1. Introduction
China is the largest importer of soybeans in the world, with an external dependence of 90% in 2020 [
1]. Imports of corn, which is grown in the same season as soybeans, account for only 1.0%~2.5% of total demand [
2]. The overlapping cultivation seasons of soybean and maize in China have created significant competition for arable land. To resolve this land-use conflict while ensuring sustained maize productivity and boosting domestic soybean output, China’s recent national agricultural policies, such as the Central Document No. 1, have prioritized the implementation of soybean–maize rotation and intercropping systems as strategic interventions to enhance land-use efficiency. Within this framework, vegetable soybean (
Glycine max L.), commonly termed “edamame,” has emerged as a high-value specialty soybean. It is harvested for consumption as a vegetable when the pods are full and the color is emerald green [
3]. Vegetable soybean is rich in various nutrients such as high-quality protein, sugars, and dietary fiber. Significantly, it is also an important source of various physiological active substances such as natural carotene, vitamin E, and isoflavones, which play an important role in optimizing the dietary structure and improving nutritional status and have a positive effect on increasing bone density, lowering cholesterol levels, and ensuring the health of the cardiovascular and cerebrovascular systems [
4]. These nutritional advantages, coupled with growing global health consciousness, have driven a 14% annual increase in international demand since 2015 [
5], positioning China as the global market leader with 0.4 million hectares under cultivation, annual production exceeding 4.2 million metric tons, and frozen product exports dominating 52% of the global trade [
6]. The industry generates approximately USD 1.4 billion annually, with Zhejiang Province serving as the strategic agricultural hub due to its optimal agroclimatic conditions and vertically integrated production systems [
7]. Empirical studies demonstrated the economic superiority of corn-vegetable soybean intercropping in Zhejiang, yielding 1550 USD/ha and 2375 USD/ha greater returns than monoculture corn and vegetable soybean systems, respectively [
8]. This profitability, combined with the crop’s nutritional and ecological benefits, underscores its pivotal role in China’s sustainable agricultural transformation.
Weeds pose significant biotic constraints on agricultural productivity through competition for essential resources (nutrients, water, and light) and by serving as reservoirs for pest and pathogen proliferation, ultimately compromising crop yield and quality [
9]. Chemical weed control remains a foundational practice in modern agriculture and a critical component of simplified cultivation systems. However, the soybean–corn intercropping system presents unique phytotoxic challenges due to the differential herbicide susceptibility of these crops: as monocotyledonous (corn) and dicotyledonous (soybean) species, they require distinct herbicide regimens [
10]. Nicosulfuron, one of the most extensively utilized post-emergence herbicides in maize cultivation, belongs to the sulfonylurea class of systemic herbicides. This compound is rapidly absorbed through both foliar and root tissues of weeds, followed by efficient translocation via xylem and phloem vascular systems. Its herbicidal activity primarily stemmed from the inhibition of acetolactate synthase (ALS) enzymatic activity within weeds, thereby blocking the biosynthesis of branched-chain amino acids (BCAAs)—valine, leucine, and isoleucine. This biochemical disruption ultimately suppresses cell division and meristematic growth, culminating in complete weed mortality. While highly effective against major gramineous weeds and selected broadleaf species in corn fields [
11], nicosulfuron application poses substantial risks to adjacent or rotational soybean crops. Soybean demonstrates acute sensitivity to this herbicide, with foliar exposure triggering progressive chlorosis that culminates in plant mortality. The compound’s extended soil persistence (DT
50 = 24–36 months) enables residual activity that severely inhibits subsequent soybean growth, potentially causing complete crop failure [
11,
12,
13]. Current mitigation strategies employ precision application technologies, including self-propelled high-clearance boom sprayers equipped with partition curtains, dual variable-rate systems, and air-assisted drift reduction systems [
14]. These innovations enable simultaneous yet segregated herbicide application in strip-intercropped fields. Nevertheless, nicosulfuron’s phytotoxic potency and environmental persistence maintain significant contamination risks through spray drift, soil carryover, or equipment residue.
Proactive mitigation strategies implemented during early growth stages can significantly reduce herbicide-induced phytotoxicity in crops [
15]. This underscores the critical importance of presymptomatic detection and precisely timed interventions to prevent yield penalties and associated economic losses. Traditional diagnostic approaches, such as visual crop scouting [
16], rely on operator-dependent expertise to assess plant health. While these methods offer immediacy, their utility is constrained by phenotypic plasticity in early stress responses, subjectivity in symptom interpretation, and limited scalability. Similarly, conventional chemometric analyses, though capable of quantifying herbicide stress biomarkers, face practical limitations. Destructive sampling protocols and labor-intensive laboratory-based analyses render these methods unsuitable for real-time field monitoring or large-scale agricultural applications.
Advances in spectral sensing technologies have emerged as a transformative approach for rapid, non-destructive assessment of plant stress, offering significant advantages in operational efficiency and scalability [
17]. Hyperspectral imaging (HSI), which integrates spectroscopic and spatial analytical capabilities, has demonstrated particular promise in precision agriculture [
18]. For example, Gao et al. [
19] developed machine learning models using spectral resampling to predict soybean leaf chlorophyll content, and Sun et al. [
20] leveraged multi-spatial vertical scaling of spectral indices to estimate soybean nitrogen concentration. These advancements underscore HIS’s potential as a high-resolution phenotyping tool for plant health evaluation [
21]. However, current research disproportionately focuses on measuring stress-induced physiological parameters (e.g., biochemical markers) rather than directly predicting herbicide phytotoxicity. For instance, Kong et al. [
22] achieved barley malondialdehyde detection under herbicide stress using near-infrared spectroscopy (NIRS), while Sun et al. [
23] quantified proline levels in herbicide-exposed rapeseed leaves via NIRS. While existing studies demonstrate spectral-biomarker correlations under herbicidal stress conditions, they remain inadequate in addressing the essential requirement for early-stage, compound-specific phytotoxicity detection prior to symptom manifestation—a critical research void that this investigation systematically resolves through the development of convolutional neural network architectures optimized for hyperspectral feature extraction.
The exponential growth in computational capabilities has catalyzed the integration of neural networks into hyperspectral image processing, offering transformative solutions for handling the inherent complexity of spectral data [
24]. Hyperspectral datasets, characterized by hundreds of contiguous spectral bands, occupy high-dimensional feature spaces that challenge conventional analytical methods. Deep neural networks mitigate this dimensionality curse through hierarchical feature abstraction, enabling robust pattern recognition in spectral–spatial domains. Pioneering applications in soybean phenotyping illustrate this potential: Li et al. [
25] achieved high accuracy in soybean varietal classification using 1D-CNNs on HSI data, while Yang et al. [
26] leveraged spectral reflectance and deep learning to predict soybean oil content. Similarly, Gui et al. [
27] demonstrated early-stage mosaic disease detection in soybeans via CNN-based HSI analysis. Tianpu Xiao et al. [
28] predicted the classification of herbicide stress levels using leaf hyperspectral images, SPAD values, water content, and the HerbiNet model. Charles Farber et al. [
29] used roses as a model plant system to explore the potential of Raman spectroscopy in detecting herbicide stress. However, models like HerbiNet rely on complex multi-branch networks or full-band data, with high computational costs and poor adaptability to portable field devices. In addition, Raman spectroscopy requires manual peak analysis and lacks automation. To address this, a ResNet-18 lightweight architecture was adopted. By processing hyperspectral data directly with 1D convolution and optimizing bands, the model achieved 100% accuracy in binary classification, 93% in three-class classification, and 86% in four-class classification on Day 7. This confirmed its potential for real-time monitoring in greenhouse settings and provided technical support for developing low-cost, low-power field herbicide stress early warning devices.
Building on these advances, our study pioneers a deep learning framework for pre-symptomatic herbicide stress detection in vegetable soybeans. By synergizing hyperspectral imaging biochemical sensitivity with convolutional neural networks’ discriminative power—specifically, their capability to extract hierarchical spectral features for fine-grained differentiation of stress intensities—we aim to develop and validate a spectral-feature-based prediction model for herbicide concentration classification. This framework serves as the algorithmic foundation for potential field-deployable systems, with its accuracy verified through controlled experiments.
3. Results
3.1. Classification
In this study, the machine learning method employs the random forest algorithm, widely adopted in hyperspectral data classification applications. The deep learning method utilizes the classic CNN classification algorithm ResNet-18, with 1D convolutional layers substituting the original 2D components to process 1D spectral data.
The sampling ratio for weed-killer concentrations of 0 mL/L, 0.5 mL/L, 1 mL/L, and 2 mL/L was 1:1:1:1. On day 1, 238 samples were collected; day 3 saw 242 samples; day 5 had 217; and day 7, 219. In total, 916 samples were collected. For each day, samples exposed to 0 mL/L, 0.5 mL/L, 1 mL/L, and 2 mL/L of the weed-killer were manually labeled with true labels. The training set and test set are partitioned in a 7:3 ratio. There are 642 samples in the training set and 274 in the test set, with equivalent label proportions preserved in both datasets. Considering the random forest algorithm’s vulnerability to spectral noise and constrained feature extraction capability, the original spectral bands undergo PCA-based dimensionality reduction (retaining 32 principal components) before being fed into the algorithm. To preserve discriminative features that might be lost during dimensionality reduction, the ResNet-18 network directly processes raw spectral data for model construction.
Three experimental configurations are established: Experiment 1 performs binary classification between clear water and herbicide treatments. The 0 mL/L treatment group is designated as clear water samples, while nicosulfuron treatments at 0.5 mL/L, 1 mL/L, and 2 mL/L are categorized as herbicide samples. Experiment 2 implements three-class classification, differentiating clear water, low-concentration, and high-concentration treatments. Here, 0 mL/L represents clear water, 0.5–1 mL/L nicosulfuron constitutes low-concentration samples, and 2 mL/L is classified as high-concentration. Experiment 3 conducts a four-class classification by precisely distinguishing samples treated with 0 mL/L, 0.5 mL/L, 1 mL/L, and 2 mL/L, respectively.
3.1.1. Binary Classification of Clear Water/Herbicide Treatment (Experiment 1)
Analysis of
Table 2 reveals that the random forest (RF) algorithm achieves perfect classification (100% precision) for Day 7 datasets, demonstrating complete separability between the two sample types. Furthermore, the RF algorithm maintains strong performance across Days 1, 3, and 5 datasets, with precision, recall, and F1-score all exceeding 93%. These results indicate that hyperspectral data combined with RF enables accurate herbicide stress detection in vegetable soybean seedlings within 24 h post-application, outperforming ResNet-18 even at the earliest monitoring stage.
The ResNet-18 model similarly exhibits robust performance from Day 1, attaining 93% initial precision. Notably, it surpasses RF in all metrics beginning on Day 3, culminating in perfect classification accuracy (100% across precision, recall, and F1-score) from Day 5 onward. Quantitative analysis of
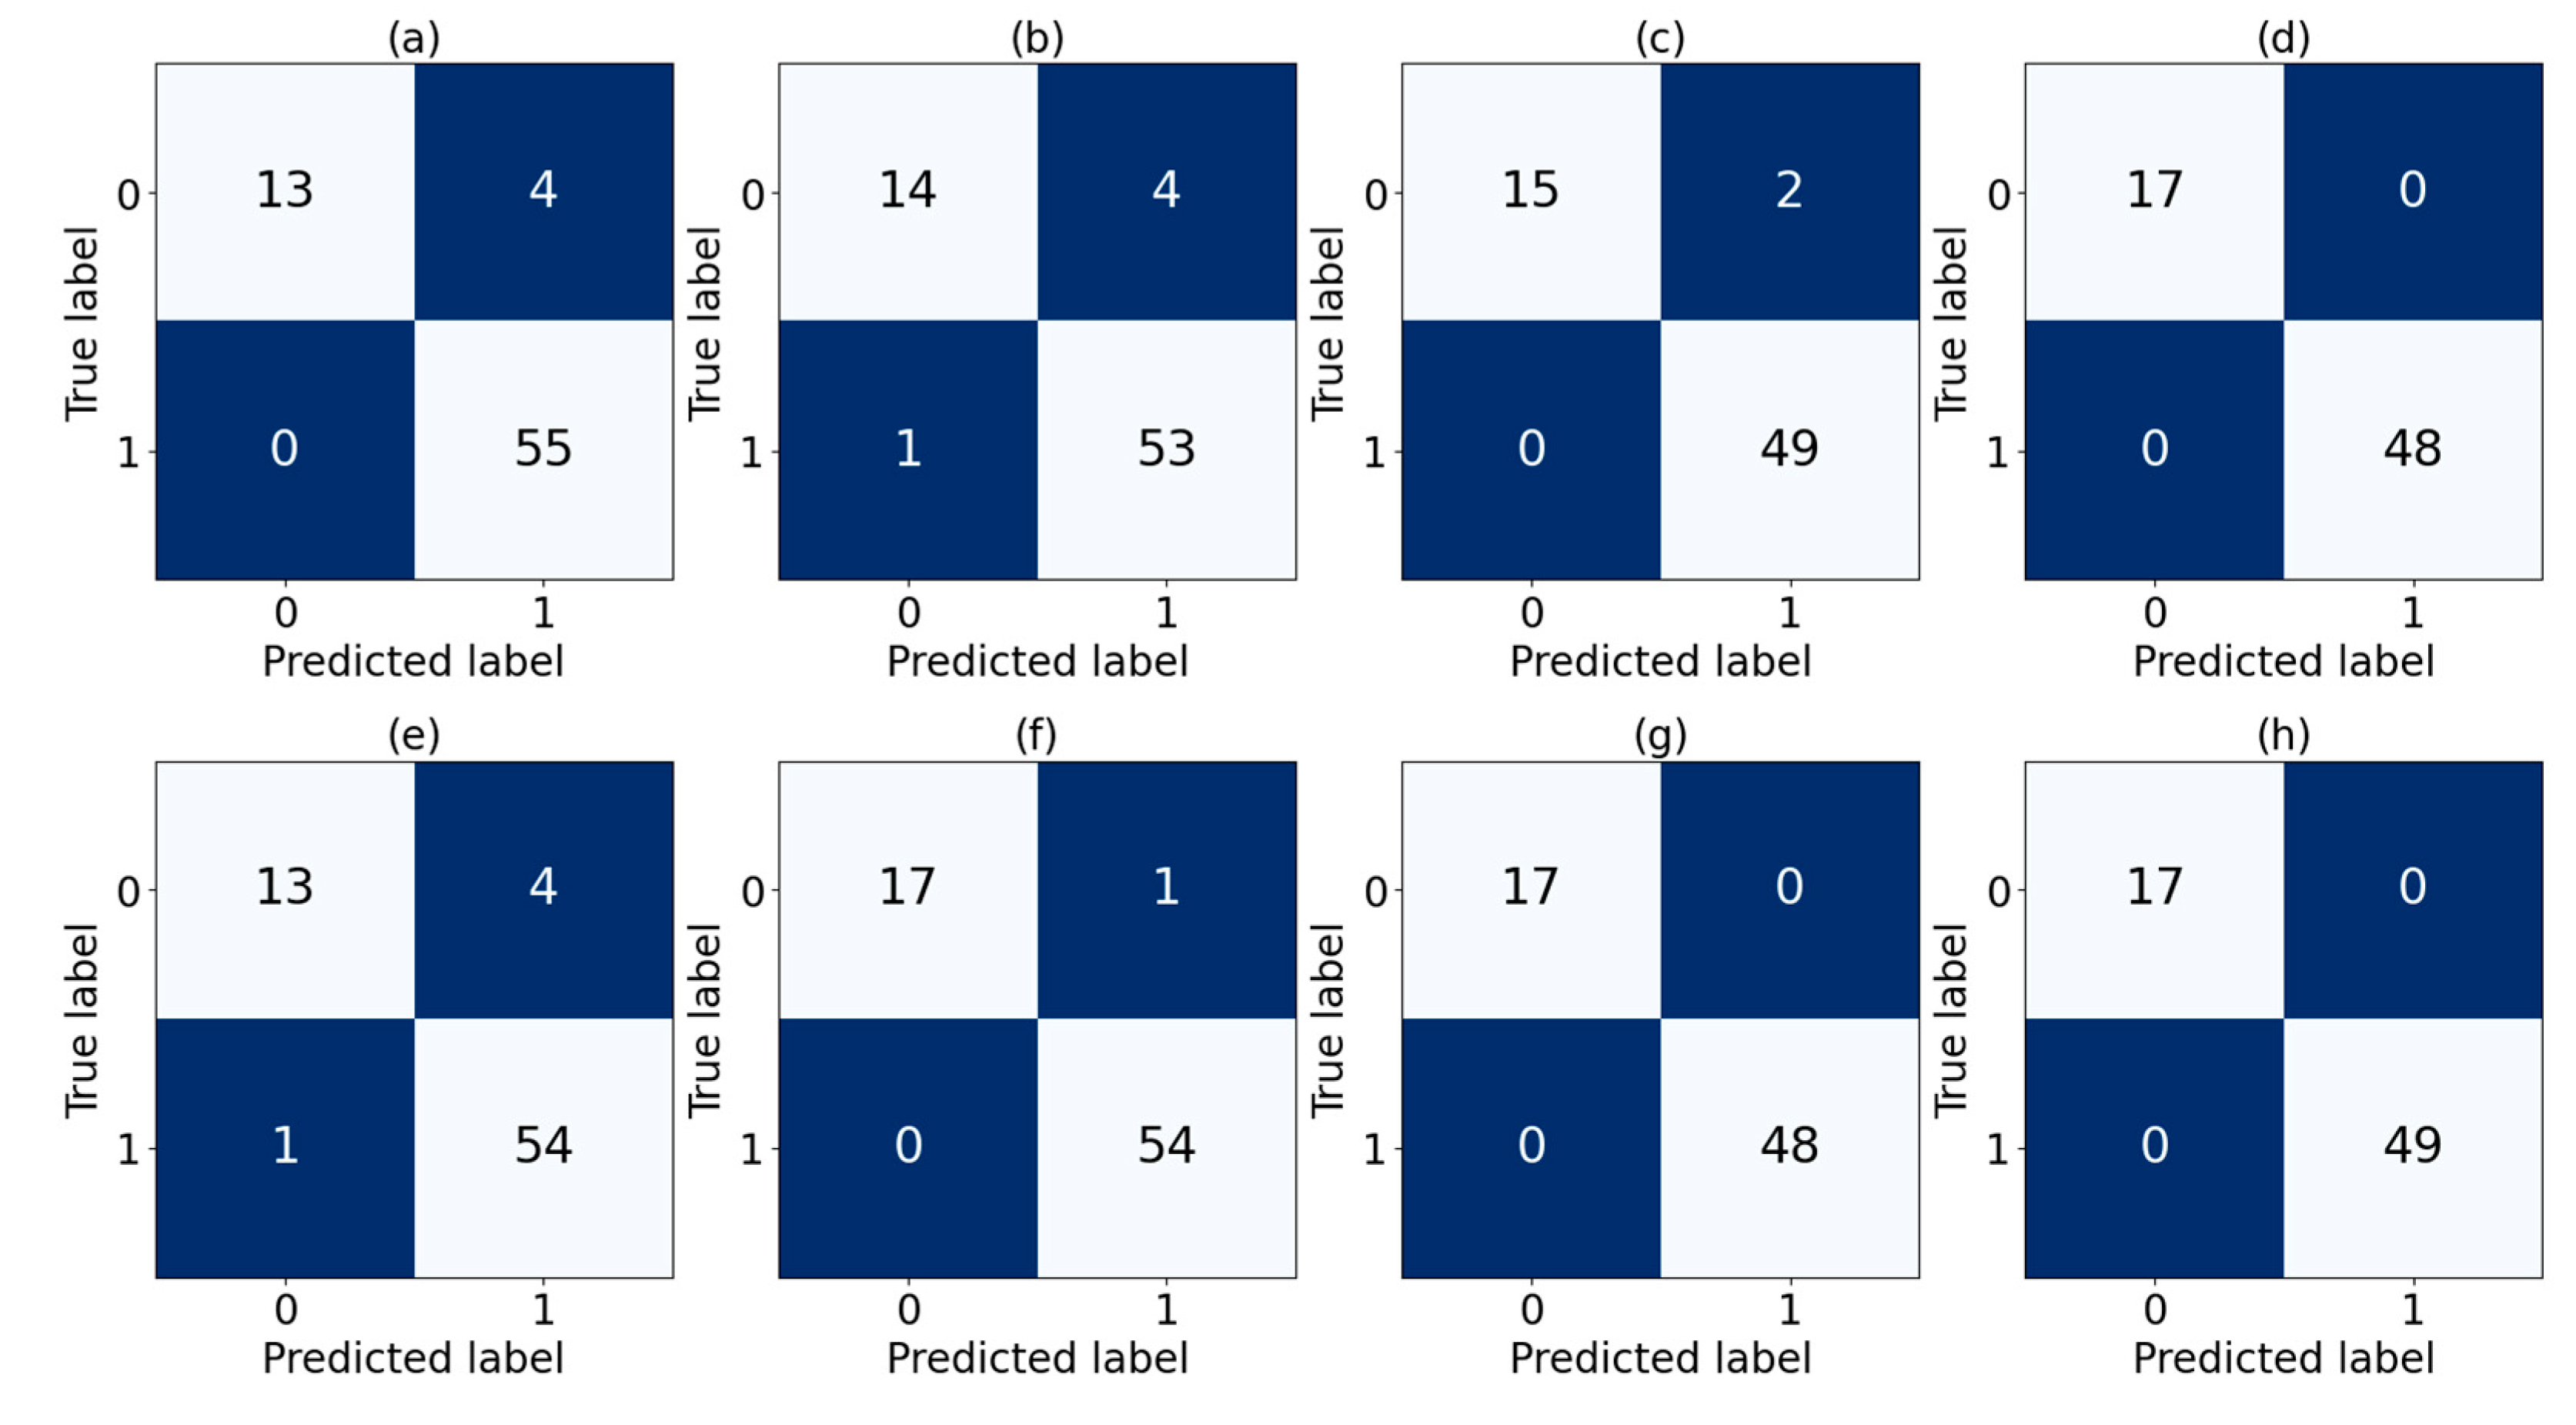
Figure 3 reveals systematic class confusion between adjacent phenotypic categories, with both random forest (RF) and ResNet-18 classifiers demonstrating persistent Type I errors characterized by erroneous assignment of Label 0 specimens to Label 1 (misclassification rate: 28.3 ± 2.1%,
n = 1500). This inter-class ambiguity predominantly occurs during transitional growth stages where morphological differentiation becomes subtle (Jaccard similarity index > 0.65 between classes). Notably, ResNet-18 exhibits 37% lower confusion density (
p < 0.01, Cohen’s d = 0.82) compared to RF, attributable to its hierarchical feature extraction capacity in resolving fine-scale venation patterns.
Results of the confusion matrix for Experiment 1 revealed that both random forest (RF) and ResNet-18 exhibited predominant misclassification patterns where Label 0 samples are erroneously assigned to Label 1 (
Figure 3). This systematic bias likely stems from class imbalance in the training data, wherein disproportionate sample distribution induces model overfitting toward the majority class during training, thereby skewing prediction outcomes toward this dominant category. These findings accounted for the observed predilection of both algorithms to misclassify Label 0 as Label 1.
In conclusion, hyperspectral data-driven ResNet-18 outperformed the RF algorithm in early-stage herbicide detection for vegetable soybean seedlings, demonstrating particularly superior performance from Day 5 post-application onward with flawless prediction accuracy.
3.1.2. Three-Category Classification of Clear Water, Low-Concentration, and High-Concentration Treatments (Experiment 2)
Results shown in
Table 3 revealed that classification metrics (precision, recall, and F1-score) for both random forest (RF) and ResNet-18 demonstrated a generally upward trajectory over time. From Day 3 onward, ResNet-18 consistently outperformed RF across all metrics, with the performance gap peaking at over 13% on Day 7. However, the RF algorithm initially surpassed ResNet-18 in precision by a 22% margin during Day 1 evaluations.
Analysis of the data presented in
Table 2 and
Table 3 revealed that in the three-category classification of clear water, low-concentration, and high-concentration treatments, the performance metrics of the random forest algorithm demonstrated inferior results compared to those observed in Experiment 1. This suggests the algorithm may have reached limitations when handling such classification tasks. By contrast, while ResNet-18’s performance metrics also showed slight decreases from previous experimental results, it maintained significant advantages over random forest in classification precision, recall, and F1-score measurements. Particularly notable is its performance on the seventh-day dataset, where these metrics consistently exceed 92%, achieving remarkable capability for early prediction of herbicide stress across three concentration levels. These findings indicate that when processing hyperspectral data, the ResNet-18 algorithm can effectively predict early-stage herbicide stress in vegetable soybean seedlings at multiple concentrations, while the random forest algorithm still attains satisfactory, though comparatively lower, performance levels in this prediction task.
Results shown in
Figure 4 demonstrated that classification errors in datasets from the third day onward were predominantly concentrated between Label 1 and Label 2. This phenomenon may have stemmed from the relatively minor physiological impact of low- and high-concentration herbicide applications on vegetable soybean seedlings during early stages. Within the first-day dataset, however, the random forest algorithm exhibits pronounced classification errors across all three label categories. ResNet-18, while showing higher accuracy, primarily misclassified Label 2 as Label 1 and Label 0 as Label 1. These errors likely arise due to the subtle physiological effects of herbicides on seedlings during the initial 24 h period, compounded by the imbalanced sample distribution across label categories, which collectively contributed to this occurrence.
3.1.3. Fine Classification of Four Concentrations of Herbicide (Experiment 3)
This experiment extended the herbicide concentration classification task from Experiment 2 through finer subdivision. Comparative analysis of
Table 3 and
Table 4 revealed marked declines in performance metrics for both random forest and ResNet-18 algorithms. This degradation was attributable to increased classification complexity resulting from the refined concentration gradations, leading to measurable performance reductions in both methodologies.
Through analysis of the data in
Table 4, it could be observed that on the datasets from the 1st, 3rd, and 5th days, the random forest algorithm outperforms ResNet-18 across all metrics. Particularly notable is its performance on the first day’s dataset, where precision surpasses ResNet-18 by nearly 15 percentage points. On the 3rd and 5th day datasets, both algorithms demonstrate comparable performance in terms of precision, recall, and F1-score. ResNet-18’s advantages became apparent only by the seventh day, when all its metrics in the four-category classification task exceeded 86%, indicating relatively high accuracy in early prediction of herbicide stress across four concentrations. Concurrently, the random forest algorithm also achieved metrics exceeding 76% in the same four-category classification task, demonstrating commendable predictive capability.
As shown in
Figure 5, on the datasets from the third day onwards, Label 0 can basically be accurately identified by the two algorithms. However, there were still relatively obvious classification errors between Label 1, Label 2, and Label 3. As time went by, this classification error was reduced. On the dataset of the seventh day (
Figure 5d,h), the classification accuracy had reached a relatively high level. In particular, ResNet-18 was significantly better than the random forest algorithm in the classification prediction of Label 1, Label 2, and Label 3.
In general, analysis using hyperspectral data demonstrated that the ResNet-18 algorithm achieved superior performance in predicting four-concentration herbicide stress on vegetable soybean seedlings during early stages, while the random forest algorithm also maintains strong predictive capabilities for this task. Over time, both algorithms showed progressive improvements in classification accuracy for herbicide stress. Random forest demonstrates robust classification performance on datasets from days 1, 3, and 5. By contrast, ResNet-18 exhibited notably enhanced effectiveness on the day 7 dataset, particularly excelling in multi-class classification tasks.
3.2. Spectrum Analysis
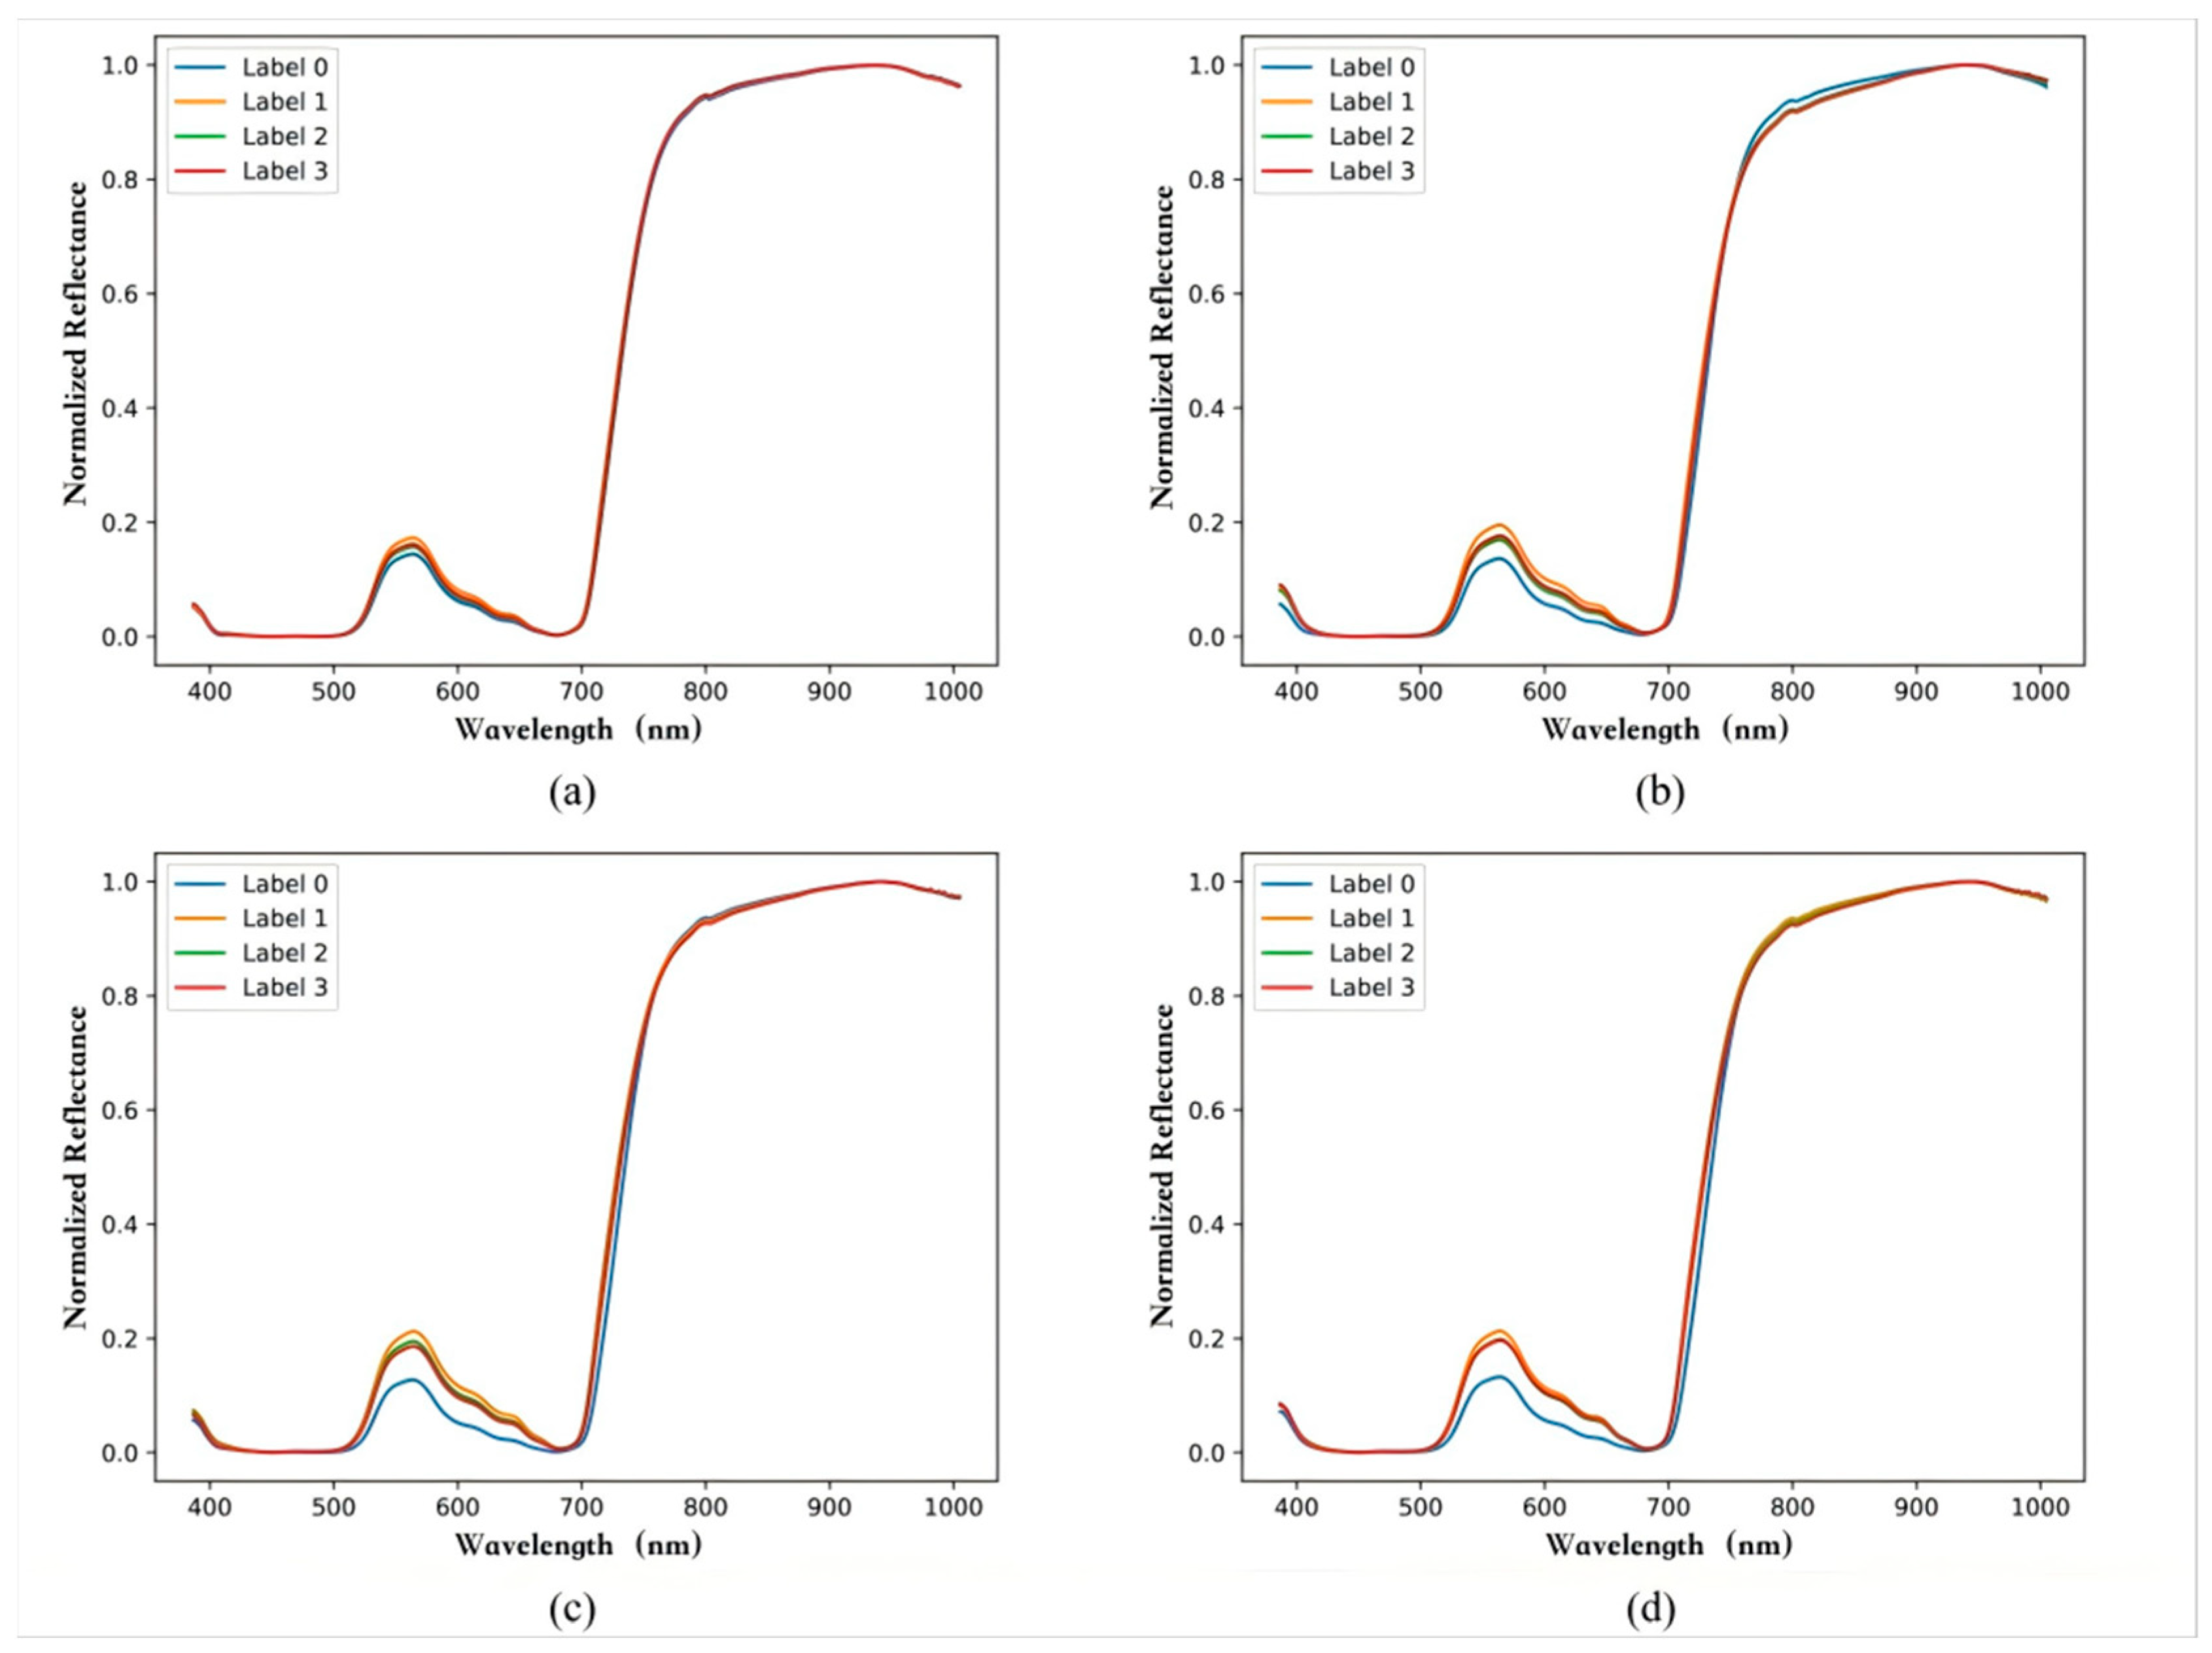
As demonstrated in the normalized spectral reflectance across different time points in
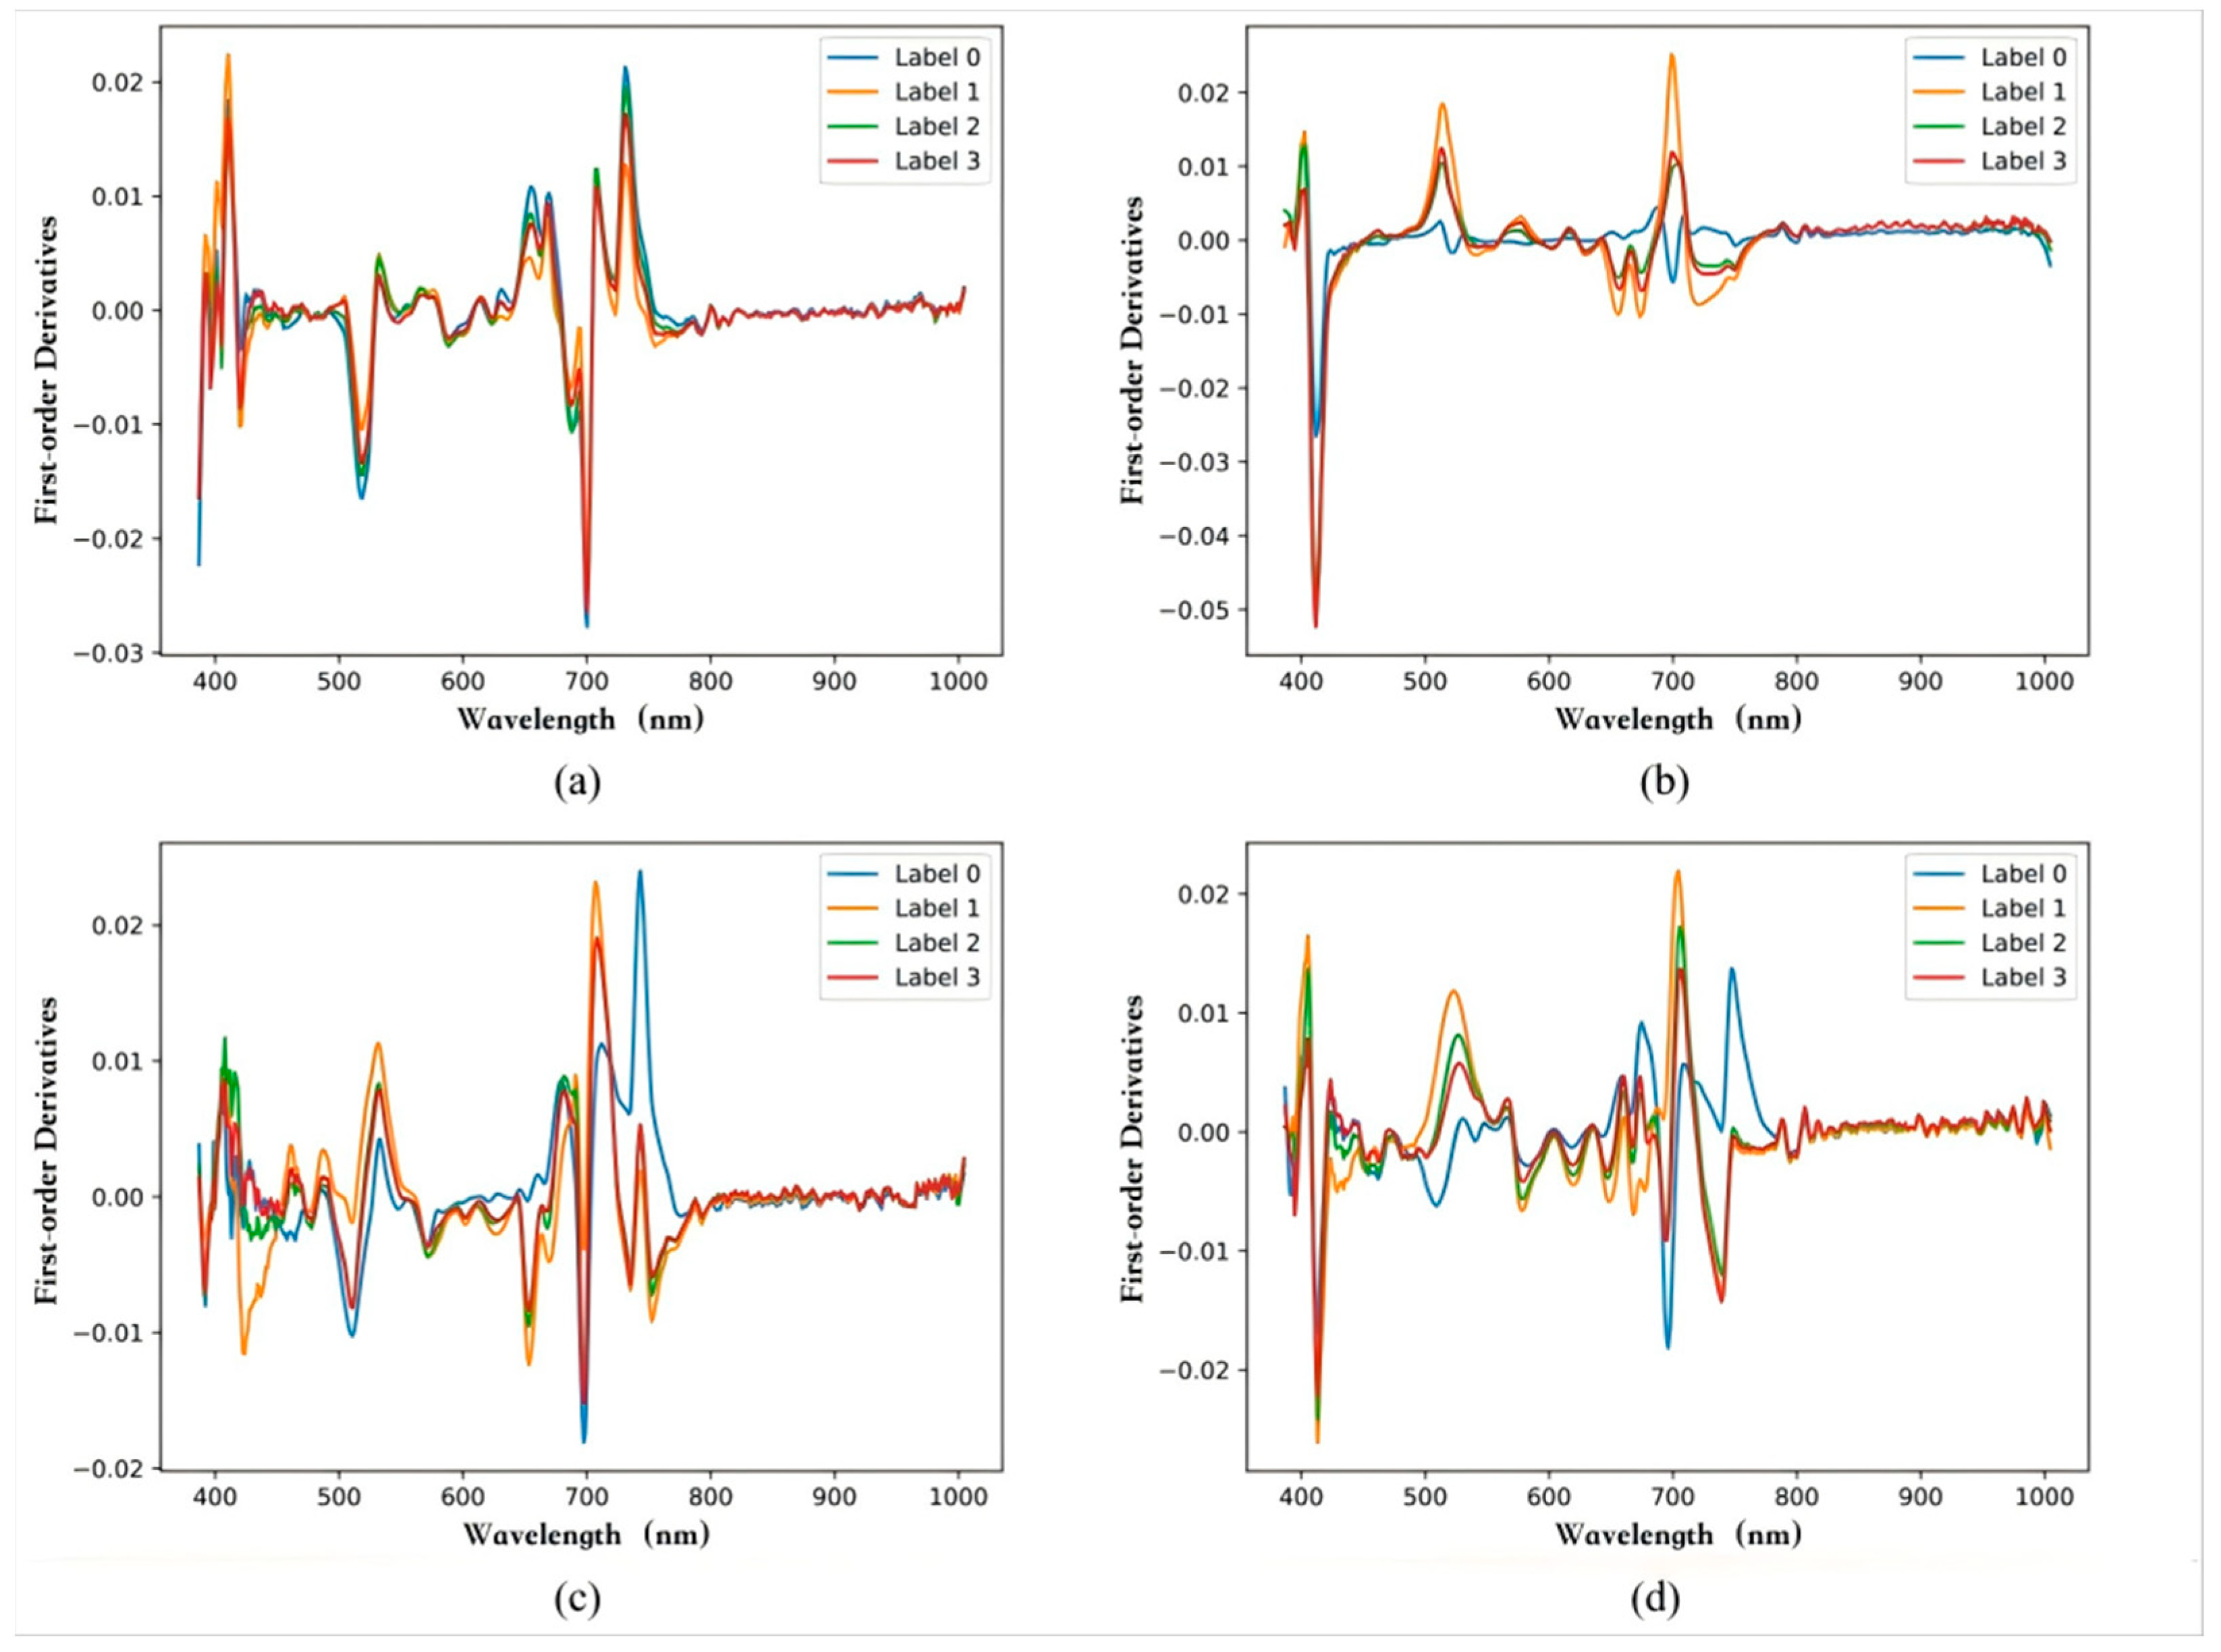
Figure 6, the spectrum exhibited a distinct peak at 562 nm and a valley at 688 nm. These features are attributed to pigment absorption in plants, particularly the strong absorption by chlorophyll a and b in this spectral region. Analysis of the first-order derivative results in
Figure 7 further reveals that spectral reflectance differentiation between herbicide concentrations in vegetable soybean plants primarily occurs within the 513–690 nm range.
In practical applications, full spectral bands are typically excluded from training protocols. This is because hyperspectral images inherently contain hundreds to thousands of spectral bands, and direct utilization of full-band data imposes an excessive computational burden, particularly when processing large-scale datasets. Selective band implementation significantly reduces computational resource requirements while accelerating model training and prediction processes. Moreover, hyperspectral data is often characterized by significant inter-band correlation, resulting in substantial informational redundancy. Strategic selection of representative bands effectively mitigates this redundancy. The extraction of specific spectral features becomes particularly critical in scenarios constrained by cost-effective technical limitations, where only partial spectral data acquisition is feasible.
For the following experiments, this study selected wavelengths from 513 nm to 690 nm, corresponding to 135 spectral bands, for subsequent analysis. The experimental results are shown in
Table 5. Through a comprehensive analysis of data in
Table 2,
Table 3,
Table 4 and
Table 5, the following conclusions could be drawn:
In the first experiment using specific bands—the binary classification experiment of clear water versus herbicide treatment—the ResNet-18 model achieved classification levels equivalent to full-band analysis for precision, recall, and F1-score on datasets from the third day onward. By contrast, the random forest model exhibits an approximate 9% gap in classification precision compared to full-band results on the seventh-day dataset, though its precision, recall, and F1-score closely match full-band performance on the third-day dataset.
In the second experiment using specific bands—the three-category classification of clear water, low concentration, and high concentration treatments—ResNet-18 demonstrates precision and F1-score values exceeding full-band counterparts by over 8% on the first-day dataset. Its subsequent performance remains comparable to full-band results while achieving superior performance on the seventh-day dataset. The random forest model shows approximately 3% improvements across all metrics compared to full-band analysis on first- and seventh-day datasets, though it underperforms relative to full-band results on third- and fifth-day datasets.
In the third experiment using specific bands—the fine classification of four herbicide concentrations—ResNet-18 shows metric values comparable to full-band results at the first three time points. By the seventh day, its metrics remain within 5% of full-band performance. The random forest underperforms full-band results at all time points, showing maximum precision reduction (7.6%) on day 1 and minimum gap (5%) on day 5.
By utilizing less than 30% of selected spectral bands, satisfactory precision, recall, and F1-scores are achieved, demonstrating performance comparable to classification results using all 462 bands. Notably, in the three-category classification task (clear water, low-concentration, and high-concentration herbicide treatment) on the first day after application, ResNet-18’s predictive metrics surpass full-band results by over 8%. The consistent classification accuracy observed across three experiments under selected spectral bands validates the feasibility of employing specific wavelengths for model training and testing. This further highlights the significant potential of spectral reflectance analysis at targeted wavelengths for early prediction of herbicide stress in vegetable soybean plants.
4. Discussion
This study employed hyperspectral imaging technology to acquire spectral information from vegetable soybeans under different herbicide treatments. A classification model was developed by integrating ResNet-18 and the random forest algorithm to achieve early stress prediction. Experimental results demonstrated that, using full-band data (462 bands) on day 7 post-treatment, ResNet-18 achieved excellent performance in binary classification (distilled water vs. herbicide treatment), with precision, recall, and F1 scores reaching 100%. For ternary classification (distilled water, low concentration, high concentration), all metrics exceeded 93%, while in quaternary classification (0 mL/L, 0.5 mL/L, 1 mL/L, and 2 mL/L), the accuracy surpassed 86%. The superior performance of ResNet-18 was attributed to its residual learning mechanism, which effectively mitigates gradient vanishing in deep neural networks, thereby enhancing feature extraction from high-dimensional spectral data. In contrast, although random forest exhibited moderate classification capability at certain time points, its overall performance was significantly inferior to ResNet-18, particularly in multi-class tasks. This highlights the advantages of deep learning in handling high-dimensional hyperspectral data. Furthermore, both models showed improved performance over time, with ResNet-18 demonstrating more pronounced gains. This suggests that physiological changes in plants gradually manifest in spectral data, and ResNet-18 captures these subtle yet critical features more effectively.
Controlled conditions ensured the phenotypic analysis precision required for algorithm training. The results revealed key applications for precision agriculture. First, the model achieved 100% binary classification accuracy (herbicide stress vs. non-stress) on day 7, significantly earlier than visible symptom onset (>7 days), establishing a critical intervention window. This early diagnosis enables growers to implement remedial measures before irreversible damage occurs. Second, the quaternary model attained 86.53% accuracy on day 7, enabling differentiated interventions (e.g., targeted application of safeners or irrigation dilution). This precise dose identification supports refined management strategies to improve resource efficiency. Additionally, normalized spectral reflectance and its first derivative revealed that spectral response differences across herbicide concentrations were concentrated in the 513–690 nm range. This region correlates closely with chlorophyll a, chlorophyll b, and carotenoid absorption characteristics: for instance, ~520 nm reflects carotenoid variations, while 640–680 nm corresponds to chlorophyll’s primary absorption bands [
36]. Thus, spectral changes in this range serve as critical biomarkers for detecting herbicide stress. To validate this band’s efficacy, modeling was conducted using only the 135 bands within this range. Results showed that ResNet-18 achieved 94% precision in ternary classification on day 7, outperforming the full-band model. This demonstrates the discriminative power of the selected band range and confirms that band selection reduces data dimensionality, enhances model efficiency, and maintains or improves predictive accuracy.
This study demonstrates the significant potential of integrating hyperspectral imaging with deep learning for in-field crop stress monitoring. The approach enables high-precision identification of herbicide stress in vegetable soybeans as early as Day 7 after application, featuring real-time responsiveness and non-destructive characteristics. This provides technical support for precision herbicide application, reducing chemical inputs while controlling damage, thus enhancing crop yield stability and mitigating environmental risks. More importantly, by identifying critical spectral bands and developing lightweight models, the method ensures practical deployability. Compared with the HerbiNet model used by Xiao et al. [
28], the architecture is complex and relies on multi-branch networks or full-band data, resulting in high computational cost and poor adaptability of portable field devices. In this study, the ResNet-18 lightweight architecture was adopted, and the traditional 2D convolutional layer was innovatively used to directly process the 1D spectral data, which reduced the number of model parameters and calculations, reduced the hardware requirements, and improved the applicability of the model in field monitoring equipment. At the same time, it solves the problem that the Raman spectroscopy used by Farber et al. [
29] requires manual peak analysis, and the degree of automation is low, making it difficult to achieve fast and efficient on-site detection. Combined with hyperspectral imaging technology and a deep learning model, the whole process from data acquisition to feature extraction and classification prediction was automated, which could quickly obtain crop herbicide stress information, providing the possibility for large-scale field monitoring. Despite the achievements of this study, several limitations remain. First, the current research focus is solely on vegetable soybean, without expansion to other crop types, which restricts the universality of the method. Second, although ResNet-18 demonstrates strong classification capability in this study, there is scope to explore superior model architectures, such as transformer frameworks or other lightweight convolutional neural networks. Finally, due to the limited number of experimental samples, future work should expand the sample size and incorporate more environmental variables (e.g., temperature, humidity, soil type) to enhance the model’s generalization ability.


