Article

Optimizing Nutrition Protocols for Improved Rice Yield, Quality, and Nitrogen Use Efficiency in Coastal Saline Soils

by
Xiang Zhang
1,
Xiaoyu Geng
1,
Yang Liu
1,
Lulu Wang
1,2,
Jizou Zhu
1,
Weiyi Ma
1,
Xiaozhou Sheng
1,
Lei Shi
3,
Yinglong Chen
1,
Pinglei Gao
1,
Huanhe Wei
1,* and
Qigen Dai
1,*
1
Jiangsu Key Laboratory of Crop Cultivation and Physiology/Jiangsu Key Laboratory of Crop Genetics and Physiology/Jiangsu Co-Innovation Center for Modern Production Technology of Grain Crops/Key Laboratory of Saline-Alkali Soil Reclamation and Utilization in Coastal Areas, the Ministry of Agriculture and Rural Affairs of China/Research Institute of Rice Industrial Engineering Technology, Yangzhou University, Yangzhou 225009, China
2
Joint Laboratory for International Cooperation in Agriculture and Agricultural Product Safety, Ministry of Education, Institute of Agricultural Science and Technology Development, Yangzhou University, Yangzhou 225009, China
3
Huanghai Original Seed Factory, Yancheng 224000, China
*
Authors to whom correspondence should be addressed.
Agronomy 2025, 15(7), 1662; https://doi.org/10.3390/agronomy15071662
Submission received: 20 June 2025 / Revised: 6 July 2025 / Accepted: 7 July 2025 / Published: 9 July 2025
(This article belongs to the Section Soil and Plant Nutrition)

Abstract

This study evaluated the effects of one-time application of controlled-release fertilizer (CRF) on rice (Oryza sativa L.) grain yield, grain quality, and agronomic nitrogen use efficiency (ANUE, ANUE (kg/kg) = (Grain yield with N application − grain yield without N application)/N application amount) in coastal saline soils. A two-year field experiment (2023–2024) was conducted using two rice varieties (Nanjing 5718 and Yongyou 4953) under four nitrogen treatments: N0 (no nitrogen fertilization), N1 (270 kg·hm−2, with a ratio of 5:1:2:2 at 1-day before transplanting, 7-day after transplanting, panicle initiation, and penultimate-leaf appearance stage, respectively), N2 (270 kg·hm−2, one-time application at 1-day before transplanting as 50% CRF with 80-day release period + 50% urea), and N3 (270 kg·hm−2, 50% one-time application of CRF with 120-day release period at the seedling stage + 50% urea at 1-day before transplanting). Compared with N1, the N3 treatment significantly increased grain yield by 10.2% to 12.9% and improved ANUE by 18.5% to 51.6%. It also improved processing quality (higher brown rice, milled rice, and head rice rates), appearance quality (reduced chalkiness degree and chalky rice percentage), and taste value (by 19.3% to 31.2%). These improvements were associated with lower amylose, protein, and soluble sugar contents and favorable changes in starch composition and pasting properties. While N2 slightly improved some quality traits, it significantly reduced yield and ANUE. Correlation analysis revealed that starch and protein composition, as well as pasting properties, were significantly associated with taste value and related attributes such as appearance, stickiness, balance degree, and hardness. Overall, one-time application of CRF with a 120-day release period at the seedling stage, combined with basal urea, offers an effective strategy to boost yield, quality, and ANUE in coastal saline rice systems.

1. Introduction

Global food production is increasingly constrained by shrinking reserves of fertile land and growing population pressures. Coastal saline soils, though traditionally regarded as marginal lands, present a promising opportunity to expand agricultural production if their inherent limitations can be mitigated [1,2]. Rice (Oryza sativa L.) is a major staple crop cultivated across more than 100 countries, supplying critical calories and nutrients for over half of the world’s population, with Asia contributing approximately 90% of global production [3,4]. Importantly, rice cultivation also contributes to improving saline soils by lowering salinity levels and improving organic matter and microbial diversity [5,6]. Despite these benefits, rice productivity and grain quality in coastal saline and alkaline soils remain suboptimal due to high salinity, nutrient imbalances, and poor soil structure. Physiologically, rice plants have developed several adaptive mechanisms to thrive in alkaline soils, such as the regulation of root architecture, ion transport, and the synthesis of osmotic regulators [7,8]. These adaptations allow rice to maintain nutrient uptake and tolerance under saline and alkaline stress, which are crucial for improving productivity in these challenging environments.
Efficient nitrogen management is essential for improving rice yield and grain quality, particularly in saline and alkaline-affected environments. Nitrogen use efficiency (NUE) plays a pivotal role in achieving sustainable agricultural practices, as it directly influences yield, grain quality, and environmental sustainability. The relationship between NUE and yield has been extensively studied, with findings suggesting that optimized nitrogen management can enhance rice productivity while reducing environmental impacts such as nutrient leaching and greenhouse gas emissions [9,10]. Excessive urea application, commonly practiced to compensate for low soil fertility, often results in low NUE and suboptimal grain quality, posing further challenges in saline and alkaline soils [11,12]. Controlled-release fertilizer (CRF), which releases nitrogen gradually in synchrony with crop uptake patterns, has been proposed as a more efficient alternative to traditional nitrogen sources, offering improved NUE and environmental sustainability [13]. Several studies have demonstrated that CRF can enhance NUE and reduce N losses while improving rice yield [14,15]. In addition to the yield benefits, CRF applications have been reported to influence rice grain quality, an increasingly important trait in breeding and production. Enhanced nitrogen delivery through CRF use can improve processing traits (milled rice rate, head rice rate), appearance quality (chalkiness), and eating quality [16,17]. These improvements are linked to the regulation of starch and protein metabolism during grain filling [18,19]. Nevertheless, the specific physiological mechanisms by which controlled nitrogen release affects starch composition, protein accumulation, and their collective impact on rice eating quality remain insufficiently understood.
Most commercially available CRFs are designed to release nutrients over a period of 40 to 90 days, often necessitating additional fertilization during later growth stages to sustain optimal crop performance. In response, extended-release CRF has been developed to support one-time application at the seedling stage. When integrated with mechanized transplanting systems, these long-acting CRFs offer potential agronomic and economic benefits by reducing labor inputs and simplifying field management [20]. Despite these advantages, their agronomic performance, particularly in saline–alkaline soils, remains insufficiently explored. To date, the majority of CRF-related studies have been conducted in conventional paddy systems, with limited attention to their efficacy under salinity stress. High salinity not only disrupts nitrogen uptake and assimilation but also impairs starch and protein metabolism, ultimately affecting grain quality [21]. Whether extended-release CRF can counteract these salt-induced constraints and simultaneously improve yield, nitrogen use efficiency, and grain quality in coastal saline environments remains an open question.
Therefore, this study aimed to (1) evaluate the effects of extended-release CRF on rice grain yield, grain quality, and NUE in coastal saline soils and (2) examine the relationships among eating quality, starch and protein composition, and pasting properties under saline soil conditions.

2. Materials and Methods

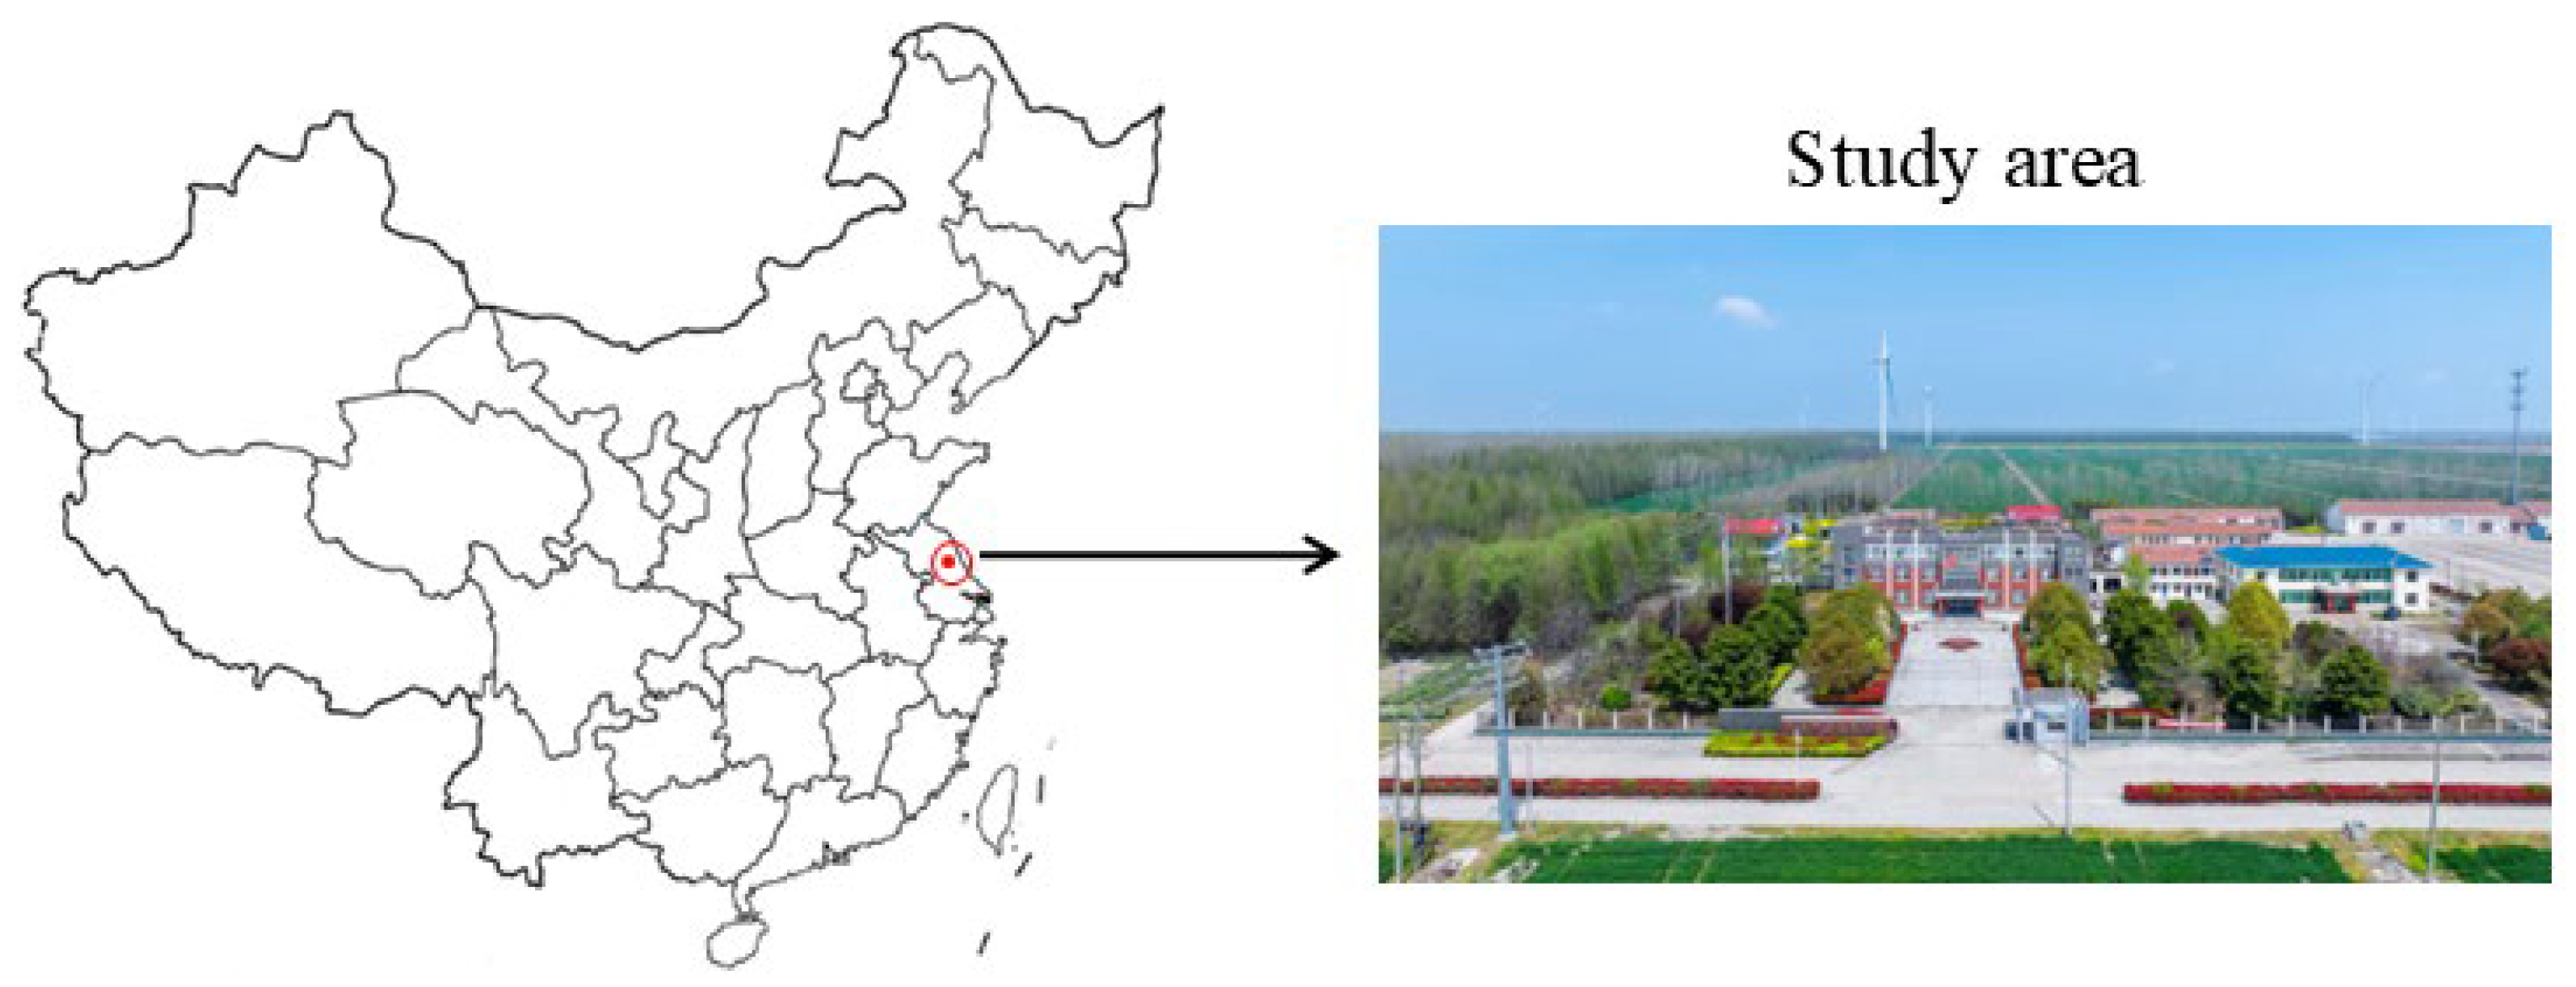
2.1. Plant Materials and Growing Conditions

A field experiment was conducted in 2023 and 2024 at the Huanghai Breeding Farm in Dongtai, Yancheng, Jiangsu Province, China (32.0° N, 120.5° E, 6 m above sea level). Figure 1 shows the specific location of the field experiment. The preceding crop was wheat, and the soil was classified as Fluvisols according to the World Reference Base for Soil Resources (WRB), with a composition of approximately 68% sand, 30% silt, and 12% clay. The climate of the study area is characterized by a temperate monsoon climate, with hot, humid summers and cold, dry winters. The average annual precipitation is approximately 1100 mm, and the average annual temperature is around 14 °C. Prior to rice transplantation, the topsoil (plow layer) had an electrical conductivity of 4.6–4.9 dS/m. Table 1 presents the soil nutrient status of the field prior to rice transplantation.
All nitrogen fertilizers used in this study were in the form of urea. This included two types of polymer-coated controlled-release fertilizers (CRF): an 80-day CRF (42% N, Shandong Maoshi Fertilizer Co., Ltd., Jinan, China) and a 120-day CRF (30% N, Heilongjiang Jiucheng Agricultural Technology Co., Ltd., Harbin, China), in addition to conventional urea (46% N). Superphosphate (P2O5) and potassium chloride (K2O) were applied as phosphorus and potassium fertilizers, respectively. Two rice cultivars were provided by Jiangsu Jintudi Seed Industry Co., Ltd., Yangzhou, China, in the experiment: Nanjing 5718, a medium-maturity japonica inbred variety, and Yongyou 4953, a medium-maturity indica-japonica hybrid variety.

2.2. Experimental Design

Table 2 summarizes the experimental design and the nitrogen application treatments used in this study. The treatments included different nitrogen fertilizer types, application rates, and timing methods, all of which were applied in a completely randomized block design.
During the two experimental years, seedlings were cultivated on 7 May 2023 and 12 May 2024, respectively, using broadcast seedling trays, with a seedling age of 30 days. In the N3 treatment, CRF was uniformly incorporated into the seedling trays during nursery cultivation, at a rate of 2.03 g per hill for Nanjing 5718 and 2.7 g per hill for Yongyou 4953. This method allowed the rice roots to come into direct contact with and absorb the CRF granules. The transplanting spacing was configured as follows: 30 cm × 12 cm for Nanjing 5718 (3 seedlings per hill) and 30 cm × 16 cm for Yongyou 4953 (2 seedlings per hill). All other field management practices were conducted in accordance with standard rice cultivation protocols.

2.3. Sampling and Data Collection

Grain yield was determined from a 6.0 m2 harvest area in each plot and adjusted to 14% moisture content. At maturity, 50 hills per plot were sampled for yield component analysis. Panicle number was recorded from a 1.0 m2 area per plot, excluding border plants.
Thirty consecutive hills were sampled to determine the number of spikelets per panicle, seed-setting rate, and 1000-grain weight. Grains were air-dried and stored for at least three months following the national standard NY/T 83-1988.
For quality assessment, three subsamples of 120 g per plot were collected. Brown rice was obtained using a dehusker (TP-JLG-2018, Zhejiang Top Yunnong Technology Co., Ltd., Hangzhou, China), and milled rice was produced by polishing. Head rice was manually separated as grains with a length ≥ 80% of the original. The brown rice rate, milled rice rate, and head rice rate were expressed as percentages of the initial rough rice weight.
Appearance quality was evaluated by randomly selecting 100 milled grains per plot. Kernels exhibiting white areas on the belly, center, or back were counted as chalky grains. Milled rice was ground into flour using a stainless-steel grinder and sieved through a 0.25 mm mesh.
The amylose content and starch concentration were measured from rice flour. The amylose content in the rice flour was determined using the iodine colorimetric method. For this, 0.1 g of rice flour was dispersed in 100 mL of distilled water. Iodine solution (I2/KI) was then added to the mixture, and the absorbance was measured at 620 nm. The amylose content was calculated based on a calibration curve prepared with known concentrations of amylose standards. The starch concentration was determined using a spectrophotometric method. First, a known weight of rice flour was extracted with 80% ethanol, and then the starch was digested with a sodium hydroxide (NaOH) solution to break it down into glucose. The glucose concentration was subsequently measured using the 3,5-dinitrosalicylic acid (DNS) method, where the color development was observed spectrophotometrically at 540 nm. The starch concentration was calculated by comparing the absorbance to a standard glucose curve. The eating quality was evaluated using 30 g of milled rice cooked with a water-to-rice ratio of 1.3:1. Parameters, including appearance, hardness, balance, stickiness, viscosity, and taste value, were recorded using a rice taste analyzer (STA1A, Satake Corp., Hiroshima-ken, Japan).
Starch pasting properties were analyzed using a Rapid Visco Analyzer (RVA Super3, Newport Scientific, Warriewood, Australia) following AACC procedures. Flour samples (3 g, 0.15 mm sieve) were mixed with 25 g of deionized water in an RVA canister. Peak, hot, and final viscosities were recorded, along with breakdown, setback, and peak time, using TCW software (version 2.6, Newport Scientific, Warriewood, Australia).

2.4. Agronomic Nitrogen Use Efficiency (ANUE)

The fertilizer difference subtraction method is used to calculate the agronomic nitrogen use efficiency. The specific calculation formula is as follows:
Agronomic nitrogen use efficiency (kg/kg) = (Grain yield with N application − grain yield without N application)/N application amount.

2.5. Statistical Analysis

Analyses of variance were performed using the SAS/STAT statistical analysis package (version 9.2, SAS Institute; Cary, NC, USA). Analyses of variance (ANOVA) were conducted to determine the effects of year, fertilization treatment, and rice variety (as independent variables), as well as their interaction effects, on yield and quality-related traits of rice (as dependent variables), with statistical significance assessed at the 5% and 1% levels. Data from each sampling date were analyzed separately, and the resulting means were tested by the least significant difference at p < 0.05 (LSD0.05).

3. Results

3.1. Rice Yield and Its Components

The grain yield of Nanjing 5718 and Yongyou 4953 under N3 treatment exhibited an average increase of 10.2% to 12.9% compared to N1, whereas the grain yield under N2 treatment decreased by an average of 11.9% to 13.0%. Across both years and under identical treatment conditions, Yongyou 4953 consistently outperformed Nanjing 5718 in grain yield (Table 3).
Yield component values under N2 were significantly lower than those under N1. The N3 treatment produced more panicles and spikelets per panicle compared to other treatments but had a lower seed-setting rate and 1000-grain weight than N1. This increase in yield under N3 was primarily driven by the combined effect of panicle number and spikelets per panicle (Table 3).

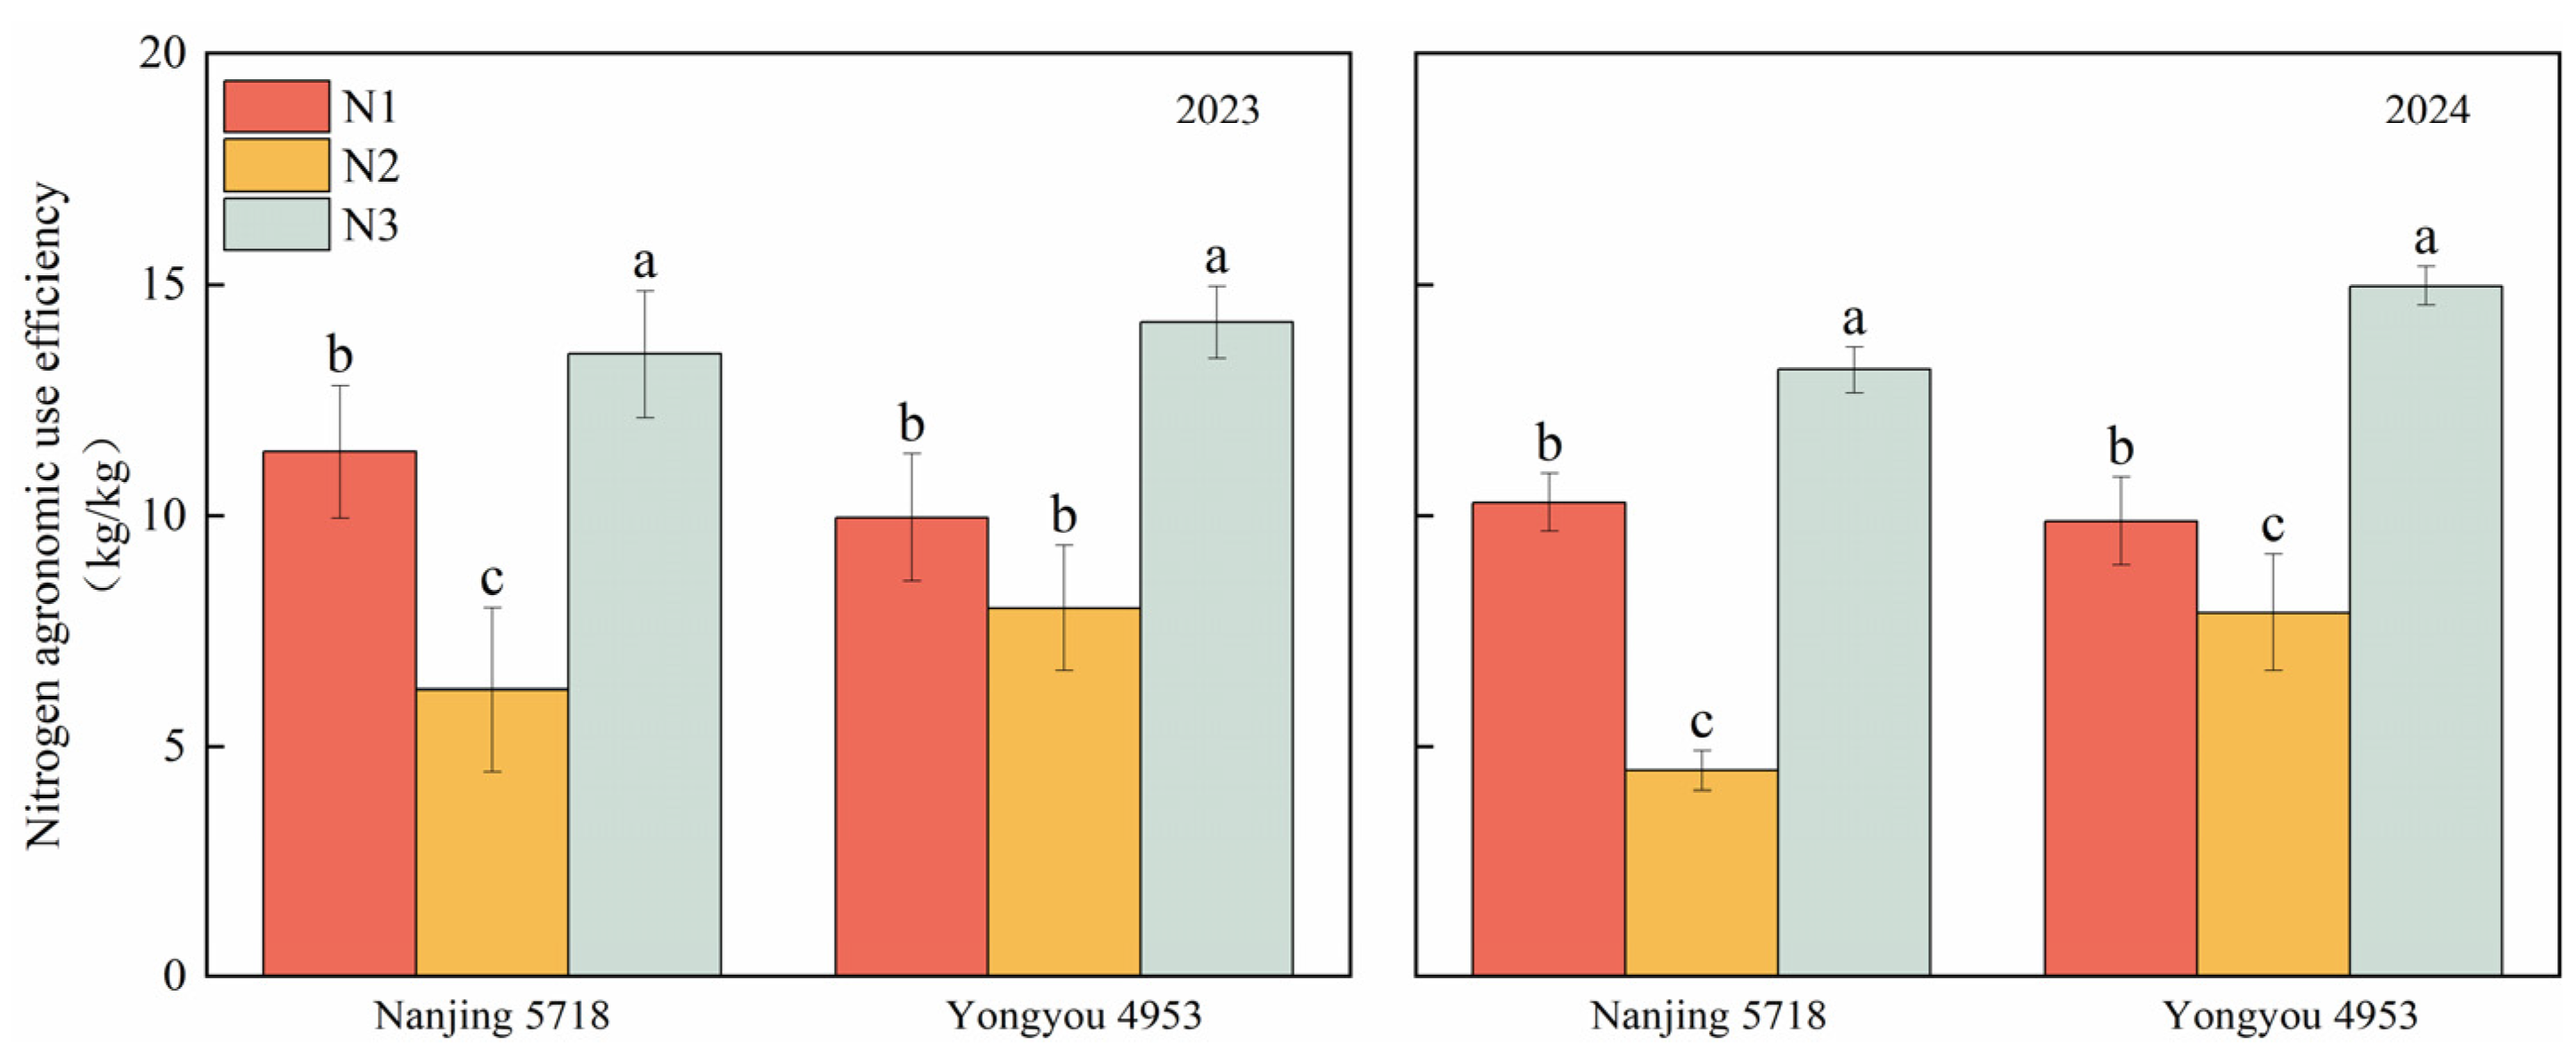
3.2. Agronomic Nitrogen Use Efficiency

As illustrated in Figure 2, agronomic nitrogen use efficiency (ANUE) differed significantly among fertilizer treatments across both years. On average, ANUE under the N2 treatment was 20.0% to 56.4% lower than that under N1, while ANUE in the N3 treatment was 18.5% to 51.6% higher compared to N1.

3.3. Rice Processing and Appearance Quality

The brown rice rate, milled rice rate, and head rice rate are critical indicators for assessing rice processing quality. Over the two-year trial period, the N2 treatment increased the brown rice rate and milled rice rate by 0.2% to 0.7% and 3.2% to 6.3%, respectively, but decreased the head rice rate by 1.3% to 10.8%, compared with N1. Under the N3 treatment, all three parameters increased by 0.2% to 0.7%, 3.8% to 7.9%, and 3.6% to 9.8%, respectively (Table 4).
Further comparisons of the effects of fertilizer treatments on rice appearance quality revealed that CRF applications significantly reduced the chalkiness degree and chalky rice percentage. Over two years, the N2 treatment decreased the chalkiness degree and chalky grain percentage by 9.9% to 33.3% and 8.8% to 18.4%, respectively. In contrast, the N3 treatment resulted in reductions of 25.1% to 41.1% in chalkiness degree and 31.2% to 34.6% in chalky grain percentage (Table 4).

3.4. Rice Taste Quality

Compared with N1, the taste value under N2 and N3 treatments increased by 4.3% to 15.8% and 19.3% to 31.2%, respectively, over the two-year trial. Further analysis of taste-related sensory parameters indicated that the improvements in taste value were primarily attributed to improved appearance, stickiness, and balance, along with reduced hardness. Across both years and under the same treatment conditions, the taste value of Nanjing 5718 was significantly higher than that of Yongyou 4953 (Table 5).

3.5. Rice Starch Content

The analysis revealed no statistically significant differences in total starch content among fertilizer treatments. Over the two-year trial, amylose content in the N2 treatment was consistently lower or significantly lower than that in the N1 treatment, with a reduction of 1.3% to 3.9%. A similar trend was observed in comparisons between N3 and N2, with a further reduction of 2.7% to 5.5%. There were no significant differences in branched-chain starch content between N2 and N1. However, the N3 treatment resulted in a decrease of 0.3% to 1.0% in branched-chain starch content compared with N1 over both years (Table 6).

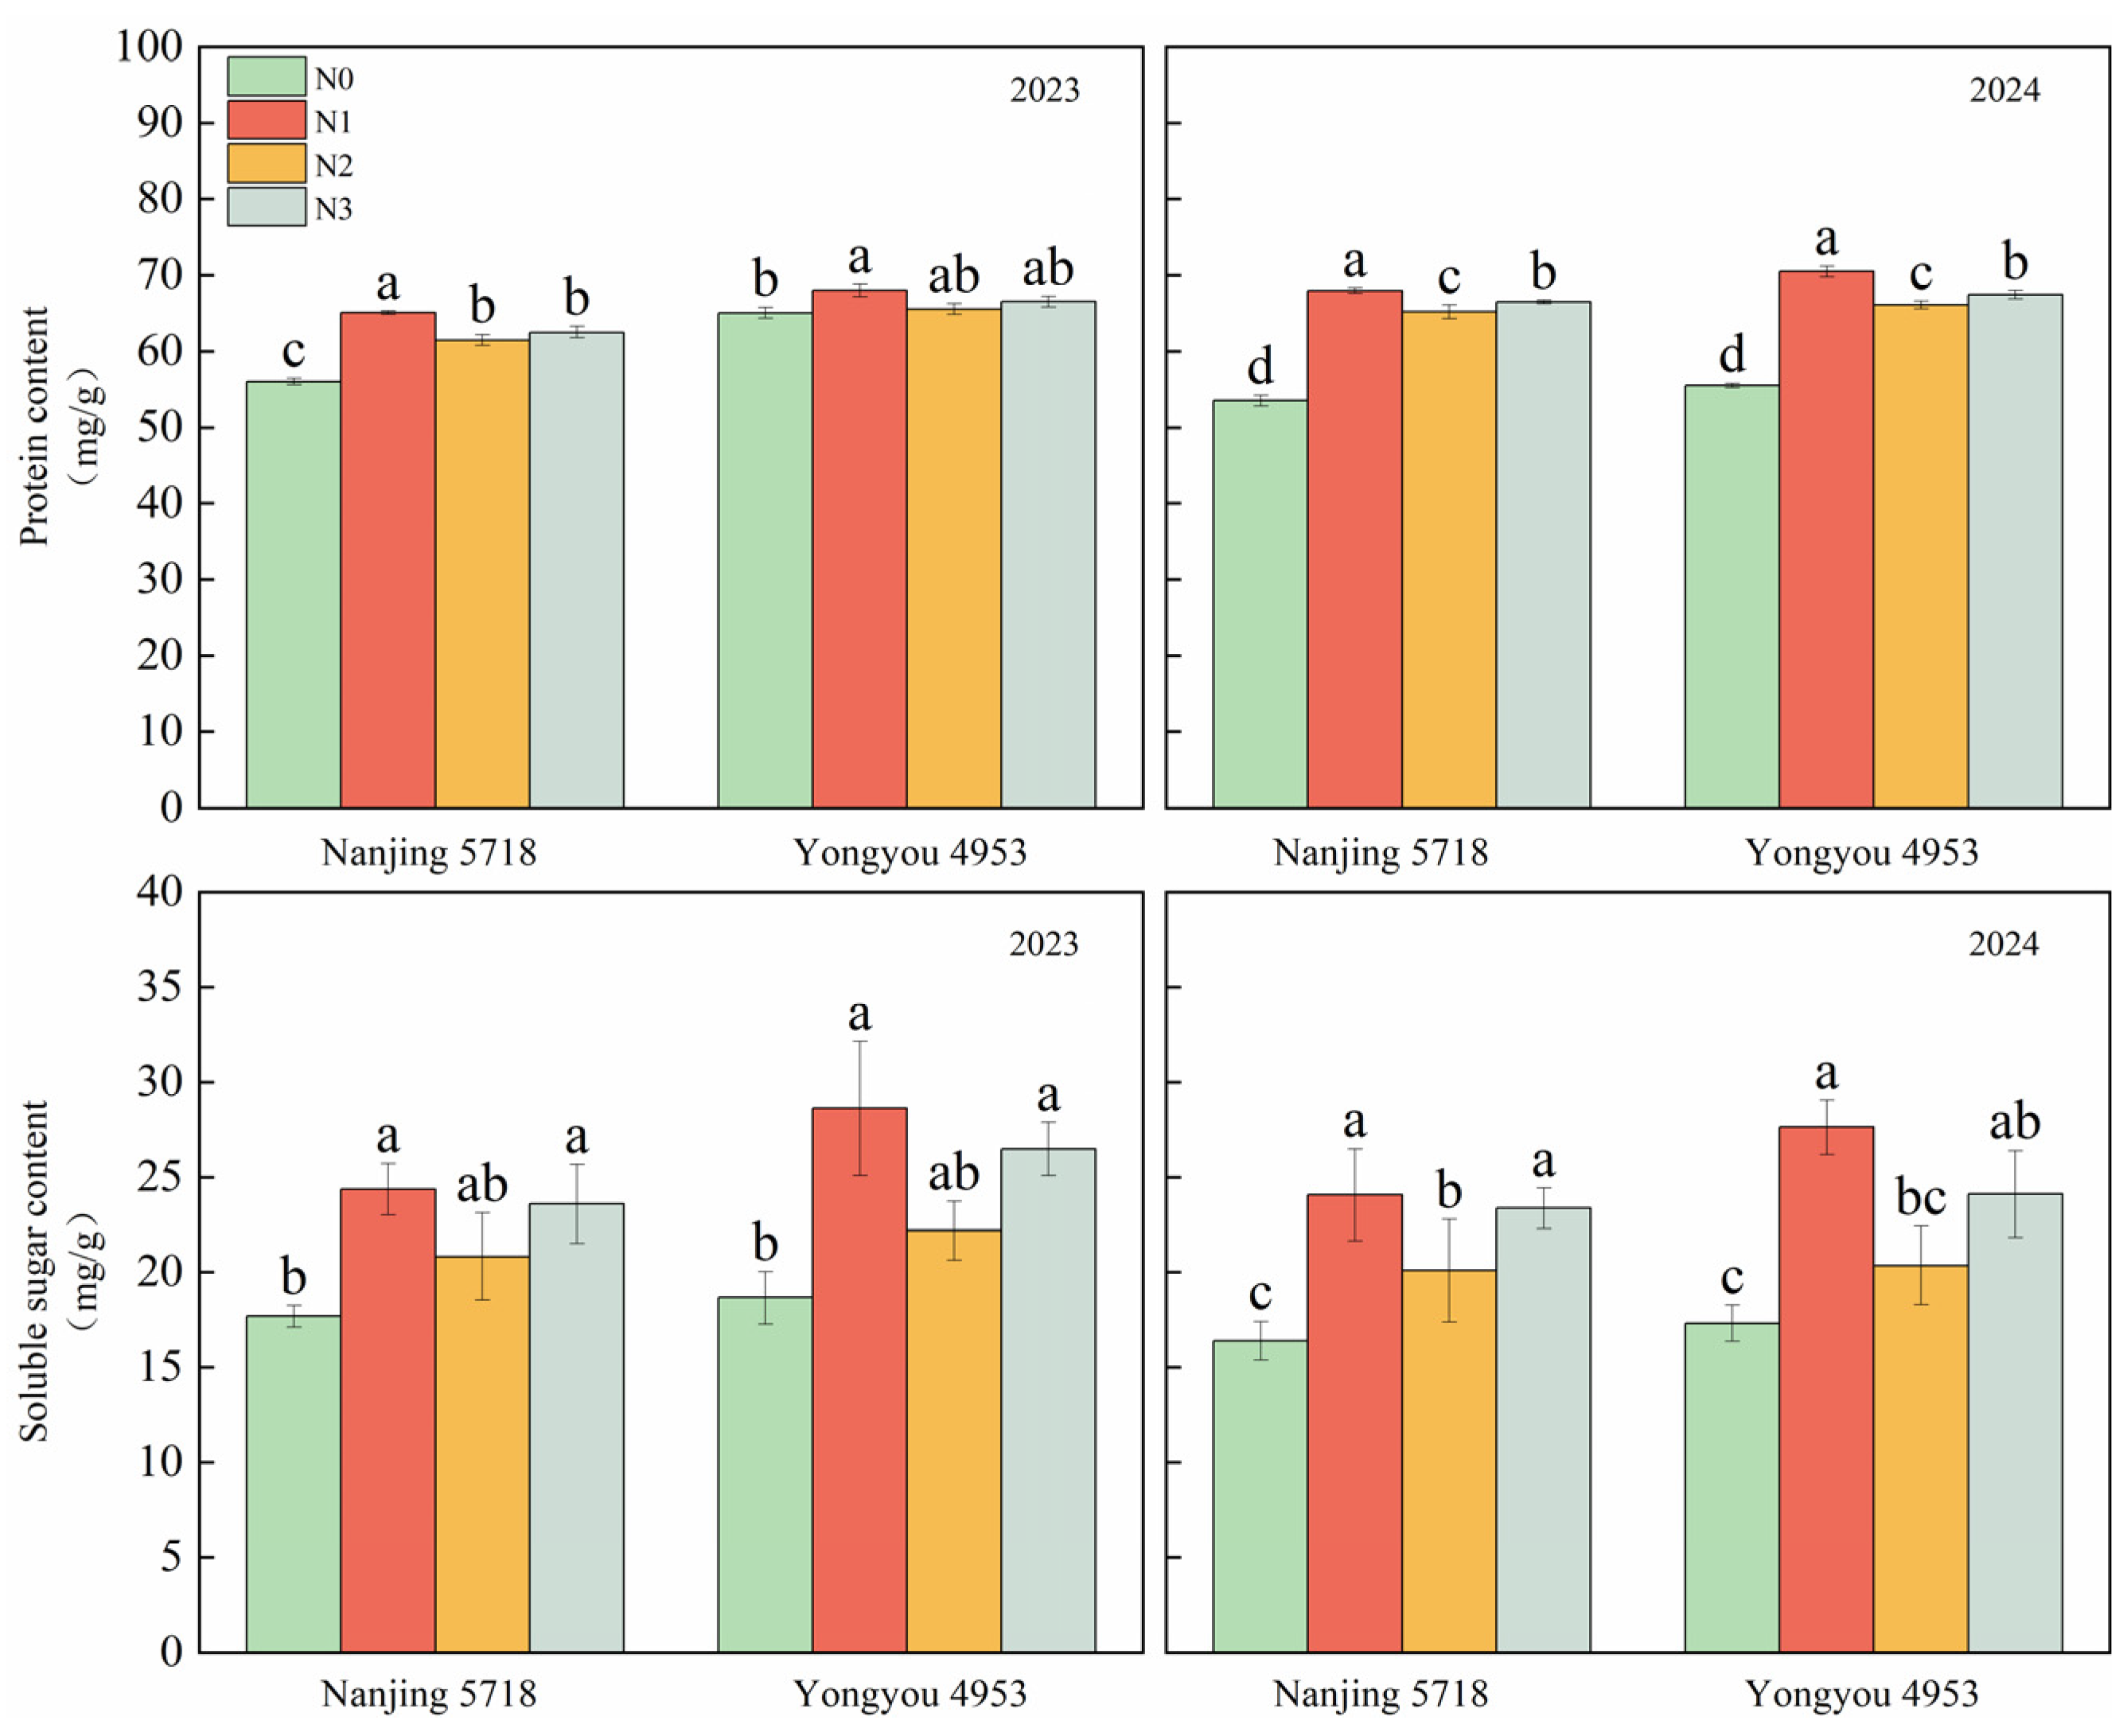
3.6. Rice Protein Content and Soluble Sugar Content

Compared with N1, the protein content in the N2 and N3 treatments decreased by 3.7% to 6.3% and 2.2% to 4.4%, respectively, over the two-year trial. A similar trend was observed in soluble sugar content, which also decreased under the N2 and N3 treatments by 14.5% to 26.3% and 3.0% to 12.7%, respectively, compared with N1 (Figure 3).

3.7. Rice Viscosity Characteristics (RVA Parameters)

RVA viscosity characteristics are key indicators of rice cooking quality. Peak viscosity, breakdown, and final viscosity values under the N2 and N3 treatments were higher than those observed under N1. Over the two-year period, peak viscosity and trough viscosity in N2 and N3 increased by 0.9% to 15.4% and 19.8% to 22.4%, respectively. In contrast, setback and consistency values decreased by 3.8% to 26.5% and 9.0% to 30.5%, respectively, compared with N1 (Table 7).

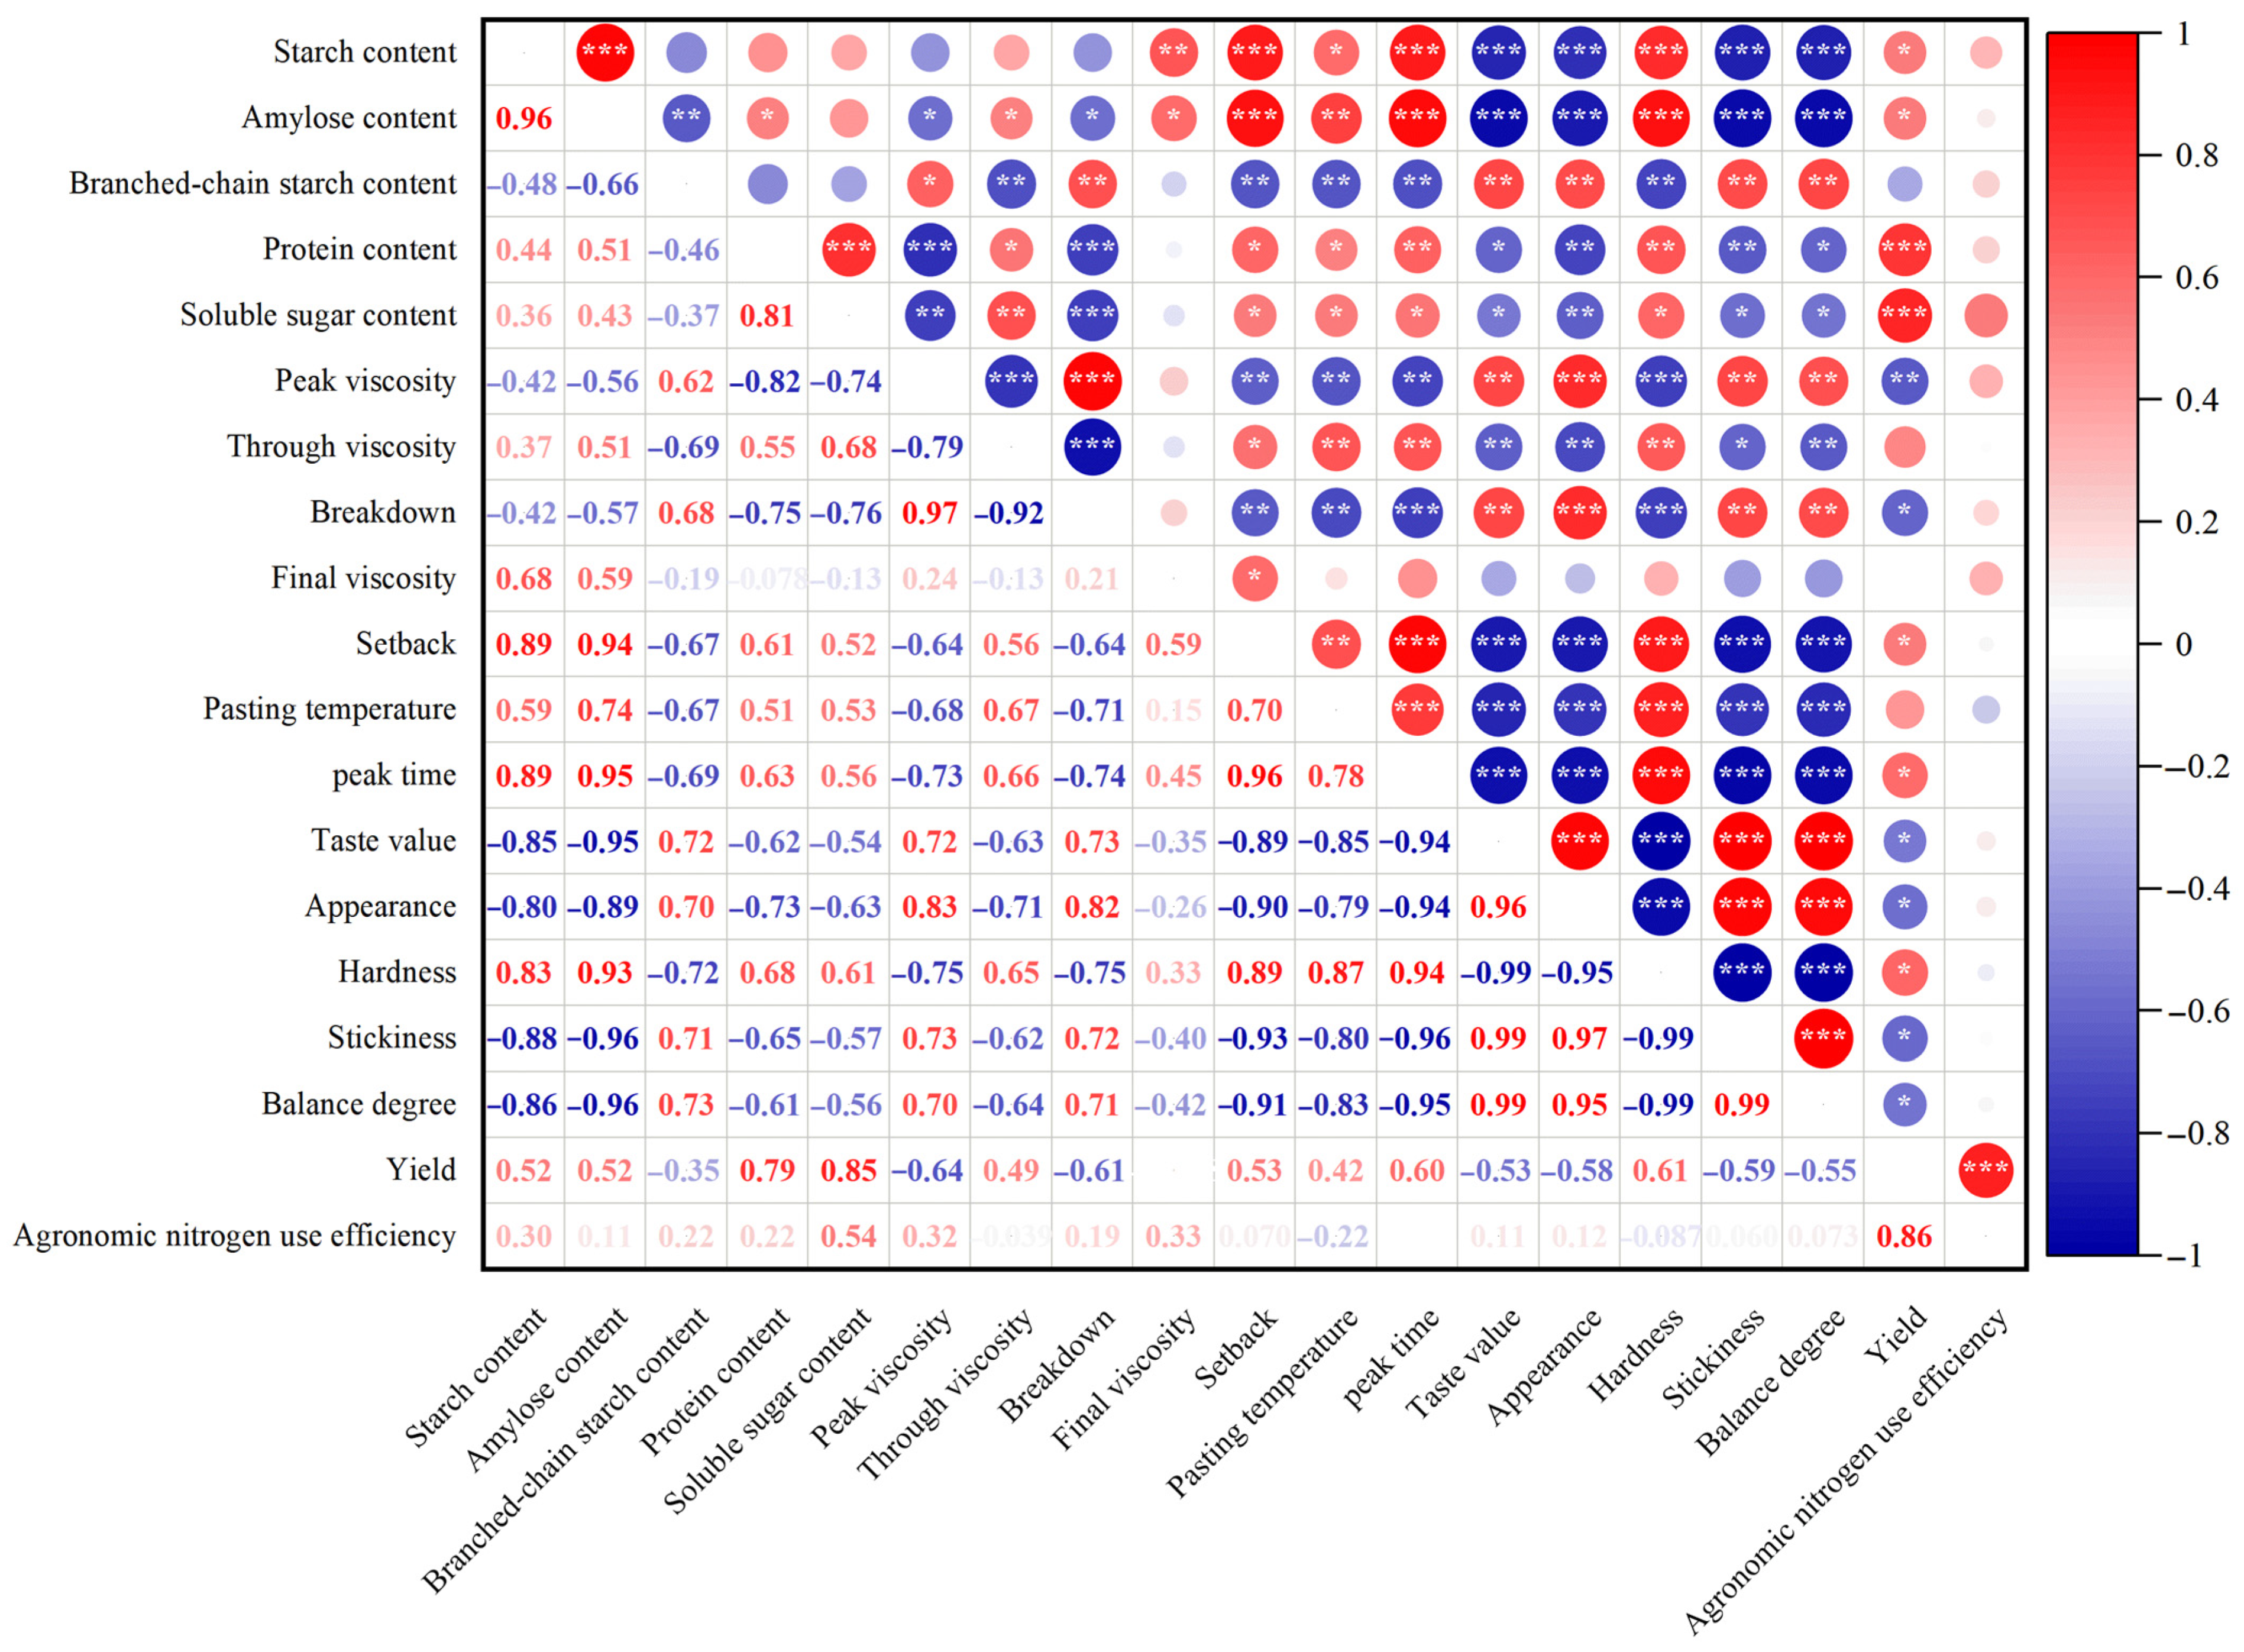
3.8. Correlation Analysis

Starch content, amylose content, protein content, and soluble sugar content were negatively correlated with appearance, stickiness, balance degree, and taste value. This suggests that higher starch, amylose, and protein content might result in rice with less desirable sensory properties, such as poorer texture and taste. This negative relationship is likely due to the impact of higher starch and protein content on the rice’s cooking properties, which can affect its mouthfeel and overall acceptability. Branched-chain starch content showed a highly significant positive correlation with appearance, viscosity, balance degree, and taste value while demonstrating a highly significant negative correlation with hardness. The positive correlation between branched-chain starch content and taste value suggests that this type of starch plays an important role in enhancing rice quality, likely by improving its texture and mouthfeel. Peak viscosity was positively correlated with appearance, stickiness, balance degree, and taste value, whereas trough viscosity and final viscosity were negatively correlated with taste value. These results highlight the importance of peak viscosity as an indicator of rice’s cooking and sensory qualities. High peak viscosity generally indicates better cooking characteristics, such as softness and less stickiness. In contrast, lower final viscosity and trough viscosity are associated with harder rice and undesirable texture. Additionally, peak viscosity and breakdown were negatively correlated with the hardness of rice. This suggests that rice varieties with higher peak viscosity and lower breakdown tend to have softer, more desirable textures. These findings underline the importance of controlling viscosity parameters for optimizing the texture and overall quality of rice (Figure 4). Furthermore, yield was positively correlated with protein content, soluble sugar content, and peak viscosity, suggesting that higher yield was associated with increased protein and sugar levels, which in turn may have enhanced peak viscosity. ANUE exhibited a highly significant positive correlation with yield, indicating that improved nitrogen use efficiency directly contributes to higher productivity.

4. Discussion

The effects of CRF application on rice yield exhibit considerable variability, which can be attributed to variations in climatic conditions, soil types, types of CRF, and application methods across different experimental contexts [22,23,24]. A substantial body of the literature suggests that CRF has the potential to enhance rice yield [14,25]. However, some studies have reported either no significant effect or even a reduction in yield following their application [26]. In this study, the grain yield of the rice varieties Nanjing 5718 and Yongyou 4953 under the N3 treatment showed an average increase of 10.2% to 12.9% compared to the N1 treatment. In contrast, the grain yield under the N2 treatment decreased by an average of 11.9% to 13.0%. Further analysis of the yield components indicated that the increased yield under the N3 treatment was dependent on the synergistic increases in panicles and spikelets per panicle (Table 3). A previous study indicated that a 20% reduction in nitrogen in CRF resulted in a modest increase in crop yield compared to split urea application [15]. However, these findings are not consistent with the results obtained in the present study. Several factors likely contributed to the observed yield reduction in N2. Firstly, existing research has demonstrated that soil compaction and poor aeration in saline-alkali areas exacerbate nitrogen loss through water-mediated fertilizer leaching [27]. Secondly, the interaction effects between CRF and soil salinity components merit consideration. It was reported that the elevated sodium (Na+) levels in saline-alkali soils impeded nutrient absorption by crops [28], leading to significant variations in the yield and yield components of rice compared to conventional paddy fields. A third and often overlooked factor is the influence of high salt concentrations on the integrity of CRF coating materials. Salinity stress may accelerate the breakdown of polymer coatings or alter nutrient diffusion, leading to premature nutrient release that mismatches crop demand during critical growth stages, thereby causing deficiencies during the reproductive phase [29]. Previous studies have indicated that salt stress can compromise root system vitality through osmotic stress-induced membrane damage, thereby diminishing nitrogen uptake efficiency [30,31]. There is a notable lack of research on the integration of CRF for rice seedlings. In this study, the direct entanglement and adsorption of CRF particles by roots reduced fertilizer loss due to volatilization, denitrification, leaching, and other factors, thereby enhancing nutrient absorption by the roots and subsequently improving rice yield. The nitrogen input was held constant across treatments (270 kg·hm−2), with variations in ANUE directly attributable to yield differences across treatments, following the order N3 > N1 > N2 (Figure 2). This result supports the findings of Hu et al., who suggested that CRF with extended-release cycles can improve the synchronized availability of nitrogen fertilizers [20]. This approach effectively reduces nitrogen loss and enhances nitrogen uptake efficiency in crops.
Rice quality is a complex and integrative trait that encompasses multiple dimensions, including processing quality, appearance quality, nutritional quality, and taste quality [17,32]. Two critical environmental factors influencing rice quality are the temperature regime during the grain-filling period and fertilization management during cultivation. Notably, the application of nitrogen fertilizer significantly affects the development of grain quality attributes [33]. Recent research indicates that while the use of CRF does not significantly impact brown rice recovery, it significantly enhances both milled rice recovery and head rice recovery [16]. Previous studies have shown that CRF ensures a more uniform distribution of nitrogen throughout the entire growth cycle of rice, unlike the split urea application in fractional amounts, which often results in insufficient nitrogen supply during critical growth phases. The sustained and stable release of nutrients has been shown to improve the processing quality of rice. It is essential to recognize that the application of urea is more susceptible to inducing an excess supply of nitrogen, which can impede the effective closure of rice hulls. This condition results in a higher incidence of broken rice and a diminished yield of finished rice. Conversely, CRF has demonstrated efficacy in alleviating nitrogen oversupply by precisely regulating the nitrogen release rate. Such regulation is critical for ensuring the optimal development of rice hulls, thereby enhancing the head rice rate. Over a two-year trial, the N2 treatment increased the brown rice rate and milled rice rate by 0.2% to 0.7% and 3.2% to 6.3%, respectively, while decreasing the head milling rice rate by 1.3% to 10.8% compared to the N1 treatment. In contrast, the N3 treatment resulted in increases of 0.2% to 0.7%, 3.8% to 7.9%, and 3.6% to 9.8% in the brown rice rate, milling rice rate, and head milling rice rate, respectively (Table 4). Research has demonstrated that N3 effectively aligns the nutrient release from CRF with the growth and developmental needs of rice, especially during the heading stage. This consistent nutrient availability has been shown to enhance grain enrichment and minimize breakage during milling, thereby substantially improving the rice’s processing quality. Conversely, N2 has exhibited inadequacies in nutrient supply during the later stages of growth, leading to a reduction in the head milling rice rate.
Seed chalk refers to an opaque, light-colored area within the rice endosperm, caused by an uneven distribution of assimilates, which negatively impacts the visual quality of the grain [34]. Previous studies have shown that moderate nitrogen application can reduce both the chalkiness degree and the proportion of chalky grains, whereas excessive nitrogen application tends to increase the proportion of chalky grains and result in suboptimal grain morphology. Cheng et al. reported that, under identical direct seeding conditions, the use of CRF decreased the percentage of chalky grains by 0.1% to 12.2% compared to split urea application [35]. Additional research suggests that split urea application may lead to excessively high nitrogen concentrations within the grains. This issue frequently arises due to the application of split urea during later growth stages, such as heading, which can exacerbate the development of chalkiness in the grains [19,36]. CRF release is better synchronized with rice nitrogen needs during mid to late growth stages, providing a more stable nitrogen supply. This synchronization facilitates a sustained moderate nitrogen supply, thereby mitigating the formation of a loose endosperm structure, which is commonly associated with excessive nitrogen during grain development [37]. In this study, the chalkiness degree and chalky grain percentage for N2 decreased by 9.9% to 33.3% and 8.8% to 18.4%, respectively, over the two years. Similarly, for N3, the chalkiness degree and chalky grain percentage decreased by 25.1% to 41.1% and 31.2% to 34.6%, respectively (Table 4). These findings are consistent with the results of previous research.
The one-time application of CRF with a 120-day release period at the seedling, combined with basal urea application, has been demonstrated to exert a positive influence on the rice taste quality. The enhancement of rice taste quality is achieved through improvements in its appearance, stickiness, balance degree, and a reduction in hardness (Table 5). Several factors influence rice taste quality, including amylose content, protein content, and soluble sugar content. The regulation of these indicators is affected by various factors, such as the type of nitrogen fertilizer and the method of application. Previous research demonstrated that under flooded irrigation conditions, CRF treatments decreased amylose content by 7.5% compared to split urea application. Under intermittent irrigation, CRF treatments reduced amylose content by 7.29% compared to split urea application [38]. Additionally, a significant increase in amylose content was observed in treatments with CRF and CRF with a 10% nitrogen reduction compared to the split urea application under saline conditions [39]. In the two-year trial, the amylose content in samples treated with N2 was consistently lower, or significantly lower, than that in samples treated with N1, with a reduction of 1.3% to 3.9%. A similar pattern was observed between N3 and N2, with a reduction of 2.7% to 5.5%. There was no statistically significant difference in branched-chain starch content between N2 and N1. However, the branched-chain starch content in N3 decreased by 0.3% to 1.0% compared to N1 across two years (Table 6). The underlying reasons for the varying effects of CRF on the straight-chain starch content in rice can be attributed to two primary factors: (1) the differences in fertilizer application methods. The use of CRF as a basal application, supplemented with a subsequent spike fertilizer, has been shown to increase amylose content [39]. In contrast, applying CRF as a basal application at a specific time point resulted in a decrease in the rectilinear amylose content [38]. (2) The availability of different types of CRF also plays a role. It has been observed that sulfur-coated CRF releases nutrients rapidly during the initial stages, potentially leading to an excess of nitrogen during the tillering stage, which may hinder amylose accumulation. On the other hand, resin-coated fertilizers release nutrients more gradually and are better suited to meet the starch synthesis demands during the middle and late stages, thereby enhancing amylose content [38,40]. (3) The application of CRF is based on the differential release of nitrogen quantities. Optimal levels of nitrogen fertilizer have been demonstrated to enhance photosynthesis, increase starch accumulation, and improve amylose content. In contrast, excessive nitrogen fertilizer has been shown to lead to excessive vegetative growth, inhibit starch synthesis, and decrease amylose content. Conversely, insufficient nitrogen fertilizer results in diminished photosynthesis, restricted starch synthesis, and reduced amylose content [41,42]. The starch content, amylose content, protein content, and soluble sugar content exhibit significant or highly significant negative correlations with taste value, whereas the branched-chain starch content shows a highly significant positive correlation with taste value (Figure 4). Prior research has established that the protein content of rice should not be excessively high and should be maintained within an optimal range [43]. For example, Shi et al. found that a reduction in protein content is beneficial for enhancing the gustatory qualities of rice [18]. Soluble sugars are defined as saccharides that dissolve in water, such as glucose, fructose, and sucrose [44]. Although typically present in low concentrations in rice, soluble sugars play a crucial role in its processing and cooking, particularly by contributing to pasting and viscosity formation [45]. Rice varieties with poor taste quality often exhibit higher total soluble sugar content, whereas those with favorable taste quality tend to have relatively lower soluble sugar levels [46]. In this study, the protein and soluble sugar contents in rice were ranked as N1 > N3 > N2 (Figure 3). Furthermore, the taste value of rice treated with CRF (N2 and N3) was significantly higher than that of N1 (Table 5), aligning with findings from previous research.
The RVA spectrum, which includes parameters such as peak viscosity, trough viscosity, breakdown, final viscosity, setback, and pasting temperature, has been shown to effectively characterize the viscosity properties of rice. This is particularly significant given the well-established correlation between rice viscosity and taste quality. The study identified a positive correlation between high taste value and increased peak viscosity, breakdown, and final viscosities, alongside reduced pasting temperatures in rice samples [18]. In this investigation, the rice taste value exhibited a significant positive correlation with both peak viscosity and breakdown, while showing a negative correlation with final viscosity (Figure 4). These differences in correlation outcomes may be partly explained by genotype-specific taste profiles, as Nanjing 5718 consistently exhibited higher palatability and lower final viscosity than Yongyou 4953. This variation in taste value likely accounts for the differences in correlation analysis outcomes when contrasted with previous studies. Liu et al. observed that the application of CRF in a basal manner led to a reduction in the setback of rice [40]. Additionally, their study revealed a significant increase in the peak viscosity, through viscosity, breakdown, and final viscosity of rice. Similarly, Wang et al. found that applying CRF at the three-leaf stage significantly improved the peak viscosity, breakdown, and final viscosity in spring-sown fresh glutinous maize [47]. The current study aligns with these previous findings, demonstrating that CRF treatments (N2, N3) significantly increased peak viscosity, breakdown, and final viscosity in the RVA parameters, with the order of effectiveness being N3 > N2 > N1. Moreover, the pasting temperature was significantly decreased, following the order N1 > N2 > N3 (Table 7).

5. Conclusions

The one-time application of CRF with a 120-day release period at the seedling stage, combined with basal urea application, significantly improved rice grain yield, grain quality, and agronomic nitrogen use efficiency in coastal saline soils. The increased grain yield of rice under N3 was attributable to the increased number of panicles and spikelets per panicle. N3 improved processing quality by increasing the milled and head rice rates, as well as appearance quality by reducing the chalkiness degree and chalky rice percentage. Moreover, N3 also improved the taste value by increasing balance degree, stickiness, and reducing hardness, as well as favorable changes in amylose and protein contents. This study offers a labor-saving and efficient fertilization strategy for sustainable rice production in coastal saline environments. However, this study was limited to short-term field trials under specific soil and climatic conditions in coastal saline soils. The long-term effects of CRF application on soil health, nutrient cycling, and environmental impacts were not assessed. Future studies should explore the performance of CRF under varying climate conditions and soil types, assess long-term impacts on soil microbial activity and nitrogen dynamics, and evaluate economic feasibility and farmer adoption in large-scale farming systems.

Author Contributions

Conceptualization, X.Z. and Q.D.; methodology, X.Z., X.S., H.W., and Q.D.; software, X.Z., X.G., Y.L., and Y.C.; validation, X.Z., X.G., H.W., and Q.D.; formal analysis, X.Z., W.M., X.S., P.G., and H.W.; investigation, X.Z., X.G., Y.L., L.W., J.Z., W.M., X.S., and L.S.; resources, L.W., J.Z., L.S., Y.C., and Q.D.; data curation, X.Z., L.W., P.G. and H.W.; writing—original draft preparation, X.Z.; writing—review and editing, X.Z., Y.L., and H.W.; visualization, X.Z., X.G., J.Z., W.M., and Y.C.; supervision, H.W. and Q.D.; project administration, H.W. and Q.D.; funding acquisition, H.W. and Q.D. All authors have read and agreed to the published version of the manuscript.

Funding

This work was supported in part by Scientific and Technological Innovation Fund of Carbon Emissions Peak and Neutrality of Jiangsu Provincial Department of Science and Technology (BE2022304), the Jiangsu Agriculture Science and Technology Innovation Fund CX (23) 1020, Natural Science Foundation of the Jiangsu Higher Education Institutions of China (24KJA210002), Key Research and Development Program of Jiangsu Province (BE2023355), Priority Academic Program Development of Jiangsu Higher Education Institutions (PAPD), and Postgraduate Research and Practice Innovation Program of Jiangsu Province (KYCX25_4023).

Data Availability Statement

All relevant data are contained within the article. The original contributions presented in the study are included in the article; further inquiries can be directed to the corresponding author.

Acknowledgments

The authors would like to express their sincere gratitude to the College of Agriculture at Yangzhou University and Huanghai Original Seed Factory for their invaluable guidance and support.

Conflicts of Interest

The authors declare that they have no known competing financial interests or personal relationships that could have appeared to influence the work reported in this paper.

Abbreviations

The following abbreviations are used in this manuscript:
ANUEagronomic nitrogen use efficiency
CRFcontrolled-release fertilizer
RVARapid ViscoAnalyser

References

  1. Baldos, U.L.C.; Pineda, A.C.; Fuglie, K.O.; Hertel, T.W. Adoption of improved crop varieties limited biodiversity losses, terrestrial carbon emissions, and cropland expansion in the tropics. Proc. Natl. Acad. Sci. USA 2025, 122, e2404839122. [Google Scholar] [PubMed]
  2. Gomez, C.; Amelin, J.; Coulouma, G.; Gaab, J.; Dharumarajan, S.; Riotte, J.; Sekhar, M.; Ruiz, L. Reuse of bottom sediment from reservoirs to cropland is a promising agroecological practice that must be rationalized. Sci. Rep. 2025, 15, 7523. [Google Scholar]
  3. Fukagawa, N.K.; Ziska, L.H. Rice: Importance for Global Nutrition. J. Nutr. Sci. Vitaminol. 2019, 65, S2–S3. [Google Scholar] [PubMed]
  4. Xu, Z.K.; Shao, T.Y.; Lv, Z.X.; Yue, Y.; Liu, A.H.; Long, X.H.; Zhou, Z.S.; Gao, X.M.; Rengel, Z. The mechanisms of improving coastal saline soils by planting rice. Sci. Total Environ. 2020, 703, 135529. [Google Scholar] [PubMed]
  5. Chu, Q.N.; Xue, L.H.; Cheng, Y.Q.; Liu, Y.; Feng, Y.F.; Yu, S.; Meng, L.; Pan, G.; Hou, P.F.; Duan, J.J.; et al. Microalgae-derived hydrochar application on rice paddy soil: Higher rice yield but increased gaseous nitrogen loss. Sci. Total Environ. 2020, 717, 137127. [Google Scholar]
  6. Li, Y.; Ai, Z.; Mu, Y.; Zhao, T.; Zhang, Y.; Li, L.; Huang, Z.; Nie, L.; Khan, M.N. Rice yield penalty and quality deterioration is associated with failure of nitrogen uptake from regreening to panicle initiation stage under salinity. Front. Plant Sci. 2023, 14, 1120755. [Google Scholar]
  7. Lv, B.-S.; Li, X.-W.; Ma, H.-Y.; Sun, Y.; Wei, L.-X.; Jiang, C.-J.; Liang, Z.-W. Differences in Growth and Physiology of Rice in Response to Different Saline-Alkaline Stress Factors. Agron. J. 2013, 105, 1889, Erratum in Crop Ecol. Physiol. 2013, 105, 1119–1128. [Google Scholar]
  8. Che, W.; Piao, J.; Gao, Q.; Li, X.; Li, X.; Jin, F. Response of soil physicochemical properties, soil nutrients, enzyme activity and rice yield to rice straw returning in highly saline-alkali paddy soils. J. Soil Sci. Plant Nutr. 2023, 23, 4396–4411. [Google Scholar]
  9. Garcia, G.; Treccarichi, S.; Cali, R.; Arena, D.; Tribulato, A.; Branca, F. Nitrogen Use Efficiency of Microbial and Amino Acid Treatments for Organic Broccoli (Brassica oleracea L. var. italica Plenk) Seed Production. Horticulturae 2025, 11, 253. [Google Scholar] [CrossRef]
  10. Ma, B.L.; Herath, A.W. Timing and rates of nitrogen fertiliser application on seed yield, quality and nitrogen-use efficiency of canola. Crop Pasture Sci. 2016, 67, 167–180. [Google Scholar]
  11. Ma, X.; Ding, Z.; Hu, R.; Wang, X.; Hou, J.; Zou, G.; Cao, B. Increasing rice yield with low ammonia volatilization by combined application of controlled-release blended fertilizer and densification. PLoS ONE 2025, 20, e0318177. [Google Scholar]
  12. Wang, L.; Xue, C.; Pan, X.; Chen, F.; Liu, Y. Application of Controlled-Release Urea Enhances Grain Yield and Nitrogen Use Efficiency in Irrigated Rice in the Yangtze River Basin, China. Front. Plant Sci. 2018, 9, 999. [Google Scholar]
  13. Ramasamy, S.; ten Berge, H.F.M.; Purushothaman, S. Yield formation in rice in response to drainage and nitrogen application. Field Crops Res. 1997, 51, 65–82. [Google Scholar]
  14. Sun, Y.; Yuan, X.; Chen, K.; Wang, H.; Luo, Y.; Guo, C.; Wang, Z.; Shu, C.; Yang, Y.; Weng, Y.; et al. Improving the yield and nitrogen use efficiency of hybrid rice through rational use of controlled-release nitrogen fertilizer and urea topdressing. Front. Plant Sci. 2023, 14, 1240238. [Google Scholar]
  15. Guo, Y.; Zhang, M.; Liu, Z.; Zhao, C.; Lu, H.; Zheng, L.; Li, Y.C. Applying and Optimizing Water-Soluble, Slow-Release Nitrogen Fertilizers for Water-Saving Agriculture. ACS Omega 2020, 5, 11342–11351. [Google Scholar]
  16. Dong, X.; Ying, Z.; Zhu, H.; Qun, H.; Liu, G.; Wei, H.; Zhang, H. Effects of a one-time application of controlled-release nitrogen fertilizer on quality and yield of rice. Food Energy Secur. 2023, 12, e413. [Google Scholar]
  17. Mi, K.; Yuan, X.; Wang, Q.; Dun, C.; Wang, R.; Yang, S.; Yang, Y.; Zhang, H.; Zhang, H. Zinc oxide nanoparticles enhanced rice yield, quality, and zinc content of edible grain fraction synergistically. Front. Plant Sci. 2023, 14, 1196201. [Google Scholar]
  18. Shi, S.; Wang, E.; Li, C.; Cai, M.; Cheng, B.; Cao, C.; Jiang, Y. Use of Protein Content, Amylose Content, and RVA Parameters to Evaluate the Taste Quality of Rice. Front. Nutr. 2022, 8, 758547. [Google Scholar]
  19. Wang, X.; Wang, K.; Yin, T.; Zhao, Y.; Liu, W.; Shen, Y.; Ding, Y.; Tang, S. Nitrogen Fertilizer Regulated Grain Storage Protein Synthesis and Reduced Chalkiness of Rice Under Actual Field Warming. Front. Plant Sci. 2021, 12, 715436. [Google Scholar]
  20. Hu, Y.; Cai, Q.; Xu, Y.; Xue, J.; Yu, E.; Wei, H.; Xu, K.; Huo, Z.; Zhang, H. One-time fertilization of controlled-release urea with compound fertilizer and rapeseed cake maintains rice grain yield and improves nitrogen use efficiency under reduced nitrogen conditions. Front. Plant Sci. 2023, 14, 1281309. [Google Scholar]
  21. Li, J.; Li, Y.e.; Wan, Y.; Wang, B.; Cai, W.; Qin, X.; Zhou, Z.; Wang, X.; Yuan, J.; Deng, Q. Annual greenhouse gas emissions from a rice paddy with different water-nitrogen management strategies in Central China. Soil Tillage Res. 2024, 235, 105906. [Google Scholar]
  22. Liu, Y.; Ma, C.; Li, G.; Jiang, Y.; Hou, P.; Xue, L.; Yang, L.; Ding, Y. Lower dose of controlled/slow release fertilizer with higher rice yield and N utilization in paddies: Evidence from a meta-analysis. Field Crops Res. 2023, 294, 108879. [Google Scholar]
  23. Chen, Z.; Wang, Q.; Ma, J.; Zhao, J.; Huai, Y.; Ma, J.; Ye, J.; Yu, Q.; Zou, P.; Sun, W.; et al. Combing mechanical side-deep fertilization and controlled-release nitrogen fertilizer to increase nitrogen use efficiency by reducing ammonia volatilization in a double rice cropping system. Front. Environ. Sci. 2022, 10, 1006606. [Google Scholar]
  24. Sun, H.; Zhou, S.; Zhang, J.; Zhang, X.; Wang, C. Effects of controlled-release fertilizer on rice grain yield, nitrogen use efficiency, and greenhouse gas emissions in a paddy field with straw incorporation. Field Crops Res. 2020, 253, 107814. [Google Scholar]
  25. Yang, X.; Geng, J.; Liu, Q.; Zhang, H.; Hao, X.; Sun, Y.; Lu, X. Controlled-release urea improved rice yields by providing nitrogen in synchrony with the nitrogen requirements of plants. J. Sci. Food Agric. 2021, 101, 4183–4192. [Google Scholar]
  26. Ding, W.-H.; Xie, H.-K.; Xu, C.; Dai, Z.; Zhang, J.; Wang, L.-G.; Li, H. Impacts of one-off fertilization on nitrogen leaching and economic benefits for rice-rape rotation system. J. Appl. Ecol. 2019, 30, 1097–1109. [Google Scholar]
  27. Lucas, E.R.; Toor, G.S.; McGrath, J.M. Agronomic and environmental phosphorus decline in coastal plain soils after cessation of manure application. Agric. Ecosyst. Environ. 2021, 311, 107337. [Google Scholar]
  28. Wu, H. Plant salt tolerance and Na+ sensing and transport. Crop J. 2018, 6, 215–225. [Google Scholar]
  29. Ransom, C.J.; Jolley, V.D.; Blair, T.A.; Sutton, L.E.; Hopkins, B.G. Nitrogen release rates from slow- and controlled-release fertilizers influenced by placement and temperature. PLoS ONE 2020, 15, e0234544. [Google Scholar]
  30. Zhang, X.; He, P.; Guo, R.; Huang, K.; Huang, X. Effects of salt stress on root morphology, carbon and nitrogen metabolism, and yield of Tartary buckwheat. Sci. Rep. 2023, 13, 12483. [Google Scholar]
  31. Nazir, F.; Mahajan, M.; Khatoon, S.; Albaqami, M.; Ashfaque, F.; Chhillar, H.; Chopra, P.; Khan, M.I.R. Sustaining nitrogen dynamics: A critical aspect for improving salt tolerance in plants. Front. Plant Sci. 2023, 14, 1087946. [Google Scholar]
  32. An, L.; Tao, Y.; Chen, H.; He, M.; Xiao, F.; Li, G.; Ding, Y.; Liu, Z. Embryo-Endosperm Interaction and Its Agronomic Relevance to Rice Quality. Front. Plant Sci. 2020, 11, 587641. [Google Scholar]
  33. Xu, Y.; Guan, X.; Han, Z.; Zhou, L.; Zhang, Y.; Asad, M.A.U.; Wang, Z.; Jin, R.; Pan, G.; Cheng, F. Combined Effect of Nitrogen Fertilizer Application and High Temperature on Grain Quality Properties of Cooked Rice. Front. Plant Sci. 2022, 13, 874033. [Google Scholar]
  34. Li, Q.; Deng, F.; Zeng, Y.; Li, B.; He, C.; Zhu, Y.; Zhou, X.; Zhang, Z.; Wang, L.; Tao, Y.; et al. Low Light Stress Increases Chalkiness by Disturbing Starch Synthesis and Grain Filling of Rice. Int. J. Mol. Sci. 2022, 23, 9153. [Google Scholar]
  35. Cheng, S.; Li, S.P.; Tian, J.Y.; Xing, Z.P.; Hu, Y.J.; Guo, B.W.; Wei, H.Y.; Gao, H.; Zhang, H.C. Effects of one-time nitrogen basal application on the yield and quality of different direct-seeding rice crops by machine. Trans. Chin. Soc. Agric. Eng. 2020, 36, 1–10. [Google Scholar]
  36. Sun, Y.; Wu, Y.; Sun, Y.; Luo, Y.; Guo, C.; Li, B.; Li, F.; Xing, M.; Yang, Z.; Ma, J. Effects of Water and Nitrogen on Grain Filling Characteristics, Canopy Microclimate with Chalkiness of Directly Seeded Rice. Agriculture 2022, 12, 122. [Google Scholar] [CrossRef]
  37. Xu, D.; Zhu, Y.; Zhu, H.; Hu, Q.; Liu, G.; Wei, H.; Zhang, H. Effects of a One-Time Application of Controlled-Release Nitrogen Fertilizer on Yield and Nitrogen Accumulation and Utilization of Late Japonica Rice in China. Agriculture 2021, 11, 1041. [Google Scholar]
  38. Wang, L.Y.; He, J.; Hua, K.J.; Zhang, C.J.; Ye, Z.M.; Zhang, L. Combined Effect of Slow-release Fertilizer and Irrigation Method on Growth Yield and Grain Quality of Rice. J. Irrig. Drain. 2023, 42, 44–52. [Google Scholar]
  39. Zhang, J.; Chen, P.J.; Han, J.J.; Zhai, C.J.; Miao, Y.Q.; Cui, S.Y. Effects of slow-release fertilizer application and nitrogen reduction treatment under saline stress on rice growth, panicle traits, yield and grain quality. J. Triticeae Crops 2023, 39, 1483–1491. [Google Scholar]
  40. Liu, C.; Zhou, T.; Xue, Z.; Wei, C.; Zhu, K.; Ye, M.; Zhang, W.; Zhang, H.; Liu, L.; Wang, Z.; et al. Combining Controlled-Release and Normal Urea Enhances Rice Grain Quality and Starch Properties by Improving Carbohydrate Supply and Grain Filling. Plants 2025, 14, 107. [Google Scholar] [CrossRef]
  41. Guo, X.; Wang, L.; Zhu, G.; Xu, Y.; Meng, T.; Zhang, W.; Li, G.; Zhou, G. Impacts of Inherent Components and Nitrogen Fertilizer on Eating and Cooking Quality of Rice: A Review. Foods 2023, 12, 2495. [Google Scholar] [CrossRef]
  42. Feng, W.; Xue, W.; Zhao, Z.; Shi, Z.; Wang, W.; Bai, Y.; Wang, H.; Qiu, P.; Xue, J.; Chen, B. Nitrogen fertilizer application rate affects the dynamic metabolism of nitrogen and carbohydrates in kernels of waxy maize. Front. Plant Sci. 2024, 15, 1416397. [Google Scholar]
  43. Diaz, E.O.; Kawamura, S.; Koseki, S. Effect of thickness and maturity on protein content of Japonica brown rice collected during postharvest processing. Biosyst. Eng. 2019, 183, 160–169. [Google Scholar]
  44. Ni, D.; Chen, Z.; Tian, Y.; Xu, W.; Zhang, W.; Kim, B.-G.; Mu, W. Comprehensive utilization of sucrose resources via chemical and biotechnological processes: A review. Biotechnol. Adv. 2022, 60, 107990. [Google Scholar]
  45. Honma, Y.; Adhikari, P.B.; Kuwata, K.; Kagenishi, T.; Yokawa, K.; Notaguchi, M.; Kurotani, K.; Toda, E.; Bessho-Uehara, K.; Liu, X.; et al. High-quality sugar production by osgcs1 rice. Commun. Biol. 2020, 3, 617. [Google Scholar]
  46. Hu, J.; Zhang, S.; Yang, S.; Zhou, J.; Jiang, Z.; Qi, S.; Xu, Y. Effects of Irrigation and Fertilization Management on Yield and Quality of Rice and the Establishment of a Quality Evaluation System. Agronomy 2023, 13, 2034. [Google Scholar] [CrossRef]
  47. Wang, S.Y.; Li, G.H.; Lu, W.P.; Lu, D.L. Effects of Slow-Release Fertilizer Application Stage on Yield and Quality of Spring-Sown Fresh Waxy Maize. J. Nucl. Agric. Sci. 2021, 35, 2136–2144. [Google Scholar]
Figure 1. Geographical location of the experimental site.
Agronomy 15 01662 g001
Figure 2. Nitrogen agronomic use efficiency of rice in 2023 and 2024. Note: Vertical bars represent ± standard error of the mean. Different letters above bars indicate statistical significance at p = 0.05 within the same measurement stage.
Agronomy 15 01662 g002
Figure 3. Rice protein content and soluble sugar content in 2023 and 2024. Note: Vertical bars represent ± standard error of the mean. Different letters above bars indicate statistical significance at p = 0.05 within the same measurement stage.
Agronomy 15 01662 g003
Figure 4. Correlation of starch fractions, protein, and soluble sugar content and rice viscosity characteristics (RVA parameters) with taste quality. *** indicates significance at p ≤ 0.001, ** indicates significance at p ≤ 0.01, * indicates significance at p ≤ 0.05.
Agronomy 15 01662 g004
Table 1. Soil nutrient status of the field prior to rice transplantation in 2023 and 2024.
YearOrganic Matter
g kg−1
Alkali-Hydrolyzable Nitrogen
mg kg−1
Available Phosphorus
mg kg−1
Available Potassium
mg kg−1
202322.188.533.279.3
202419.874.524.765.2
Table 2. Experimental design and nitrogen application treatments.
TreatmentNitrogen Fertilizer TypeNitrogen Application Rate (kg hm−2)Application Timing and Method
N0No nitrogen fertilization0No nitrogen application
N1Conventional Urea (46% nitrogen)2705:1:2:2 ratio at 1-day before transplanting, 7-day after transplanting, panicle initiation, and penultimate-leaf appearance stage
N2Controlled-Release Fertilizer (42% nitrogen, 80-day release) + Urea27050% CRF applied at 1-day before transplanting, 50% urea applied during planting
N3Controlled-Release Fertilizer (30% nitrogen, 120-day release) + Urea27050% CRF applied at seedling stage, 50% urea applied at 1-day before transplanting
Table 3. Rice yield and its component factors in 2023 and 2024.
Year/TreatmentPanicle (×104 hm−2)Spikelets per PanicleSeed-Setting Rate (%)1000-Grain WeightGrain Yield
Variety(g)(t hm−2)
2023
NanjingN0254.0 ± 3.6 d131.0 ± 1.8 d79.3 ± 0.4 d23.1 ± 0.4 c4.7 ± 0.4 d
5718N1299.7 ± 4.2 b146.9 ± 0.9 b86.5 ± 0.4 a25.8 ± 0.5 a7.8 ± 0.1 b
N2290.3 ± 2.0 c143.7 ± 1.2 c83.8 ± 0.6 c24.7 ± 0.4 b6.4 ± 0.4 c
N3318.6 ± 4.9 a153.1 ± 0.2 a85.2 ± 0.9 b25.2 ± 0.3 ab8.4 ± 0.2 a
YongyouN0220.5 ± 5.0 d234.7 ± 0.7 d73.6 ± 0.4 c20.7 ± 0.4 c6.1 ± 0.5 c
4953N1259.1 ± 1.3 b263.8 ± 0.1 b78.3 ± 0.9 a23.0 ± 0.3 a8.8 ± 0.6 b
N2246.6 ± 2.7 c257.6 ± 0.4 c75.5 ± 0.7 b22.2 ± 0.3 b8.2 ± 0.3 b
N3274.4 ± 2.7 a273.0 ± 0.6 a77.4 ± 1.3 a22.5 ± 0.3 ab9.9 ± 0.5 a
Mean270.4200.579.923.47.5
2024
NanjingN0259.2 ± 4.7 d133.3 ± 0.6 c80.7 ± 0.8 c23.0 ± 0.3 c5.1 ± 0.2 d
5718N1306.3 ± 2.2 b145.5 ± 0.5 b89.2 ± 0.8 a25.8 ± 0.4 a7.9 ± 0.3 b
N2295.6 ± 2.1 c143.1 ± 0.6 b86.8 ± 0.9 b24.5 ± 0.6 b6.3 ± 0.2 c
N3320.5 ± 2.7 a153.7 ± 0.7 a88.6 ± 1.1 ab25.3 ± 0.2 ab8.7 ± 0.3 a
YongyouN0228.9 ± 2.4 d240.6 ± 0.5 d72.4 ± 1.2 c20.1 ± 0.3 d5.9 ± 0.6 d
4953N1255.5 ± 2.6 b265.0 ± 0.4 b78.5 ± 0.9 a23.0 ± 0.1 a8.6 ± 0.2 b
N2250.4 ± 2.0 c261.1 ± 0.5 c76.9 ± 0.8 b21.8 ± 0.3 c8.0 ± 0.4 c
N3274.1 ± 2.9 a271.3 ± 0.2 a77.3 ± 1.0 b22.4 ± 0.2 b9.9 ± 0.5 a
Mean273.8201.781.323.27.6
FYear******--
Variety**********
Treatment**********
Year × Variety-****-*
Year × Treatment-***--
Variety × Treatment******-**
Year × Variety × Treatment-**---
Note: Means (n = 3) within each column and year, followed by different lowercase letters, were significantly different (p < 0.05). Symbols “*” and “**” represent significant differences at the 0.05 and 0.01 levels, respectively.
Table 4. Rice processing and appearance quality in 2023 and 2024 (%).
Year/TreatmentProcessing QualityAppearance Quality
VarietyBrown Rice RateMilled Rice RateHead Rice RateChalkiness DegreeChalky Rice Percentage
2023
NanjingN084.0 ± 0.1 a68.5 ± 0.2 a44.2 ± 0.7 a1.6 ± 0.08 d8.7 ± 0.2 d
5718N184.2 ± 0.5 a62.6 ± 0.8 c38.7 ± 0.6 bc4.9 ± 0.09 a16.9 ± 0.1 a
N284.7 ± 0.1 a65.8 ± 0.8 b36.0 ± 2.5 c3.2 ± 0.08 b14.8 ± 0.1 b
N384.6 ± 0.3 a66.4 ± 0.7 ab42.6 ± 0.6 ab2.9 ± 0.10 c11.1 ± 0.1 c
YongyouN084.1 ± 0.7 a72.9 ± 1.1 a57.6 ± 0.6 a1.1 ± 0.05 b4.4 ± 0.1 d
4953N184.1 ± 0.2 a69.2 ± 0.9 b49.9 ± 0.7 c2.1 ± 0.18 a11.1 ± 0.1 a
N284.2 ± 0.5 a71.7 ± 1.4 ab47.8 ± 0.3 d1.9 ± 0.23 a10.0 ± 0.2 b
N384.8 ± 0.1 a72.3 ± 0.4 ab54.1 ± 0.3 b1.3 ± 0.05 b7.6 ± 0.1 c
Mean84.568.546.42.410.6
2024
NanjingN083.9 ± 0.3 a68.9 ± 0.6 a47.9 ± 0.8 a3.4 ± 0.25 d7.6 ± 0.2 d
5718N184.1 ± 0.2 a64.0 ± 0.9 b43.2 ± 1.0 c5.7 ± 0.11 a16.0 ± 0.1 a
N284.0 ± 0.1 a66.7 ± 1.0 a41.4 ± 1.8 c5.1 ± 0.11 b13.1 ± 0.1 b
N383.9 ± 0.3 a68.0 ± 0.3 a44.8 ± 1.1 b4.3 ± 0.15 c10.6 ± 0.1 c
YongyouN083.9 ± 0.9 a72.8 ± 1.0 a54.2 ± 0.7 a1.5 ± 0.11 d4.6 ± 0.2 d
4953N183.9 ± 0.3 a67.9 ± 0.8 b48.9 ± 0.4 b2.8 ± 0.09 a13.0 ± 0.1 a
N284.0 ± 0.1 a71.3 ± 0.4 a47.2 ± 0.8 b2.5 ± 0.11 b11.3 ± 0.2 b
N384.3 ± 0.6 a72.1 ± 0.1 a52.8 ± 0.1 a2.1 ± 0.08 c8.7 ± 0.1 c
Mean83.96947.63.410.6
FYear--****-
Variety-********
Treatment-********
Year × Variety-*******
Year × Treatment---****
Variety × Treatment---****
Year × Variety × Treatment---****
Note: Means (n = 3) within each column and year, followed by different lowercase letters, were significantly different (p < 0.05). Symbols “*” and “**” represent significant differences at the 0.05 and 0.01 levels, respectively.
Table 5. Rice taste quality in 2023 and 2024.
Year/TreatmentTaste ValueAppearanceHardnessStickinessBalance Degree
Variety
2023
NanjingN064.9 ± 1.8 a6.3 ± 0.2 a6.9 ± 0.2 b6.3 ± 0.3 a5.8 ± 0.3 a
5718N153.9 ± 1.0 b4.4 ± 0.3 d7.6 ± 0.3 a4.4 ± 0.3 c4.2 ± 0.4 b
N256.3 ± 0.5 b4.9 ± 0.5 c7.6 ± 0.1 a4.5 ± 0.3 c4.3 ± 0.3 b
N364.3 ± 2.9 a5.7 ± 0.2 b7.1 ± 0.1 b5.6 ± 0.5 b5.7 ± 0.5 a
YongyouN050.7 ± 0.8 a4.1 ± 0.3 a7.8 ± 0.1 c3.5 ± 0.3 a3.5 ± 0.1 a
4953N134.1 ± 2.0 d2.6 ± 0.4 b9.1 ± 0.2 a1.2 ± 0.4 c0.8 ± 0.3 c
N239.5 ± 0.8 c3.7 ± 0.1 a8.7 ± 0.2 ab2.0 ± 0.2 b1.7 ± 0.2 b
N344.7 ± 1.4 b4.0 ± 0.2 a8.4 ± 0.3 b2.3 ± 0.3 b2.2 ± 0.4 b
Mean51.14.57.93.73.5
2024
NanjingN063.1 ± 1.6 a6.2 ± 0.1 a6.8 ± 0.1 c6.2 ± 0.2 a5.8 ± 0.3 a
5718N151.1 ± 2.8 c4.2 ± 0.1 d7.6 ± 0.1 a4.2 ± 0.2 c4.3 ± 0.2 b
N254.9 ± 1.8 b4.7 ± 0.2 c7.6 ± 0.1 a4.2 ± 0.3 c4.4 ± 0.1 b
N362.6 ± 1.9 a5.4 ± 0.2 b7.2 ± 0.1 b5.5 ± 0.4 b5.7 ± 0.5 a
YongyouN048.5 ± 2.2 a4.3 ± 0.1 a7.8 ± 0.1 d3.3 ± 0.3 a3.5 ± 0.2 a
4953N132.9 ± 1.6 d2.8 ± 0.2 c9.1 ± 0.1 a1.2 ± 0.2 c0.8 ± 0.2 d
N237.4 ± 2.1 c3.5 ± 0.2 b8.8 ± 0.1 b2.1 ± 0.1 b1.8 ± 0.1 c
N342.3 ± 2.2 b3.8 ± 0.2 b8.5 ± 0.1 c2.3 ± 0.3 b2.2 ± 0.1 b
Mean49.14.47.93.63.6
FYear**----
Variety**********
Treatment**********
Year × Variety-----
Year × Treatment-----
Variety × Treatment**********
Year × Variety × Treatment-----
Note: Means (n = 3) within each column and year, followed by different lowercase letters, were significantly different (p < 0.05). Symbol “**” represents significant differences at 0.01 level.
Table 6. Rice starch content in 2023 and 2024 (%).
Year/TreatmentStarch ContentAmylose ContentBranched-Chain Starch Content
Variety
2023
NanjingN080.2 ± 0.6 a11.9 ± 0.2 b68.4 ± 0.5 a
5718N180.5 ± 1.0 a12.8 ± 0.1 a67.7 ± 0.8 a
N280.2 ± 0.2 a12.4 ± 0.2 ab67.8 ± 0.2 a
N380.6 ± 0.6 a12.2 ± 0.2 b68.4 ± 0.5 a
YongyouN082.1 ± 0.1 a14.2 ± 0.1 c67.9 ± 0.2 a
4953N182.2 ± 0.1 a15.0 ± 0.1 a67.2 ± 0.1 b
N281.9 ± 0.5 a14.8 ± 0.1 ab67.1 ± 0.4 b
N382.3 ± 0.1 a14.6 ± 0.1 b67.7 ± 0.1 a
Mean81.213.567.8
2024
NanjingN080.0 ± 0.3 a12.0 ± 0.1 c68.1 ± 0.2 a
5718N180.9 ± 0.5 a12.8 ± 0.1 a68.1 ± 0.4 a
N280.1 ± 0.1 a12.3 ± 0.1 b67.8 ± 0.1 a
N380.3 ± 0.3 a12.1 ± 0.1 bc68.3 ± 0.3 a
YongyouN082.2 ± 0.1 a14.2 ± 0.1 c68.0 ± 0.1 a
4953N182.2 ± 0.1 a15.1 ± 0.1 a67.2 ± 0.1 b
N282.4 ± 0.1 a14.9 ± 0.1 ab67.5 ± 0.1 b
N382.6 ± 0.5 a14.7 ± 0.1 b67.8 ± 0.4 a
Mean81.313.567.8
FYear---
Variety******
Treatment-****
Year × Variety---
Year × Treatment---
Variety × Treatment---
Year × Variety × Treatment---
Note: Means (n = 3) within each column and year, followed by different lowercase letters, were significantly different (p < 0.05). Symbol “**” represents significant differences at 0.01 level.
Table 7. Rice viscosity characteristics (RVA parameters) in 2023 and 2024.
Year/TreatmentPeak ViscosityThrough ViscosityBreakdownFinal ViscositySetbackPasting TemperaturePeak Time
Variety(cP)(cP)(cP)(cP)(cP)(°C)(min)
2023
Nanjing 5718N03374 ± 7 a1325 ± 59 c2049 ± 66 a2630 ± 81 a−744 ± 88 c74.2 ± 0.3 b5.4 ± 0.05 b
N12267 ± 4 d2115 ± 136 a152 ± 140 d1871 ± 57 b−396 ± 61 a76.4 ± 0.6 a6.0 ± 0.14 a
N22572 ± 64 c1555 ± 11 b1017 ± 75 c2011 ± 63 b−562 ± 11 b75.2 ± 0.1 ab5.8 ± 0.05 a
N32737 ± 12 b1469 ± 2 bc1268 ± 14 b2036 ± 51 b−701 ± 13 c74.8 ± 0.5 b5.7 ± 0.09 ab
Yongyou 4953N02797 ± 147 a1447 ± 48 c1350 ± 99 a2995 ± 62 a198 ± 85 a75.5 ± 0.6 c6.2 ± 0.01 a
N12180 ± 19 b2062 ± 204 a118 ± 185 c2406 ± 74 d327 ± 54 a91.4 ± 0.5 a6.5 ± 0.09 a
N22199 ± 92 b1736 ± 40 b463 ± 52 b2484 ± 76 c285 ± 16 a87.0 ± 0.1 b6.5 ± 0.24 a
N32612 ± 23 a1591 ± 187 bc1021 ± 209 a2854 ± 25 b242 ± 47 a76.3 ± 0.5 c6.3 ± 0.01 a
Mean259216639302411−18278.96.1
2024
Nanjing 5718N03270 ± 79 a1289 ± 50 c1982 ± 129 a2163 ± 180 a−1107 ± 91 c74.5 ± 0.1 b5.4 ± 0.19 c
N12294 ± 37 d1531 ± 35 a763 ± 72 d1866 ± 32 a−428 ± 6 a76.9 ± 0.9 a5.9 ± 0.16 a
N22561 ± 16 c1473 ± 6 ab1088 ± 22 c1982 ± 157 a−579 ± 141 ab75.2 ± 0.1 b5.7 ± 0.12 ab
N32750 ± 18 b1339 ± 57 bc1412 ± 39 b2098 ± 123 a−652 ± 81 b74.6 ± 0.2 b5.6 ± 0.05 b
Yongyou 4953N02813 ± 41 a1438 ± 37 c1375 ± 4 a2686 ± 97 a−128 ± 56 b75.7 ± 0.2 b6.1 ± 0.06 c
N12138 ± 60 d1771 ± 34 a367 ± 94 c2383 ± 43 b245 ± 43 a85.6 ± 3.8 a6.4 ± 0.06 a
N22467 ± 45 c1647 ± 8 b821 ± 53 b2410 ± 25 b−58 ± 31 b84.9 ± 1.6 ab6.4 ± 0.08 a
N32616 ± 5 b1612 ± 34 b1004 ± 39 b2531 ± 66 ab−85 ± 20 b77.9 ± 3.5 ab6.2 ± 0.13 b
Mean2614151311012265−34978.25.9
FYear-********-**
Variety**************
Treatment**************
Year × Variety*---***-
Year × Treatment*********-
Variety × Treatment**-**-***-
Year × Variety × Treatment--***--
Note: Means (n = 3) within each column and year, followed by different lowercase letters, were significantly different (p < 0.05). Symbols “*” and “**” represent significant differences at the 0.05 and 0.01 levels, respectively.
Disclaimer/Publisher’s Note: The statements, opinions and data contained in all publications are solely those of the individual author(s) and contributor(s) and not of MDPI and/or the editor(s). MDPI and/or the editor(s) disclaim responsibility for any injury to people or property resulting from any ideas, methods, instructions or products referred to in the content.

