Article

Optimizing Effects of Organic Farming and Moderately Low Nitrogen Levels on Soil Carbon and Nitrogen Pools

1
Jiangsu Key Laboratory of Crop Genetics and Physiolog/Jiangsu Key Laboratory of Crop Cultivation and Physiology, Agricultural College of Yangzhou University, Yangzhou 225009, China
2
Jiangsu Co-Innovation Center for Modern Production Technology of Grain Crops, Yangzhou University, Yangzhou 225009, China
*
Author to whom correspondence should be addressed.
Agronomy 2025, 15(7), 1561; https://doi.org/10.3390/agronomy15071561
Submission received: 4 June 2025 / Revised: 23 June 2025 / Accepted: 24 June 2025 / Published: 26 June 2025
(This article belongs to the Section Agroecology Innovation: Achieving System Resilience)

Abstract

Reasonable nitrogen fertilizer management and cultivation methods can enhance the nitrogen supply and carbon sequestration capabilities of soil, which is beneficial for meeting the growth requirements of crops and alleviating environmental issues. However, the existing research on optimizing nitrogen use efficiency and soil carbon sequestration in organic systems remains limited. Therefore, a field trial was conducted to elucidate the impacts of different cultivation patterns and nitrogen application rates on soil carbon and nitrogen pools, especially on how these factors affect the components of soil organic carbon. The treatments included conventional cultivation with low nitrogen treatment (CFN12), conventional cultivation with high nitrogen treatment (CFN18), organic cultivation with low nitrogen treatment (OFN12), and organic cultivation with high nitrogen treatment (OFN18). The results demonstrated that, relative to CFN18, OFN12 significantly increased the accumulation amounts of organic carbon and nitrogen in paddy soil. This was evident under multiple classifications of organic carbon, while it showed no advantage in the accumulation of mineral nitrogen. Notably, the organic cultivation mode increased the activities of enzymes involved in the carbon–nitrogen cycle in the cultivated layer and optimized the structure of humus, which gave the proportion of aggregates with a particle size greater than 0.5 mm more advantages. Correlation analysis demonstrated that the pertinent indices associated with soil carbon and nitrogen pools exhibited a highly significant positive correlation in the topsoil layer, accompanied by pronounced synergistic interactions among them. The PCA comprehensive scoring results indicate that OFN12 has the highest total score, indicating that it is beneficial for the improvement of soil fertility. This study offers practical insights for improving soil health, boosting plant growth, and enhancing climate mitigation through soil carbon storage, contributing to more sustainable agricultural practices.

1. Introduction

The physicochemical properties of soil serve as crucial indicators for assessing soil health and productivity, exerting significant influences on crop growth, environmental quality, and climate change [1]. In recent years, with the development of intensive agriculture, excessive application of nitrogen fertilizers has exerted adverse impacts on the physicochemical properties of soil. Organic cultivation and moderate reduction in nitrogen fertilization can effectively improve soil physicochemical properties, gradually ameliorating soil conditions without compromising crop yields [2], aligning with the future trend of sustainable agriculture.
The soil nitrogen pool represents the total amount of nitrogen stored in the soil. Nitrogen fertilization management practices have a significant impact on the soil nitrogen pool. Excessive application of chemical or synthetic nitrogen fertilizers, compared to organic fertilizers, significantly decreases the soil carbon-to-nitrogen ratio, which has become a consensus in recent years. Moderately reducing nitrogen fertilizer application can prevent land degradation, yield reduction due to nitrogen deficiency, or decreased fertilizer efficiency and environmental harm caused by excessive nitrogen fertilization. Adequate nitrogen fertilization can enhance soil nitrogen supply capacity to meet crop nitrogen demand. However, excessive nitrogen application can lead to nitrogen leaching, causing environmental pollution. Yang et al. [3] also found that organic cultivation can increase soil nitrogen supply capacity while reducing nitrogen leaching. Nitrogen leaching refers to the process in which nitrogen accumulated in the soil is lost to groundwater or surface water bodies with water. Excessive application of nitrogen fertilizer will cause a large amount of nitrogen (mainly soluble nitrogen such as nitrate–nitrogen) to enter water bodies through leaching, triggering environmental problems such as eutrophication of water bodies [4]. In addition, the transformation processes of nitrogen in the soil (such as nitrification and denitrification) will produce greenhouse gases such as nitrous oxide (N2O), exacerbating global warming [5]. Therefore, reducing excessive nitrogen input in agriculture can lower the risk of nitrogen leaching and thus alleviate environmental pollution. All of these provide theoretical support for combining nitrogen reduction with organic cultivation in farming practices.
The soil carbon pool represents the largest carbon reservoir within the terrestrial ecosystem. The composition of this pool not only affects carbon accumulation and decomposition processes but also directly regulates the global terrestrial carbon balance. Even slight changes in the soil carbon pool can have important effects on global carbon balance. Nitrogen application is undoubtedly a key factor affecting crop yield. However, the contribution rate of soil organic carbon to crop yield is nearly one-fifth of that of nitrogen application. Within a certain threshold, the crop yield will increase with the increase in soil organic carbon [6]. Organic cultivation can increase soil carbon storage by increasing organic matter input into the soil. Compared with conventional cultivation, organic cultivation can increase soil organic matter content by 20–50% through the application of organic materials [7]. Increasing soil carbon storage can improve soil fertility, enhance soil structure, and mitigate climate change through carbon sequestration [8]. If the sequestration amount of soil organic carbon can be expanded to a new level with the popularization of the application of organic cultivation, it will make a great contribution to reducing CO2 emissions, thereby alleviating the climate pressure caused by the greenhouse effect [6].
Current research has found that most nitrogen and organic carbon in soil aggregate in water-stable macroaggregates with particle sizes of 0.25–2 mm. Soluble organic materials, such as fresh green manure, are rapidly decomposed by soil microorganisms [9]. The binding substances generated during this decomposition promote the formation of aggregates, particularly in the 100–200 μm microaggregate fraction [10]. Meanwhile, the remaining organic components are stored in soil as recalcitrant organic carbon, thereby increasing the soil’s organic carbon content [11]. Microaggregates larger than 0.05 mm have advantages in adsorbing humic acid due to their larger contact area with the external environment, promoting mineralization reactions between microorganisms and humic acid [12]. Humic acid’s moderate binding characteristics enable it to form good aggregate structures with soil particles or sand particles. The proportion of humic acid to fulvic acid can effectively evaluate the quality of soil humus, serving as an important indicator for maintaining or improving soil fertility, and it is an essential component of soil nutrients [13]. Organic materials with moderate C/N ratios decompose slowly in soil, generating particulate organic matter fractions such as fPOM and oPOM, which serve as synthetic precursors for humus formation [14]. Humic acid in humus is usually considered inert matter in soil and mainly participates in the soil organic carbon cycle [15], serving as a carbon source. During the formation of humus, mineralization of organic nitrogen and denitrification of nitrate nitrogen may lead to the production of gases such as ammonia, nitrogen, and nitrogen dioxide, affecting the process of nitrogen fixation in soil [16]. Therefore, selecting organic materials rationally is crucial to promote humus formation while controlling nitrogen volatilization reactions. The composition of soil humus is significantly influenced by natural conditions and human management activities, and studying these changes helps understand the effects of different nitrogen application rates on soil carbon cycling [17].
Q. Wang et al. [18] found that long-term excessive application of chemical fertilizers can lead to a decrease in organic carbon and humus content, exacerbating soil acidification. The combined application of chemical and organic fertilizers not only contributes to the accumulation of organic carbon and humus but also promotes the humification process of soil, improving the soil microecological environment. Some studies have explored the effects of returning organic materials to soil on the form and content of soil humus [19], but these effects are greatly influenced by soil type, climate conditions, and the amount of exogenous organic material input [20]. In addition, different plant root exudates and residues have varying degrees of impact on soil microbial community metabolic activities and humus forms [17]. Soil enzyme activity often represents the intensity of soil microbial activity. Adopting organic cultivation measures and moderate nitrogen fertilization can promote soil microbial activity and increase the activity of various soil enzymes [21]. Among them, leucine aminopeptidase is closely related to soil nitrogen cycling [22], and soil sucrase catalyzes the hydrolysis of sucrose in soil into monosaccharides more conducive to rhizosphere absorption [23]. By measuring the changes in the activity of these specific enzymes, the transformation rate of relevant products in the soil and the rate of nutrient synthesis can be indirectly inferred.
Previous studies have shown limited exploration into the effects of different nitrogen fertilization levels on soil carbon and nitrogen pools under organic cultivation. This study focuses on organic cultivation and nitrogen application levels, systematically analyzing their effects on soil physical and chemical properties by investigating soil carbon storage, nitrogen supply capacity, humus composition, and enzyme activity indices. The findings aim to provide theoretical support for integrating nitrogen reduction with organic cultivation in agricultural production.

2. Materials and Methods

2.1. Study Area and Experimental Materials

The experimental field was located within the Ma Peng Wan Ecological Agriculture Co., Ltd. in Gaoyou City, Yangzhou, Jiangsu Province, China, from 2021 to 2022 (longitude 119°25′, latitude 32°47′), situated in the northern subtropical monsoon humid climate zone of China. The average annual temperature is approximately 16.2 °C, with an annual precipitation of about 1341.5 mm and an annual sunshine duration of around 2100 h. The frost-free period lasts approximately 221 days. The company is located in Tayuan Village, Mapeng Town, Gaoyou City, covering an area of 135 ha. In 2011, the China Organic Food Certification Center (COFCC) granted it the organic food conversion certification and it is a modern ecological organic farm specializing in the cultivation of organic rice. The experimental field has been dedicated to organic cultivation research since 2012, with stable soil properties characterized by clay loam texture. All the plots involved in the organic cultivation in this experiment were those that had adopted organic cultivation for 10 years, and the designed fertilizer treatments were consistent in 2021 and 2022. The soil sample collected in June 2022 contained 27.93 g·kg−1 organic matter, 112.24 mg·kg−1 alkali-hydrolyzable nitrogen, 7.36 mg·kg−1 available phosphorus, 61.08 mg·kg−1 available potassium, and 1.31 g·kg−1 total nitrogen. The pH of the sample was 8.13.
This experiment utilized high-yield rice varieties commonly grown in the middle and lower reaches of the Yangtze River, namely Nanjing 46 (Nanjing46, Japonica), with a full growth period of 165 days, and Huai Fragrant Jing 15 (Huaixiangjing15, Japonica), with a full growth period of 150 days.

2.2. Tillage Practices

The experimental plots were designed using a split-plot design, with cultivation methods (conventional cultivation, organic cultivation) as the main plots and nitrogen input levels during the rice season (N12: 180 kg/hm2, N18: 270 kg/hm2) as the subplots, with an area of 49 m2 (7 m × 7 m) each, replicated three times. Purple clouds were planted as the previous crop, and the test rice was sown on 18 May 2022, with manual transplanting on June 9, using a spacing of 0.3 m × 0.125 m, with 3 seedlings per hill. The main plots of planting methods were distributed in adjacent fields with similar fertility, separated by ridges, and isolated between subplots with small ridges, covered with plastic film to ensure separate irrigation and drainage for each subplot.
Conventional cultivation (CF) followed local practices for high-yield cultivation management in Gaoyou, with 45% compound fertilizer (containing 15% nitrogen) applied as base fertilizer one day before rice transplanting. Urea was applied as topdressing fertilizer in three installments: first tillering, second tillering, and heading. Management measures for disease, pests, and weeds were implemented according to conventional cultivation requirements. Organic cultivation (OF) was managed according to the national standards for organic product production (GB/T 19630-2019 [24]), adopting the milk vetch-rice planting pattern. Milk vetch (containing 0.33% nitrogen) were plowed and applied as base fertilizer two weeks before rice transplanting. Rapeseed cake (containing 4.60% nitrogen) and bio-organic fertilizer (containing 4.00% nitrogen) were applied as base fertilizer one day before rice transplanting, with bio-organic fertilizer applied as topdressing fertilizer in mid-July as heading fertilizer. N18 equivalent to pure nitrogen 270 kg·hm−2 (conventional nitrogen application by local farmers) and N12 equivalent to pure nitrogen 180 kg·hm−2 (nitrogen reduction treatment in the experiment) were applied. Specific fertilization strategies are shown in Table 1. Organic rice production throughout the process complies with organic rice production management regulations, with disease and pest control exclusively using certified organic pesticides, and manual weeding in the plots.
After two years of the above-mentioned cultivation and fertilization management positioning, this study focuses on the analysis of soil samples in 2022.

2.3. Soil Sample Collection

Soil samples were collected using a soil sampler at the tillering stage, heading stage, and maturity stage of rice growth, following a five-point sampling method. Soil samples were taken from depths of 0–10 cm (surface layer) and 10–20 cm (subsurface layer) in each plot. After uniformly mixing the soil samples from each plot, plant roots and stones were removed, and a portion of the samples was stored in sealed bags and placed in a −70 °C freezer as fresh samples for subsequent determination of soil active carbon and nitrogen. The remaining soil samples were air-dried completely and sieved through a 254 microns sieve for further analysis. Additionally, at the maturity stage, soil aggregates were collected in the field using a shovel (with the premise of not disturbing the original soil structure) for aggregate determination.

2.4. Measurements

2.4.1. Determination of Soil Nutrient Content

Soil total nitrogen was determined using the semi-micro Kjeldahl method, soil organic matter was determined using the potassium dichromate heating external heating method [25], and soil alkali-hydrolyzable nitrogen was determined using the alkali diffusion method [25].

2.4.2. Determination of Soil Enzyme Activity

For fresh soil samples (moist soil samples stored in a refrigerator at 4 °C) at the maturity stage of rice, soil sucrase, soil cellulase, and soil leucine aminopeptidase activities were determined separately. Soil sucrase activity was determined using the 3,5-dinitrosalicylic acid colorimetric method [26], with enzyme activity expressed as the amount of glucose produced per gram of soil after 1 day; soil cellulase activity was determined using the anthrone colorimetric method [27], with enzyme activity expressed as the amount of glucose produced per gram of soil after 1 day; soil leucine aminopeptidase activity was determined using the p-nitroaniline colorimetric method [28], with enzyme activity expressed as the amount of p-nitroaniline produced per gram of soil after 1 day.

2.4.3. Determination of Soil Active Carbon and Nitrogen Indices

For air-dried soil samples at the tillering stage, heading stage, and maturity stage of rice, soil organic carbon was determined using the low-temperature external heating potassium dichromate oxidation-colorimetric method [29]. The TOC-L CPH total organic carbon analyzer was used to determine soil total carbon, inorganic carbon, and soluble organic carbon in air-dried soil samples at the tillering stage, heading stage, and maturity stage of rice [30]. Ammonium nitrogen and nitrate nitrogen were determined using a continuous flow analyzer (Proxima) after extraction with 1 mol·L−1 KCl solution from air-dried soil samples at the tillering stage, heading stage, and maturity stage of rice. Acid hydrolysis method was used to determine acid hydrolyzable organic carbon according to the method of Rovira and Vallejo [31].

2.4.4. Determination of Soil Aggregates

The wet sieving method [32] was used to determine water-stable aggregates. Samples were taken at the maturity stage, and fresh soil was retrieved from the field using a shovel (with the premise of not disturbing the original soil structure). Soil samples were split along the soil sample gaps, removing residual broken stems, roots, stones, and other impurities. The samples were turned every 3–4 h, and the soil samples were continuously split along the gaps until the soil samples could be directly crushed by hand rather than flattened when pinched. The soil samples were processed in this manner and air-dried to a moisture content slightly below 10% for analysis. Initially, 10 g of soil sample was dried to a constant weight to calculate the moisture content. Subsequently, 50 g of soil sample was placed in a vibrating mechanical sieve shaker, subjected to vertical oscillation with an amplitude of 3 cm and a duration of 30 min for wet sieving. The soil samples separated in five sieves (2 mm, 1 mm, 500 μm, 250 μm, 106 μm) were transferred and dried at 50 °C. The proportion of aggregates of different particle sizes in the soil was calculated based on the moisture content and the dry weight of the soil samples in different sieves.

2.4.5. Determination of Soil Humus Content

Soil humus content was determined using the modified humus composition method [33] on air-dried soil samples collected at the maturity stage of rice. The humus-containing soil samples were dissolved using a mixed alkaline solution (0.1 mol L−1 NaOH and 0.1 mol L−1 Na2P2O7), followed by acidification to separate distinct humic fractions (humic acid, fulvic acid, and humin). The carbon content of each fraction was subsequently quantified via the potassium dichromate volumetric method.

2.5. Data Analysis Methods

Data were collated and analyzed using Microsoft Excel 2019 and SPSS 27.0 software. Graphs were plotted with Origin 2022, and the Genescloud platform (https://www.genescloud.cn, accessed on 28 February 2023) was used for correlation analysis of soil indicators and drawing principal component analysis plots. Data mainly used One-way ANOVA to test the significance of differences in data among different treatments (combinations of cultivation methods and nitrogen levels). In the analysis of variance, F-values and p-values were calculated to determine whether the cultivation mode, nitrogen level, and their interaction had significant effects on each soil indicator. If p < 0.05, the difference was considered statistically significant. Further, the LSD (Least Significant Difference) method was used for multiple comparisons to determine the specific differences among different treatments. A general linear model was adopted, with “cultivation method” and “nitrogen application amount” as fixed factors, to analyze their effects on soil nutrient content indexes, soil active carbon and nitrogen indexes, soil aggregates, humus, and enzyme activities. For soil samples in the mature stage, the Pearson algorithm was used to analyze the correlation among 15 physicochemical indicators including total nitrogen (TN), alkali-hydrolyzable nitrogen (AHN), ammonium nitrogen (NH4+-N), nitrate nitrogen (NO3-N), total phosphorus (TP), available phosphorus (AP), soil organic matter (OM), pH, total carbon (TC), soil organic carbon (SOC), dissolved organic carbon (DOC), acid extractable organic carbon (AOC), sucrase (SUC), leucine aminopeptidase (LAP), and cellulase (CEL). These data all follow a normal distribution. Principal component analysis was conducted on the 21 physicochemical indicators including TN, AHN, NH4+-N, NO3-N, TP, AP, OM, pH, TC, SOC, DOC, AOC, SUC, LAP, CEL, fulvic acid (FA), humic acid (HA), humin (HM), proportion of different aggregate sizes (>2 mm, 0.25–2 mm, <0.25 mm).

3. Results

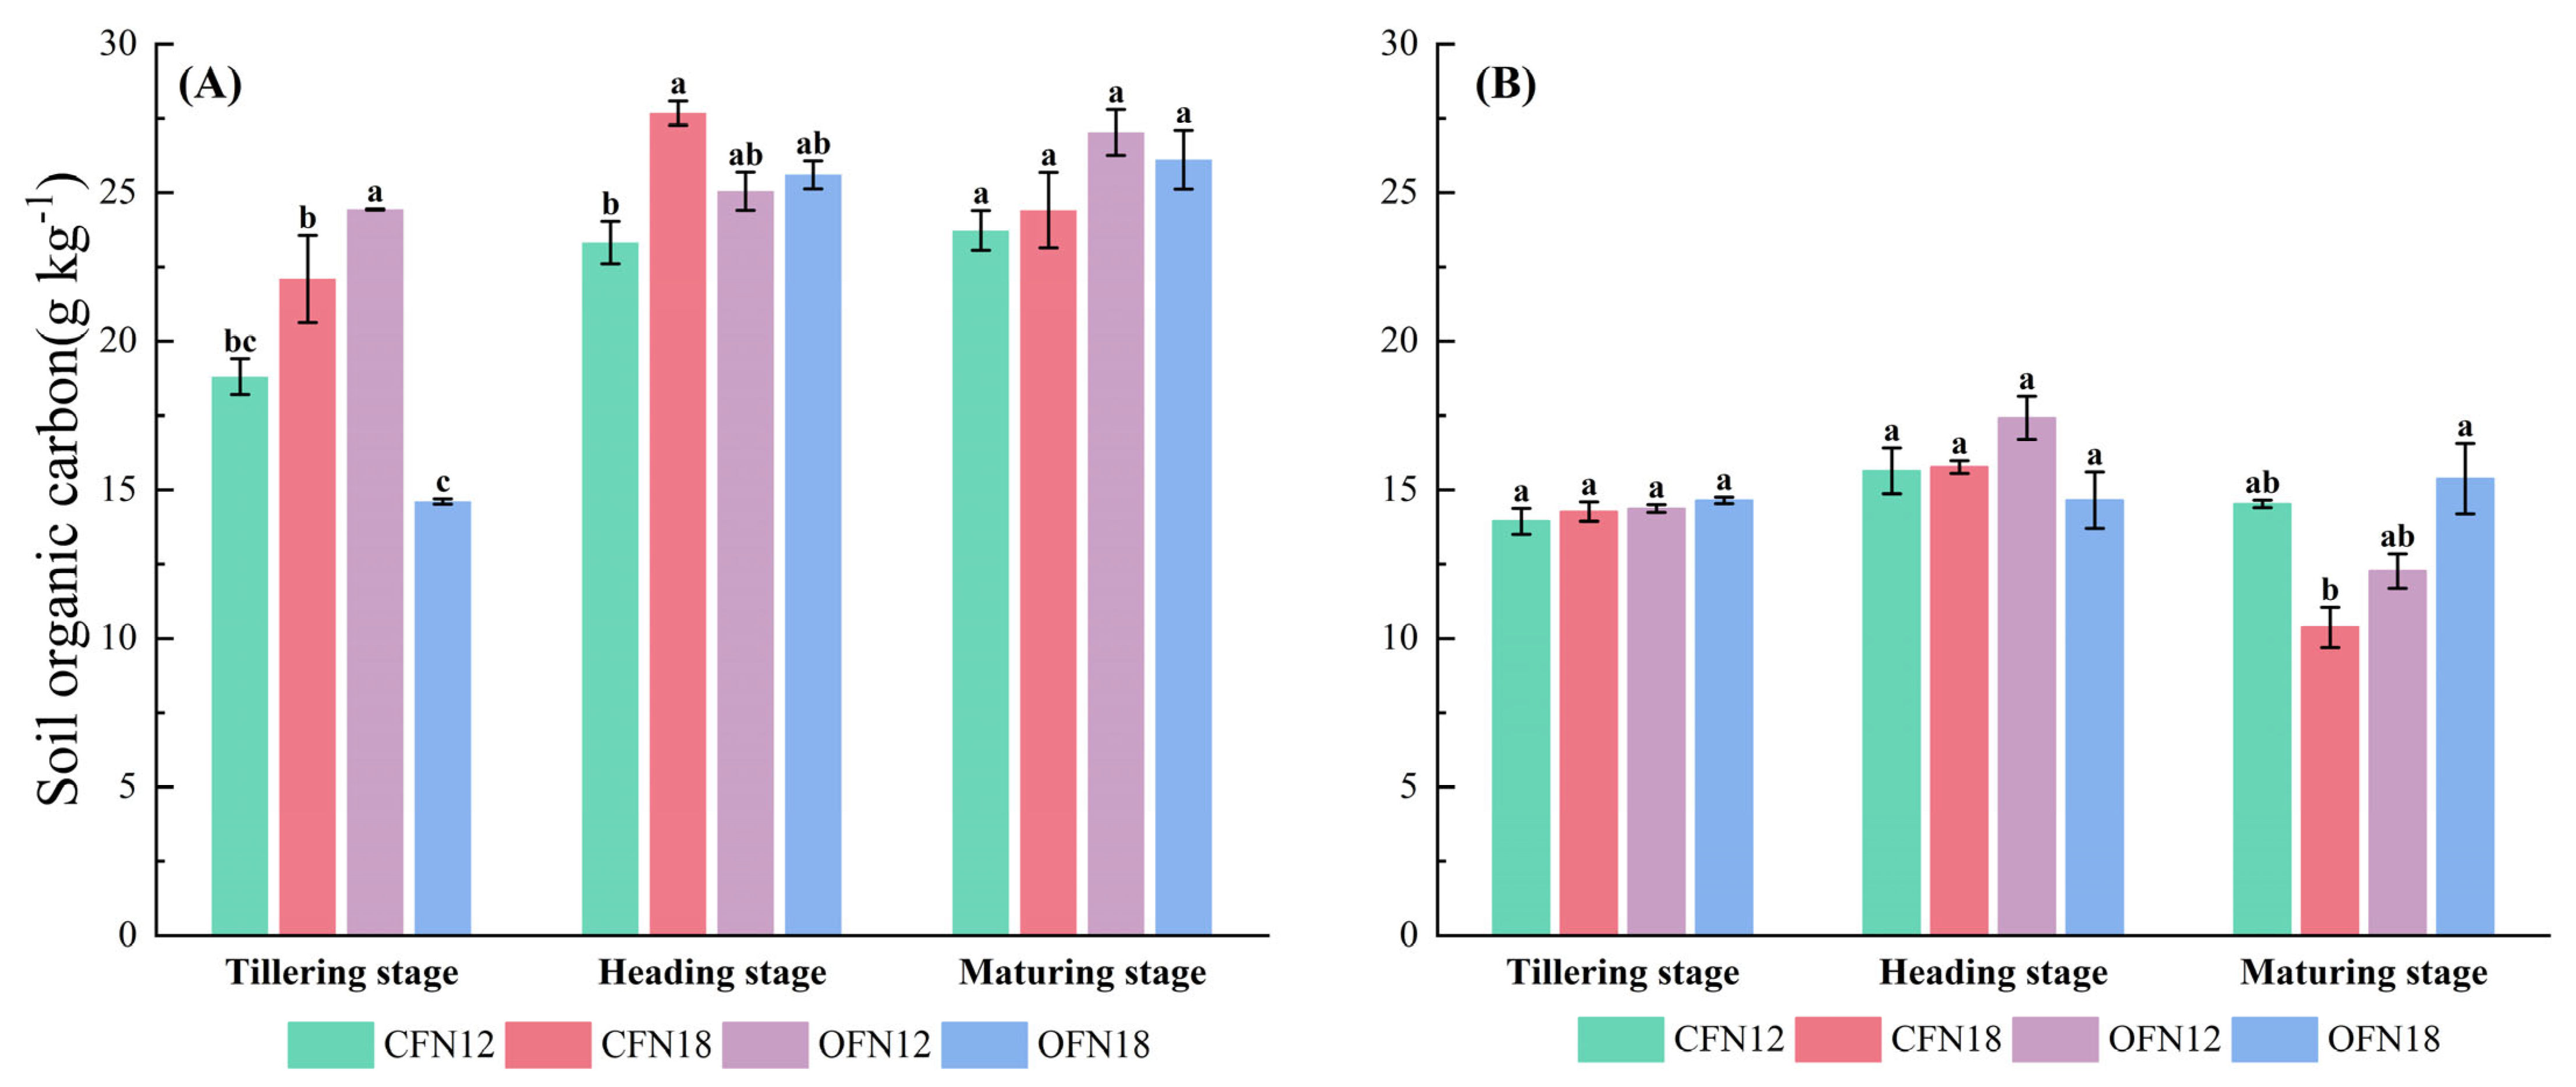
3.1. Soil Organic Carbon

The organic carbon content of soil surface and subsurface under different planting systems and nitrogen levels at three sampling stages is shown in Figure 1. During the tillering and heading stages, the organic carbon content in the soil surface is significantly higher under certain cultivation methods and nitrogen levels, with CFN18 and OFN12 exhibiting the highest organic carbon content. In the subsurface, there is no significant pattern, and differences between treatments are minimal. During the tillering stage, the organic carbon content in the soil surface is significantly higher in OFN12 compared to CFN12, and in CFN18 compared to OFN18; however, these differences diminish during the heading stage, with increases of 7.42% and 8.12%, respectively. During the maturity stage, the organic carbon content in the soil surface is significantly higher in the OFN12 treatment compared to other treatments.

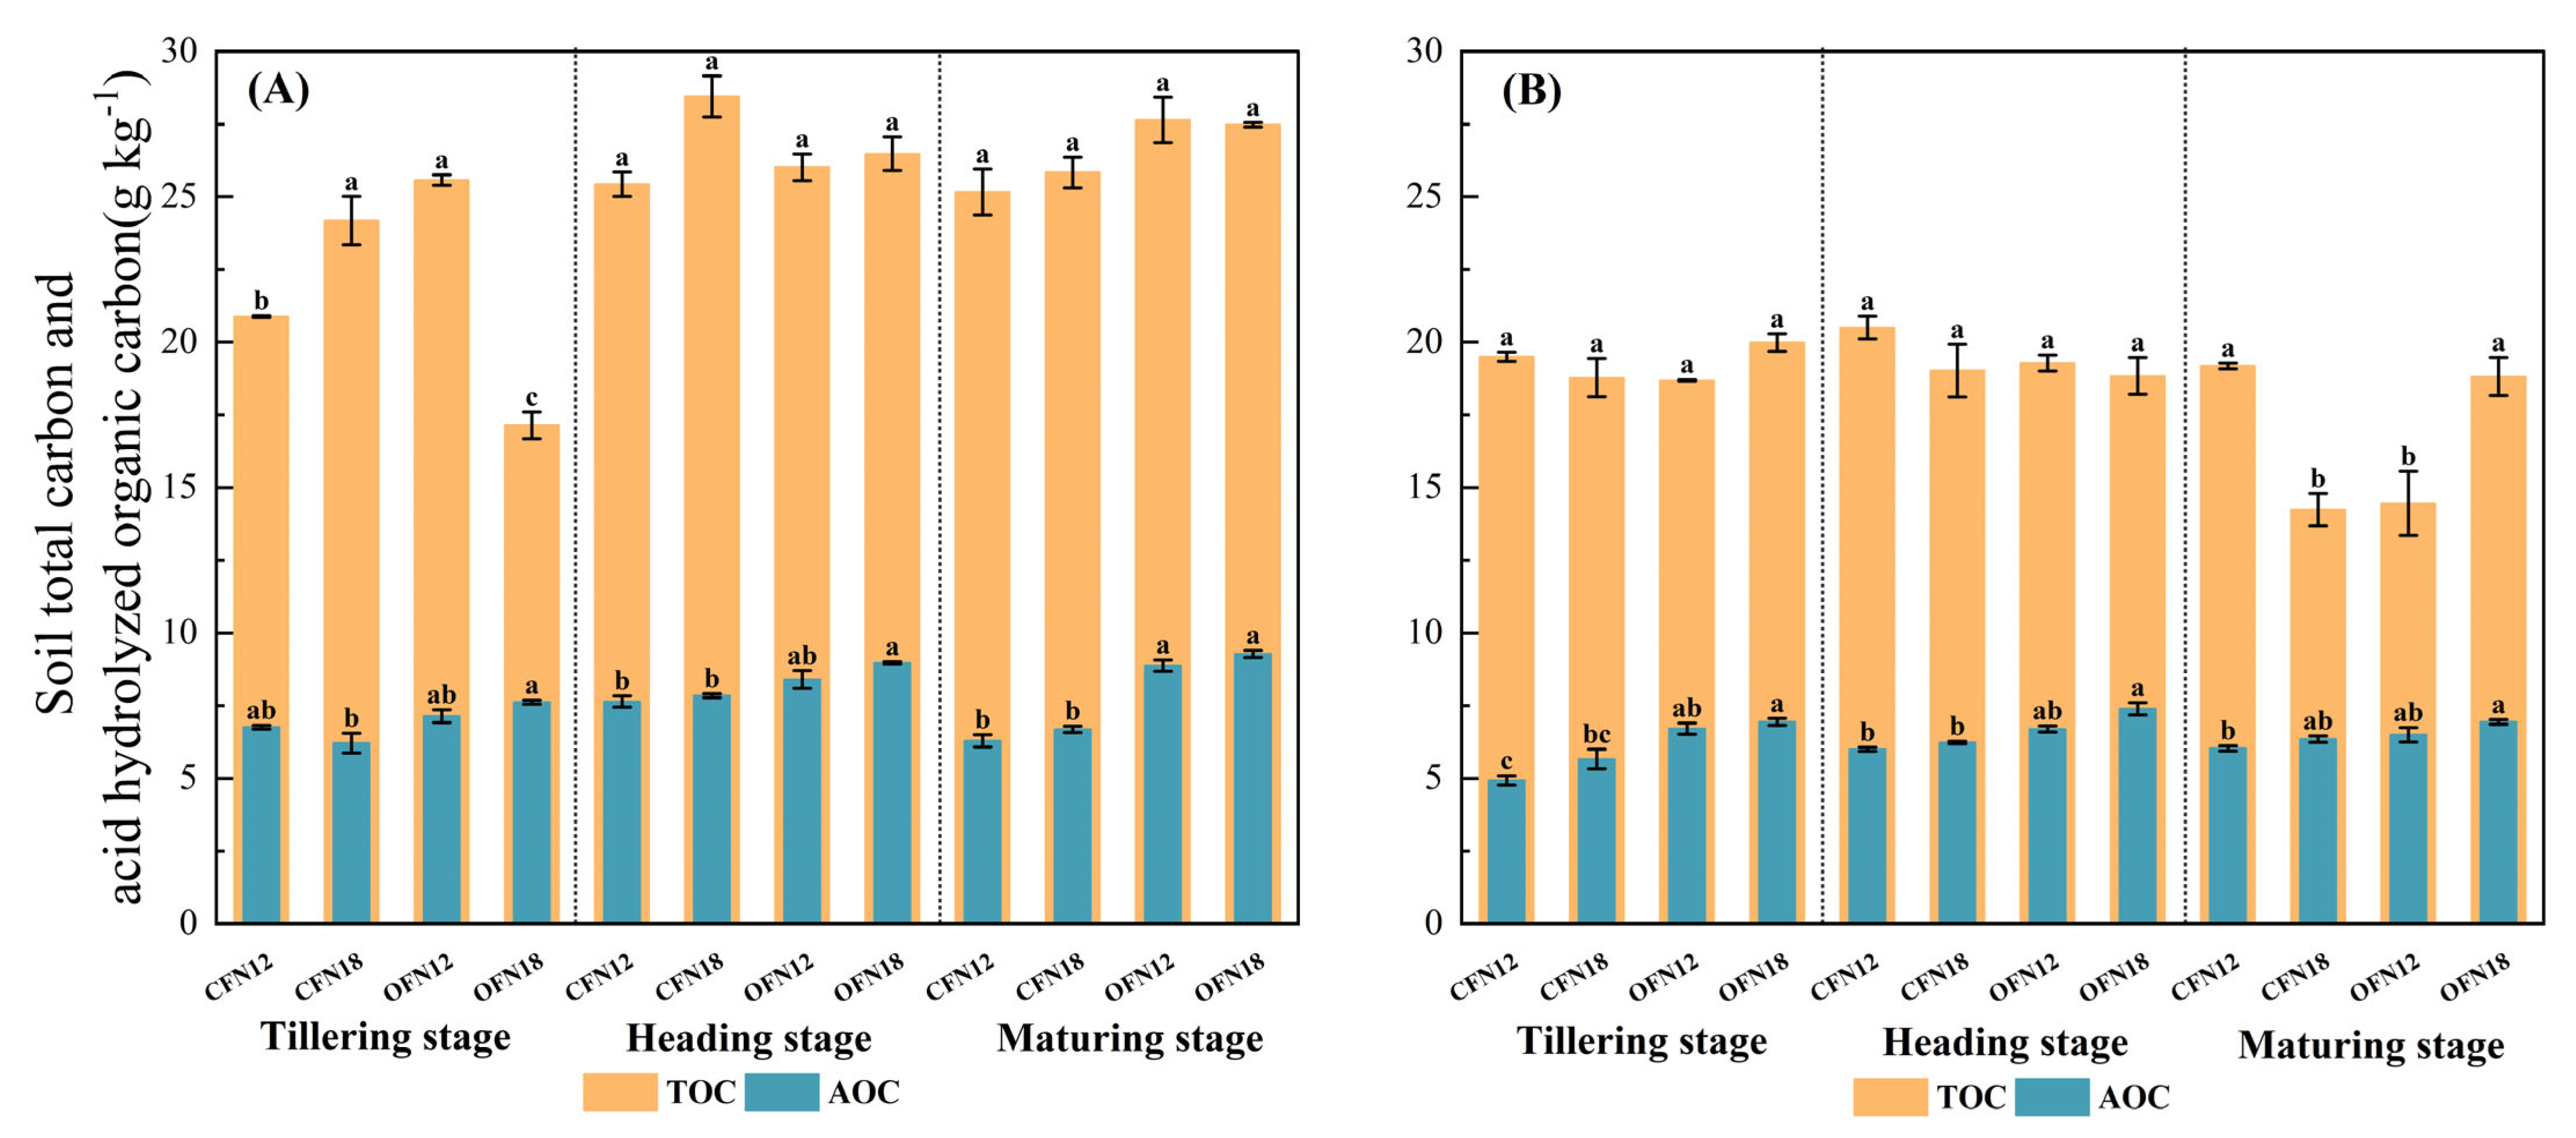
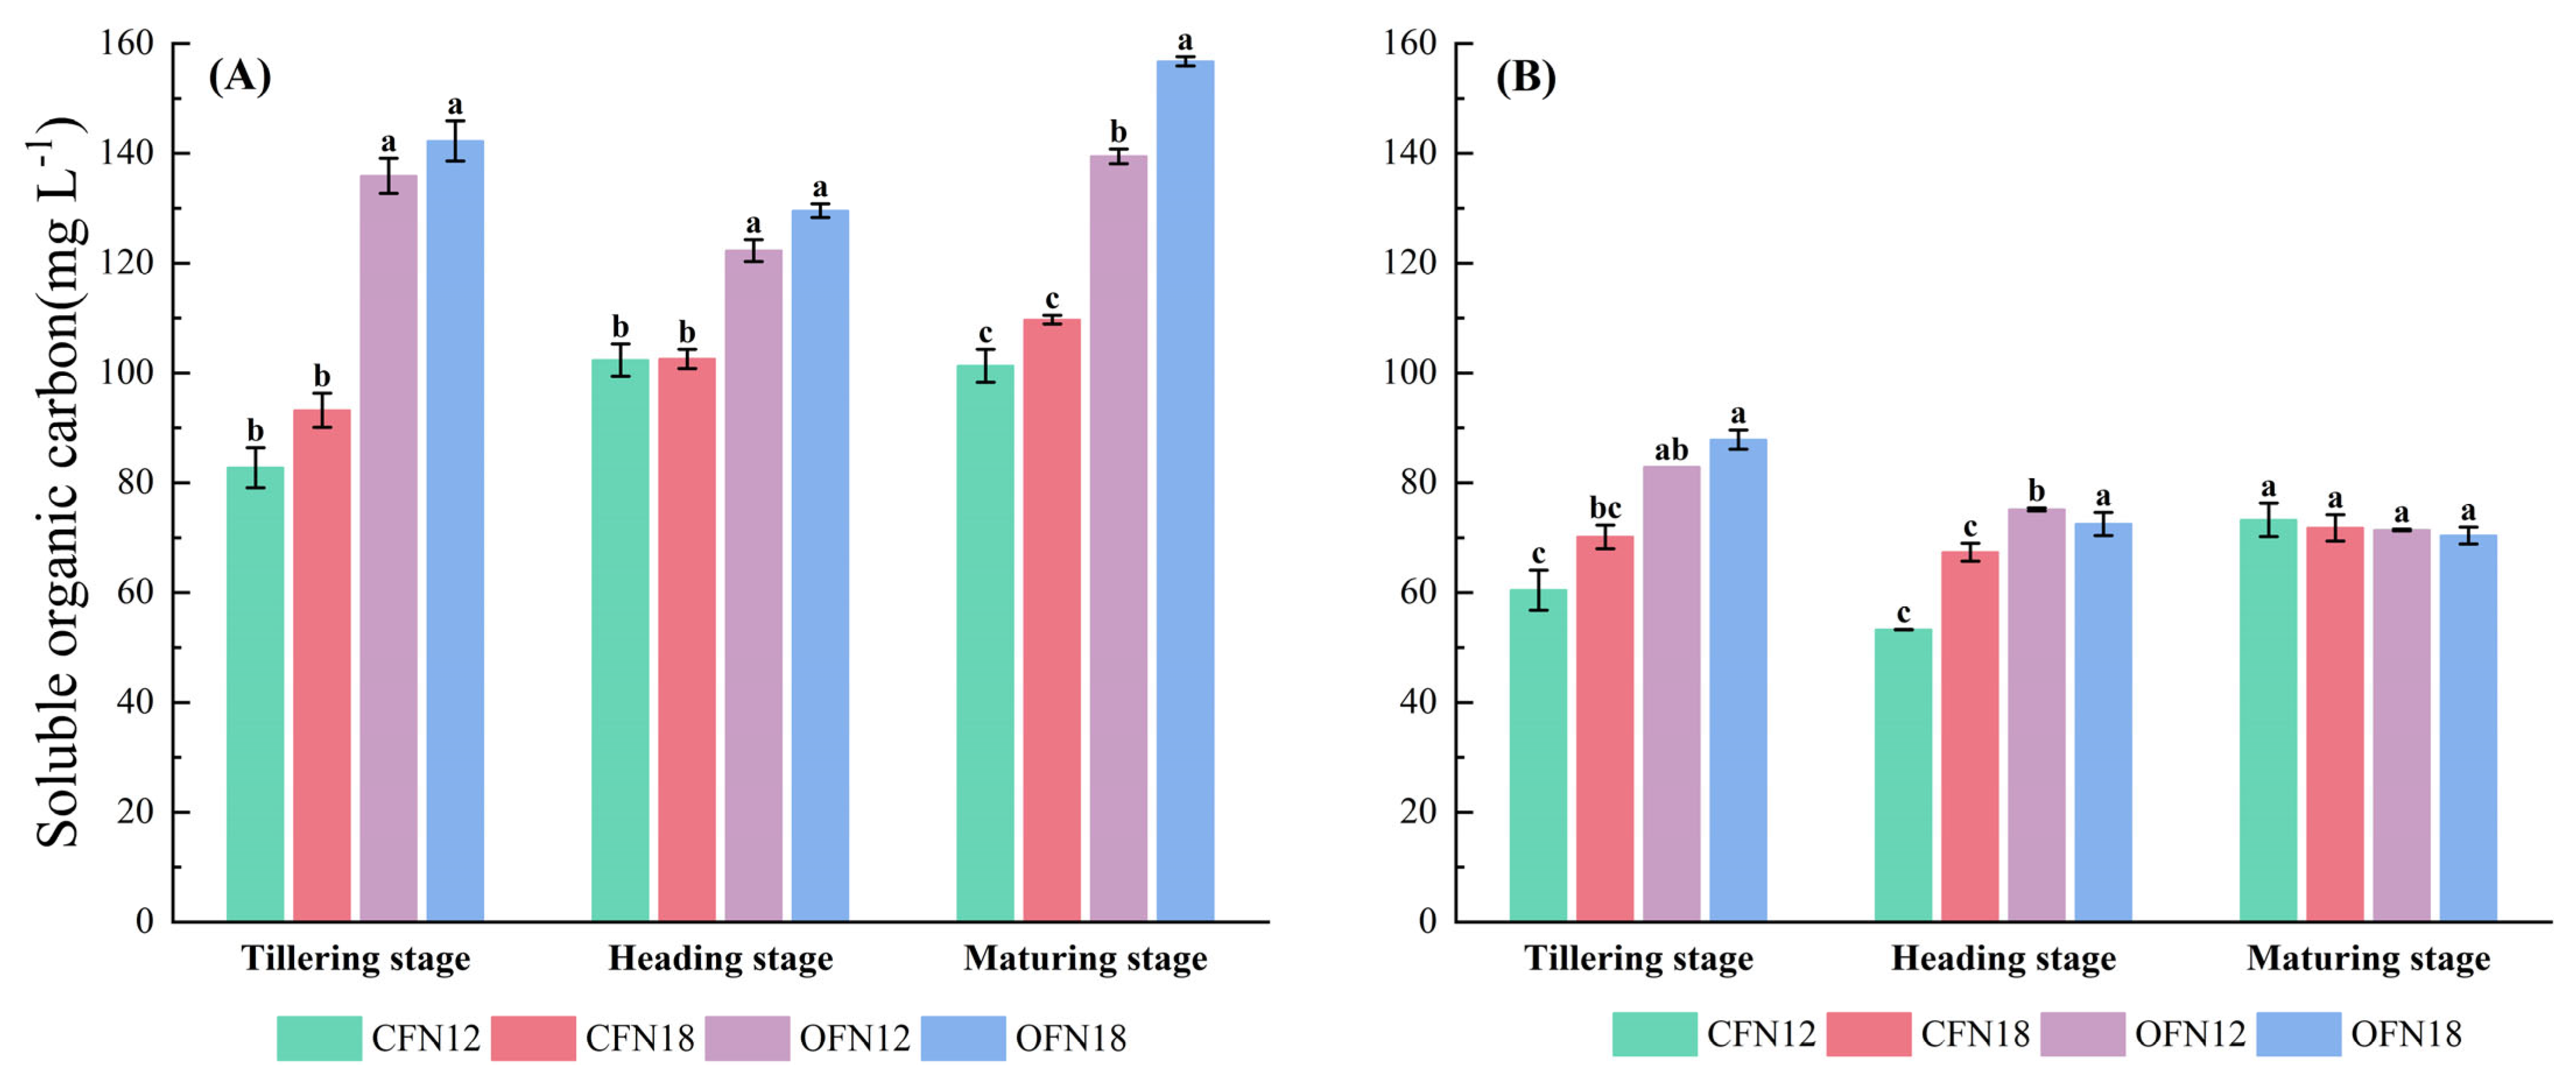
3.2. Soil Carbon Pool

The content and variance analysis of soil total carbon components under two nitrogen levels in organic and conventional cultivation at three sampling periods are presented in Figure 2 and Figure 3. During the tillering stage, the total carbon content in the CFN18 treatment is 41.07% higher than that in the OFN18 treatment, and 22.51% higher in the OFN12 treatment compared to the CFN12 treatment, with both differences being significant. In the surface soil during the maturity stage, total carbon is influenced by cultivation methods, with OFN > CF, and differences between treatments are not significant. In the subsurface soil during the maturity stage, total carbon is significantly influenced by the interaction between cultivation methods and nitrogen levels, showing a pattern opposite to that of the surface soil during the tillering stage, with higher total carbon content observed in the CFN12 and OFN18 treatments compared to other treatments.
The organic carbon components in the surface soil were higher than that in the subsurface (Figure 2). The content of acid hydrolysis organic carbon in the surface soil gradually increased after the tillering stage; after the heading stage, there was still a slight increase in the OF treatment, while a decrease was observed in the CF treatment. At the maturity stage, under the same nitrogen level, there was no significant difference in acid hydrolyzable organic carbon content among different cultivation methods. Across all three periods, the content of acid hydrolysis organic carbon in both soil layers was significantly influenced by cultivation methods, showing OF > CF, with significant differences. During the maturity stage, the difference in acid hydrolysis organic carbon content in the surface soil under different cultivation methods was the greatest. Under N18, the OF treatment increased the content of acid hydrolysis organic carbon by 41.02% compared to CF, and under N12, this increase was also 38.71%.
In the OF treatment during the maturity stage, the difference in soluble organic carbon content between different soil layers was the greatest (Figure 3). The pattern of soil soluble organic carbon was highly consistent across all three periods, with OF > CF observed except in the subsurface during the maturity stage. Taking the surface soil during the maturity stage as an example, under N12, the OF treatment increased the soluble organic carbon content by 37.22% compared to the CF treatment; under N18, this increase was 42.89%, both significant. Additionally, in the surface soil under the OF treatment, the soluble organic carbon content was higher under N18 than N12, with a difference of 12.41% during the maturity stage, which was significant.

3.3. Soil Nitrogen Pool
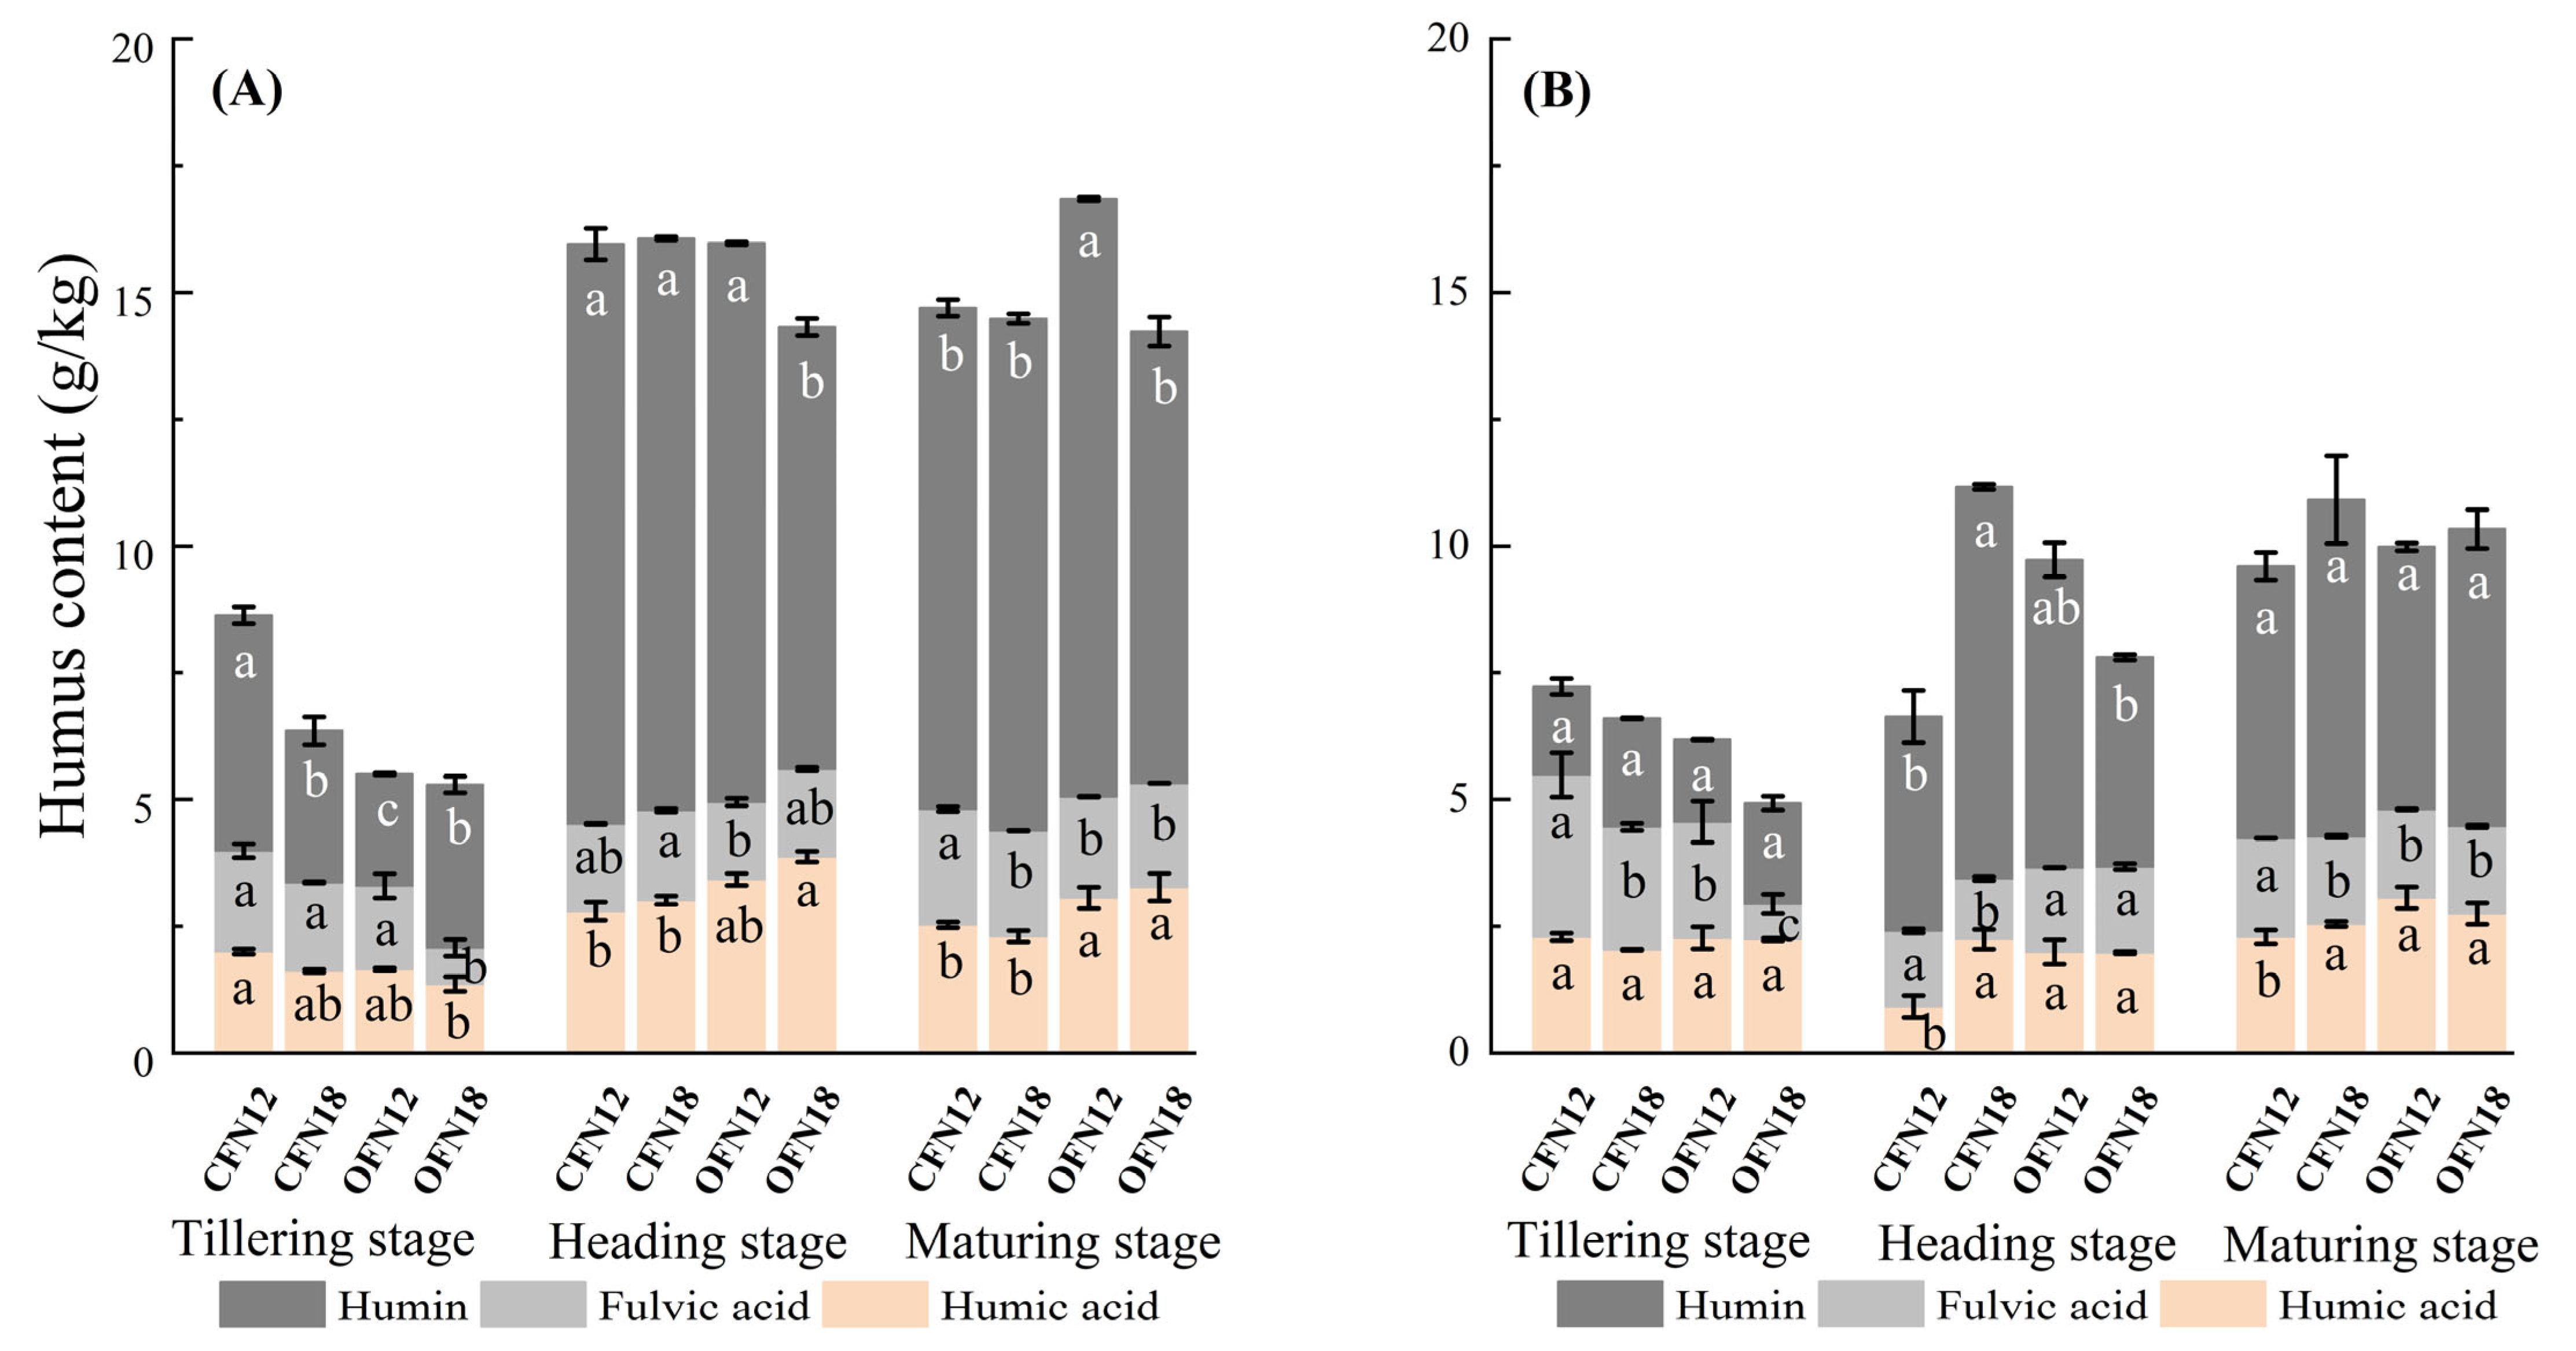
As shown in Table 2, total nitrogen content in the soil surface is significantly higher than in the subsurface during all three periods. Under the same nitrogen level, surface and subsurface total nitrogen are influenced by cultivation methods. The tillering stage shows OF > CF; the pattern reverses after tillering. After tillering, total nitrogen in different layers is influenced by nitrogen levels. After tillering, under the same cultivation method, N12 treatment increases total nitrogen in the surface soil. For example, at the heading stage, OFN18 total nitrogen is 14.22% higher than OFN12 in the surface soil; conversely, OFN12 in subsurface soil is 23.33% higher than OFN18.
Overall, alkali-hydrolyzable nitrogen content in the soil surface is much higher than in the subsurface. Its content is influenced by various factors during different periods. At the tillering stage, surface alkali-hydrolyzable nitrogen is influenced by nitrogen levels (N12 > N18). Under CF and OF, the N12 treatment has 11.69% and 34.88% higher content than the N18 treatment in surface soil, respectively, with significant difference under OF. There are no significant differences in the subsurface. At the heading stage, there are no significant differences in the surface; the subsurface shows N12 > N18.
Soil ammonium nitrogen is significantly influenced by cultivation methods, nitrogen levels, and their interaction (Table 3). Surface soil and N12 treatment in the subsurface show a trend of initially decreasing then increasing ammonium nitrogen content, especially at the tillering stage. Differences between soil layers occur only at the tillering stage. At the maturity stage, due to interaction, the CFN12 and OFN18 treatments have higher ammonium nitrogen content. In subsurface soil, compared to the CFN18 treatment, CFN12 shows 46.97% increase; compared to the OFN18 treatment, it shows a 55.36% increase.
Compared to surface soil, nitrate nitrogen content in the subsurface shows less fluctuation (Table 3). At the tillering stage, the CFN12 and OFN18 treatments have higher nitrate nitrogen content but lose advantage after tillering. After the heading stage, high nitrogen levels promote nitrate nitrogen. Surface soil shows N18 > N12. During the heading and maturity stages, under conventional and organic cultivation, the N18 treatment has higher nitrate nitrogen content than the N12 treatment.

3.4. Soil Humus

During the tillering stage, the proportion of humic and fulvic acids organic carbon content in soil humus is higher compared to other stages, ranging from 39.25% to 75.87% (Figure 4). After the tillering stage, organic carbon is mainly provided by humin, accounting for 52.93% to 71.65%, which is notably significant in the 0–10 cm soil layer. In the 0–10 cm soil layer during the heading and maturity stages, compared to OFN18, the carbon content of humin in OFN12 is significantly increased by 13.36% and 17.78%, respectively, with significant differences observed. The fulvic acid content shows relatively minor fluctuations overall. The humin content increased significantly during the heading and maturity stages. In contrast, the humic acid content showed a notable increase in surface soil following the tillering stage. During the heading stage, the carbon content of humin in all treatments increased by more than 35%, with the most significant increase observed in the OF treatment. Under conventional nitrogen application, the carbon content of humin acid in the OF treatment during the heading and maturity stages increased by 22.51% and 21.14%, respectively, compared to CF, and under the influence of N12, this increase was even higher, with significant differences observed. Additionally, in the surface soil after the tillering stage, compared to other treatments, OFN18 has a higher proportion of humic and fulvic acids, reaching 39.11% during the heading stage and 37.38% during the maturity stage, indicating a higher conversion rate of organic carbon to humic and fulvic acids in soil humus.

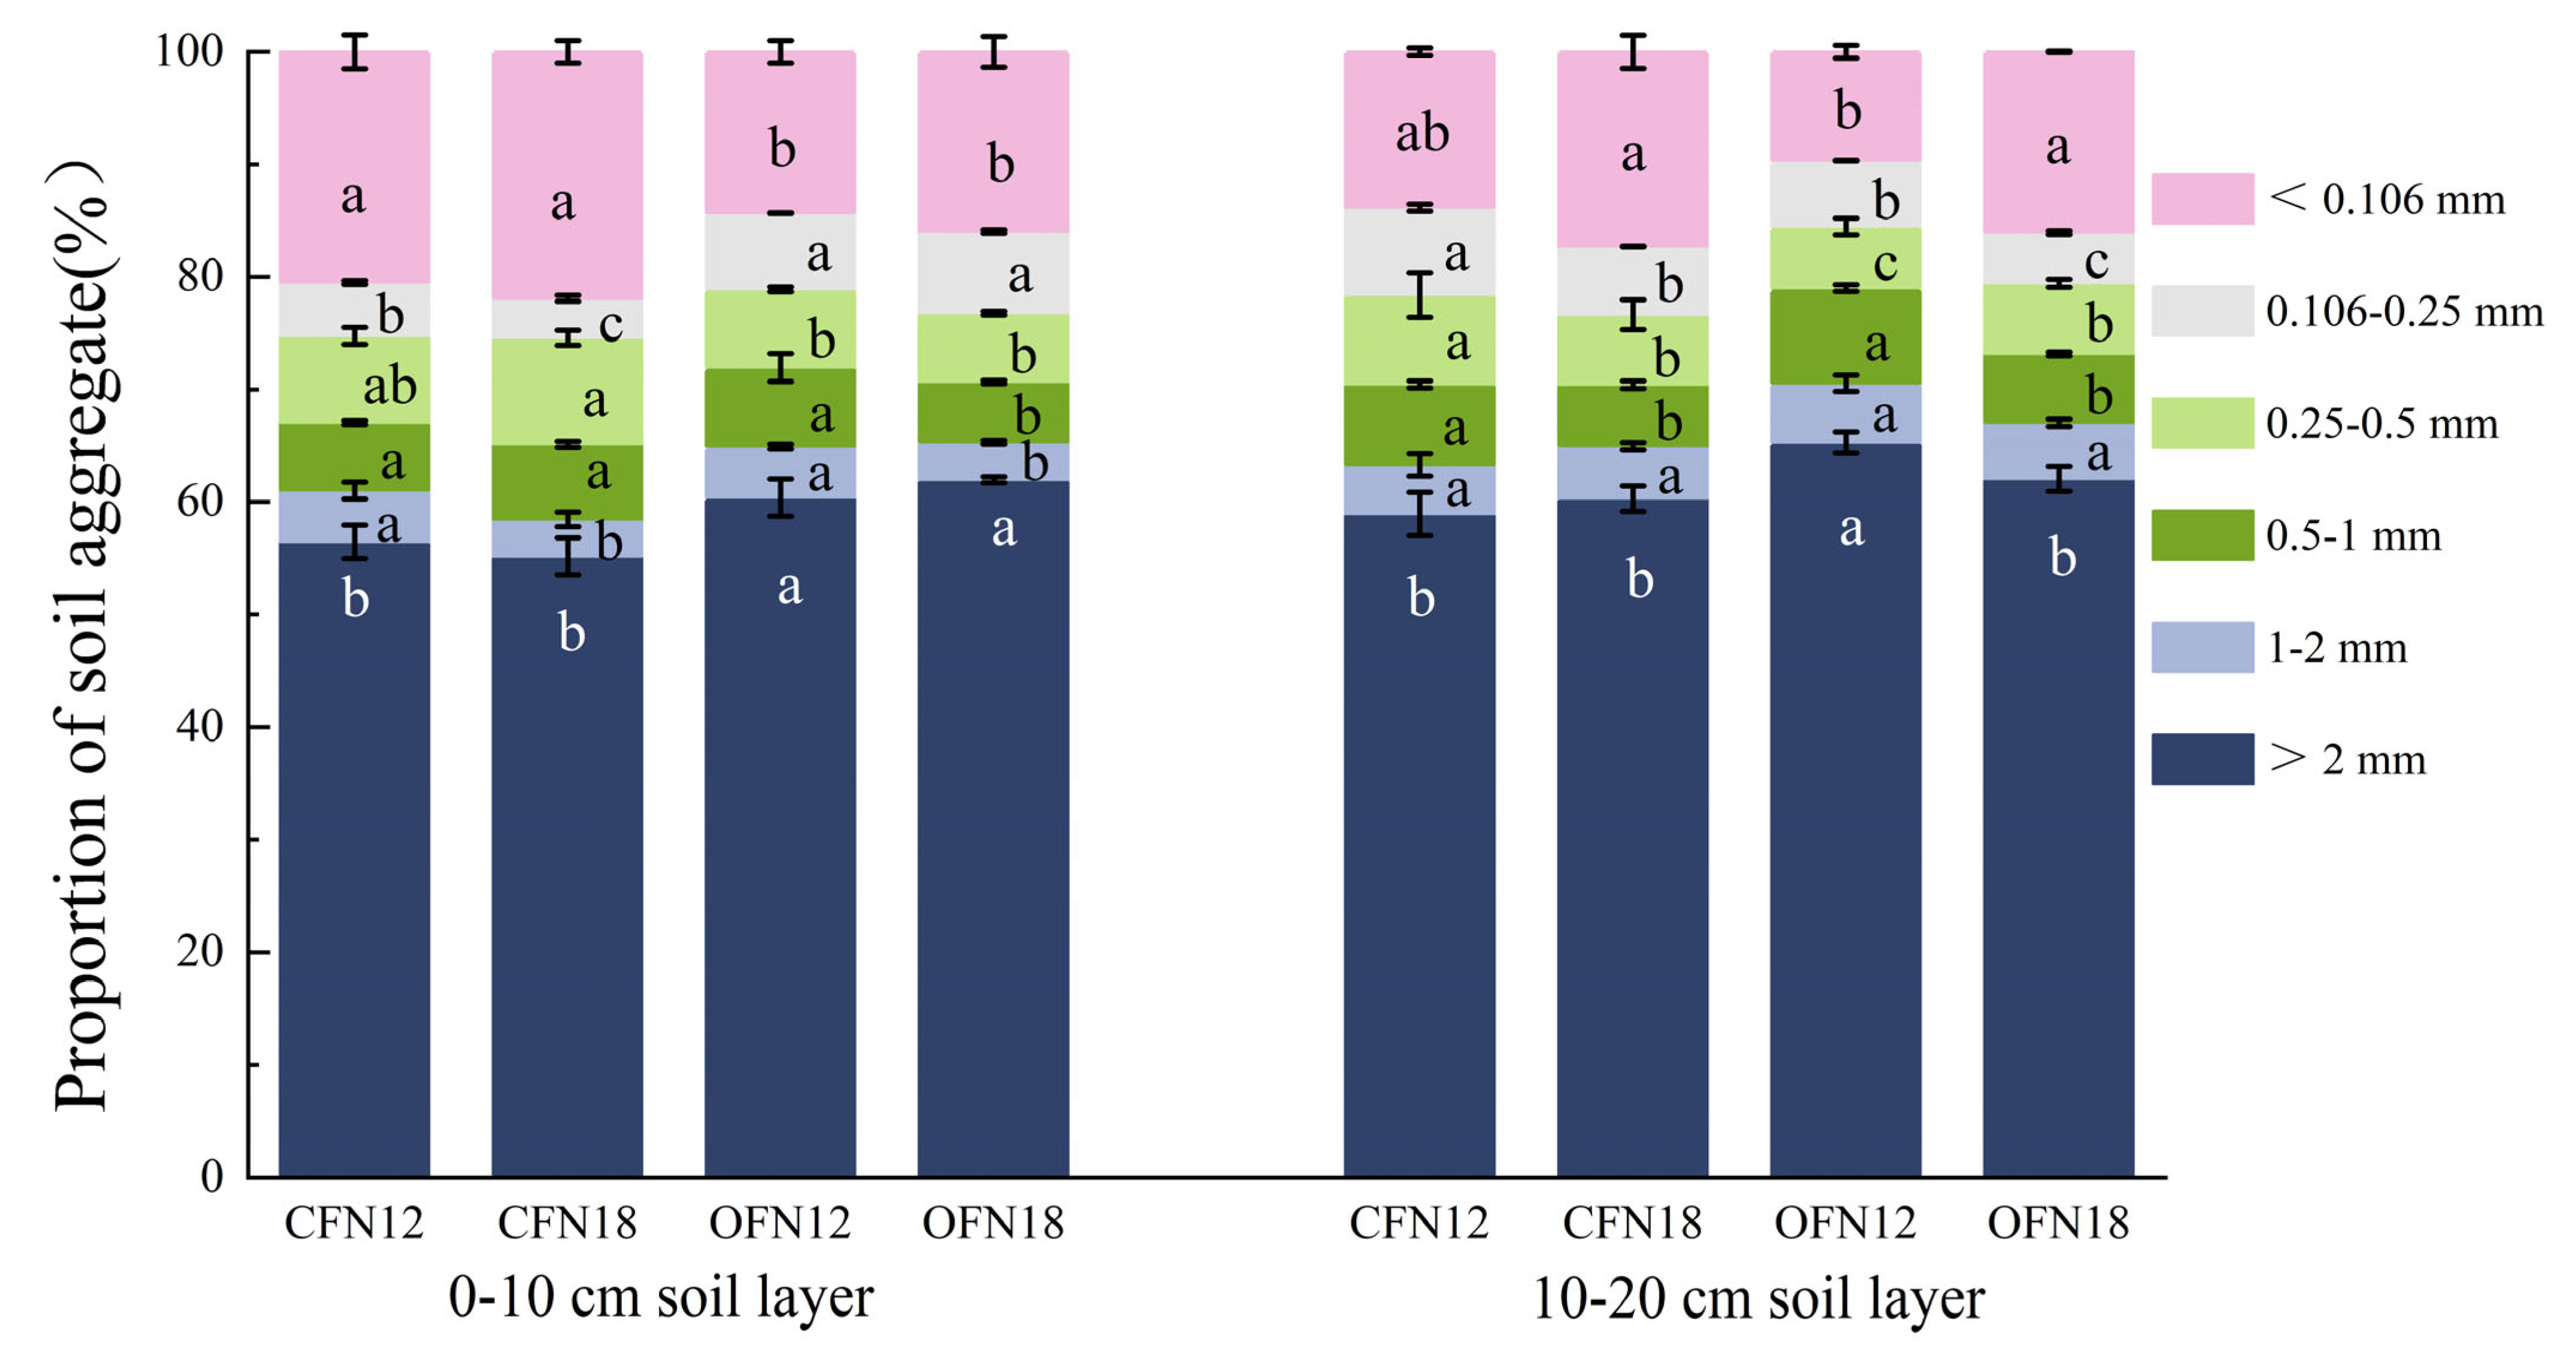
3.5. Soil Aggregates

During the maturity stage, in all treatments, more than half of the soil aggregates are composed of macroaggregates with particle sizes larger than 2 mm, with the remaining majority being microaggregates with particle sizes smaller than 0.106 mm, accounting for 9% to 22% (Figure 5).
In the surface soil under N18, the content of macroaggregates larger than 2 mm in OF is increased by 12.36% compared to CF, which decreases to 6.95% under N12, both showing significant differences. In the surface layer, the proportion of microaggregates with particle sizes between 0.106 and 0.25 mm is higher in OF than in CF; however, in the subsoil layer, the trend is reversed, with CF > OF, and the differences are significant. In the surface layer, the proportion of microaggregates with particle sizes smaller than 0.106 mm is influenced by cultivation methods, showing CF > OF; in the subsoil layer, influenced by nitrogen levels, it is N18 > N12. Among all treatments, OFN12 has the smallest proportion of microaggregates with particle sizes smaller than 0.106 mm.

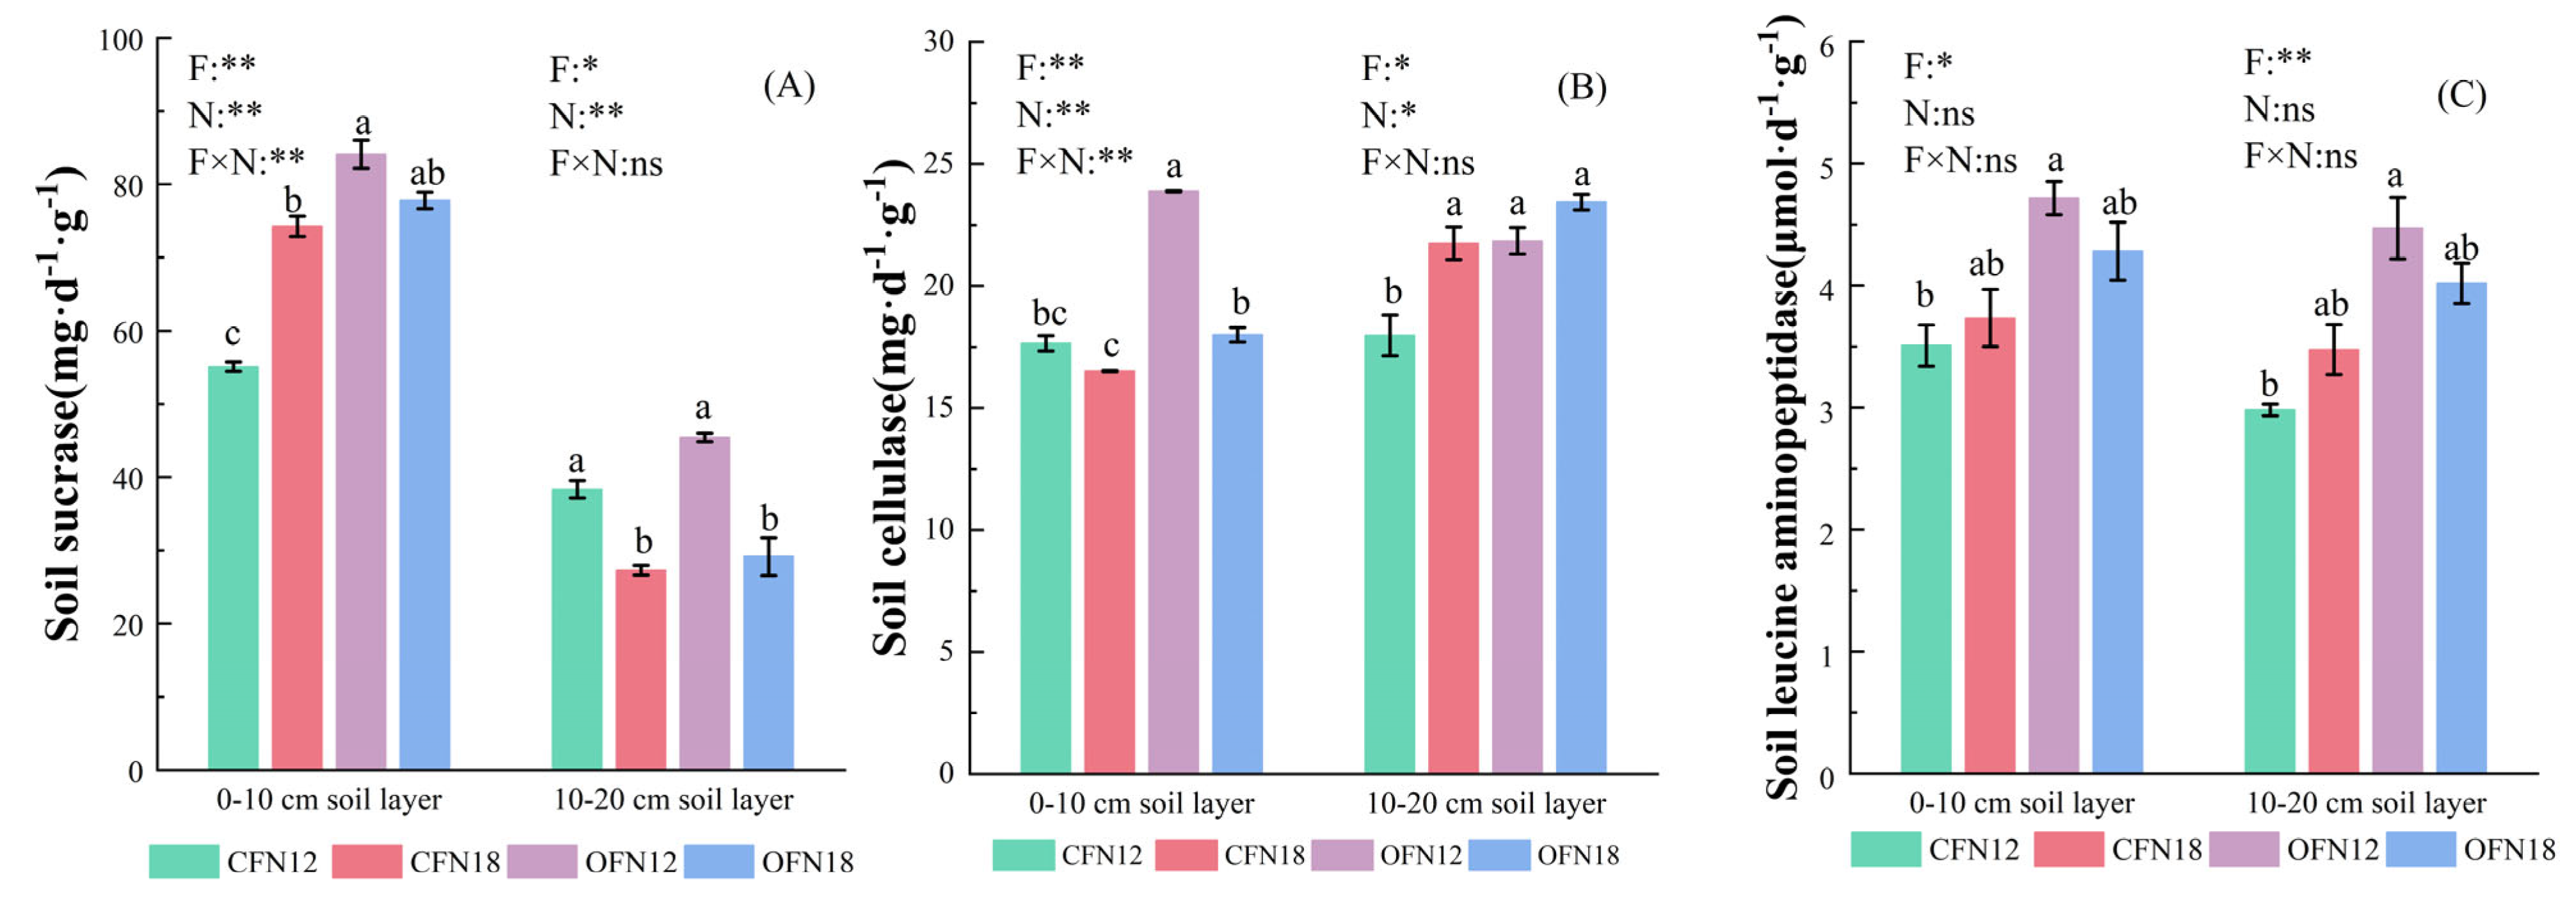
3.6. Soil Enzyme Activity

The effects of different cropping systems and nitrogen levels on three soil enzyme activities in the surface and subsurface soils at maturity are shown in Figure 6. Under N12 levels, sucrase activity under OFN12 is higher than CF. Surface soil sucrase is affected by cultivation method and nitrogen application rate interaction. In subsurface soils, sucrase activity shows N12 > N18. Under CF and OF, N12 treatment has sucrase activity of 40.62% and 55.93% higher than the N18 treatment, respectively. N18 inhibits sucrase in the subsurface. OFN12 is more conducive to soil enzyme-catalyzed reactions.
Except for the OFN12 treatment, the subsurface has higher cellulase activity. In mature surface soils, the OFN12 treatment has the highest cellulase activity, 32.71% higher than the OFN18 treatment. In subsurface soils, cellulase activity is influenced by cultivation method and nitrogen level (OF > CF, N18 > N12). Only the CFN12 treatment has significantly lower activity. OFN12 shows higher activity in both the surface and subsurface.
Under the OF treatment, leucine aminopeptidase activity is significantly higher than CF. Under N12, in the 0–20 cm soil layer, OF treatment enzyme activity is 34.47% and 49.95% higher than CF. Under N18, the increase narrows. Under OF, N12 has 10.16% and 11.23% higher leucine aminopeptidase activity than N18 in the 0–20 cm soil layer. OFN12 > N18 under OF.

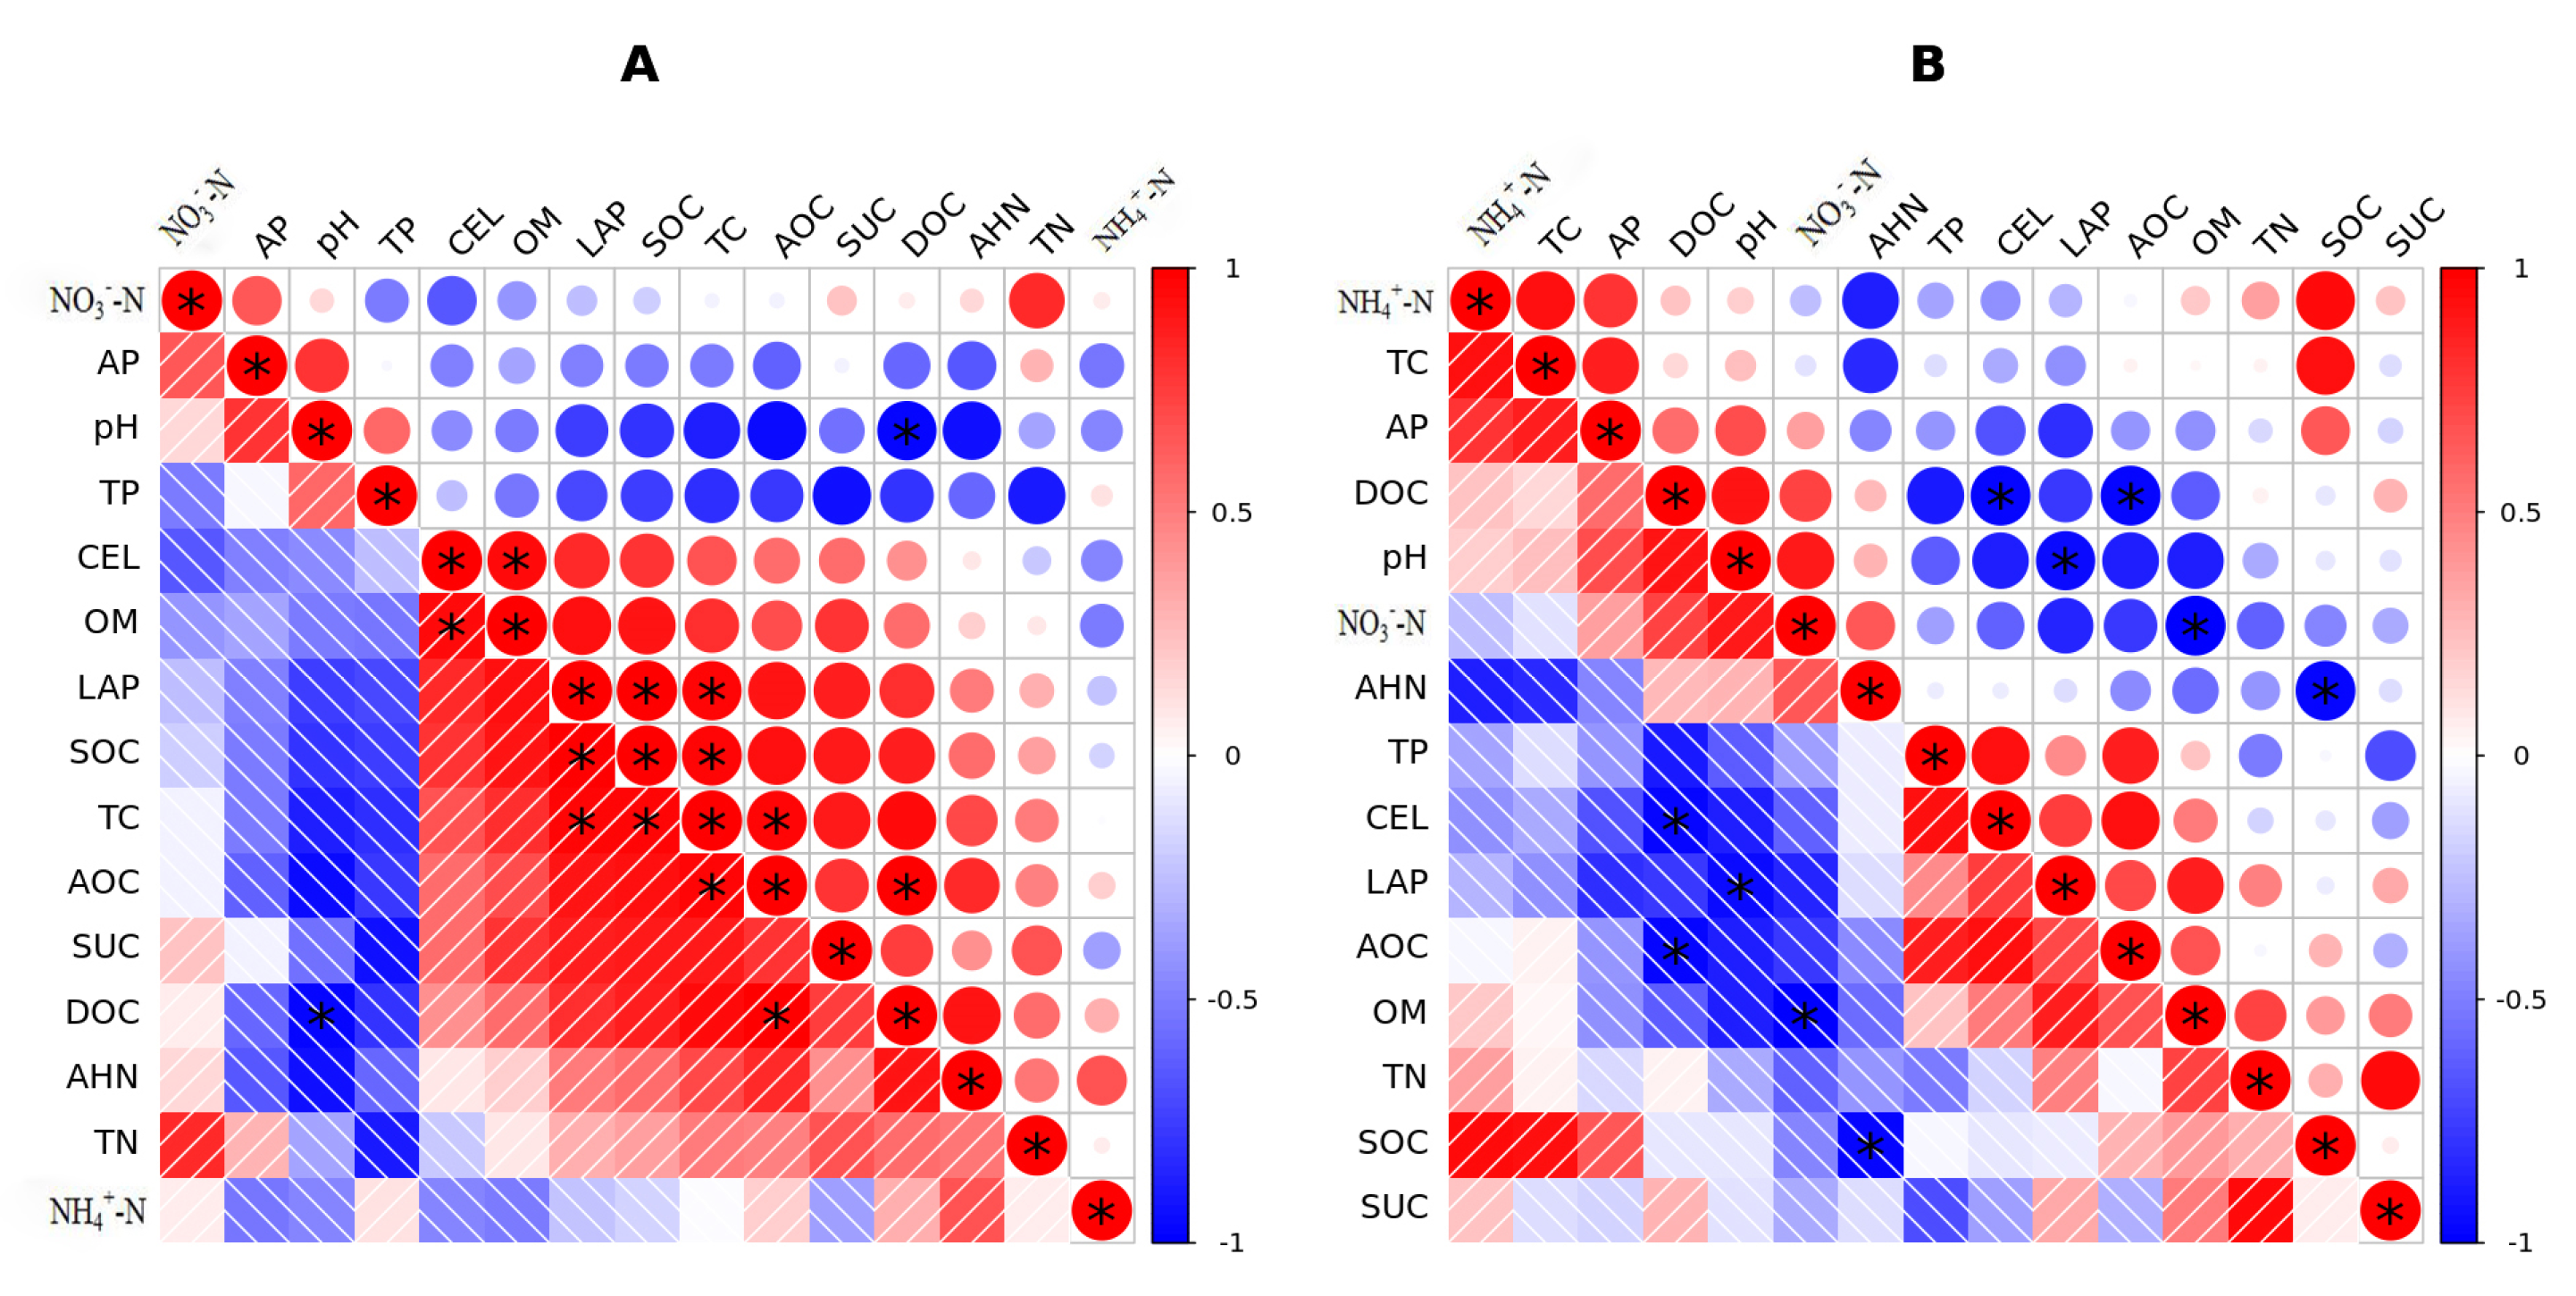
3.7. Correlation Analysis of Soil Indicators

The Pearson correlation algorithm was employed to analyze the interrelationships among 15 physicochemical indicators for the soil samples collected at the maturity stage. The results are shown in Figure 7. Overall, in the surface soil, except for pH, mineral nitrogen content influenced by pH, and slightly lower total phosphorus content, all other fertility, carbon, nitrogen, and enzyme activity indicators showed significant or extremely significant positive correlations. Particularly, the positive correlation was more pronounced in the soil carbon pool-related indicators. In this study, compared to the subsoil, the relationship between fertility indicators, active carbon and nitrogen indicators, and enzyme activity is closer in the surface soil, and their mutual promotion effect is more significant.

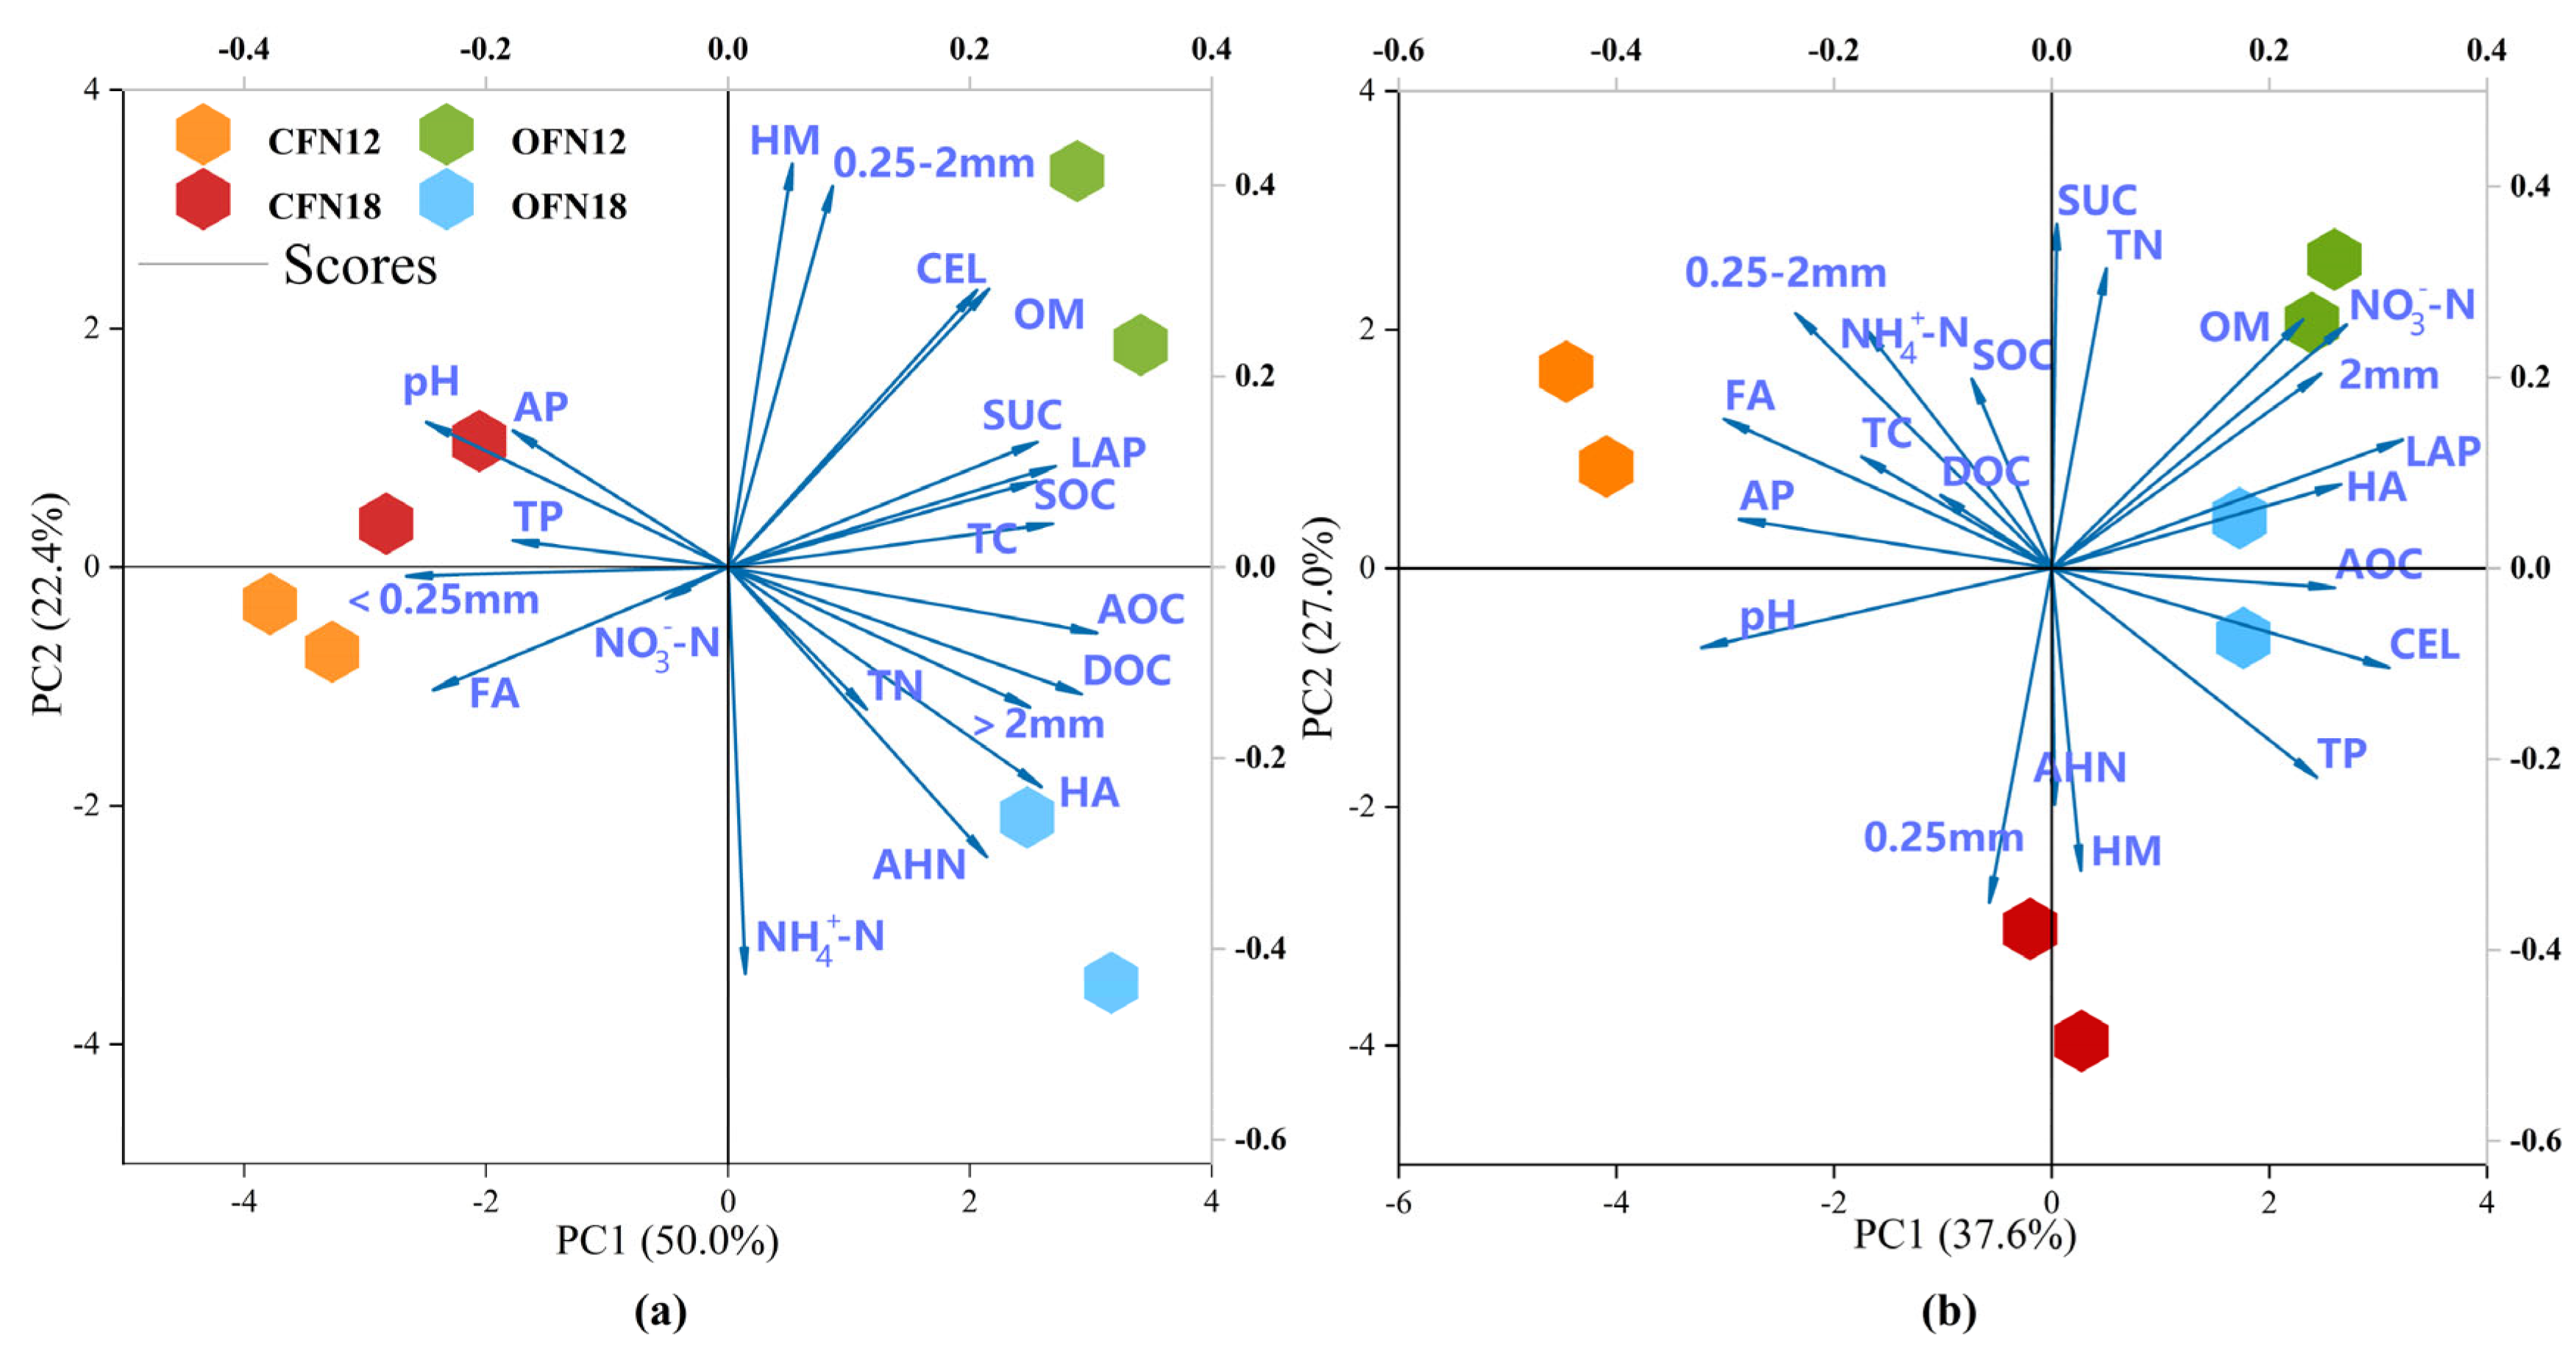
3.8. Principal Component Analysis of Soil Indicators

The principal component analysis was conducted on the 21 physicochemical indicators for the soil samples collected at the maturity stage. The results are shown in Figure 8, where the cumulative variance contribution rates of the major components PC1 and PC2 reached 72.4% and 64.6% in the surface and subsoil, respectively, explaining the differences among the four treatments well. Scores on PC1 and PC2 were calculated for each treatment to represent soil properties comprehensively. The ranking of treatments in the 0–10 cm soil depth was as follows (Table 4): OFN12 > OFN18 > CFN18 > CFN12; and in the 10–20 cm depth, it was OFN12 > OFN18 > CFN12 > CFN18. The scores showed that OF > CF in both soil depths, with N18 < N12.
Along PC1 and PC2, soil organic matter (OM), indicators related to carbon cycle (SOC, TC, LAP, CEL), and aggregate size fractions (0.25–2 mm, >2 mm) are the core variables distinguishing OFN12 from other treatments. In Figure 8a, sucrose (SUC) and humin (HM), and in Figure 8b, nitrate nitrogen (NO3—N), humic acid (HA), and active organic carbon (AOC) further reflect the role of carbon–nitrogen cycling characteristics and humus composition in the two soil layers in distinguishing OFN12 from other treatments.

4. Discussion

4.1. Influence of Organic Cultivation and Reduced Nitrogen Fertilization on Soil Carbon and Nitrogen Pools

The OFN12 treatment maintained higher surface soil organic carbon across all growth stages, outperforming CFN18 which showed post-maturity decomposition [34]. This discrepancy stems from OFN12’s integrated input of green manure (milk vetch) and organic fertilizers, which not only provides labile carbon sources for microbial biomass formation but also stabilizes carbon via humus accumulation [35]. In contrast, CFN18’s early SOC surge was attributed to root exudates under high nitrogen stimulation, yet field drying at maturity triggered aerobic decomposition, aligning with prior findings [36,37]. Soluble organic carbon and acid-extractable organic carbon were significantly higher in organic cultivation (except subsoil at maturity), reflecting enhanced microbial accessibility and metabolic activity [38,39,40,41]. DOC’s depletion in subsoil during field drying highlights its sensitivity to moisture fluctuations, while AEOC’s increase under OFN12 suggests improved soil protein/polysaccharide pools, driving a positive feedback loop between organic matter and microbial fertility [41,42,43]. CFN18’s high nitrogen level accelerated nitrification during tillering, boosting nitrate nitrogen (NO3-N) [44], but led to ammonium nitrogen (NH4+-N) accumulation at maturity due to reduced crop uptake. OFN12, however, balanced nitrogen supply via green manure decomposition, avoiding excessive microbial carbon mineralization caused by nitrogen overload [45].
The anaerobic environment in mid-growth paddy fields stabilized SOC and carbon–nitrogen ratios, endowing soils with the capacity to buffer short-term climate extremes (e.g., temperature/rainfall fluctuations) [46]. This stability underscores paddy soils’ role as a carbon sink under sustainable management. By combining moderate nitrogen reduction with organic amendments, OFN12 achieved dual benefits: sustained carbon sequestration through microbial carbon assimilation [35]; reduced carbon loss by avoiding nitrogen-driven excessive decomposition [45]. This contrasts with conventional fertilization, where intensive nitrogen application compromises long-term carbon stability [47,48]. The study reveals that organic carbon management—via rational nutrient input and tillage practices—can reconcile crop productivity with soil health. Specifically, integrating leguminous green manures (e.g., milk vetch) and organic fertilizers provides a viable pathway to enhance soil carbon pools, microbial activity, and climate resilience, supporting low-carbon agriculture [49,50].

4.2. Influence of Organic Cultivation and Reduced Nitrogen Fertilization on Soil Aggregates and Humus

One of the signs of soil degradation under continuous cropping is the loss of soil organic matter and a decrease in aggregate size, indicating that aggregates can characterize soil fertility [51]. In this experiment, the proportion of large aggregates with a size greater than 2 mm in both soil layers was significantly influenced by the cultivation method, showing organic > conventional. Under organic cultivation, the proportion of large aggregates with a size greater than 0.25 mm was higher, with the highest increase in the proportion of aggregates with a size of 0.5–1 mm in the N12 treatment. The improvement effect of organic cultivation on soil aggregates observed in the experiment is consistent with previous findings [52]. Soil aggregates can fix organic carbon particles inside them through physical encapsulation, reducing the contact of organic carbon with the external environment and decreasing the probability of organic carbon being oxidized and decomposed. Substances such as extracellular polysaccharides secreted by microorganisms can serve as cementing materials for aggregates, enhancing the stability of aggregates. The stable aggregate structure effectively protects the organic carbon within it from physical disturbances and excessive decomposition by microorganisms, thus promoting the increase in soil organic carbon content [53].
As the main component of organic matter in aggregates, the formation and transformation of humus are crucial for maintaining the stability of aggregates [54]. Humus is involved in the formation of aggregates, promoting soil carbon storage function and enhancing carbon sequestration capacity [55]. Typically, compost can enhance soil fertility because the humus formed during composting effectively supplements the humus deficit caused by soil fertility consumption [56]. Humic acid is a major component of humus, and different components of humic substances have varying effects on aggregate formation: the content of humic acid in humic substances is a key factor affecting aggregate stability, while the influence of fulvic acid is relatively minor [57]. Research has shown that after adding different concentrations of humic acid to soil, the content of water-stable aggregates in soils with different degrees of erosion will increase [58]. Humic acid itself is an important component of soil organic carbon. Its chemical structure is relatively stable and it can be stored in the soil for a long time. Humic acid has acid–base buffering properties and can regulate the soil pH value, keeping it within a relatively stable range. In addition, humic acid can also adsorb and fix heavy metal ions and organic pollutants in the soil, reducing their bioavailability and toxicity and decreasing the harm to the soil ecosystem [59].
In this experiment, the fulvic acid content in the soil showed no significant change after the tillering stage, exerting limited impact on soil aggregates. By contrast, organic cultivation significantly increased the humic acid content in the 0–10 cm soil layer, leading to a higher proportion of large aggregates (both >2 mm and >0.25 mm) at maturity—an effect most pronounced in the OFN12 treatment. Notably, while humic acid accumulation positively correlated with surface SOC levels, the dynamics of humus did not fully align with those of total carbon. This discrepancy can be attributed to the differential decomposition rates of humus fractions: the stable aromatic structure of humic acid resists microbial degradation [60], facilitating long-term carbon sequestration, whereas labile fulvic acid turns over more rapidly, decoupling humus dynamics from bulk carbon pool trends [61]. Mechanistically, the aromatic ring structure and complex chemical bonds in humic acid molecules render them resistant to rapid microbial decomposition, thereby enhancing soil organic carbon storage [62].

4.3. Impact of Organic Cultivation and Reduced Nitrogen Fertilization on Soil Enzyme Activity

Organic cultivation significantly elevated activities of sucrase, leucine aminopeptidase (LAP), and cellulase, with the most pronounced increases observed in the surface soil at maturity [63,64,65,66]. This suggests a treatment-specific stimulation of carbon (sucrase, cellulase) and nitrogen (LAP) cycling enzymes, aligning with the functional roles of applied organic amendments. The increase in enzyme activities is primarily attributed to the preceding green manure (milk vetch), whose decomposition provided labile organic matter and a favorable microhabitat for microbial proliferation [63]. Cellulase breaks down plant cellulose from milk vetch residues, while sucrase hydrolyzes sucrose released during decomposition, facilitating carbon assimilation by microbes [63]. Milk vetch decomposition promoted actinomycetes and nitrogen-fixing bacteria, which are known producers of LAP [65]. Reduced nitrogen fertilization in organic cultivation positively impacted LAP activity, likely by resolving microbial community imbalances caused by excessive nitrogen [64]. The shift favored LAP-producing taxa, while abundant organic nitrogen sources stimulated LAP synthesis to meet microbial nitrogen demands [65]. Phenolic and flavonoid compounds generated during organic matter decomposition may directly activate LAP [66]. These metabolites act as signaling molecules or enzyme co-factors, enhancing proteolytic activity independent of microbial biomass changes.
In conclusion, the increase in invertase activity accelerates the decomposition of plant root exudates (which contain organic carbon compounds such as sucrose), enabling carbon to cycle more quickly in the soil-plant-microorganism system and improving the utilization efficiency of carbon. The increase in leucine aminopeptidase activity also promotes the mineralization process of organic nitrogen in the soil, converting organic nitrogen into forms such as ammonium nitrogen (NH4+-N) that can be directly absorbed by plants, enhancing the availability of soil nitrogen and increasing the rate and efficiency of the soil nitrogen cycle. Promoting nutrient cycling through the increase in the activities of enzymes such as invertase and leucine aminopeptidase can directly improve the elements of soil fertility. Organic cultivation and reduced nitrogen fertilization measures have a significant impact on the enhancement of soil enzyme activity, providing favorable conditions for the growth and activity of soil microbial communities, thereby contributing to maintaining soil health and biological activity. Notably, although organic cultivation can provide a high-quality soil environment for crop production, factors such as the slow release of nutrients in organic materials themselves and the weak resistance to pests and diseases due to the inability to spray pesticides in the cultivation mode still trouble our exploration of yield factors [67].

5. Conclusions

From the results of this study, it can be concluded that OFN12 significantly enhances soil fertility by improving carbon sequestration, optimizing nitrogen cycling, and stabilizing aggregate humic structures. The application of organic fertilizers was found to enhance the activities of sucrase, cellulase, and leucine aminopeptidase in soil, particularly in the subsurface layer. PCA showed that OFN12 had the highest comprehensive score, and carbon cycling-related indicators (SOC, TC, LAP, CEL) were the key variables distinguishing it from other treatments. Thus, it is recommended to adopt organic cultivation combined with moderate nitrogen reduction, to promote soil health protection with reduced fertilizer inputs, thereby advancing the development of sustainable agriculture.

Author Contributions

G.W.: Writing—original draft, Data curation, Formal analysis, Resources. Y.Y.: Conceptualization, Data curation, Methodology. Y.C.: Writing—review and editing. X.H.: Data curation, Resources. S.Y.: Data curation, Resources. M.J.: Writing—review and editing. Z.Z.: Funding acquisition, Methodology, Supervision. L.H.: Project administration, Funding acquisition, Supervision, Validation, Writing—review and editing. All authors have read and agreed to the published version of the manuscript.

Funding

Special Funds for Scientific and Technological Innovation of Jiangsu Province, China (BE2022425) and Jiangsu Province Postgraduate Research Innovation Program (KYCX24-3785).

Data Availability Statement

The data presented in this study are contained within the article.

Acknowledgments

We thank all the colleagues of Yangzhou Ma Peng Wan Ecological Agricultural Science and Technology Co. for their help during the experimental field.

Conflicts of Interest

The authors have no relevant financial or non-financial interest to disclose.

References

  1. Khan, Z.; Zhang, K.; Khan, M.N.; Zhu, K.; Hu, L. Effects of Biochar Persistence on Soil Physiochemical Properties, Enzymatic Activities, Nutrient Utilization, and Crop Yield in a Three-Year Rice-Rapeseed Crop Rotation. Eur. J. Agron. 2024, 154, 127096. [Google Scholar] [CrossRef]
  2. Paudel, D.; Wang, L.; Poudel, R.; Acharya, J.P.; Victores, S.; De Souza, C.H.L.; Rios, E.; Wang, J. Elucidating the Effects of Organic vs. Conventional Cropping Practice and Rhizobia Inoculation on Rhizosphere Microbial Diversity and Yield of Peanut. Environ. Microbiome 2023, 18, 60. [Google Scholar] [CrossRef] [PubMed]
  3. Yang, J.; Wu, F.; Ni, X.; Yue, K.; Wei, X.; Zhang, X.; Zhang, X. Responses of Soil Nitrogen Pools to Litter Input Under Nitrogen Addition: A Meta-Analysis. JGR Biogeosci. 2024, 129, e2023JG007699. [Google Scholar] [CrossRef]
  4. Wang, L. Leaching of Soil Legacy Nitrogen in Intact Soil Columns and Significance of Soil Macropore Structure. Sci. Total Environ. 2024, 906, 167546. [Google Scholar] [CrossRef]
  5. Duan, P.; Song, Y.; Li, S.; Xiong, Z. Responses of N2O Production Pathways and Related Functional Microbes to Temperature across Greenhouse Vegetable Field Soils. Geoderma 2019, 355, 113904. [Google Scholar] [CrossRef]
  6. Ma, Y.; Woolf, D.; Fan, M.; Qiao, L.; Li, R.; Lehmann, J. Global Crop Production Increase by Soil Organic Carbon. Nat. Geosci. 2023, 16, 1159–1165. [Google Scholar] [CrossRef]
  7. Smith, P. An Overview of the Permanence of Soil Organic Carbon Stocks: Influence of Direct Human-induced, Indirect and Natural Effects. Eur. J. Soil Sci. 2005, 56, 673–680. [Google Scholar] [CrossRef]
  8. Zhao, C.; He, X.; Dan, X.; He, M.; Zhao, J.; Meng, H.; Cai, Z.; Zhang, J. Soil Dissolved Organic Matters Mediate Bacterial Taxa to Enhance Nitrification Rates under Wheat Cultivation. Sci. Total Environ. 2022, 828, 154418. [Google Scholar] [CrossRef]
  9. Liang, S.; Sun, N.; Meersmans, J.; Longdoz, B.; Colinet, G.; Xu, M.; Wu, L. Impacts of Climate Change on Crop Production and Soil Carbon Stock in a Continuous Wheat Cropping System in Southeast England. Agric. Ecosyst. Environ. 2024, 365, 108909. [Google Scholar] [CrossRef]
  10. Thomaz, E.L.; Araujo-Junior, C.F.; Vendrame, P.R.S.; De Melo, T.R. Mechanisms of Aggregate Breakdown in (Sub) Tropical Soils: Effects of the Hierarchical Resistance. CATENA 2022, 216, 106377. [Google Scholar] [CrossRef]
  11. Wang, F.; Liu, Y.; Liang, B.; Liu, J.; Zong, H.; Guo, X.; Wang, X.; Song, N. Variations in Soil Aggregate Distribution and Associated Organic Carbon and Nitrogen Fractions in Long-Term Continuous Vegetable Rotation Soil by Nitrogen Fertilization and Plastic Film Mulching. Sci. Total Environ. 2022, 835, 155420. [Google Scholar] [CrossRef] [PubMed]
  12. Tong, L.; Zhu, L.; Lv, Y.; Zhu, K.; Liu, X.; Zhao, R. Response of Organic Carbon Fractions and Microbial Community Composition of Soil Aggregates to Long-Term Fertilizations in an Intensive Greenhouse System. J. Soils Sediments 2020, 20, 641–652. [Google Scholar] [CrossRef]
  13. Hu, N.; Liu, C.; Chen, Q.; Fan, J.; Wang, Y.; Sun, H. Substitution of Chemical Fertilizer with Organic Fertilizer Can Affect Soil Labile Organic Carbon Fractions and Garlic Yield by Mediating Soil Aggregate-Associated Organic Carbon. Agronomy 2023, 13, 3062. [Google Scholar] [CrossRef]
  14. Leri, A.C.; Ravel, B. Abiotic Bromination of Soil Organic Matter. Environ. Sci. Technol. 2015, 49, 13350–13359. [Google Scholar] [CrossRef]
  15. Xu, J.; Zhao, B.; Chu, W.; Mao, J.; Olk, D.C.; Xin, X.; Zhang, J. Altered Humin Compositions under Organic and Inorganic Fertilization on an Intensively Cultivated Sandy Loam Soil. Sci. Total Environ. 2017, 601–602, 356–364. [Google Scholar] [CrossRef] [PubMed]
  16. Silva, G.N.D.; Bonetti, J.D.A.; Souza, E.D.D.; Paulino, H.B.; Carneiro, M.A.C. Management Systems and Soil Use on Fractions and Stocks of Organic Carbon and Nitrogen Total in Cerrado Latosol. Biosci. J. 2016, 32, 1482–1492. [Google Scholar] [CrossRef]
  17. Wang, R.; Li, D.; Deng, F.; Cao, Z.; Zheng, G. Production of Artificial Humic Acid from Rice Straw for Fertilizer Production and Soil Improvement. Sci. Total Environ. 2024, 906, 167548. [Google Scholar] [CrossRef]
  18. Wang, Q.; Zhu, Y.; Xu, L.; Chen, B.; Liu, C.; Ma, X.; Meng, Q.; Liu, B.; Huang, Z.; Jiao, Y.; et al. Responses of Soil Humus Composition and Humic Acid Structural Characteristics to the Addition of Different Types of Biochar in Phaeozems. J. Soil Sci. Plant Nutr. 2023, 23, 1611–1618. [Google Scholar] [CrossRef]
  19. Zhang, N.; Bai, L.; Wei, X.; Li, T.; Tang, Y.; Wen, J.; Peng, Z.; Zhang, Y.; Wang, Y.; Zeng, X.; et al. Effects of Organic Material Addition on Carbon Cycling and Soil Fertility in Paddy Soil. J. Environ. Manag. 2025, 379, 124898. [Google Scholar] [CrossRef]
  20. Egli, M.; Sartori, G.; Mirabella, A.; Favilli, F.; Giaccai, D.; Delbos, E. Effect of North and South Exposure on Organic Matter in High Alpine Soils. Geoderma 2009, 149, 124–136. [Google Scholar] [CrossRef]
  21. Liu, Z.; Xie, W.; Yang, Z.; Huang, X.; Zhou, H. Effects of Manure and Chemical Fertilizer on Bacterial Community Structure and Soil Enzyme Activities in North China. Agronomy 2021, 11, 1017. [Google Scholar] [CrossRef]
  22. Li, Y.; Wang, C.; Wu, J.; Zhang, Y.; Li, Q.; Liu, S.; Gao, Y. The Effects of Localized Plant–Soil–Microbe Interactions on Soil Nitrogen Cycle in Maize Rhizosphere Soil under Long-Term Fertilizers. Agronomy 2023, 13, 2114. [Google Scholar] [CrossRef]
  23. Xiao, Y.; Zhou, M.; Li, Y.; Zhang, X.; Wang, G.; Jin, J.; Ding, G.; Zeng, X.; Liu, X. Crop Residue Return Rather Than Organic Manure Increases Soil Aggregate Stability under Corn–Soybean Rotation in Surface Mollisols. Agriculture 2022, 12, 265. [Google Scholar] [CrossRef]
  24. GB/T 19630-2019; Organic Products—Requirements for Production, Processing, Labeling and Management System. Standards Press of China: Beijng, China, 2019. (In Chinese)
  25. Bao, S.D. Methods for Soil Agricultural and Chemical Analysis; China Agricultural Press: Beijing, China, 2000. (In Chinese) [Google Scholar]
  26. McKee, L.S. Measuring Enzyme Kinetics of Glycoside Hydrolases Using the 3,5-Dinitrosalicylic Acid Assay. In Protein-Carbohydrate Interactions; Abbott, D.W., Lammerts Van Bueren, A., Eds.; Methods in Molecular Biology; Springer: New York, NY, USA, 2017; Volume 1588, pp. 27–36. ISBN 978-1-4939-6898-5. [Google Scholar]
  27. Leng, F.; Sun, S.; Jing, Y.; Wang, F.; Wei, Q.; Wang, X.; Zhu, X. A Rapid and Sensitive Method for Determination of Trace Amounts of Glucose by Anthrone-Sulfuric Acid Method. Bulg. Chem. Commun. 2016, 48, 109–113. [Google Scholar]
  28. Mathieu, C.; Hagmann, D.; Krumins, J.; Goodey, N. Leucine-aminopeptidase Activities in Heavy-metal Contaminated Soils from Brownfields of Liberty State Park (583.6). FASEB J. 2014, 28, 583.6. [Google Scholar] [CrossRef]
  29. Sato, J.H.; Figueiredo, C.C.D.; Marchão, R.L.; Madari, B.E.; Benedito, L.E.C.; Busato, J.G.; Souza, D.M.D. Methods of Soil Organic Carbon Determination in Brazilian Savannah Soils. Sci. Agric. 2014, 71, 302–308. [Google Scholar] [CrossRef]
  30. Pu, C.; Kan, Z.; Liu, P.; Ma, S.; Qi, J.; Zhao, X.; Zhang, H. Residue Management Induced Changes in Soil Organic Carbon and Total Nitrogen under Different Tillage Practices in the North China Plain. J. Integr. Agric. 2019, 18, 1337–1347. [Google Scholar] [CrossRef]
  31. Rovira, P.; Ramón Vallejo, V. Labile, Recalcitrant, and Inert Organic Matter in Mediterranean Forest Soils. Soil Biol. Biochem. 2007, 39, 202–215. [Google Scholar] [CrossRef]
  32. Su, Y. Revisiting Carbon, Nitrogen, and Phosphorus Metabolisms in Microalgae for Wastewater Treatment. Sci. Total Environ. 2021, 762, 144590. [Google Scholar] [CrossRef]
  33. Palkar, K.P.; Meshram, N.A.; Kasture, M.C.; Pinjari, S.S.; Dodake, S.B. Effect of Crop Residue and Fertilizers on Humus Fractions and Rice (Oryza sativa) Yield. Indian J. Agric. Sci. 2022, 92, 249–253. [Google Scholar] [CrossRef]
  34. Bongiorno, G.; Bünemann, E.K.; Oguejiofor, C.U.; Meier, J.; Gort, G.; Comans, R.; Mäder, P.; Brussaard, L.; De Goede, R. Sensitivity of Labile Carbon Fractions to Tillage and Organic Matter Management and Their Potential as Comprehensive Soil Quality Indicators across Pedoclimatic Conditions in Europe. Ecol. Indic. 2019, 99, 38–50. [Google Scholar] [CrossRef]
  35. Yang, Y.; Dou, Y.; Wang, B.; Wang, Y.; Liang, C.; An, S.; Soromotin, A.; Kuzyakov, Y. Increasing Contribution of Microbial Residues to Soil Organic Carbon in Grassland Restoration Chronosequence. Soil Biol. Biochem. 2022, 170, 108688. [Google Scholar] [CrossRef]
  36. Li, Q.; Wang, L.; Fu, Y.; Lin, D.; Hou, M.; Li, X.; Hu, D.; Wang, Z. Transformation of Soil Organic Matter Subjected to Environmental Disturbance and Preservation of Organic Matter Bound to Soil Minerals: A Review. J. Soils Sediments 2023, 23, 1485–1500. [Google Scholar] [CrossRef]
  37. Xu, J.M.; Cheng, H.H.; Koskinen, W.C.; Molina, J.A.E. Characterization of Potentially Bioreactive Soil Organic Carbon and Nitrogen by Acid Hydrolysis. Nutr. Cycl. Agroecosyst. 1997, 49, 267–271. [Google Scholar] [CrossRef]
  38. Sao, S.; Ann, V.; Nishiyama, M.; Praise, S.; Watanabe, T. Tracing the Pathways by Which Flood Duration Impacts Soil Bacteria through Soil Properties and Water-Extractable Dissolved Organic Matter: A Soil Column Experiment. Sci. Total Environ. 2023, 902, 166524. [Google Scholar] [CrossRef] [PubMed]
  39. Miao, S.; Ye, R.; Qiao, Y.; Zhu-Barker, X.; Doane, T.A.; Horwath, W.R. The Solubility of Carbon Inputs Affects the Priming of Soil Organic Matter. Plant Soil 2017, 410, 129–138. [Google Scholar] [CrossRef]
  40. Chen, H.; Kong, W.; Shi, Q.; Wang, F.; He, C.; Wu, J.; Lin, Q.; Zhang, X.; Zhu, Y.; Liang, C.; et al. Patterns and Drivers of the Degradability of Dissolved Organic Matter in Dryland Soils on the Tibetan Plateau. J. Appl. Ecol. 2022, 59, 884–894. [Google Scholar] [CrossRef]
  41. Al-Hazmi, N.E.; Naguib, D.M. Agricultural Wastes Polysaccharides Promising Soil Fertilizer Improves Plant Growth and Resistance against Soil-Borne Pathogens. Plant Soil 2024, 495, 675–697. [Google Scholar] [CrossRef]
  42. Fu, B.; Xu, Z.; Lei, Y.; Dong, R.; Wang, Y.; Guo, X.; Zhu, H.; Cao, Y.; Yan, Z. A Novel Secreted Protein, NISP1, Is Phosphorylated by Soybean Nodulation Receptor Kinase to Promote Nodule Symbiosis. J. Integr. Plant Biol. 2023, 65, 1297–1311. [Google Scholar] [CrossRef]
  43. Moffett, B.F.; Nicholson, F.A.; Uwakwe, N.C.; Chambers, B.J.; Harris, J.A.; Hill, T.C.J. Zinc Contamination Decreases the Bacterial Diversity of Agricultural Soil. FEMS Microbiol. Ecol. 2003, 43, 13–19. [Google Scholar] [CrossRef]
  44. Jiang, X.; Liu, W.; Liu, Q.; Jia, Z.; Wright, A.L.; Cao, Z. Soil N Mineralization, Nitrification and Dynamic Changes in Abundance of Ammonia-Oxidizing Bacteria and Archaea along a 2000 Year Chronosequence of Rice Cultivation. Plant Soil 2013, 365, 59–68. [Google Scholar] [CrossRef]
  45. Chen, X.; Hu, Y.; Xia, Y.; Zheng, S.; Ma, C.; Rui, Y.; He, H.; Huang, D.; Zhang, Z.; Ge, T.; et al. Contrasting Pathways of Carbon Sequestration in Paddy and Upland Soils. Glob. Chang. Biol. 2021, 27, 2478–2490. [Google Scholar] [CrossRef] [PubMed]
  46. Paul, C.; Bartkowski, B.; Dönmez, C.; Don, A.; Mayer, S.; Steffens, M.; Weigl, S.; Wiesmeier, M.; Wolf, A.; Helming, K. Carbon Farming: Are Soil Carbon Certificates a Suitable Tool for Climate Change Mitigation? J. Environ. Manag. 2023, 330, 117142. [Google Scholar] [CrossRef] [PubMed]
  47. Kan, Z.-R.; Virk, A.L.; Wu, G.; Qi, J.-Y.; Ma, S.-T.; Wang, X.; Zhao, X.; Lal, R.; Zhang, H.-L. Priming Effect Intensity of Soil Organic Carbon Mineralization under No-till and Residue Retention. Appl. Soil Ecol. 2020, 147, 103445. [Google Scholar] [CrossRef]
  48. Yang, R.; Su, Y.; Wang, T.; Yang, Q. Effect of Chemical and Organic Fertilization on Soil Carbon and Nitrogen Accumulation in a Newly Cultivated Farmland. J. Integr. Agric. 2016, 15, 658–666. [Google Scholar] [CrossRef]
  49. Xing, H.; Zhou, W.; Wang, C.; Li, L.; Li, X.; Cui, N.; Hao, W.; Liu, F.; Wang, Y. Excessive Nitrogen Application under Moderate Soil Water Deficit Decreases Photosynthesis, Respiration, Carbon Gain and Water Use Efficiency of Maize. Plant Physiol. Biochem. 2021, 166, 1065–1075. [Google Scholar] [CrossRef]
  50. Schnabel, R.R.; Dell, C.J.; Shaffer, J.A. Filter, Inoculum and Time Effects on Measurements of Biodegradable Water Soluble Organic Carbon in Soil. Soil Biol. Biochem. 2002, 34, 737–739. [Google Scholar] [CrossRef]
  51. Ma, F.; Liu, L.; Han, X.; Wang, Y.; Wan, H.; Xia, J.; Lu, X. Using a Novel Vector Length Stability Index (VLSI) to Evaluate Soil Aggregate Stability: A Preliminary Study. CATENA 2024, 240, 107995. [Google Scholar] [CrossRef]
  52. Gioacchini, P.; Baldi, E.; Montecchio, D.; Mazzon, M.; Quartieri, M.; Toselli, M.; Marzadori, C. Effect of Long-Term Compost Fertilization on the Distribution of Organic Carbon and Nitrogen in Soil Aggregates. CATENA 2024, 240, 107968. [Google Scholar] [CrossRef]
  53. Oldfield, E.E.; Bradford, M.A.; Wood, S.A. Global Meta-Analysis of the Relationship between Soil Organic Matter and Crop Yields. Soil 2019, 5, 15–32. [Google Scholar] [CrossRef]
  54. Qiao, J.; Chen, M.; Zhong, S.; Tong, H.; Li, F. Soil Humic Acid Stimulates Potentially Active Dissimilatory Arsenate-Reducing Bacteria in Flooded Paddy Soil as Revealed by Metagenomic Stable Isotope Probing. Environ. Sci. Technol. 2024, 58, 2303–2312. [Google Scholar] [CrossRef] [PubMed]
  55. Zhang, D.; Cai, C.; Zhu, J. Changes of Soil Water–Stable Aggregates after Rice–Crawfish Rotation in Low-Lying Paddy Fields: A Case Study in Jianghan Plain of China. Commun. Soil Sci. Plant Anal. 2021, 52, 2358–2372. [Google Scholar] [CrossRef]
  56. Kou, B.; Hui, K.; Miao, F.; He, Y.; Qu, C.; Yuan, Y.; Tan, W. Differential Responses of the Properties of Soil Humic Acid and Fulvic Acid to Nitrogen Addition in the North China Plain. Environ. Res. 2022, 214, 113980. [Google Scholar] [CrossRef]
  57. Zhang, Y.; Hui, K.; Li, Y.; Yuan, Y.; Tan, W. Electron Transfer Capacity of Humic Acid in Soil Micro and Macro Aggregates in Response to Mulching Years. Sci. Total Environ. 2022, 831, 154927. [Google Scholar] [CrossRef]
  58. Asli, S.; Neumann, P.M. Rhizosphere Humic Acid Interacts with Root Cell Walls to Reduce Hydraulic Conductivity and Plant Development. Plant Soil 2010, 336, 313–322. [Google Scholar] [CrossRef]
  59. Wu, X.; Liu, P.; Gong, Z.; Wang, H.; Huang, H.; Shi, Y.; Zhao, X.; Gao, S. Humic Acid and Fulvic Acid Hinder Long-Term Weathering of Microplastics in Lake Water. Environ. Sci. Technol. 2021, 55, 15810–15820. [Google Scholar] [CrossRef]
  60. Yang, S.; Wang, K.; Yu, X.; Xu, Y.; Ye, H.; Bai, M.; Zhao, L.; Sun, Y.; Li, X.; Li, Y. Fulvic Acid More Facilitated the Soil Electron Transfer than Humic Acid. J. Hazard. Mater. 2024, 469, 134080. [Google Scholar] [CrossRef]
  61. Alsudays, I.M.; Alshammary, F.H.; Alabdallah, N.M.; Alatawi, A.; Alotaibi, M.M.; Alwutayd, K.M.; Alharbi, M.M.; Alghanem, S.M.S.; Alzuaibr, F.M.; Gharib, H.S.; et al. Applications of Humic and Fulvic Acid under Saline Soil Conditions to Improve Growth and Yield in Barley. BMC Plant Biol. 2024, 24, 191. [Google Scholar] [CrossRef]
  62. Tiwari, J.; Ramanathan, A.; Bauddh, K.; Korstad, J. Humic Substances: Structure, Function and Benefits for Agroecosystems—A Review. Pedosphere 2023, 33, 237–249. [Google Scholar] [CrossRef]
  63. Chen, Y.; Du, Z.; Weng, Z.; Sun, K.; Zhang, Y.; Liu, Q.; Yang, Y.; Li, Y.; Wang, Z.; Luo, Y.; et al. Formation of Soil Organic Carbon Pool Is Regulated by the Structure of Dissolved Organic Matter and Microbial Carbon Pump Efficacy: A Decadal Study Comparing Different Carbon Management Strategies. Glob. Chang. Biol. 2023, 29, 5445–5459. [Google Scholar] [CrossRef]
  64. Wang, Y.; Zhang, Y.; Zhang, H.; Yang, Z.; Zhu, Q.; Yan, B.; Fei, J.; Rong, X.; Peng, J.; Luo, G. Intercropping-Driven Nitrogen Trade-off Enhances Maize Productivity in a Long-Term Experiment. Field Crops Res. 2022, 287, 108671. [Google Scholar] [CrossRef]
  65. Cardinali, F.; Botta, C.; Harasym, J.; Reale, A.; Ferrocino, I.; Boscaino, F.; Orkusz, A.; Milanović, V.; Garofalo, C.; Rampanti, G.; et al. Tasting of Traditional Polish Fermented Cucumbers: Microbiology, Morpho-Textural Features, and Volatilome. Food Res. Int. 2024, 177, 113851. [Google Scholar] [CrossRef]
  66. Parellada, J.; Suárez, G.; Guinea, M. Inhibition of Zinc Metallopeptidases by Flavonoids and Related Phenolic Compounds: Structure-Activity Relationships. J. Enzym. Inhib. 1998, 13, 347–359. [Google Scholar] [CrossRef] [PubMed]
  67. Ruan, S. Organic Cultivation Induced Regulation in Yield Formation, Grain Quality Attributes, and Volatile Organic Compounds of Fragrant Rice. Food Chem. 2023, 405, 134845. [Google Scholar] [CrossRef] [PubMed]
Figure 1. Soil organic carbon content under organic and conventional cultivation at two nitrogen levels. (A) 0–10 cm; (B) 10–20 cm. CFN12: conventional cultivation low nitrogen treatment, CFN18: conventional cultivation high nitrogen treatment, OFN12: organic cultivation low nitrogen treatment, OFN18: organic cultivation high nitrogen treatment. Different lowercase letters indicate significant differences among the four treatments at p < 0.05. The error bar represents the standard deviation of the mean.
Agronomy 15 01561 g001
Figure 2. Soil total carbon and acid hydrolyzed organic carbon content under organic and conventional cultivation at two nitrogen levels. TOC, soil total carbon; AOC, soil acid hydrolysis organic carbon. (A) 0–10 cm; (B) 10–20 cm. Different lowercase letters indicate significant differences among the four treatments at p < 0.05. The error bar represents the standard deviation of the mean.
Agronomy 15 01561 g002
Figure 3. Soluble organic carbon content under organic and conventional cultivation at two nitrogen levels. (A) 0–10 cm; (B) 10–20 cm. CFN12: conventional cultivation low nitrogen treatment, CFN18: conventional cultivation high nitrogen treatment, OFN12: organic cultivation low nitrogen treatment, OFN18: organic cultivation high nitrogen treatment. Different lowercase letters indicate significant differences among the four treatments at p < 0.05. The error bar represents the standard deviation of the mean.
Agronomy 15 01561 g003
Figure 4. Soil humus organic carbon content under organic and conventional cultivation at two nitrogen levels. (A) 0–10 cm; (B) 10–20 cm. CFN12: conventional cultivation low nitrogen treatment, CFN18: conventional cultivation high nitrogen treatment, OFN12: organic cultivation low nitrogen treatment, OFN18: organic cultivation high nitrogen treatment. Different lowercase letters indicate significant differences among the four treatments at p < 0.05. The error bar represents the standard deviation of the mean.
Agronomy 15 01561 g004
Figure 5. Percentage of soil aggregates under organic and conventional cultivation at two nitrogen levels. Different lowercase letters indicate significant differences among the four treatments at p < 0.05. The error bar represents the standard deviation of the mean.
Agronomy 15 01561 g005
Figure 6. Concentrations of three enzymes under organic and conventional cultivation at two nitrogen levels. (A): Soil sucrase, (B): soil cellulase, (C): soil leucine aminopeptidase. F, cultivation pattern; N, nitrogen level; F × N, interaction between F and N. * indicate p < 0.05; ** indicate p < 0.01; ns indicate non-significance (p ≥ 0.05). Different lowercase letters indicate significant differences among the four treatments at p < 0.05. The error bar represents the standard deviation of the mean.
Agronomy 15 01561 g006
Figure 7. Correlation analysis of soil nutrients, enzyme activity, and active carbon and nitrogen in soil. (A) 0–10 cm; (B) 10–20 cm. * indicate a significant correlation at p < 0.05. Total nitrogen (TN), alkali-hydrolyzable nitrogen (AHN), ammonium nitrogen (NH4+-N), nitrate nitrogen (NO3-N), total phosphorus (TP), available phosphorus (AP), soil organic matter (OM), pH, total carbon (TC), soil organic carbon (SOC), dissolved organic carbon (DOC), acid extractable organic carbon (AOC), sucrase (SUC), leucine aminopeptidase (LAP), and cellulase (CEL).
Agronomy 15 01561 g007
Figure 8. Principal component analysis of soil nutrients, enzyme activity, and active carbon and nitrogen in soil. (a) 0–10 cm; (b) 10–20 cm. Total nitrogen (TN), alkali-hydrolyzable nitrogen (AHN), ammonium nitrogen (NH4+-N), nitrate nitrogen (NO3-N), total phosphorus (TP), available phosphorus (AP), soil organic matter (OM), pH, total carbon (TC), soil organic carbon (SOC), dissolved organic carbon (DOC), acid extractable organic carbon (AOC), sucrase (SUC), leucine aminopeptidase (LAP), and cellulase (CEL), fulvic acid (FA), humic acid (HA), humin (HM), proportion of different aggregate sizes (>2 mm, 0.25–2 mm, <0.25 mm).
Agronomy 15 01561 g008
Table 1. Fertilization rate under organic and conventional cultivation nitrogen levels (kg·hm−2).
Cultivate
Way
Nitrogen Application LevelTotalBasal FertilizerTopdressing Fertilizer
Compound Fertilizer (15%N)Milk Vetch (0.33%N)Rapeseed Cake (4.6%N)Bio-Organic Fertilizer (4%N)Urea (46%N)Bio-Organic Fertilizer (4%N)
CFN12180500///229/
N18 270750///343/
OFN12180/12,00012001200/930
N18270/12,00024001200/1800
Note: The nutrient contents of various fertilizers are compound fertilizer: 15%N, 15% P2O5 and 15% K2O; milk vetch: 0.33% N, 0.08% P2O5 and 0.23% K2O; rapeseed cake: 4.60% N, 0.80% P2O5, 1.04% K2O, 0.80% Ca, 0.48% Mg and various trace elements; bio-organic fertilizer: 4.00% N, 1.87% P2O5, 2.28% K2O, various organic acids, peptides, and rich nutrient elements including 53% organic matter.
Table 2. Effects of two nitrogen levels on soil total nitrogen and alkali-hydrolyzed nitrogen content under organic and conventional cultivation.
Soil Layer (cm)Treatment Soil Total Nitrogen (STN) (g/kg)Soil Alkali-Hydrolyzable Nitrogen (SAN) (mg/kg)
TSHSMSTSHSMS
0–10 cmCFN122.44 ± 0.03 a2.19 ± 0.01 b2.20 ± 0.02 a173.27 ± 3.26 ab164.78 ± 3.10 a178.91 ± 1.90 b
CFN182.05 ± 0.01 b2.11 ± 0.02 b2.41 ± 0.01 a155.14 ± 1.14 b172.34 ± 7.61 a178.12 ± 1.99 b
OFN122.20 ± 0.07a b2.25 ± 0.07 b2.31 ± 0.10 a198.48 ± 10.48 a172.83 ± 3.07 a182.05 ± 1.30 ab
OFN181.92 ± 0.07 b2.57 ± 0.01 a2.43 ± 0.03 a147.15 ± 7.59 b163.06 ± 3.54 a191.19 ± 2.13 a
10–20 cmCFN121.28 ± 0.01 a1.29 ± 0.01 b1.54 ± 0.03 a110.68 ± 0.38 a131.26 ± 1.21 ab111.99 ± 0.96 c
CFN181.31 ± 0.00 a1.23 ± 0.04 b1.42 ± 0.04 a113.33 ± 1.53 a115.42 ± 4.38 c127.78 ± 0.90 a
OFN121.18 ± 0.04 a1.58 ± 0.01 a1.62 ± 0.10 a116.77 ± 0.89 a141.15 ± 1.38 a116.75 ± 0.37 b
OFN181.31 ± 0.01 a1.28 ± 0.06 b1.50 ± 0.03 a117.09 ± 2.70 a117.77 ± 2.36 bc105.17 ± 0.06 d
0–10 cmF13.34 *56.10 **1.41.650.0219.05 *
N40.60 **12.29 *10.72 *26.90 **0.055.07
F × N1.233.84 **0.736.153.367.14
10–20 cmF3.3620.93 *1.939.22 *5.33170.98 **
N11.36 *23.81 **4.450.8454.70 **9.51 *
F × N4.2811.26 *00.522.02402.08 **
Note: The data are presented as mean ± SD. Different lowercase letters within the same column indicate significant differences (* p < 0.05; ** p < 0.01) among the four treatments. TS, tillering stage; HS, heading stage; MS, maturing stage; F, cultivation pattern; N, nitrogen application level; F × N, interaction between cultivation mode and nitrogen level.
Table 3. Effects of two nitrogen levels on soil nitrate nitrogen and soil ammonium nitrogen content under organic and conventional cultivation.
Soil Layer (cm)Treatment Soil Nitrate Nitrogen NO3 (mg/kg) Soil Ammonium Nitrogen NH4+ (mg/kg)
TSHSMSTSHSMS
0–10 cmCFN121.00 ± 0.01 c0.76 ± 0.00 a1.18 ± 0.02 b20.03 ± 0.33 a17.67 ± 0.03 b15.45 ± 0.07 b
CFN182.27 ± 0.00 a0.63 ± 0.02 a0.69 ± 0.00 c16.74 ± 0.11 b19.85 ± 0.53 a17.85 ± 0.11 a
OFN122.24 ± 0.04 a0.41 ± 0.00 b0.60 ± 0.00 d16.34 ± 0.00 b16.24 ± 0.20 b15.37 ± 0.13 b
OFN181.43 ± 0.00 b0.50 ± 0.02 b1.48 ± 0.01 a19.03 ± 0.42 a19.69 ± 0.10 a17.05 ± 0.52 a
10–20 cmCFN120.82 ± 0.02 a0.69 ± 0.01 a0.97 ± 0.01 a17.52 ± 0.15 ab17.49 ± 0.16 a16.67 ± 0.12 a
CFN180.60 ± 0.04 bc0.56 ± 0.01 a0.47 ± 0.01 d17.27 ± 0.22 b16.10 ± 0.68 a16.70 ± 0.31 a
OFN120.70 ± 0.01 ab0.24 ± 0.00 a0.66 ± 0.00 c17.06 ± 0.50 b17.54 ± 0.08 a16.53 ± 0.01 a
OFN180.55 ± 0.01 c0.87 ± 0.01 a0.87 ± 0.01 b19.73 ± 0.64 a16.88 ± 0.51 a16.52 ± 0.47 a
0–10 cmF85.71 **410.83 **69.42 **6.497.622.6
N110.23 **1.98255.01 **1.2195.511 **54.607 **
F × N2306.38 **94.260 **3107.97 **119.832 **4.881.72
10–20 cmF13.53 *70.89 **23.45 **5.530.950.29
N67.70 **858.12 **268.84 **8.059 *5.720
F × N3.411985.11 **1619.28 **11.738 *0.710
Note: The data are presented as mean ± SD. Different lowercase letters within the same column indicate significant differences (* p < 0.05; ** p < 0.01) among the four treatments. TS, tillering stage; HS, heading stage; MS, maturing stage; F, cultivation pattern; N, nitrogen application level; F × N, interaction between cultivation mode and nitrogen level.
Table 4. Integrated scores of soil indicators for different treatments.
Soil LayerTreatmentPC1PC2Total PointsRank
0–10 cmCFN12−3.5306−0.50979−4.040394
CFN18−2.441230.709985−1.731253
OFN123.1497052.591665.7413651
OFN182.82213−2.791860.030272
10–20 cmCFN12−4.276731.25186−3.024873
CFN180.0382−3.49288−3.454684
OFN122.4949552.322644.8175951
OFN181.743565−0.081631.661942
Disclaimer/Publisher’s Note: The statements, opinions and data contained in all publications are solely those of the individual author(s) and contributor(s) and not of MDPI and/or the editor(s). MDPI and/or the editor(s) disclaim responsibility for any injury to people or property resulting from any ideas, methods, instructions or products referred to in the content.

