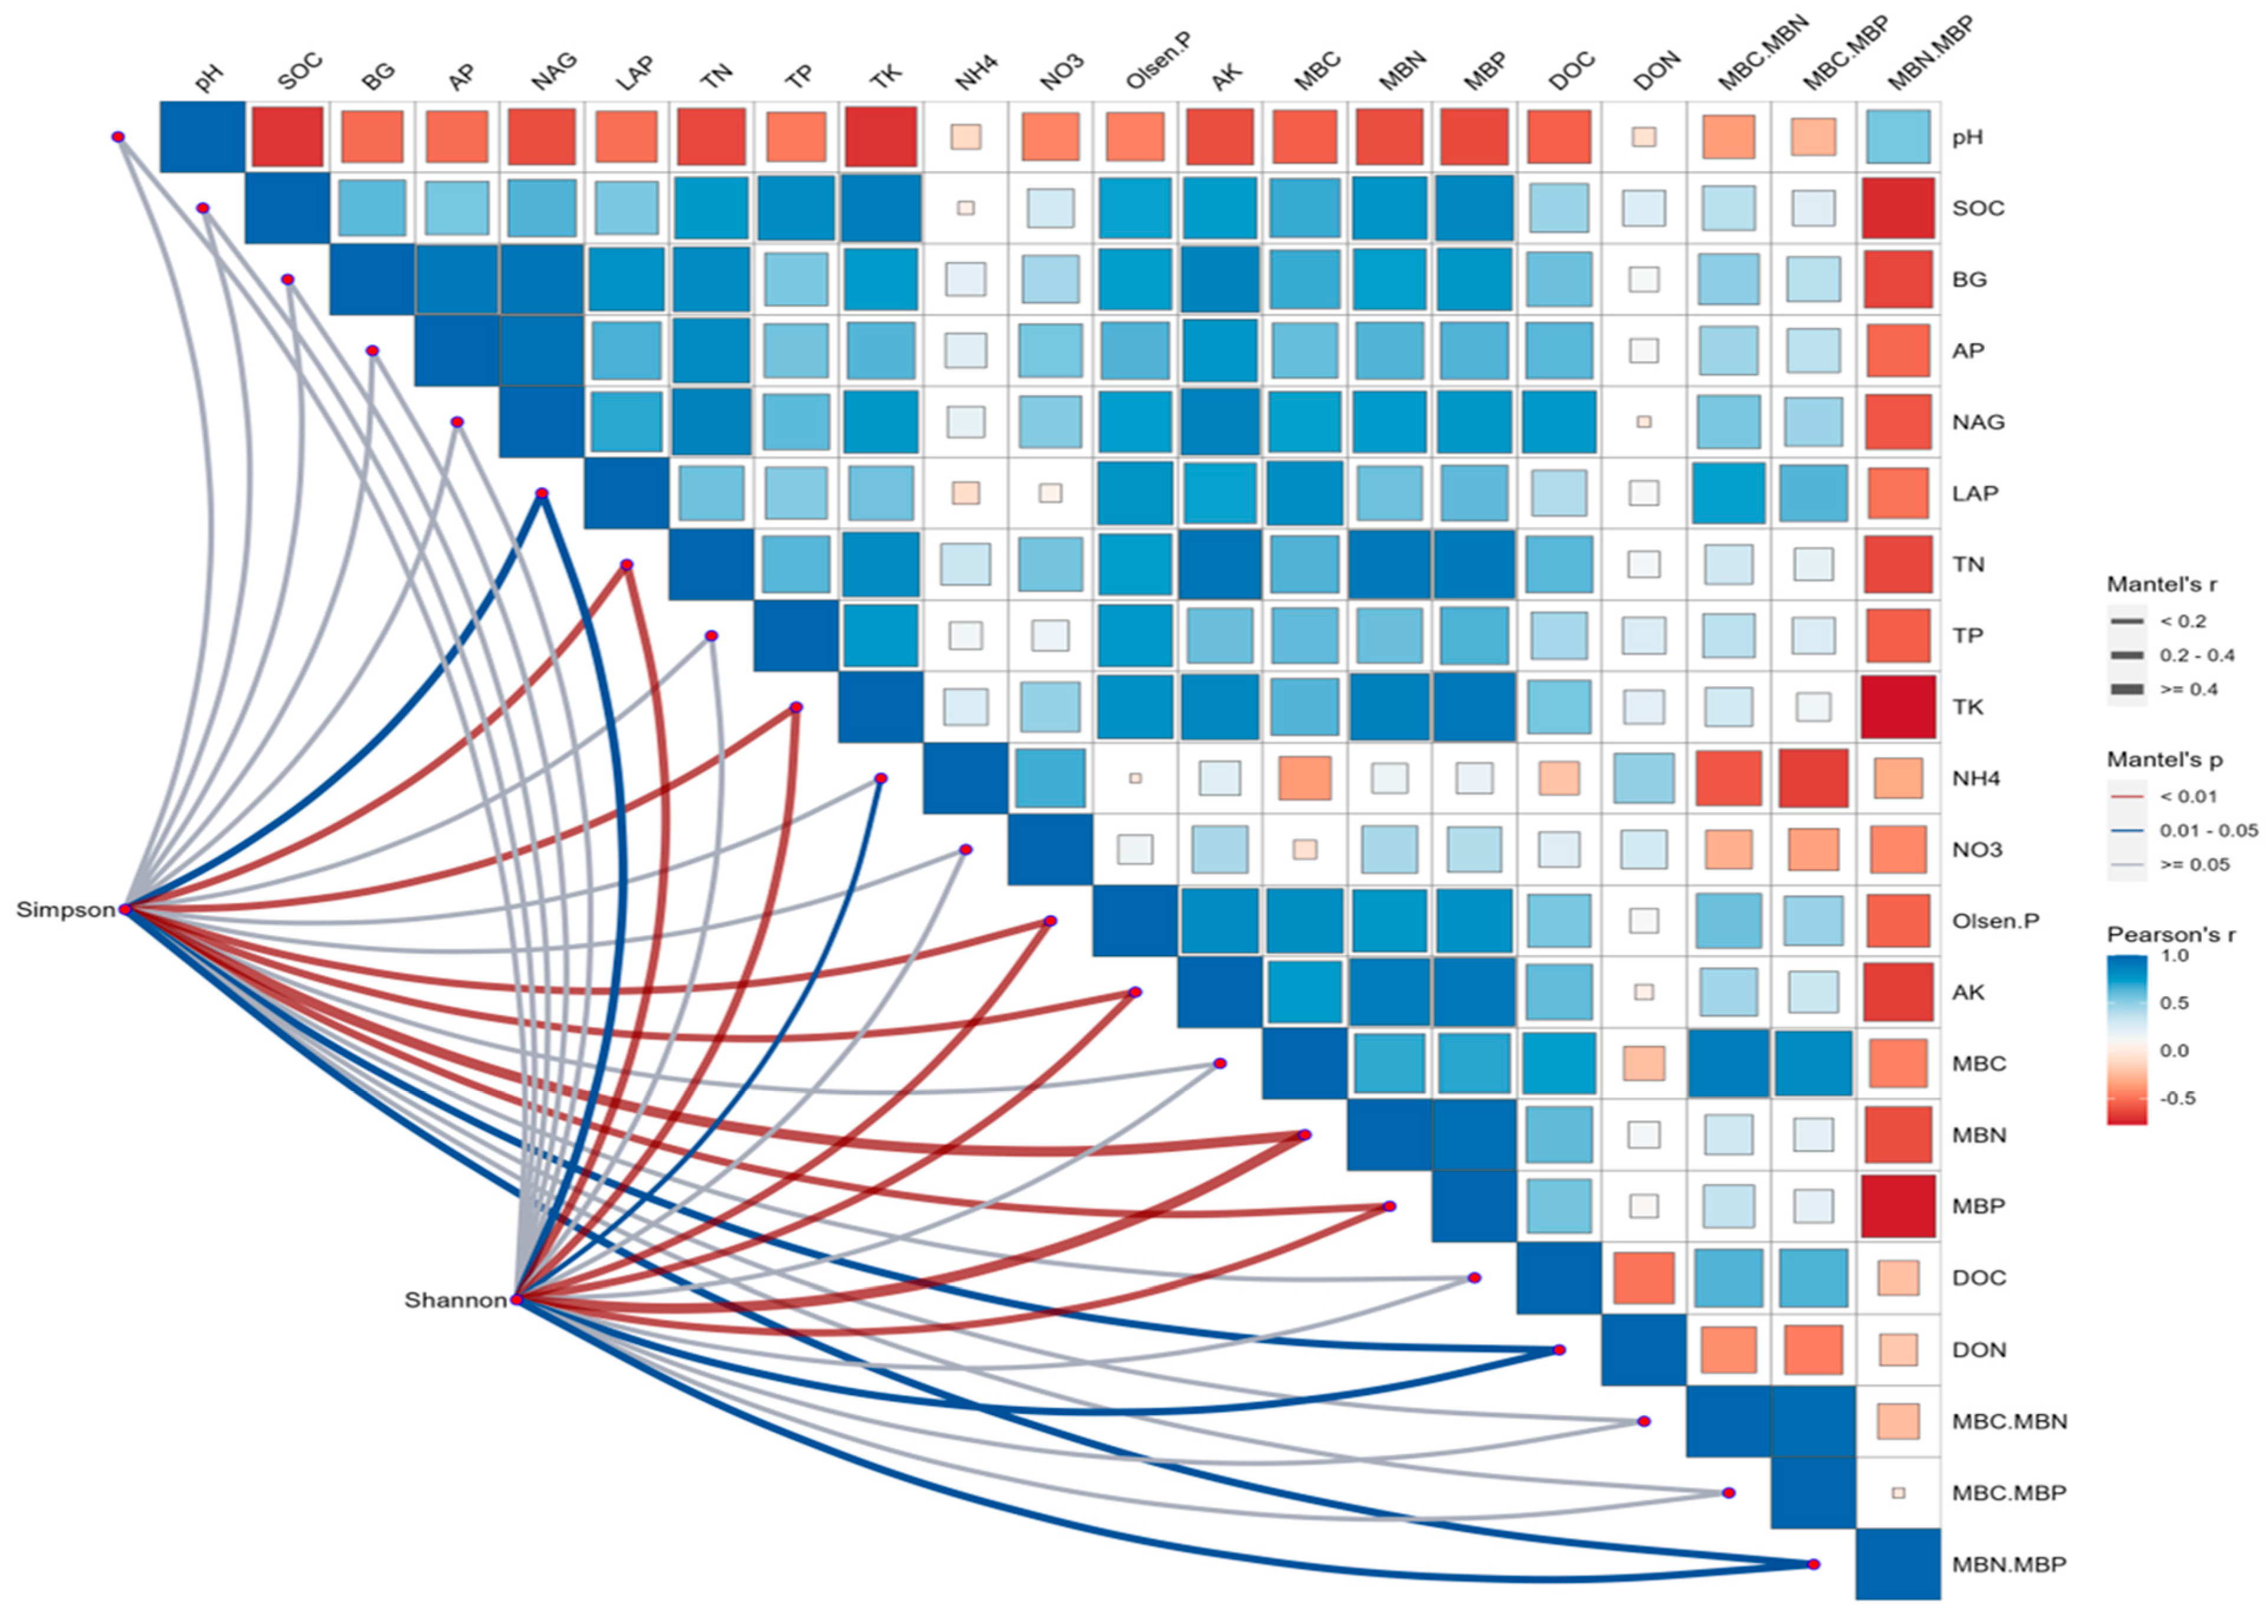
Article

Impact of Organic Fertilizer Substitution on Soil Microbial Communities and Cotton Yield in Xinjiang

by
Abudukeyoumu Abudurezike
1,2,†,
Fan Linxin
1,3,†,
Zhang Yan
1,3 and
Halihashi Yibati
1,3,*
1
Institute of Agricultural Resources and Environment, Xinjiang Uygur Autonomous Region Academy of Agricultural Sciences, Urumqi 830091, China
2
Crop Research Institute, Xinjiang Uygur Autonomous Region Academy of Agricultural Sciences, Urumqi 830091, China
3
Key Laboratory of Desert Oasis Crop Physiology, Ecology and Cultivation, Ministry of Agriculture and Rural Affairs, Urumqi 830091, China
*
Author to whom correspondence should be addressed.
These authors contributed equally to this work.
Agronomy 2025, 15(7), 1540; https://doi.org/10.3390/agronomy15071540
Submission received: 7 May 2025 / Revised: 13 June 2025 / Accepted: 20 June 2025 / Published: 25 June 2025
(This article belongs to the Section Soil and Plant Nutrition)

Abstract

Organic fertilizer substitution for chemical fertilizers is an important strategy for sustainable agriculture. This study aimed to investigate the effects of different organic nitrogen substitution ratios for a chemical nitrogen fertilizer on the soil microbial community structure in cotton fields. A three-year field experiment was conducted in Changji, Xinjiang, China, with six treatments: no fertilization (CK), a single application of chemical fertilizer (CF), and organic nitrogen substituting for 25% (T1), 50% (T2), 75% (T3), and 100% (T4) of a chemical nitrogen fertilizer. High-throughput sequencing was used to analyze the bacterial and fungal community structures. Results showed that organic substitution treatments significantly increased the bacterial Simpson and Shannon diversity indices compared to CK. At the phylum level, organic substitution treatments increased the relative abundance of Proteobacteria (1.27–22.44%), Gemmatimonadota (3.50–9.33%), and Actinobacteriota (17.25–38.57%) compared to CK. For fungi, organic substitution treatments improved the Simpson and Shannon indices, with the T2, T3, and T4 treatments showing significant increases. Organic substitution treatments increased the relative abundance of Ascomycota (2.05–14.75%), Basidiomycota (0.41–178.44%), and Glomeromycota (6.15–502.88%) compared to CK, while Rozellomycota was exclusively present in organic substitution treatments. Cotton yield data showed that the T1 treatment produced the highest seed cotton yield over the three-year study period, with significant increases of 6.19% compared to the CF treatment in the third year. These findings suggest that organic fertilizer substitution can effectively improve the soil microbial community structure and diversity, with moderate to high substitution ratios showing the most beneficial effects for maintaining soil health in cotton fields.

1. Introduction

Excessive application of chemical fertilizers in agricultural production has led to significant environmental problems, including soil degradation, nutrient imbalance, soil acidification, and an increase in soil-borne pathogens, all of which can negatively impact crop yield and soil health [1]. In cotton production, especially in arid regions like Xinjiang, China, long-term reliance on chemical fertilizers has caused soil compaction, a reduction in organic matter content, and alterations to the soil’s physical, chemical, and biological properties [2]. These shifts contribute to a cycle of soil degradation that affects microbial diversity, impairs nutrient cycling [3], and fosters the development of soil-borne pathogens, which can further exacerbate crop losses. Recent studies have shown that excessive inorganic nitrogen (N) use not only leads to nitrogen leaching but also induces shifts in the microbial communities, increasing the presence of pathogens, such as Fusarium and Verticillium, that are detrimental to cotton [1].
Organic fertilizers, which contain various nutrients and organic matter, can improve the soil structure, enhance microbial activity, and promote nutrient cycling. Organic fertilizers have been demonstrated to enhance soil microbial diversity and functionality across various cropping systems. In wheat production, organic amendments increased beneficial bacteria such as Rhizobium and Pseudomonas species, leading to improved nitrogen fixation and disease suppression [4]. Similar effects have been observed in maize systems, where organic fertilizer application enhanced arbuscular mycorrhizal fungi abundance by 35–50%, improving phosphorus uptake efficiency [5]. In vegetable cropping systems, organic fertilization increased soil enzyme activities, particularly β-glucosidase and alkaline phosphatase, by 25–40% compared to a chemical fertilizer alone [6].
Compost application provides multiple agricultural benefits beyond nutrient supply. It improves soil water retention capacity by 15–25%, reduces bulk density, and enhances soil aggregate stability [7]. Compost also serves as a slow-release nutrient source, reducing nutrient leaching by up to 30% compared to synthetic fertilizers [8]. Additionally, compost introduces beneficial microorganisms that can suppress soil-borne pathogens and enhance plant immunity through induced systemic resistance mechanisms [9]. The slow mineralization of organic matter in compost provides a sustained nutrient release pattern that better matches plant uptake requirements throughout the growing season.
Partial substitution of chemical fertilizers with organic fertilizers has been proposed as an effective strategy to maintain crop yields while improving soil health and reducing the negative environmental impact of excessive fertilizer use. Recent studies, such as Hiseq-based molecular characterization of soil microbial community, diversity structure, and predictive functional profiling in continuous cucumber planted soil affected by diverse cropping systems in an intensive greenhouse region of northern China [10], have highlighted the shift in microbial communities under nitrogen-induced conditions and its relationship to crop health, further supporting the need for alternative fertilization strategies. Previous studies have demonstrated that organic fertilizers, such as compost and manure, enrich soil microbial diversity by providing a steady source of carbon and nutrients. For example, research by Wang et al. (2020) [11] found that organic amendments enhance microbial diversity and activity in wheat and maize fields, improving nutrient cycling and soil health.
Soil microorganisms play crucial roles in maintaining soil ecosystem stability and promoting plant health [12]. They are involved in various biochemical processes, including organic matter decomposition, nutrient cycling, and the formation of soil aggregates [13]. The composition and diversity of soil microbial communities are considered sensitive indicators of soil quality and fertility [14]. Previous studies have shown that different fertilization practices can significantly affect the soil microbial community structure and function [1,3,15]. However, few studies have focused on the effects of different organic fertilizer substitution ratios on soil microbial communities, especially in cotton fields in arid regions.
Cotton is one of the most significant fiber crops globally, providing raw material for the textile industry. According to the latest reports from the Food and Agriculture Organization (FAO), global cotton production reached approximately 25.9 million tons in 2023/24, with China, India, and the United States being the largest producers, accounting for over 65% of global production [16]. Cotton fiber is used in approximately 40% of global textile production, making it one of the most economically important natural fibers worldwide [17]. Xinjiang is the largest cotton-producing region in China, accounting for more than 80% of the country’s total cotton production. The sustainable development of cotton production in this region faces challenges from soil degradation and environmental concerns associated with intensive chemical fertilizer use. Understanding how different organic fertilizer substitution ratios affect soil microbial communities is essential for developing sustainable fertilization strategies for cotton production in this region.
High-throughput sequencing technology has revolutionized microbial ecology research by enabling the comprehensive analysis of microbial community composition and diversity [1,13]. This technology allows for the detection of both culturable and unculturable microorganisms, providing a more comprehensive understanding of the microbial community structure.
The objective of this study was to investigate the effects of different organic nitrogen substitution ratios for chemical nitrogen fertilizers on soil bacterial and fungal community structures in cotton fields in Xinjiang and to examine how these changes relate to cotton yield. We hypothesized that (1) organic fertilizer substitution would increase soil microbial diversity compared to chemical fertilizer alone; (2) different organic substitution ratios would have varying effects on the microbial community composition; and (3) changes in the microbial community structure would correlate with cotton yield performance. The findings of this study would provide valuable insights into developing sustainable fertilization strategies for cotton production in arid regions, particularly those dealing with soil degradation and pathogen-related yield losses.

2. Materials and Methods

2.1. Experimental Site

The field experiment was conducted from 2021 to 2023 at the Agricultural Extension Center Experimental Station in Changji, Xinjiang, China (44°6′25.00″ N, 87°20′2.14″ E). The region has a temperate continental climate with an average annual precipitation of 280 mm, an average frost-free period of 170 days, and an accumulated temperature (≥10 °C) of 3300 °C. The soil at the experimental site is classified as gray desert soil, which is categorized as sandy loam. The site has been monocropping cotton for several years, with no significant crop rotation. This historical practice may have an impact on the microbial community composition, and this context is important for interpreting the results of the organic fertilizer substitution experiment. The initial soil physicochemical properties (0–20 cm depth) were as follows: a pH of 8.54, an organic matter concentration of 12.19 g/kg, a total nitrogen concentration of 0.34 g/kg, a total phosphorus concentration of 0.71 g/kg, a total potassium concentration of 6.45 g/kg, a nitrate nitrogen concentration of 7.05 mg/kg, an ammonium nitrogen concentration of 4.73 mg/kg, an available phosphorus concentration of 15.69 mg/kg, and an available potassium concentration of 120.00 mg/kg.

2.2. Experimental Design

The experiment was designed as a randomized complete block with six treatments and three replicates. Each plot was 11 m × 6.4 m (70.4 m2). The treatments were as follows: (1) CK: no fertilization; (2) CF: a single application of chemical fertilizer (N 220 kg/hm2, P2O5 90 kg/hm2, and K2O 60 kg/hm2); (3) T1: organic nitrogen substituting for 25% of the chemical nitrogen fertilizer; (4) T2: organic nitrogen substituting for 50% of the chemical nitrogen fertilizer; (5) T3: organic nitrogen substituting for 75% of the chemical nitrogen fertilizer; and (6) T4: organic nitrogen substituting for 100% of the chemical nitrogen fertilizer. Urea (N 46%), superphosphate (P2O5 46%), monoammonium phosphate (N 12%, P2O5 60%), and potassium sulfate (K2O 50%) were used as chemical fertilizers. The commercial organic fertilizer (cattle manure compost) with an organic matter content of ≥32.4%, a water content of 21.60%, a N content of 2.92%, a P2O5 content of 1.57%, and a K2O content of 0.61% was used. The organic fertilizer and 70% of the phosphorus fertilizer were applied as the base fertilizer before sowing. The nitrogen fertilizer was applied in six split applications during the cotton growing season according to the nutrient requirements at different growth stages: 10% at the budding stage, 20% at the full budding stage, 30% at the initial flowering stage, 20% at the full flowering stage, 10% at the boll stage, and 10% at the full boll stage. The remaining 30% of the phosphorus fertilizer was applied at the budding stage, and the potassium fertilizer was applied in two equal splits at the budding and boll stages.
Cotton (variety ‘Xinluzao 57’) was planted using a drip irrigation system under plastic film mulching with four rows per film. The sowing dates were 24 April 2021, 25 April 2022, and 2 May 2023. The harvesting dates were 10 October 2021, 12 October 2022, and 30 September 2023.

2.3. Soil Sampling and Analysis

After the cotton was harvested on 30 September 2023, soil samples were collected from the 0–20 cm soil layer. Ten soil cores were randomly collected from each plot and mixed to form a composite sample. The composite samples were divided into two parts: one part was air-dried for basic soil property analysis, and the other part was passed through a 2 mm sieve and stored at −80 °C for microbial diversity analysis.

2.4. DNA Extraction and High-Throughput Sequencing

Soil DNA was extracted using the PowerSoil® DNA Isolation Kit (MO BIO Laboratories (QIAGEN), Shanghai, China (Chinese distributor)) MO BIO Laboratories (QIAGEN), Shanghai, China (Chinese distributor) according to the manufacturer’s instructions. The DNA quality was checked by 1% agarose gel electrophoresis, and the DNA concentration was measured using a NanoDrop 2000 spectrophotometer (Thermo Fisher Scientific, Shanghai, China). For bacterial community analysis, the V3-V4 region of the 16S rRNA gene was amplified using the primers 338F (5′-ACTCCTACGGGAGGCAGCAG-3′) and 806R (5′-GGACTACHVGGGTWTCTAAT-3′) [18]. For fungal community analysis, the ITS1 region was amplified using the primers ITS1F (5′-CTTGGTCATTTAGAGGAAGTAA-3′) and ITS2R (5′-GCTGCGTTCTTCATCGATGC-3′) [19]. PCR reactions were performed in a 30 μL mixture containing 15 μL of the Phusion® High-Fidelity PCR Master Mix (New England Biolabs, Beijing, China (Chinese distributor)), 0.2 μM of each primer, and 10 ng of the template DNA. The PCR conditions were as follows: initial denaturation at 98 °C for 1 min, followed by 30 cycles of denaturation at 98 °C for 10 s, annealing at a specific temperature for 30 s, extension at 72°C for 30 s, and a final extension at 72 °C for 5 min. The PCR products were purified using the GeneJET Gel Extraction Kit (Thermo Fisher Scientific, Shanghai, China). Sequencing libraries were generated using the Ion Plus Fragment Library Kit (Thermo Fisher Scientific, Shanghai, China) following the manufacturer’s recommendations. The quality of the libraries was assessed using the Qubit® 2.0 Fluorometer (Thermo Fisher Scientific, Shanghai, China) and the Agilent Bioanalyzer 2100 system (Agilent Technologies, Beijing, China). The libraries were sequenced on the Ion S5™ XL platform (Thermo Fisher Scientific, Shanghai, China) to generate 400 bp/600 bp single-end reads.

2.5. Bioinformatics Analysis

Raw sequences were filtered to remove low-quality sequences, chimeras, and non-target sequences using QIIME 2 (version 2019.4) [4]. The filtered sequences were clustered into operational taxonomic units (OTUs) at a 97% similarity threshold using the UPARSE algorithm (version 7.0.1001) [5]. Taxonomic assignment was performed using the RDP Classifier against the Silva database (16S rRNA) and the UNITE database (ITS) with a confidence threshold of 70%. Alpha diversity indices, including Chao1, ACE, Simpson, Shannon, and the PD whole tree, were calculated using QIIME 2. Differential abundance analysis was performed using DESeq2 (v1.30.0) with a false discovery rate (FDR) threshold of 0.05. Taxa with a log2 fold change of >1.5 and an adjusted p-value of <0.05 were considered significantly different. Venn diagrams were constructed to visualize the shared and unique OTUs across treatments using the VennDiagram package (version 1.6.20) in R (version 4.0.3).
Beta diversity was assessed using non-metric multidimensional scaling (NMDS) based on Bray–Curtis dissimilarity matrices, with statistical significance tested using PERMANOVA (adonis function in vegan package) with 999 permutations. Principal coordinate analysis (PCoA) was also performed to complement the NMDS analysis and provide additional visualization of microbial community compositional differences among treatments.

2.6. Cotton Yield Measurement

At harvest, seed cotton yield was determined by hand-picking all bolls from a sampling area of 6.67 m2 in each plot. The number of plants and the number of bolls per plant were counted, and 50 bolls from the upper, middle, and lower parts of the plants were collected to determine the average boll weight. Seed cotton yield (kg/hm2) was calculated using the following equation:
Seed Cotton Yield (kg/ha) = (Number of Bolls per Plant × Plant Population (plants/ha) × Average Boll Weight (g))/1000

2.7. Statistical Analysis

All statistical analyses were performed using the SPSS 26.0 (IBM China, Beijing, China) and R software (version 4.0.3). One-way analysis of variance (ANOVA) followed by Duncan’s multiple range test was used to determine significant differences among treatments at p < 0.05. A quadratic regression model was used to analyze the relationship between organic substitution ratios and cotton yield to determine the optimal organic fertilizer substitution ratio.

2.8. Data Availability

The raw sequencing data generated in this study were deposited in the NCBI Sequence Read Archive (SRA) under the BioProject accession number PRJNA [187542].

3. Results

3.1. Cotton Yield Response to Organic Fertilizer Substitution

The effects of different fertilization treatments on cotton yield over the three-year study period (2021–2023) are shown in Figure 1. All fertilization treatments significantly increased seed cotton yield compared to the control (CK) treatment across all three years. In 2021, the seed cotton yield ranged from 2785 kg/hm2 in CK to 3448 kg/hm2 in the T1 treatment. The T1 treatment (25% organic substitution) produced the highest yield (3448 kg/hm2), which was 23.79% higher than the CK treatment. Although T1 showed a numerical advantage over CF (chemical fertilizer only, 3252 kg/hm2), this difference was not statistically significant in the first year. The T2 treatment (50% organic substitution) produced a comparable yield to T1, while the T3 (75% organic substitution) and T4 (100% organic substitution) treatments showed progressively lower yields, though still significantly higher than CK. In 2022, a similar trend was observed with yield ranges from 3326 kg/hm2 in CK to 4316 kg/hm2 in the T1 treatment. The T1 treatment again produced the highest yield, representing a 29.76% increase compared to CK. The T1, T2, and CF treatments formed a statistically similar group with the highest yields, followed by T3, while T4 showed the lowest yield among fertilization treatments though still significantly higher than CK. The regression analysis of the relationship between organic substitution ratios and cotton yield revealed an optimal organic substitution ratio of 23.61%, which closely matches the T1 treatment (25%).
In 2023, the seed cotton yield across treatments ranged from 4714 kg/hm2 in CK to 5784 kg/hm2 in the T1 treatment. Notably, in the third year, the T1 treatment not only produced the highest yield (5784 kg/hm2) but also showed a statistically significant 6.19% increase compared to the CF treatment (5447 kg/hm2). This represents a 22.71% yield increase compared to CK. The T2 treatment maintained a yield level comparable to that of CF, while the T3 and T4 treatments showed lower yields but were still significantly higher than CK. The regression analysis of the relationship between organic substitution ratios and cotton yield revealed an optimal organic substitution ratio of 23.61%, which closely matches the T1 treatment (25%). This suggests that a relatively low organic substitution rate is sufficient to achieve optimal yield benefits while reducing the chemical fertilizer input. Higher substitution rates (T3 and T4) did not further increase the yield, possibly because they could not provide sufficient readily available nutrients during the critical growth stages of cotton plants. The three-year data indicate that the T1 treatment consistently outperformed other treatments, with the yield advantage becoming more pronounced and statistically significant by the third year. This finding suggests that the cumulative benefits of appropriate organic fertilizer substitution can enhance soil fertility and crop productivity over time while demonstrating the potential for reducing chemical fertilizer use without compromising cotton yields in Xinjiang’s agricultural systems.

3.2. Soil Bacterial Community Analysis

3.2.1. Sequencing Statistics and Bacterial OTUs

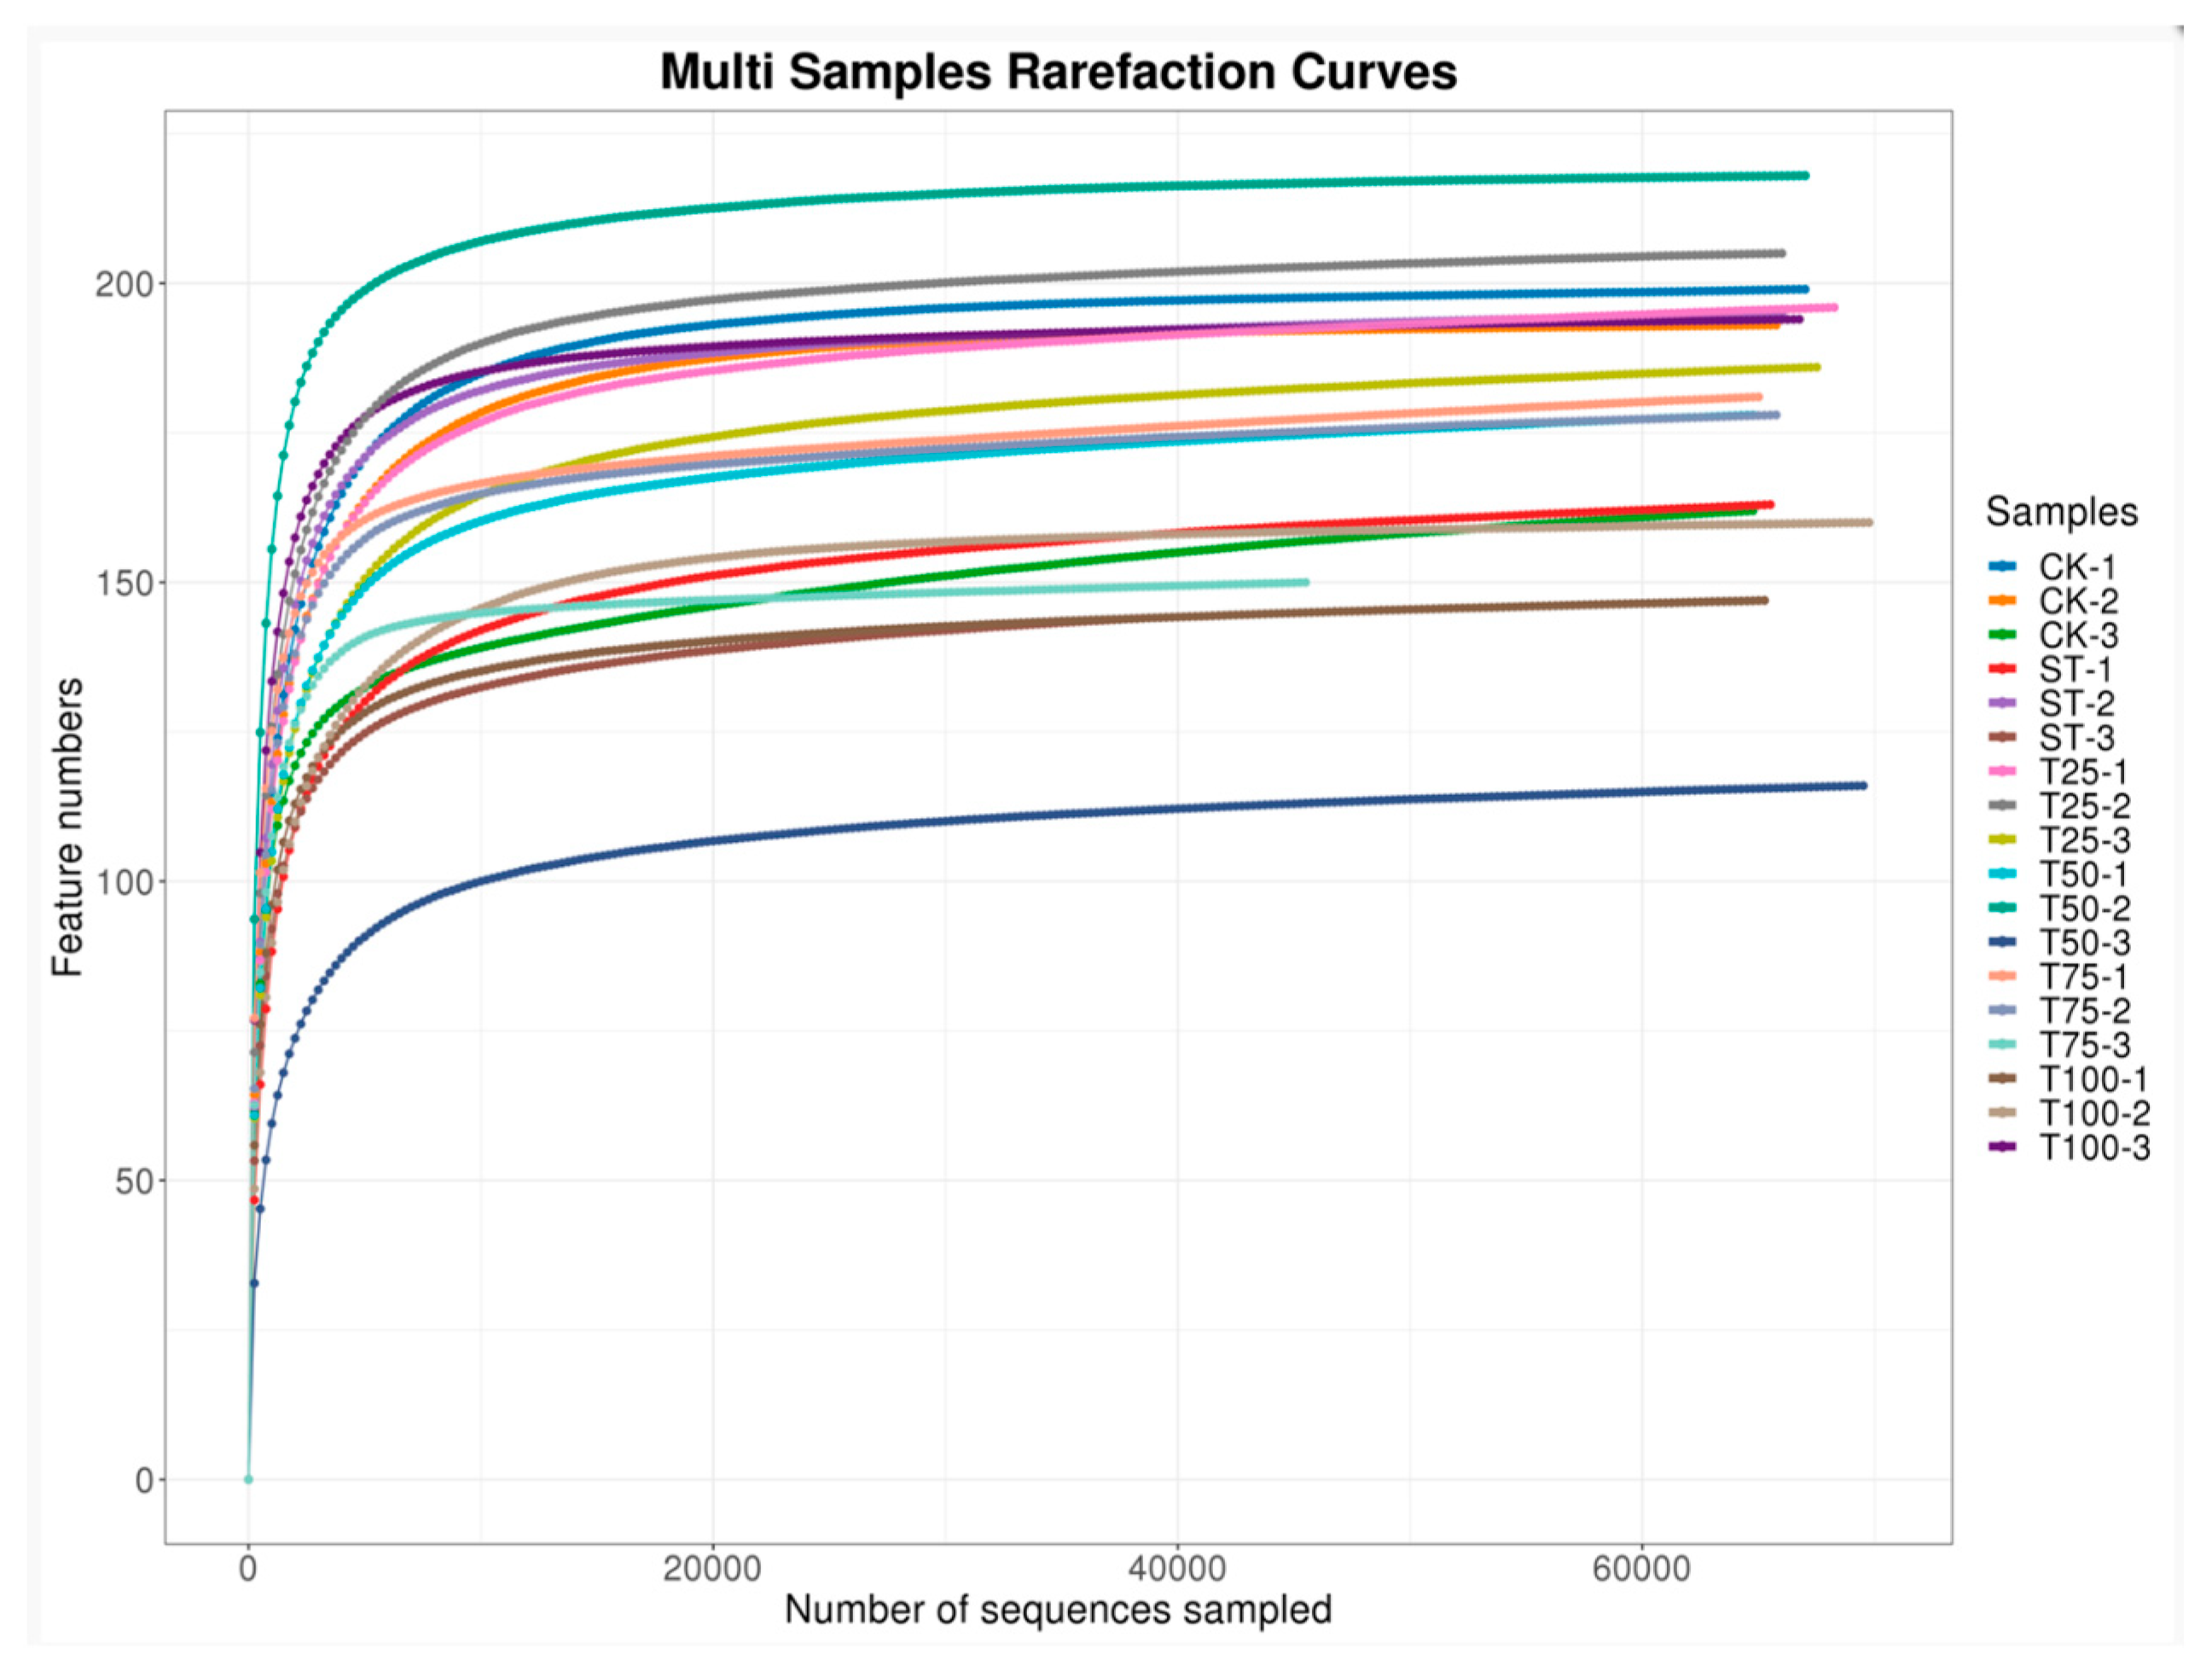
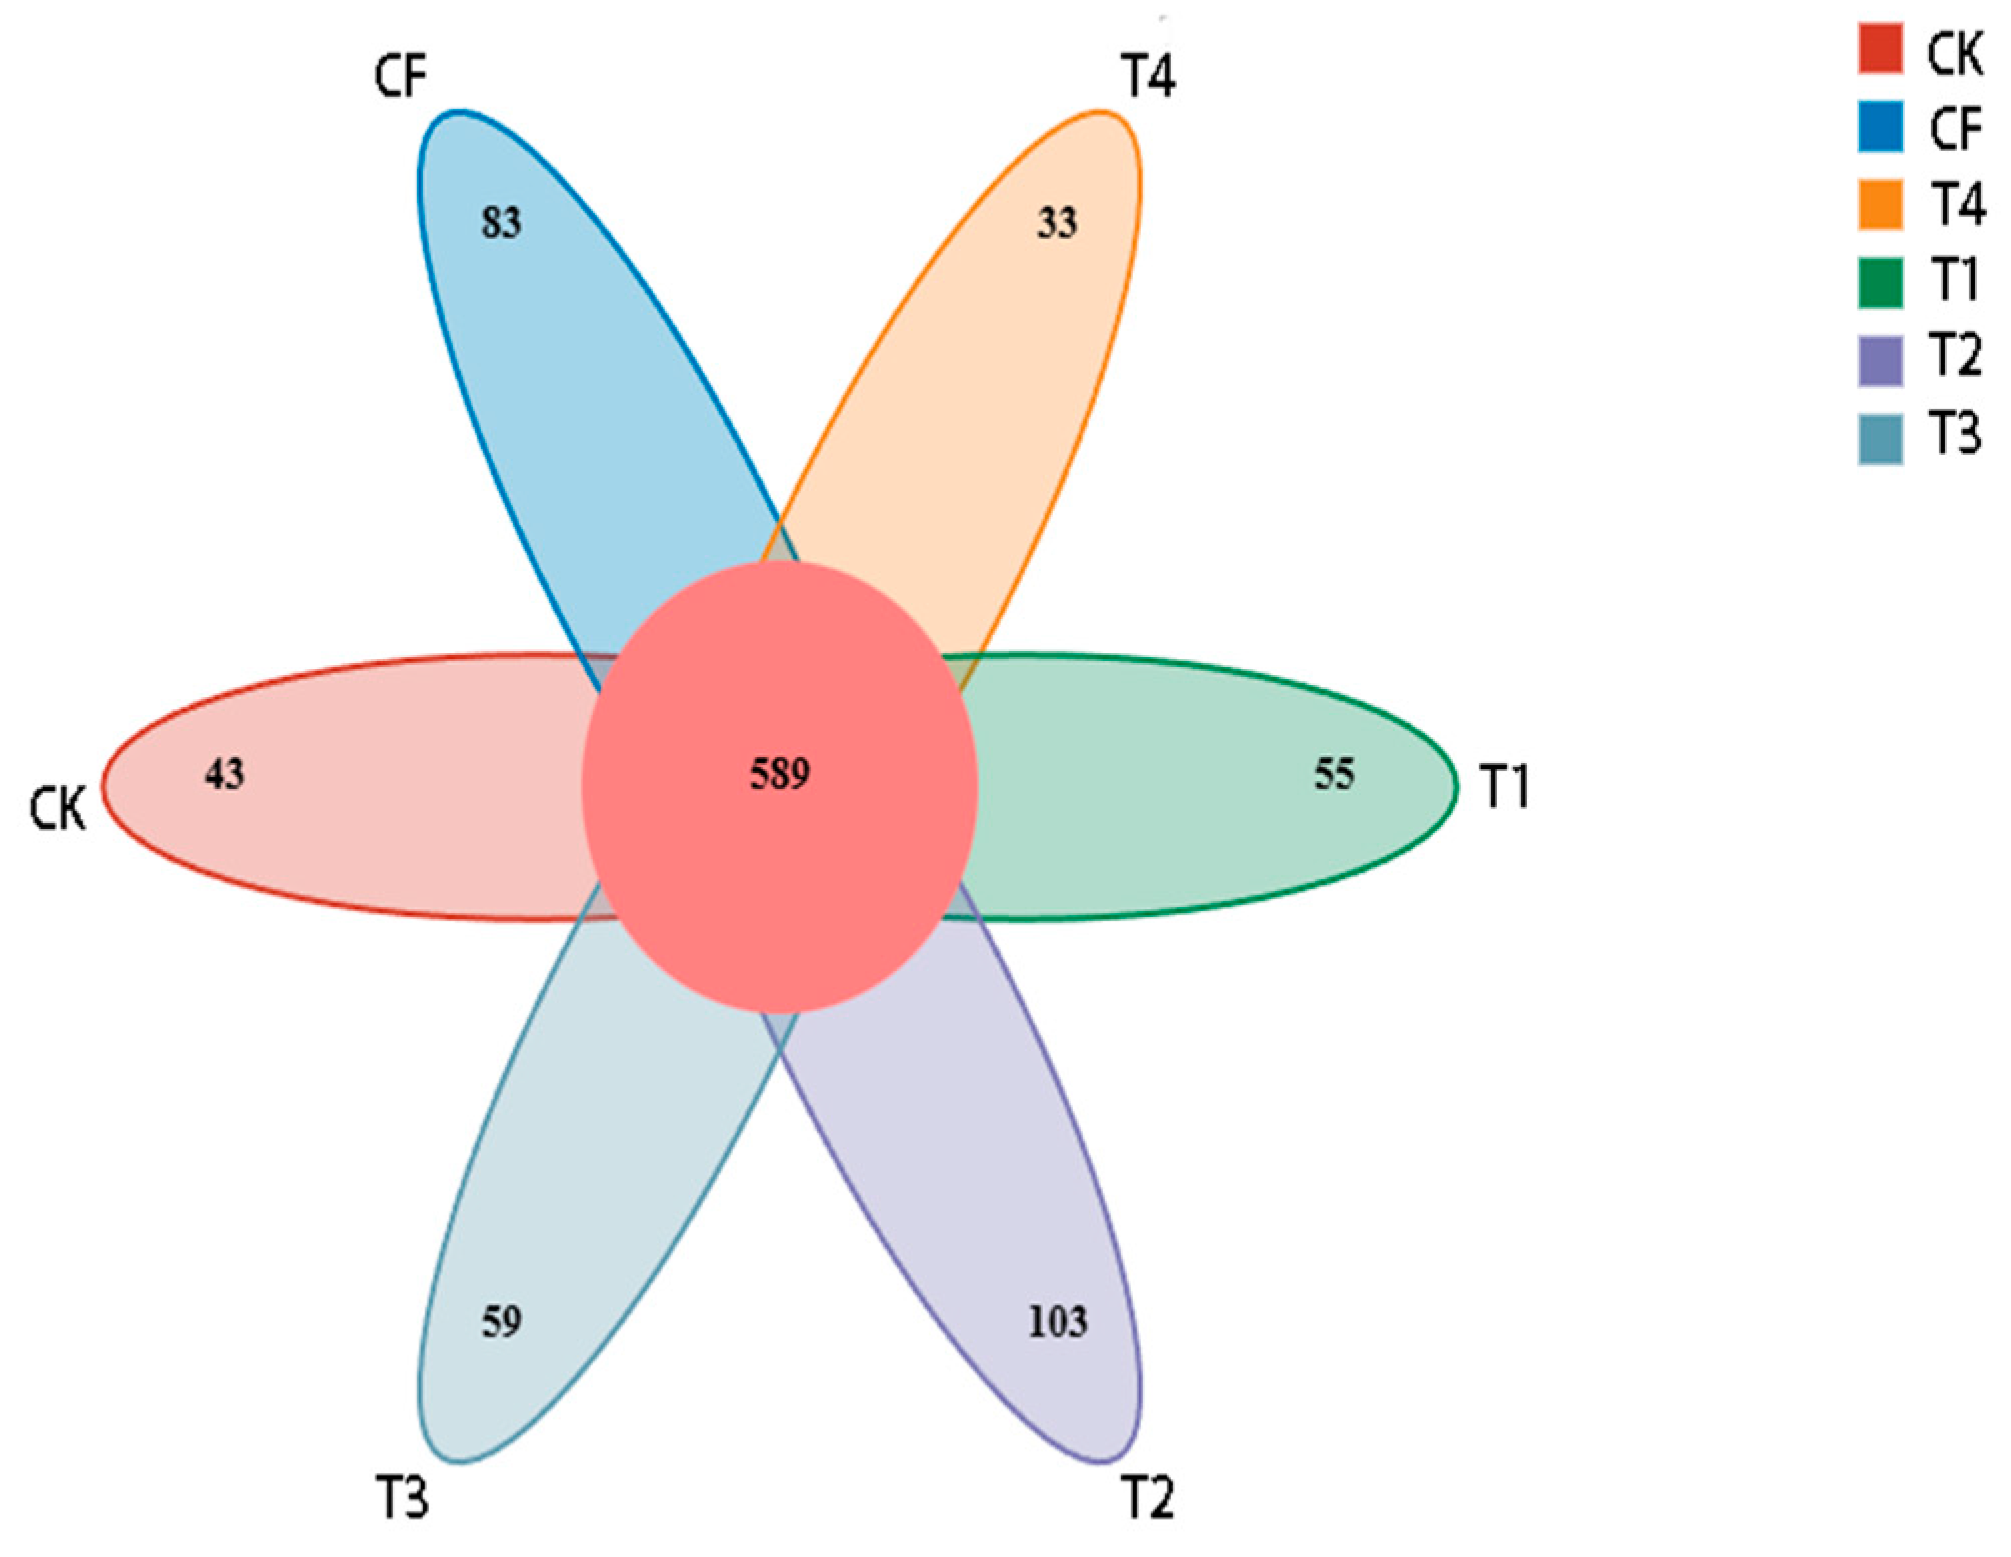
A total of 1,847,362 high-quality bacterial sequences were obtained across all samples, with an average of 28,895 ± 3247 bacterial reads per sample. After quality filtering and chimera removal, these sequences were clustered into operational taxonomic units (OTUs). Rarefaction curve analysis confirmed that sequencing depth was sufficient for all samples, with curves reaching saturation plateaus (Figure 2). A total of 2706 bacterial OTUs were identified, with the T3 treatment having the highest number (926 OTUs). Venn diagram analysis (Figure 3) showed that 589 OTUs were common to all treatments. The T2 treatment had the highest number of unique OTUs (102), while the T4 treatment had the lowest (33). Taxonomic classification revealed 27 phyla, 54 classes, 143 orders, 260 families, 434 genera, and 482 species of bacteria in the soil samples.
The Venn diagram shows the distribution of unique and shared operational taxonomic units (OTUs) across different fertilization treatments, where CK = no fertilization; CF = the chemical fertilizer only; T1 = 25% organic nitrogen substitution; T2 = 50% organic nitrogen substitution; T3 = 75% organic nitrogen substitution; and T4 = 100% organic nitrogen substitution. The numbers in the overlapping areas represent the shared OTUs between treatments, while the numbers in the non-overlapping areas represent the unique OTUs for each treatment. The central number (589) represents the OTUs common to all treatments.
At different taxonomic levels, the T1 treatment had the highest number of phyla and orders, the T4 treatment had the highest number of classes and families, and the CF treatment had the highest number of genera and species (Table 1). Compared to CK, all fertilization treatments significantly increased the number of bacterial taxa at various classification levels.

3.2.2. Bacterial Alpha Diversity

The coverage of sequencing data was over 99.99% for all samples, indicating sufficient sequencing depth (Table 2). The Chao1 and ACE indices of organic substitution treatments were significantly higher than those of CK, with increases of 7.00–23.54%. The Simpson index was highest in the high-substitution treatments (T3 and T4). The Shannon index and the PD whole tree index were significantly higher in the T1, T3, and T4 treatments compared to the CK and T2 treatments.

3.2.3. Bacterial Community Composition at the Phylum Level

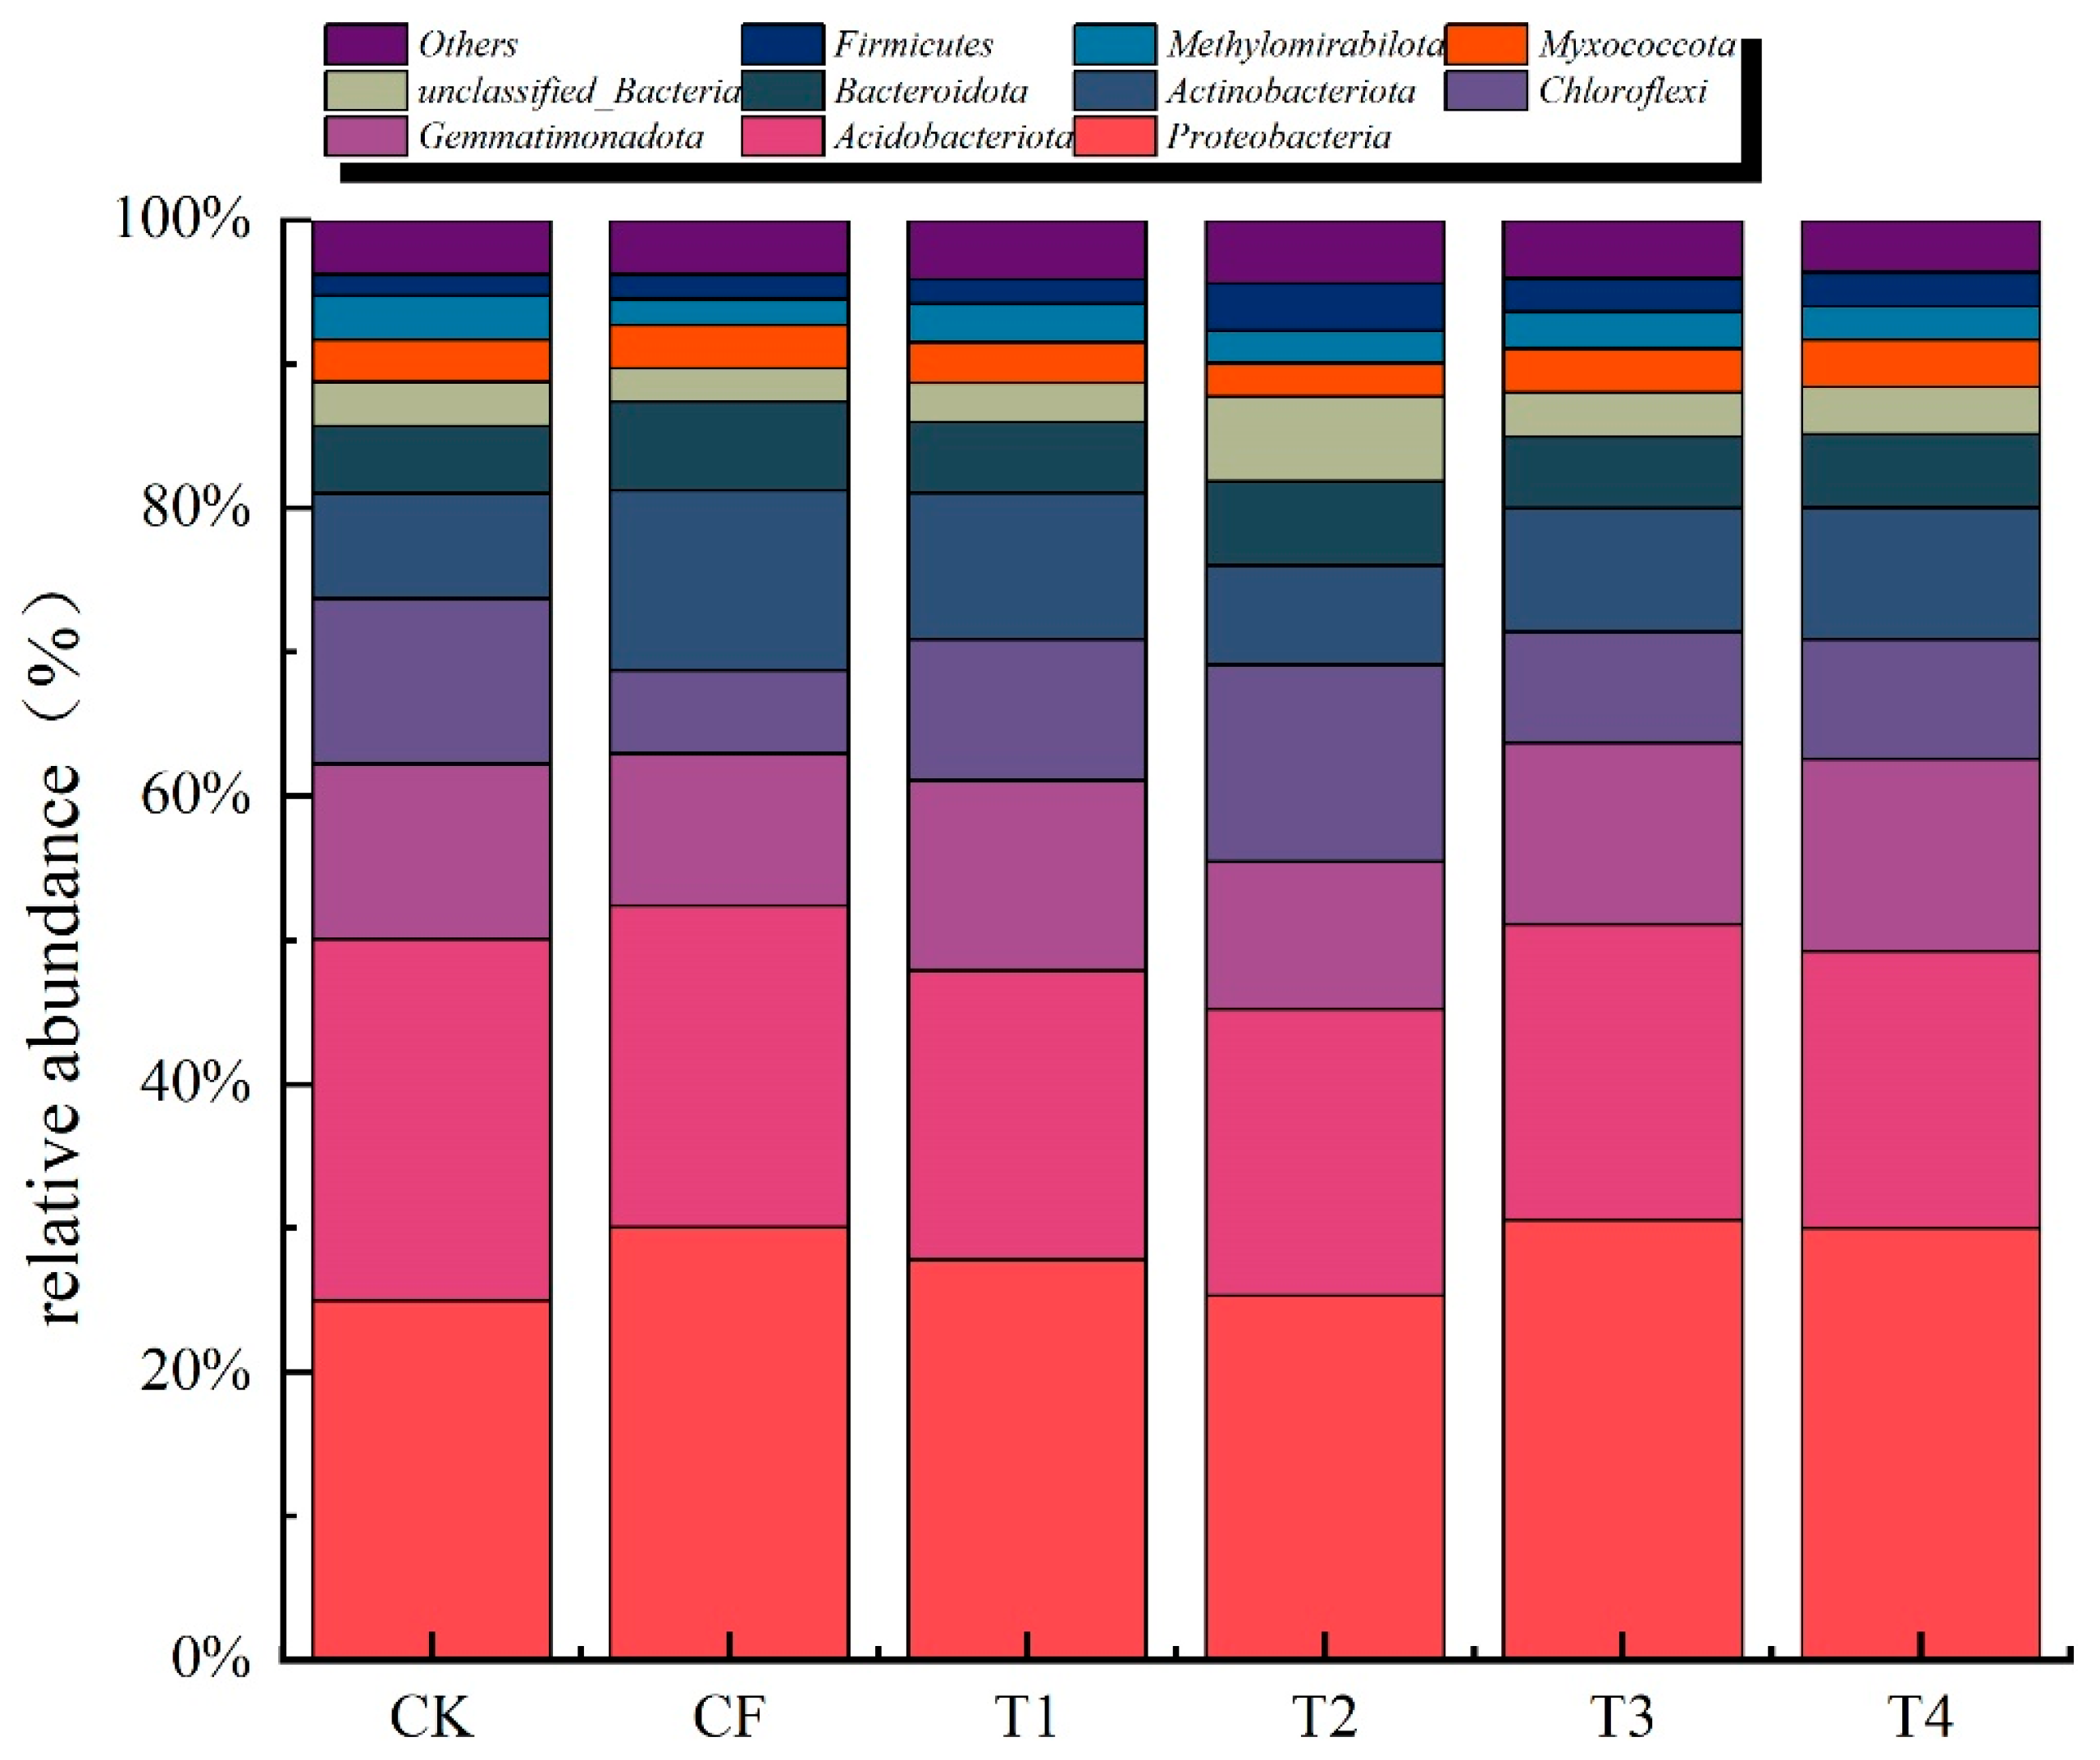
The top 10 bacterial phyla across all treatments were Proteobacteria (24.95–30.55%), Acidobacteriota (19.22–25.10%), Gemmatimonadota (10.23–13.32%), Chloroflexi (5.74–13.71%), Actinobacteriota (6.88–12.52%), Bacteroidota (4.69–6.18%), unclassified_Bacteria (2.31–5.90%), Myxococcota (2.34–3.24%), Methylomirabilota (1.76–3.04%), and Firmicutes (1.48–3.25%) (Figure 4).
The stacked bar chart shows the relative abundance (%) of the top 10 bacterial phyla across different fertilization treatments, where CK = no fertilization; CF = the chemical fertilizer only; T1 = 25% organic nitrogen substitution; T2 = 50% organic nitrogen substitution; T3 = 75% organic nitrogen substitution; and T4 = 100% organic nitrogen substitution. Only phyla with a relative abundance of >1% in at least one treatment are shown.
Compared to CK, organic substitution treatments increased the relative abundance of Proteobacteria by 1.27–22.44%, Gemmatimonadota by 3.50–9.33% (except T2, which decreased by 16.03%), and Actinobacteriota by 17.25–38.57%. Compared to CF, the organic substitution treatments T1, T3, and T4 decreased the relative abundance of Proteobacteria by 0.07–15.79%, while the treatments T1, T3, and T4 increased the relative abundance of Gemmatimonadota by 18.73–25.41%. The organic substitution treatments also affected other phyla to varying degrees. The T1, T3, and T4 treatments decreased the relative abundance of Chloroflexi compared to CK but increased it compared to CF. The T2, T3, and T4 treatments increased the relative abundance of unclassified_Bacteria compared to both CK and CF. The T3 and T4 treatments increased the relative abundance of Myxococcota compared to CK and CF.

3.2.4. Bacterial Community Composition at the Genus Level

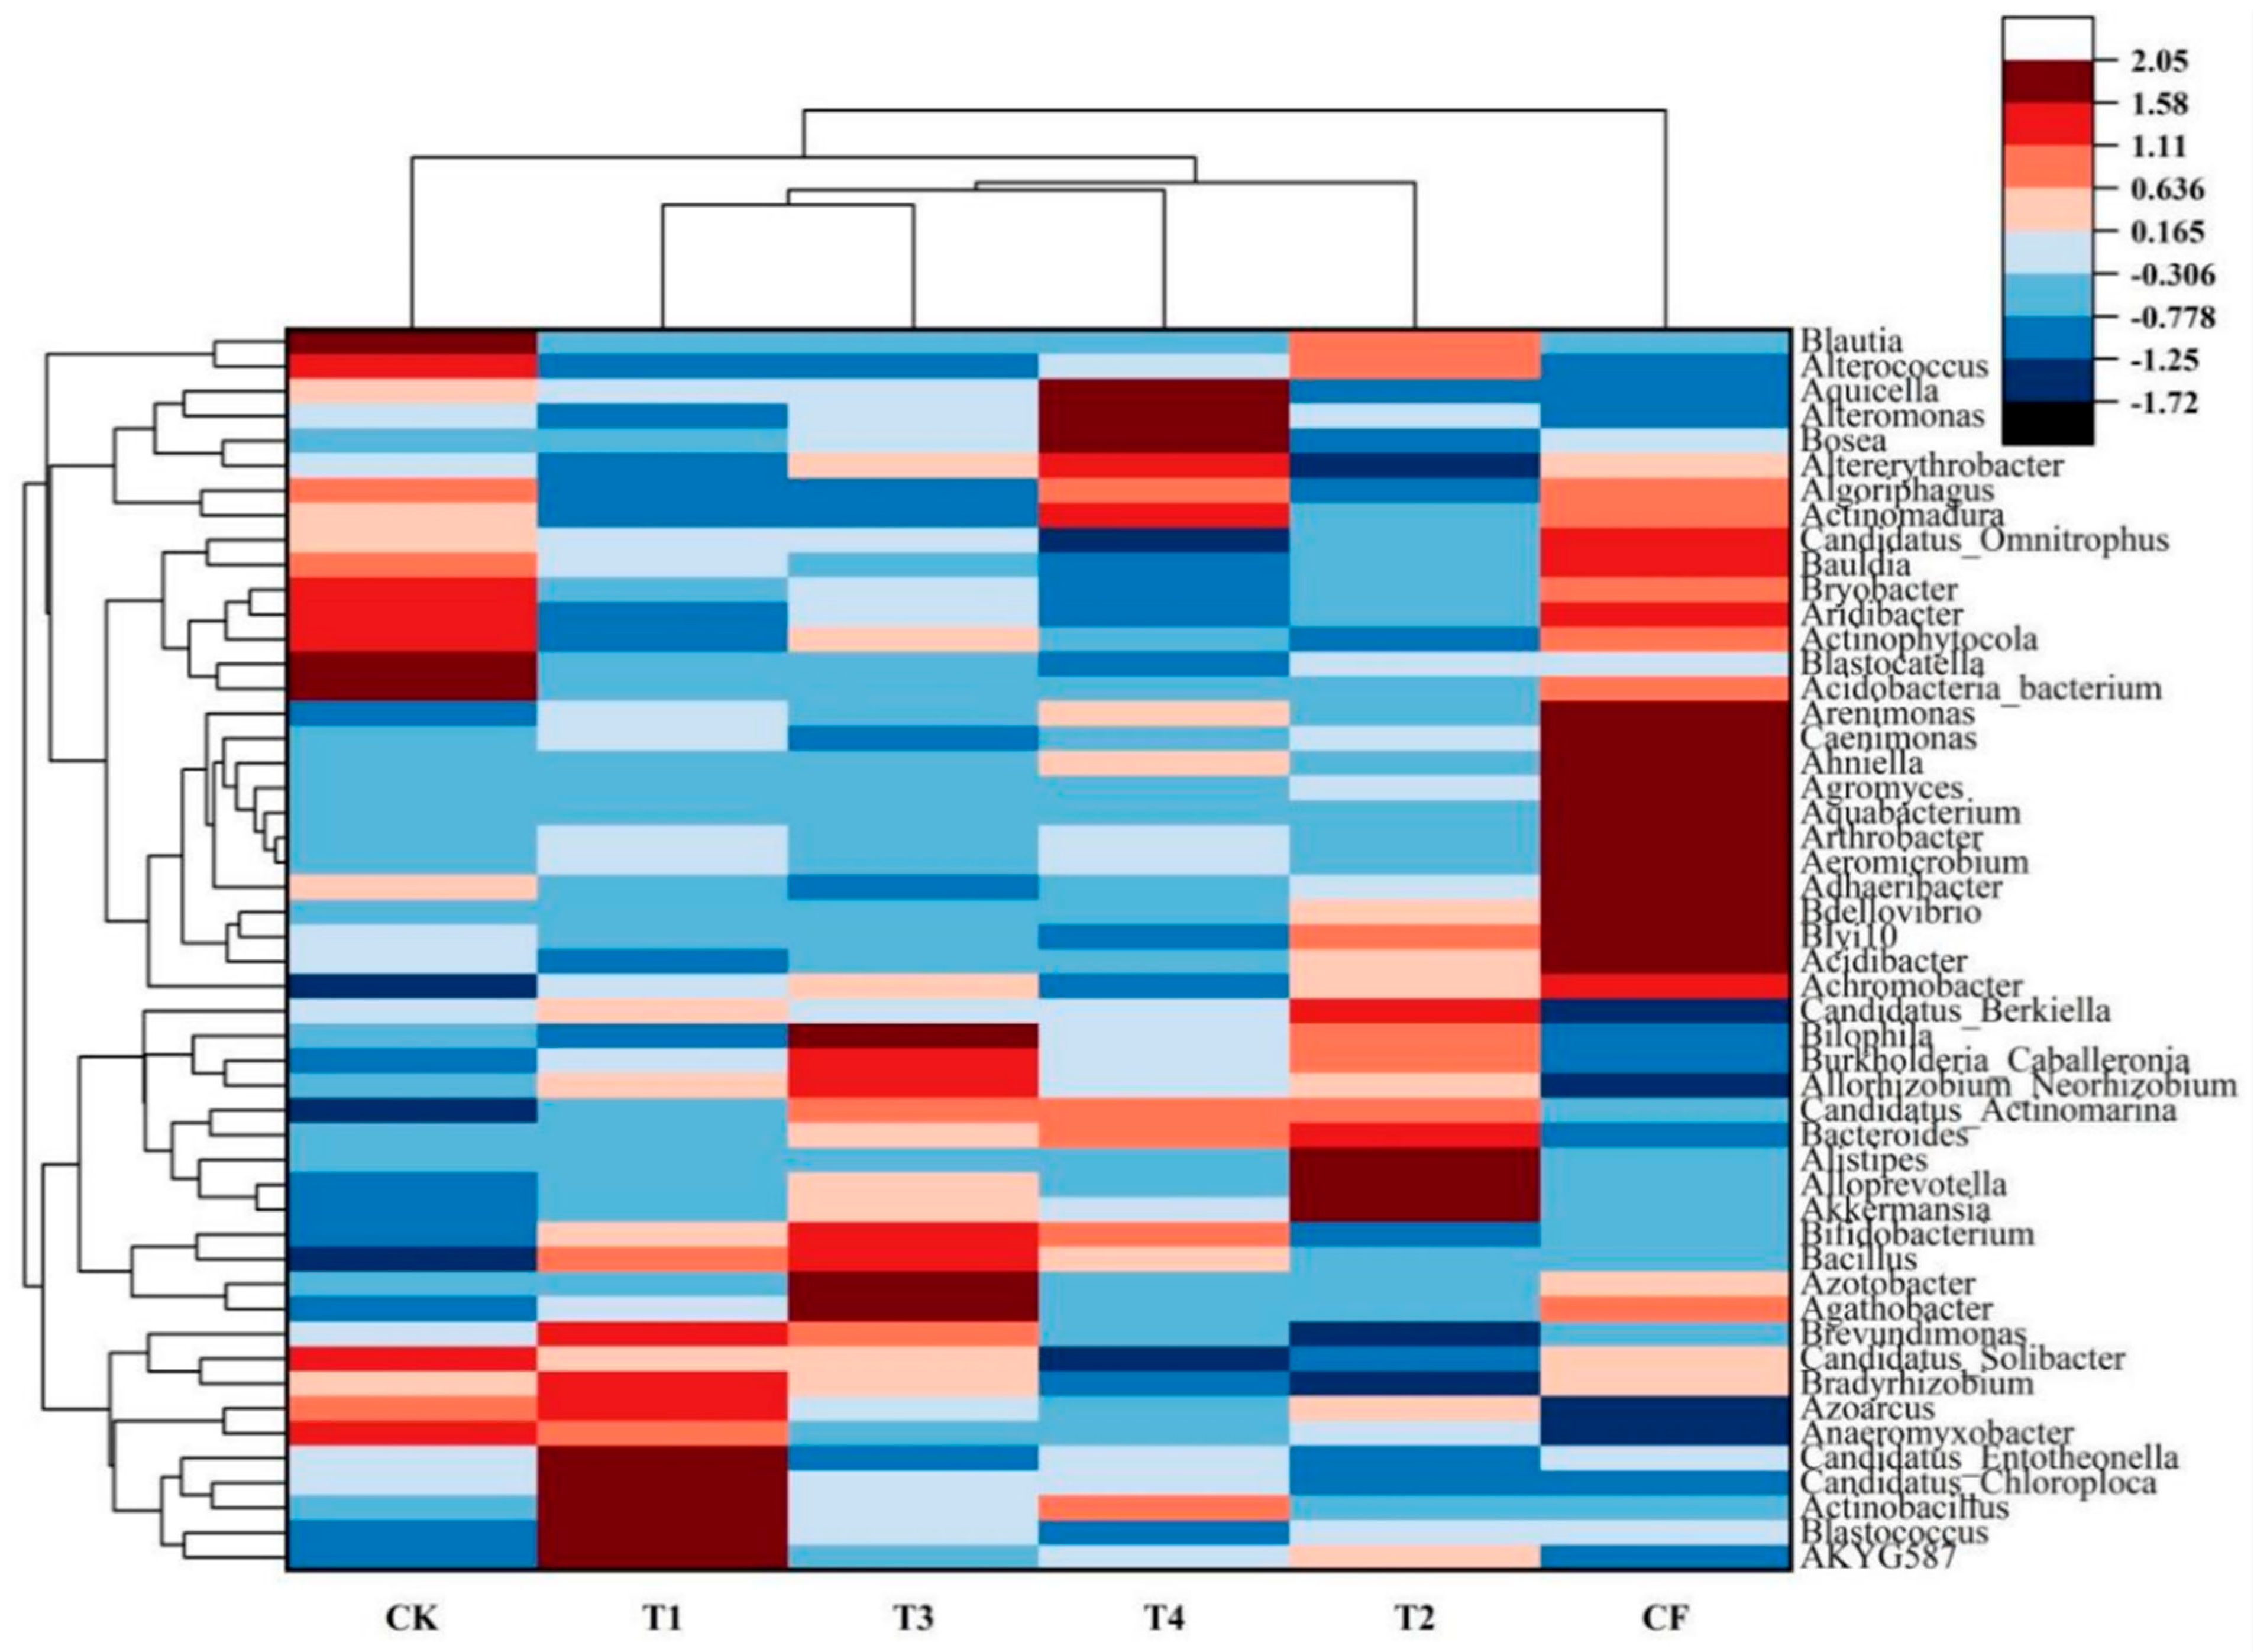
Cluster analysis of the top 50 bacterial genera showed that organic substitution treatments (T1, T2, T3, and T4) clustered together, separate from the CK and CF treatments (Figure 5). The T1 and T3 treatments showed the highest similarity, followed by the T4 and T2 treatments.
The heatmap shows the relative abundance of the top 50 bacterial genera across different fertilization treatments, where CK = no fertilization; CF = the chemical fertilizer only; T1 = 25% organic nitrogen substitution; T2 = 50% organic nitrogen substitution; T3 = 75% organic nitrogen substitution; and T4 = 100% organic nitrogen substitution. The color scale represents the relative abundance of genera, with red indicating higher abundance and blue indicating lower abundance. Dendrograms show the hierarchical clustering of treatments (top) and genera (left) based on their Euclidean distance and the Ward linkage method.
Different treatments had different dominant genera. The CK treatment had higher relative abundances of Acidobacteria_bacterium_LWQ13 and Blastocatella. The CF treatment had higher relative abundances of Acidibacter, Bhyi10, Bdellovibrio, Adhaeribacter, Aeromicrobium, Aridibacter, Aquabacterium, Agromyces, Ahniella, Caenimonas, and Arenimonas. The T1 treatment had higher relative abundances of AKYG587, Actinobacillus, Blastococcus, Candidatus_Chloroploca, and Candidatus_Entotheonella. The T2 treatment had higher relative abundances of Akkermansia, Alloprevotella, and Alistipes. The T3 treatment had higher relative abundances of Azotobacter, Agathobacter, and Bilophila. The T4 treatment had higher relative abundances of Aquicella, Arenimonas, and Bosea.

3.2.5. Bacterial Differential Abundance Analysis

DESeq2 analysis identified 127 significantly differentially abundant bacterial taxa across treatments (log2 fold change > 1.5, adjusted p-value < 0.05) (Figure 6). Notable taxa showing significant enrichment in organic substitution treatments included Azotobacter (log2FC = 2.3 in T3 vs. CK, padj < 0.001), Rhizobium (log2FC = 1.8 in T1 vs. CF, padj < 0.01), and Streptomyces (log2FC = 2.1 in T4 vs. CK, padj < 0.001). Conversely, potential pathogenic taxa such as Fusarium showed significant depletion in organic treatments (log2FC = −1.9 in T1 vs. CK, padj < 0.05).

3.3. Soil Fungal Community Analysis

3.3.1. Fungal OTUs and Species Richness

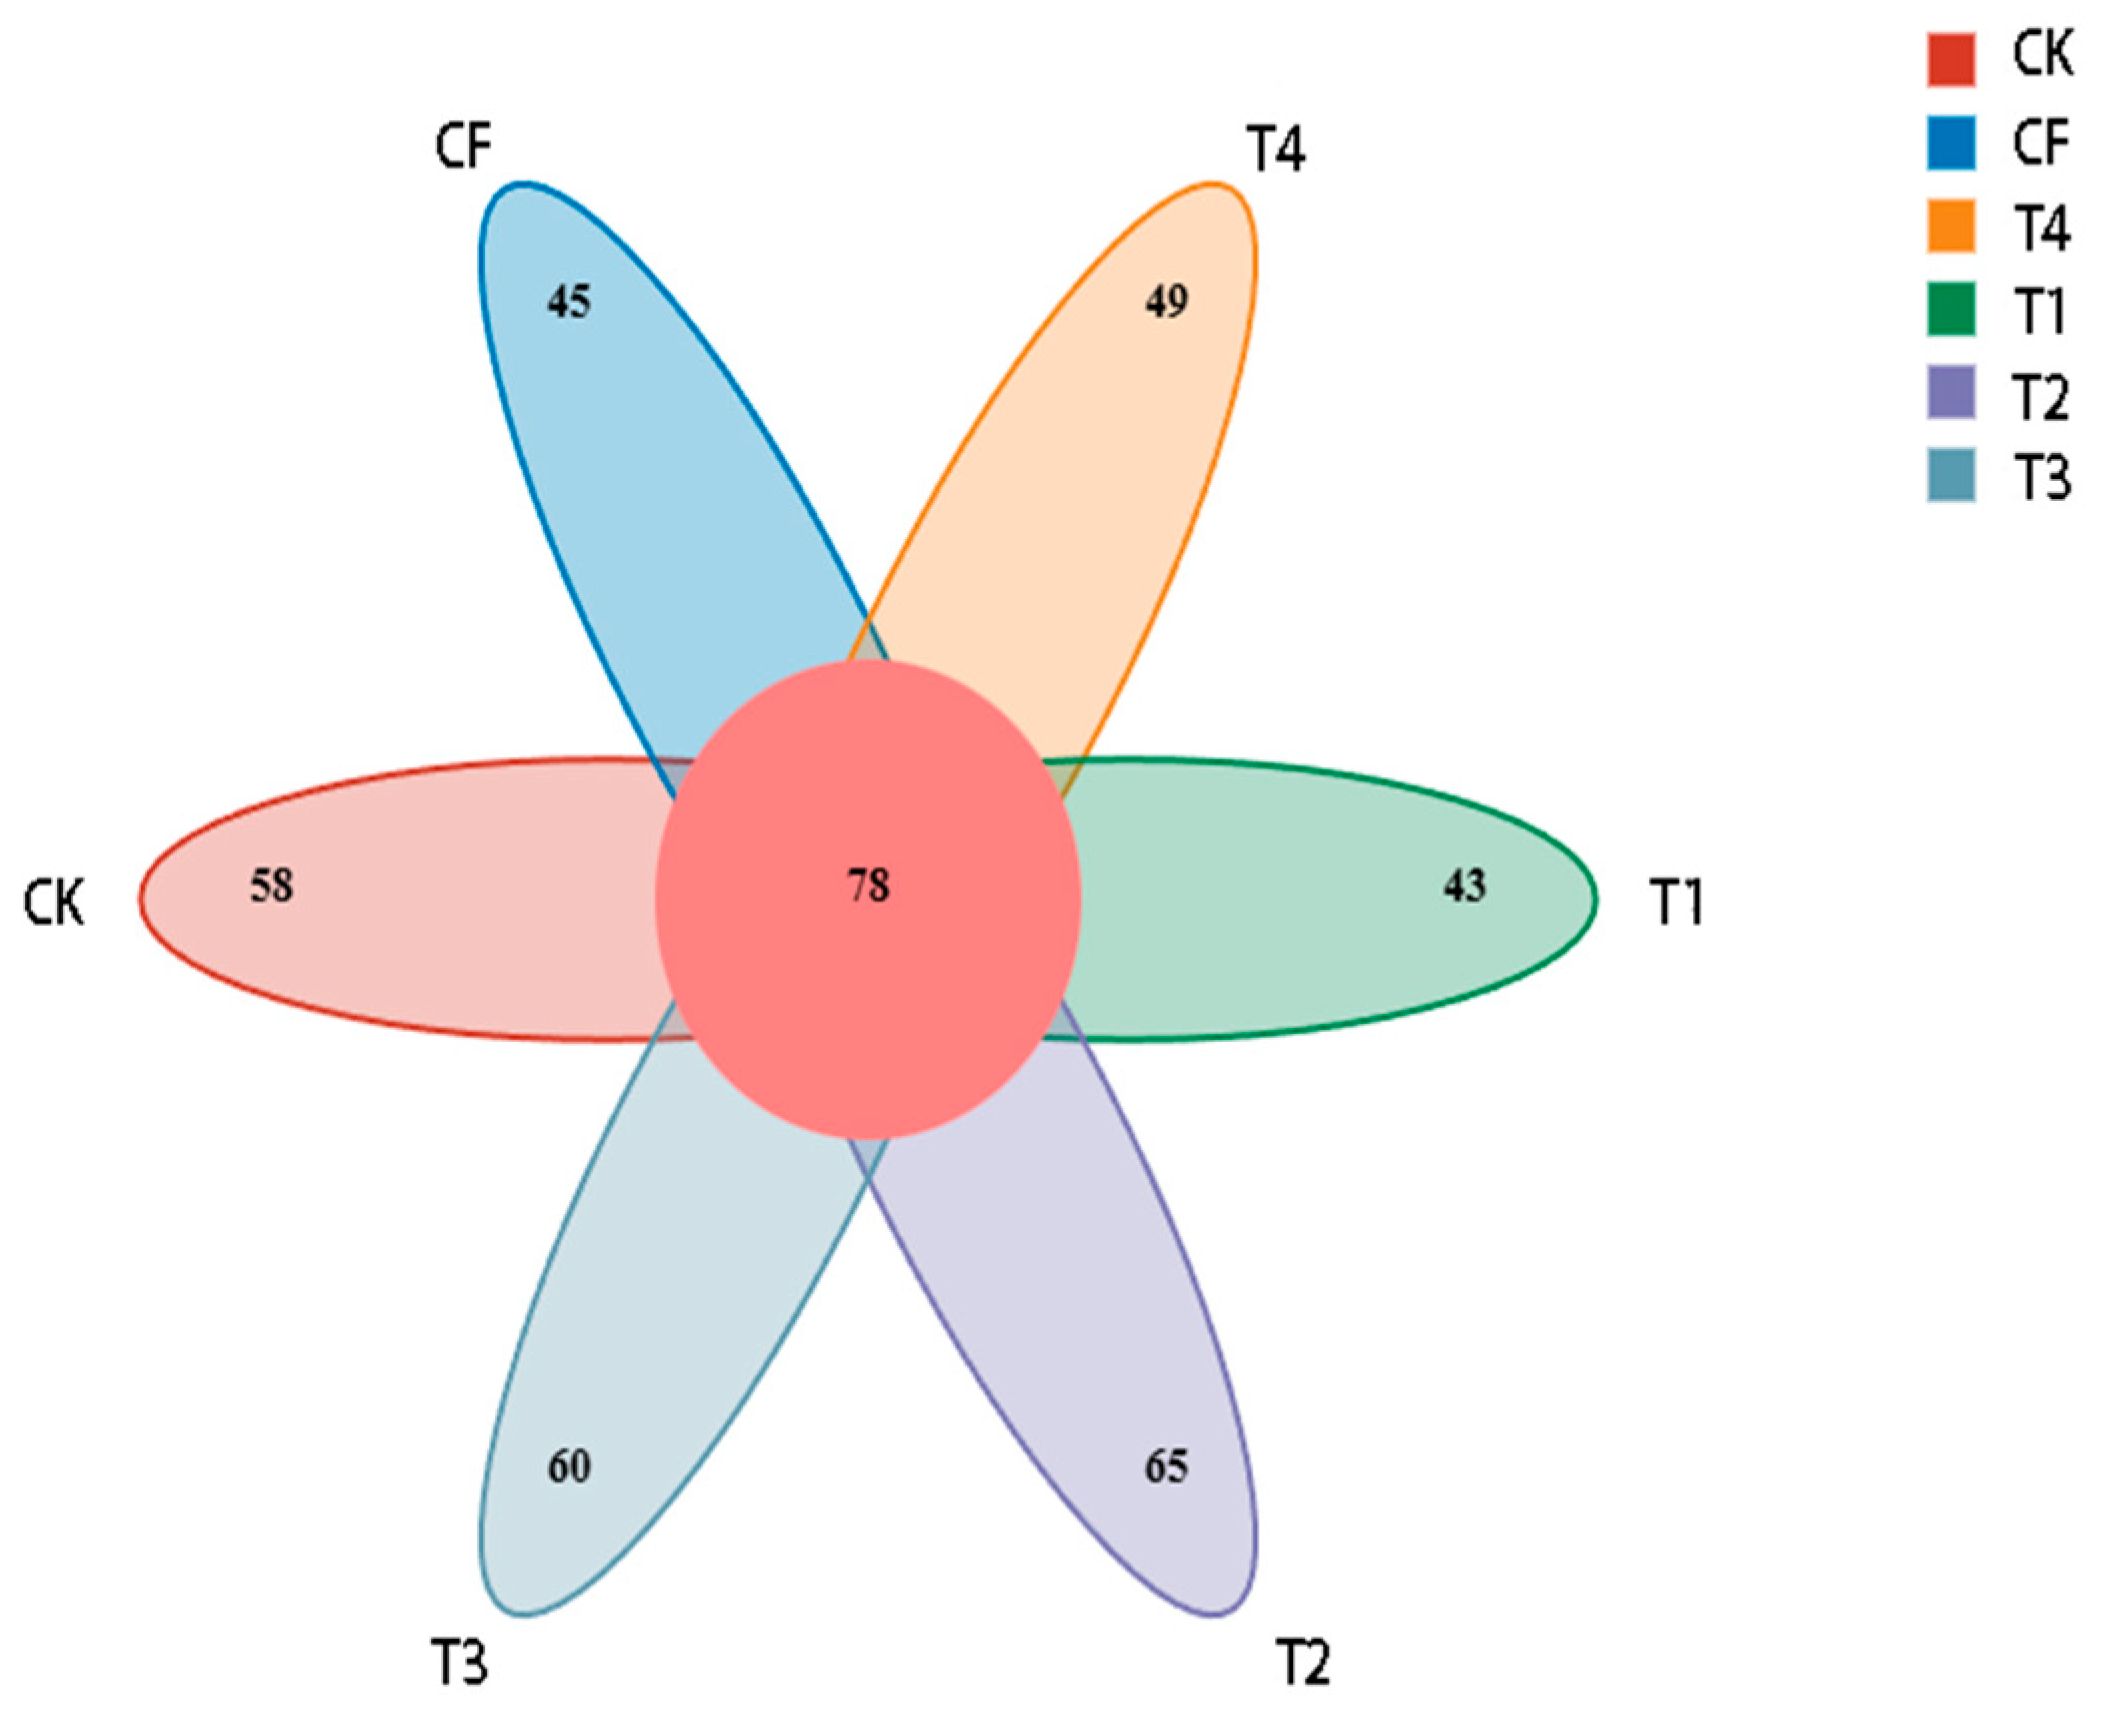
A total of 892,156 high-quality fungal sequences were obtained across all samples, with an average of 13,940 ± 2156 fungal reads per sample. Rarefaction curve analysis demonstrated adequate sequencing depth for all samples. A total of 851 fungal OTUs were identified, with the T2 treatment having the highest number (196 OTUs). Venn diagram analysis (Figure 7) showed that 78 OTUs were common to all treatments. The T2 treatment had the highest number of unique OTUs (65), while the T1 treatment had the lowest (43).
The Venn diagram illustrates the distribution of unique and shared operational taxonomic units (OTUs) across different fertilization treatments for fungal communities, where CK = no fertilization; CF = the chemical fertilizer only; T1 = 25% organic nitrogen substitution; T2 = 50% organic nitrogen substitution; T3 = 75% organic nitrogen substitution; and T4 = 100% organic nitrogen substitution. The numbers in the overlapping areas represent the shared OTUs between treatments, while the numbers in the non-overlapping areas represent the unique OTUs for each treatment. The central number (78) represents the OTUs common to all treatments
Taxonomic classification revealed eight phyla, 25 classes, 55 orders, 101 families, 183 genera, and 244 species of fungi in the soil samples (Table 3). The T4 treatment had the highest number of phyla, classes, and orders, while the T2 treatment had the highest number of families, genera, and species. Compared to CK, organic substitution treatments increased the number of fungal phyla, but the differences in the number of classes, orders, families, genera, and species were not significant.

3.3.2. Fungal Alpha Diversity

The coverage of sequencing data was over 99.98% for all samples (Table 4). The Chao1 and ACE indices showed that the low-organic-substitution treatment (T1) increased these indices by 1.86% and 2.04%, respectively, compared to CK, while high-organic-substitution treatments decreased them by 1.34–13.48% and 1.28–18.94%, respectively. The Simpson index was highest in the T3 treatment, and the Shannon index was highest in the T4 treatment. The PD whole tree index was highest in the T2 treatment, followed by the T3, T1, CF, and T4 treatments.

3.3.3. Fungal Community Composition at the Phylum Level

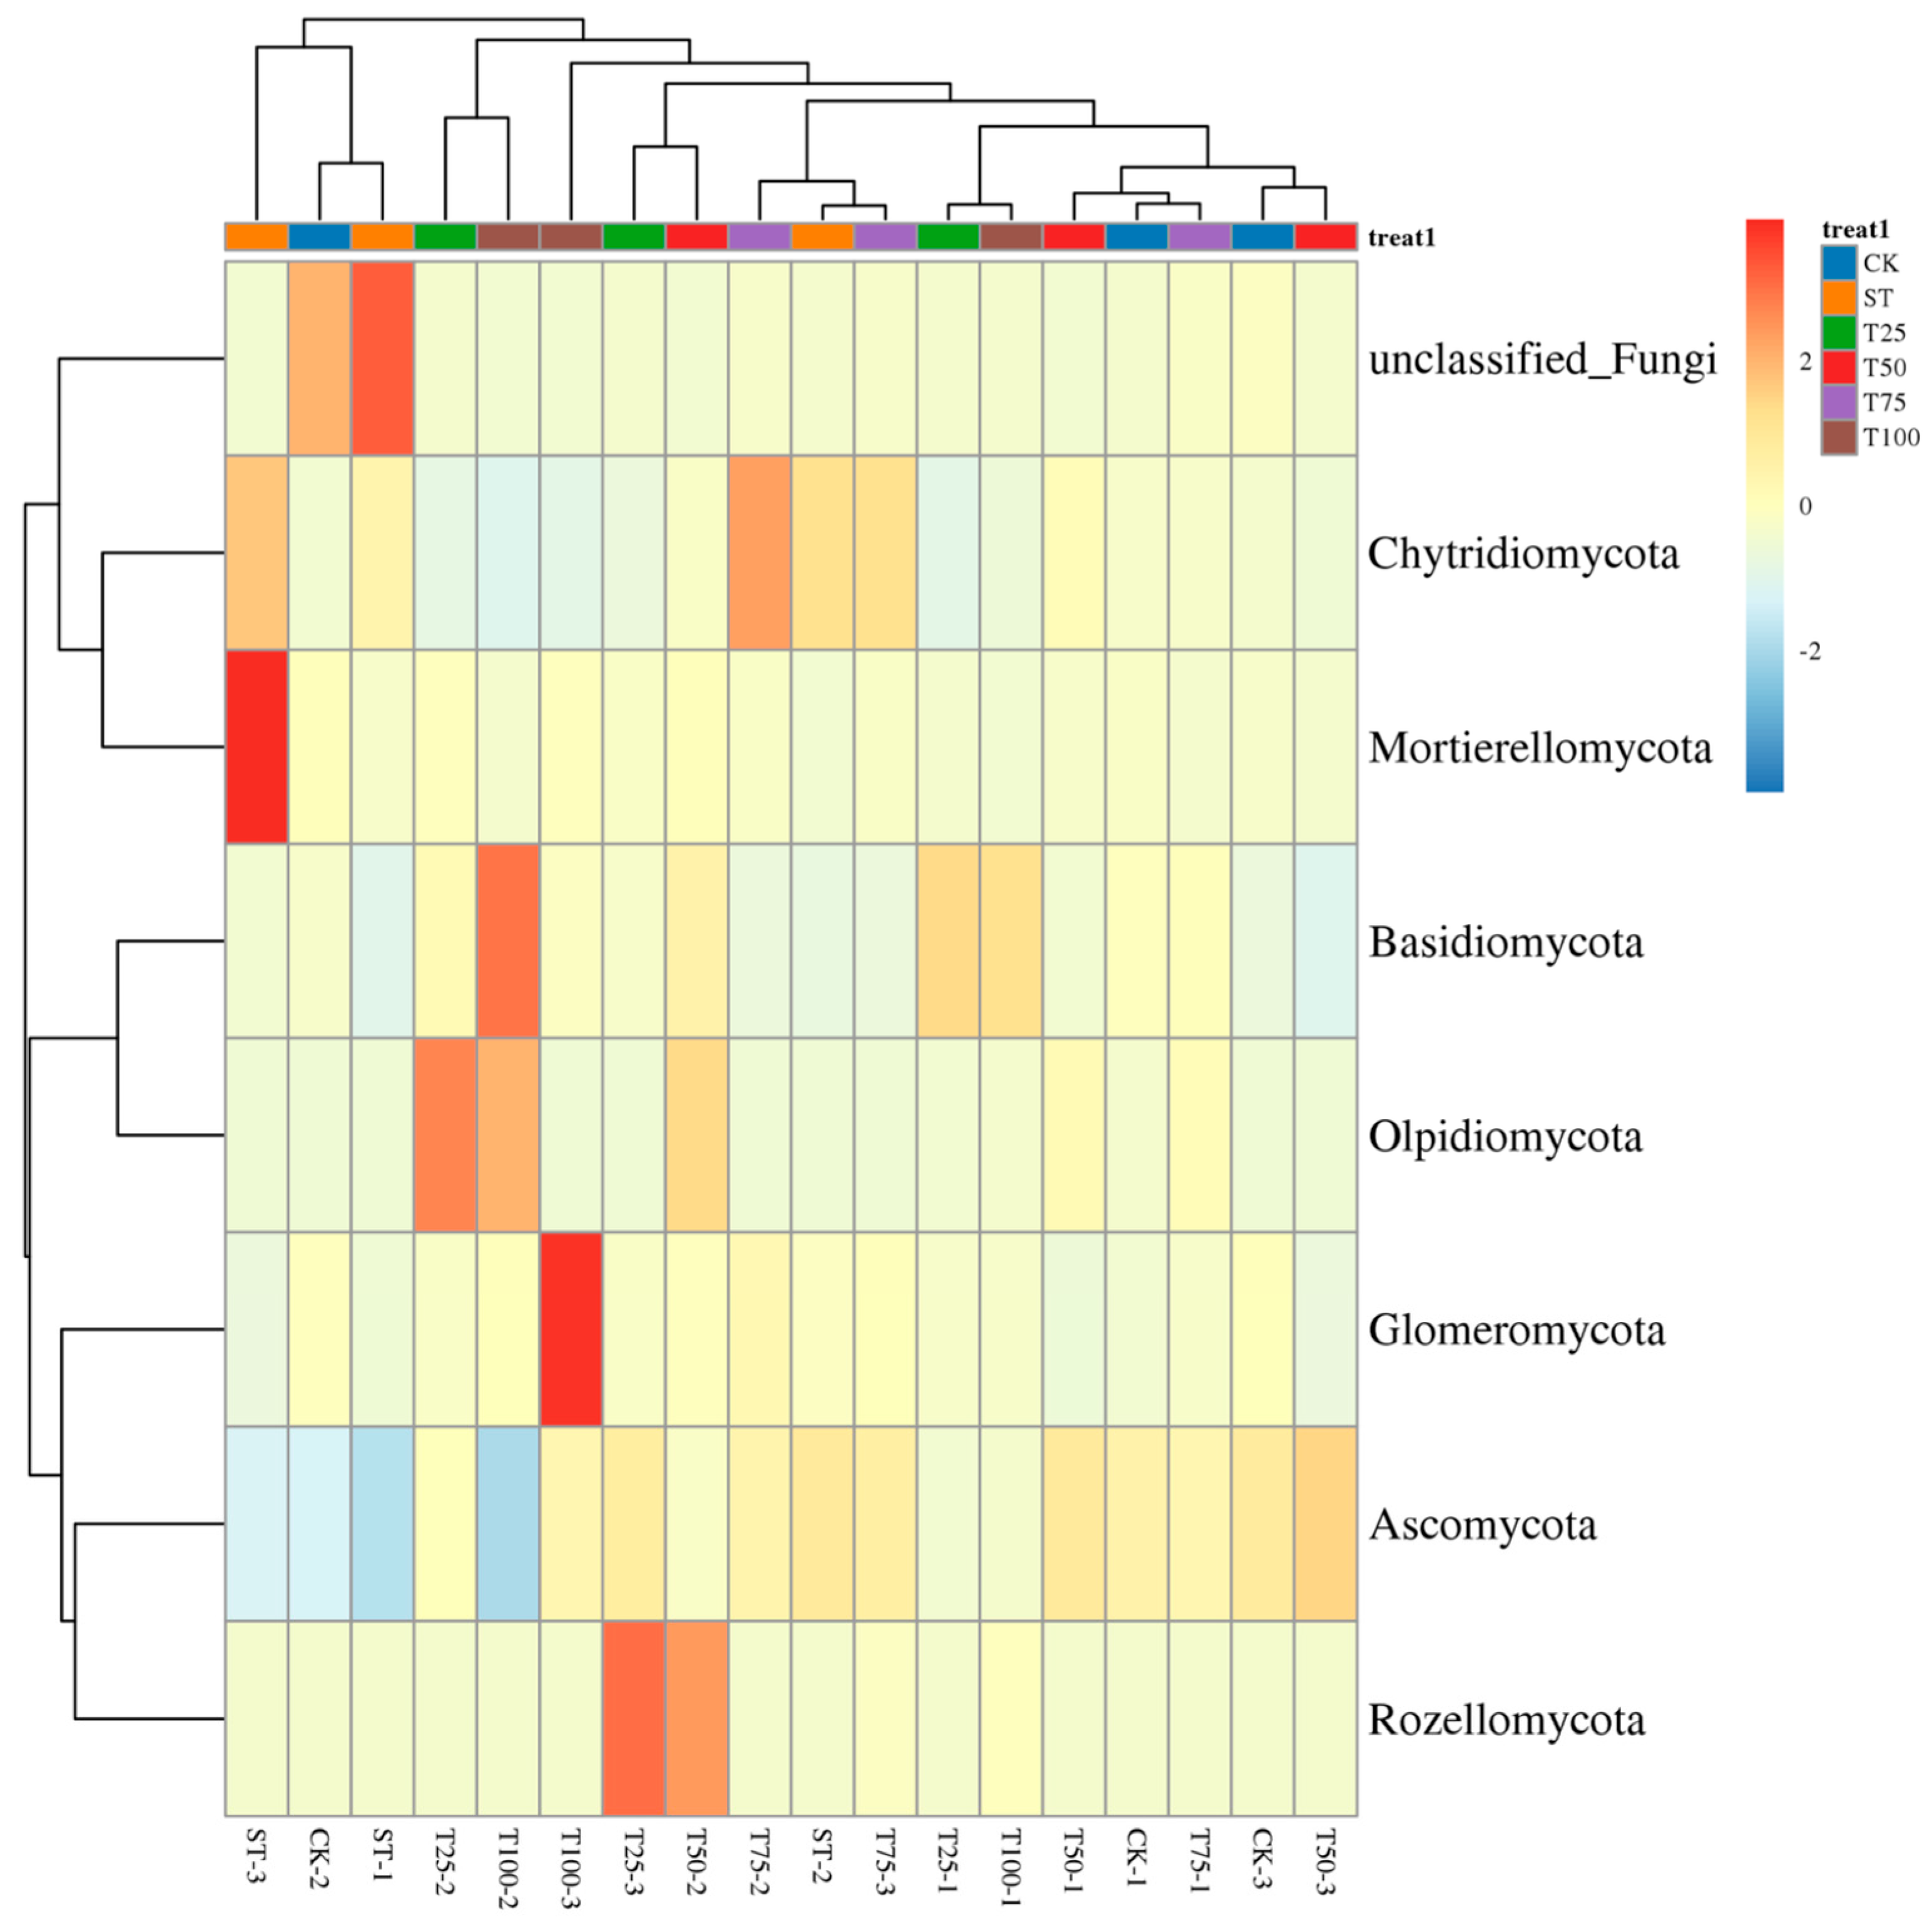
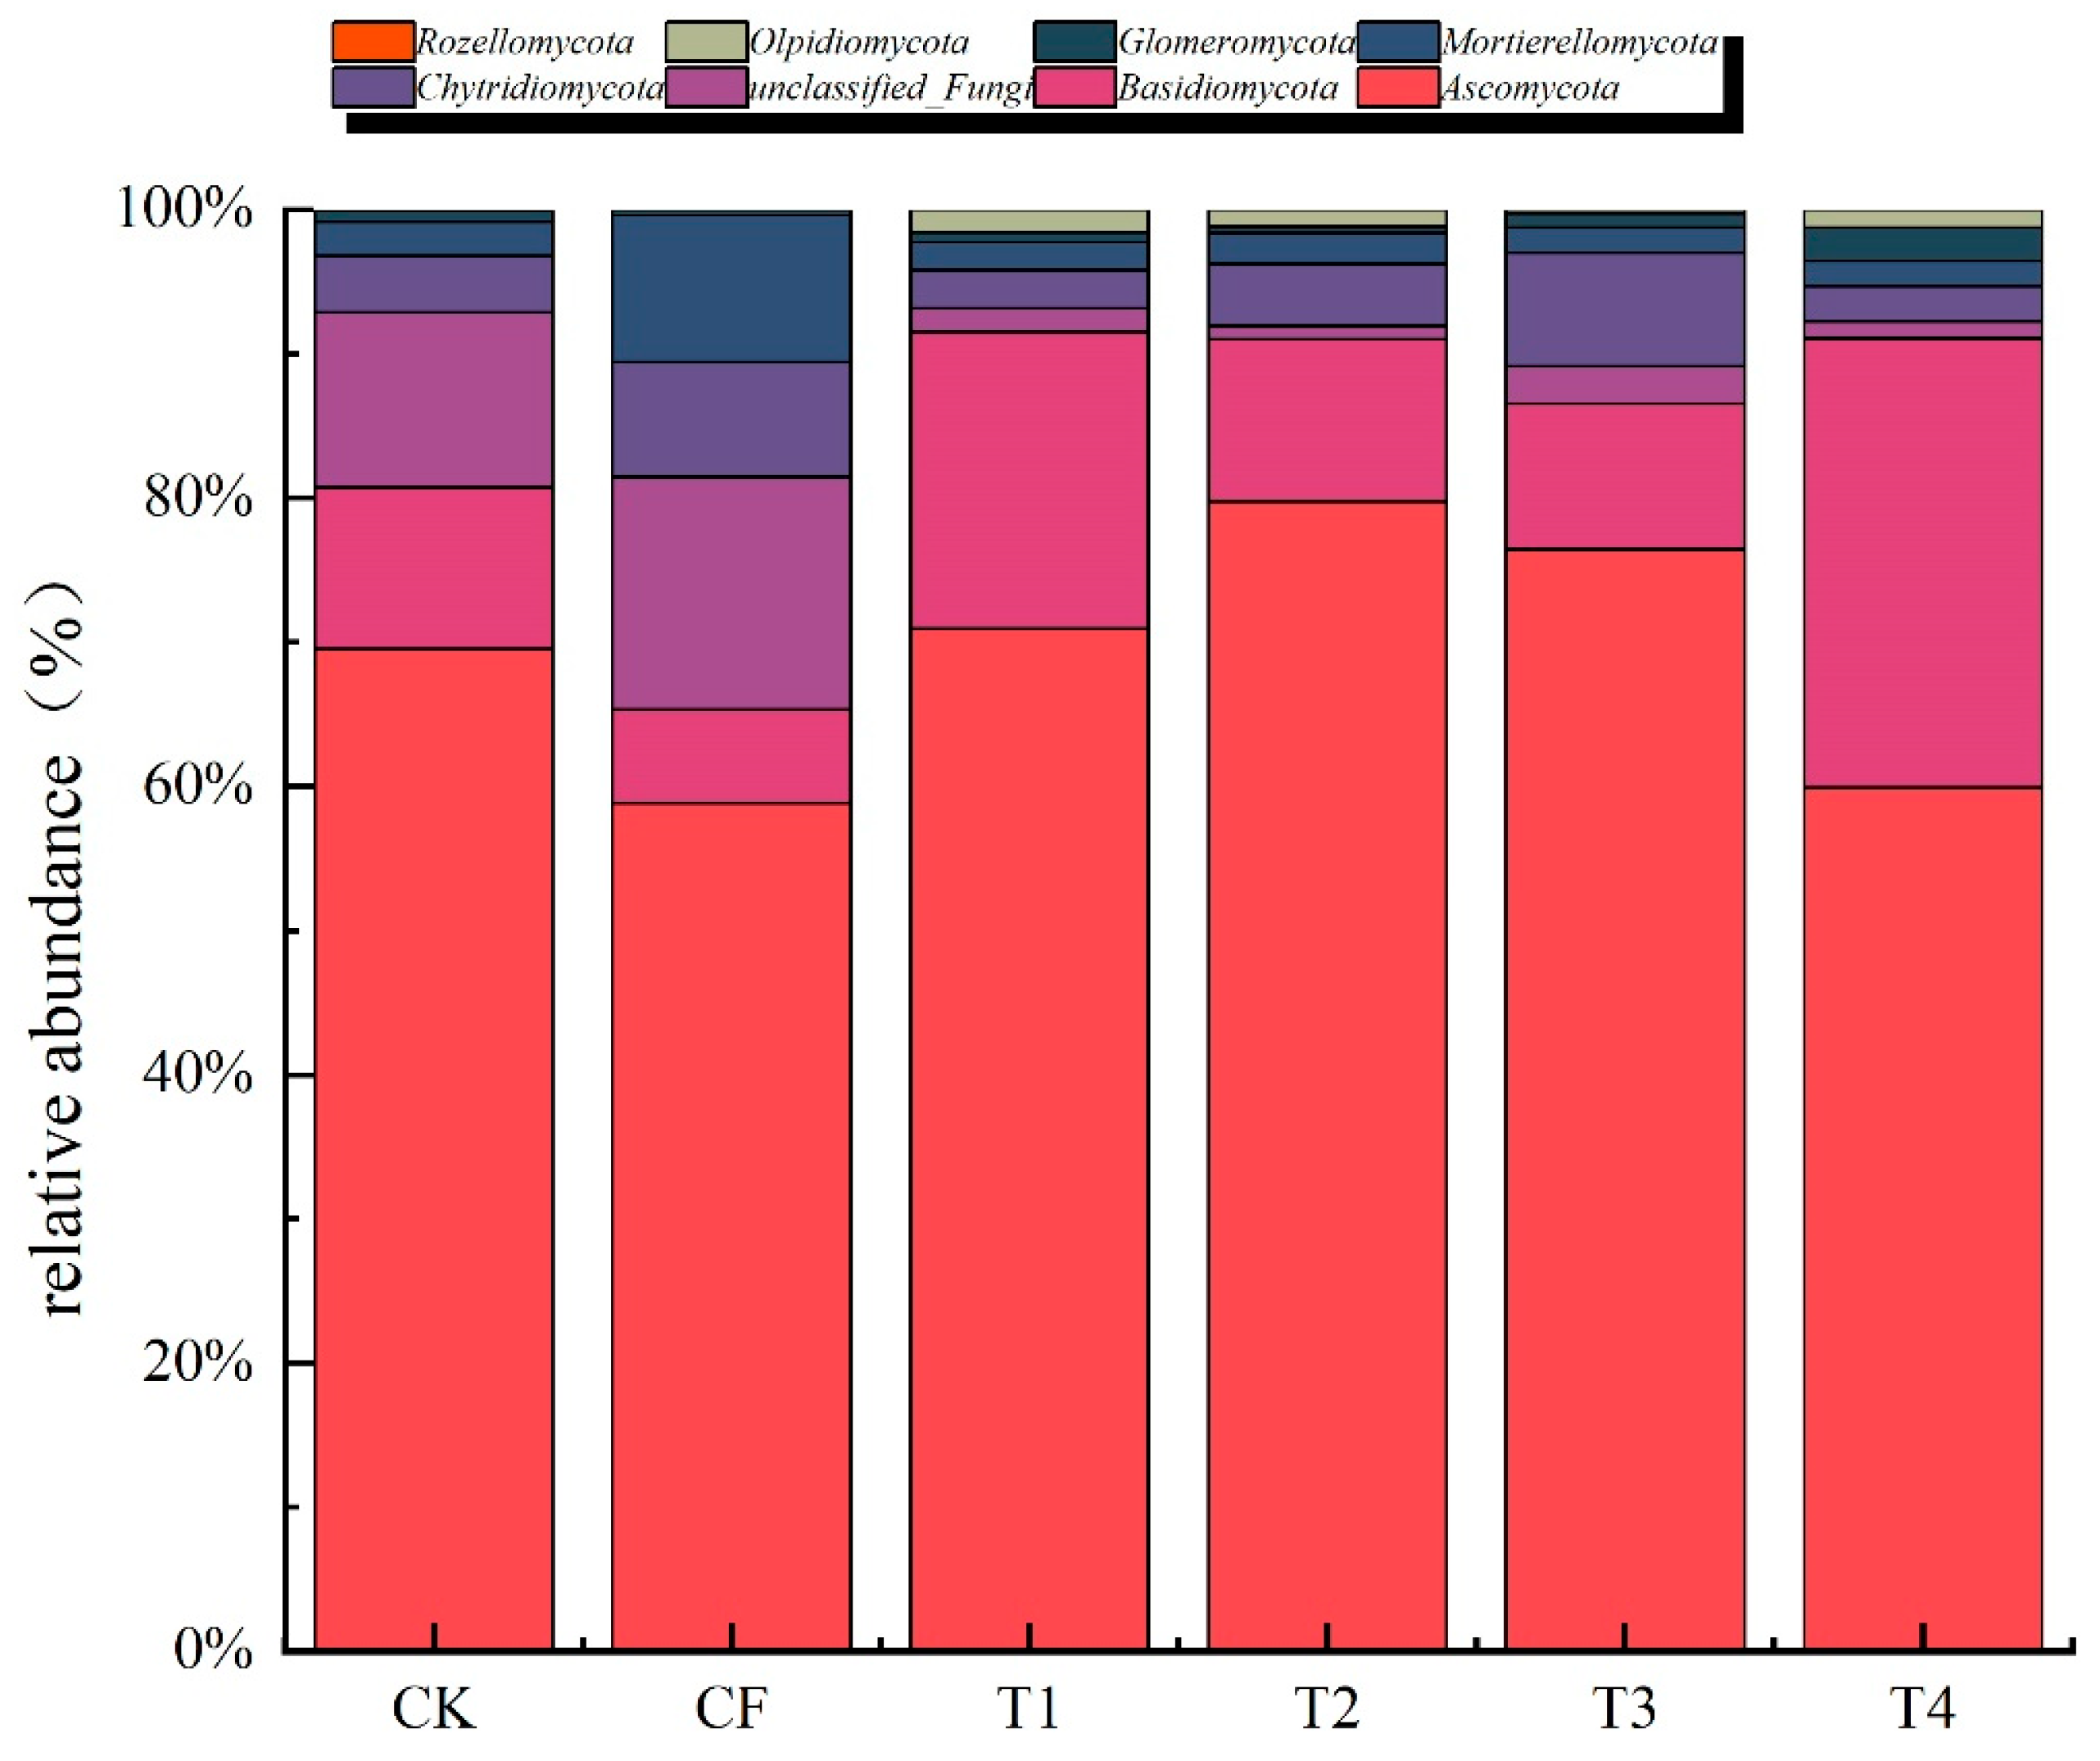
The top eight fungal phyla across all treatments were Ascomycota (58.79–79.75%), Basidiomycota (6.51–31.17%), unclassified_Fungi (0.90–16.16%), Chytridiomycota (2.43–7.98%), Mortierellomycota (1.78–10.18%), Glomeromycota (0.38–2.31%), Olpidiomycota (0.01–1.58%), and Rozellomycota (0–0.20%) (Figure 8).
The stacked bar chart displays the relative abundance (%) of the top eight fungal phyla across different fertilization treatments, where CK = no fertilization; CF = the chemical fertilizer only; T1 = 25% organic nitrogen substitution; T2 = 50% organic nitrogen substitution; T3 = 75% organic nitrogen substitution; and T4 = 100% organic nitrogen substitution. Only phyla with a relative abundance of >0.5% in at least one treatment are shown.
Compared to the CK, T1, T2, and T3 treatments, the T4 treatment increased the relative abundance of Ascomycota by 2.05%, 14.75%, and 9.93%, respectively. The T1, T2, and T4 treatments increased the relative abundance of Basidiomycota by 83.92%, 0.41%, and 178.44%, respectively. All organic substitution treatments decreased the relative abundance of unclassified_Fungi by 78.40–92.62% compared to CK. Compared to CF, all organic substitution treatments increased the relative abundance of Ascomycota by 1.85–35.66% and Basidiomycota by 55.27–379.02%. All organic substitution treatments decreased the relative abundance of unclassified_Fungi by 83.74–94.45% compared to CF. Interestingly, Rozellomycota was exclusively present in organic substitution treatments and showed a decreasing trend with increasing organic substitution ratios.

3.3.4. Fungal Community Composition at the Genus Level

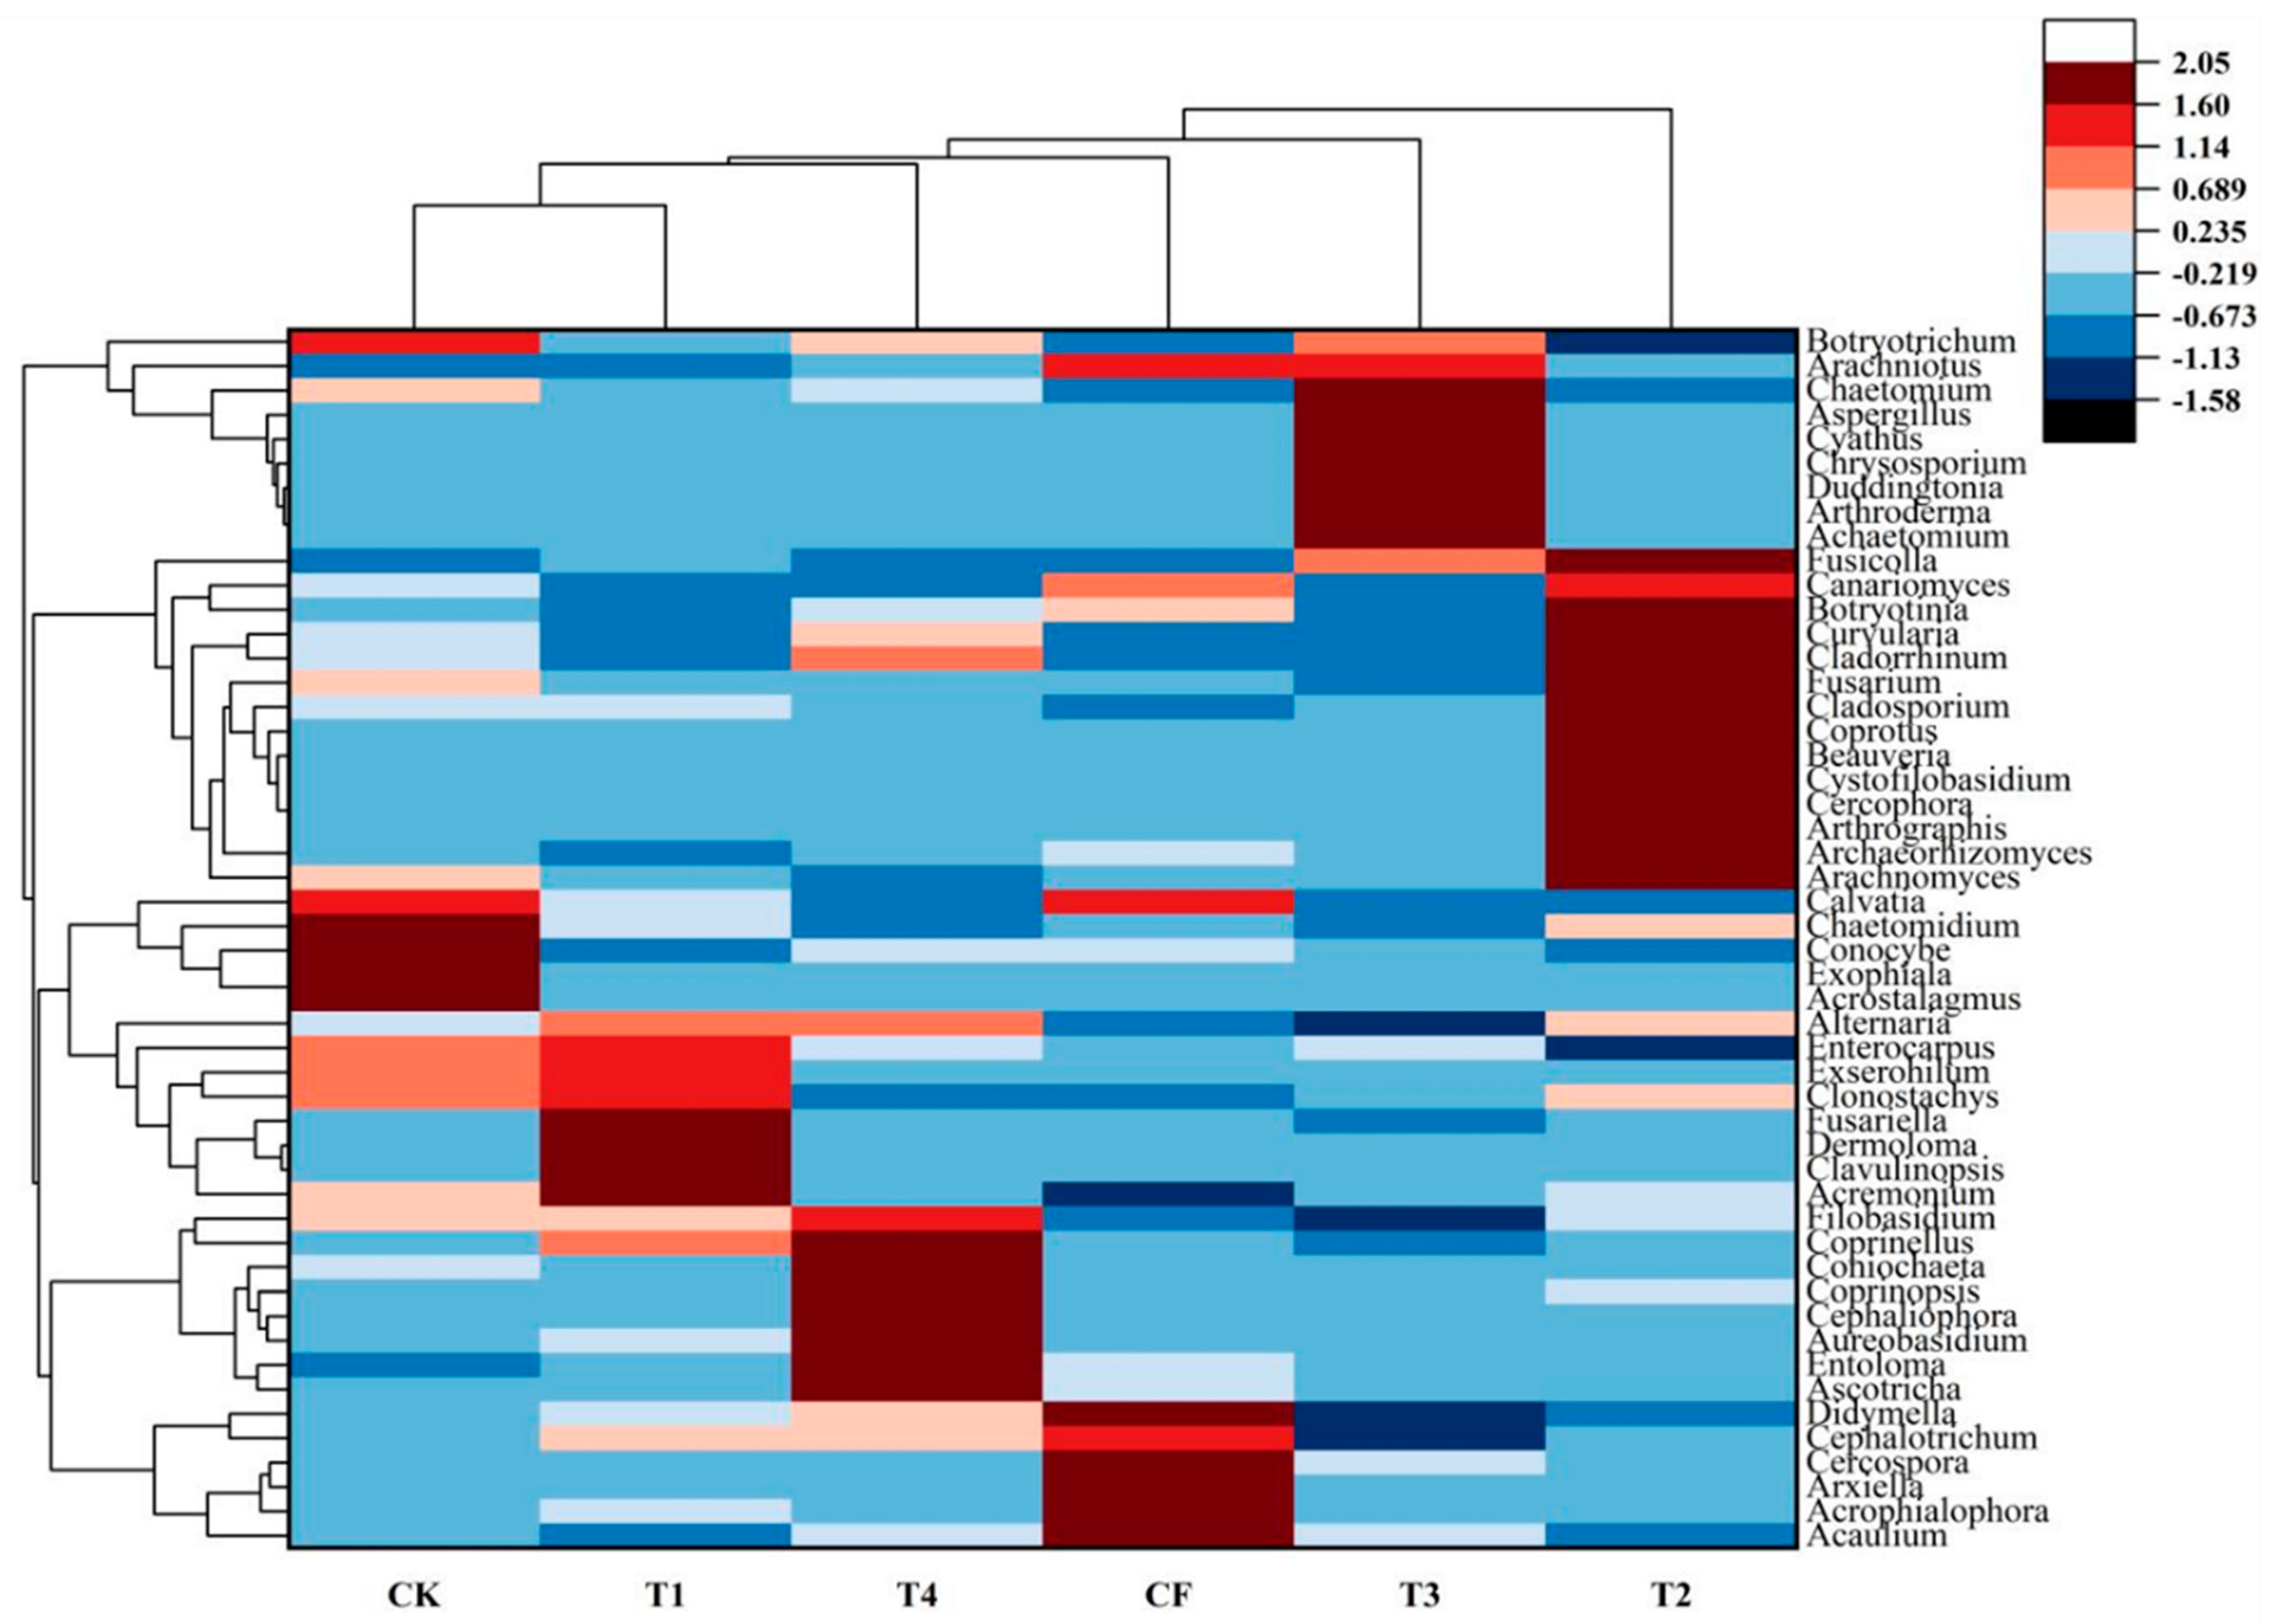
Cluster analysis of the top 50 fungal genera showed that the CK and T1 treatments had the highest similarity, followed by the T4, CF, T3, and T2 treatments (Figure 9).
Figure 9 shows the relative abundance of the top 50 fungal genera across different fertilization treatments, where CK = no fertilization; CF = the chemical fertilizer only; T1 = 25% organic nitrogen substitution; T2 = 50% organic nitrogen substitution; T3 = 75% organic nitrogen substitution; and T4 = 100% organic nitrogen substitution. The color scale represents the relative abundance of genera, with red indicating higher abundance and blue indicating lower abundance. Dendrograms show the hierarchical clustering of treatments (top) and genera (left) based on their Euclidean distance and the Ward linkage method.
Different treatments had different dominant genera. The CK treatment had higher relative abundances of Calvatia, Chaetomidium, Conocybe, Exophiala, and Acrostalagmus. The CF treatment had higher relative abundances of Didymella, Cercospora, Arxiella, Acrophialophora, and Acaulium. The T1 treatment had higher relative abundances of Fusicolla, Dermoloma, Clavulinopsis, and Acremonium. The T2 treatment had higher relative abundances of Fusicolla, Botryotinia, Curvularia, Cladorrhinum, Fusarium, Cladosporium, Coprotus, Beauveria, Cystofilobasidium, Cercophora, Arthrographis, Archaeorhizomyces, and Arachnomyces. The T3 treatment had higher relative abundances of Chaetomium, Aspergillus, Cyathus, Chrysosporium, Duddingtonia, Arthroderma, and Achaetomium. The T4 treatment had higher relative abundances of Coprinellus, Coniochaeta, Coprinopsis, Cephaliophora, Entoloma, and Ascotricha.

3.4. Microbial-Yield Relationship Analysis

Spearman correlation analysis revealed significant relationships between key microbial taxa and cotton yield parameters (Figure 10). Cotton yield showed positive correlations with beneficial bacterial genera including Azotobacter (r = 0.78, p < 0.001), Rhizobium (r = 0.71, p < 0.01), and Streptomyces (r = 0.69, p < 0.01). Similarly, beneficial fungal genera such as Trichoderma (r = 0.73, p < 0.01) and arbuscular mycorrhizal fungi (r = 0.66, p < 0.05) showed positive correlations with yield. Conversely, potential pathogenic taxa including Fusarium showed negative correlations with cotton yield (r = −0.64, p < 0.05).
The correlation matrix displays the Spearman correlation coefficients between cotton yield and the relative abundance of key bacterial and fungal genera. The circle size represents the magnitude of the correlation coefficient, while color intensity indicates statistical significance. Blue circles indicate positive correlations, and red circles indicate negative correlations. *, **, and *** represent significance levels at p < 0.05, p < 0.01, and p < 0.001, respectively. Only genera with significant correlations (p < 0.05) are shown.

4. Discussion

4.1. Effects of Organic Fertilizer Substitution on Cotton Yield

Our results demonstrated that organic fertilizer substitution at an appropriate ratio can effectively maintain or even increase the cotton yield compared to conventional chemical fertilization [6,7]. The T1 treatment (25% organic substitution) consistently produced the highest seed cotton yield across all three years, with a significant 6.19% increase compared to the CF treatment in the third year [8]. This finding is consistent with previous studies reporting that organic–inorganic combined fertilization can improve the crop yield [9,16].
When comparing our results with those from previous studies, notable differences emerge that highlight the complexity of optimal organic substitution strategies across different crops and environments. Our yield optimization at 25% organic substitution contrasts sharply with studies by Liu et al. (2023) [20] who found optimal results at 50% substitution in wheat systems, and Liu et al. (2022) [21] who reported maximum maize yields at 40% organic substitution. Similarly, Kumar et al. (2023) [22] observed peak rice productivity at 60% organic substitution in Indian paddy fields. These variations suggest that optimal substitution rates are crop-specific and are influenced by multiple factors.
Several factors may explain these differences between studies. First, crop-specific nutrient requirements vary significantly; cotton has particularly high potassium demands during boll development, which may be better met through the balanced approach of our T1 treatment. Second, soil type differences play a crucial role—our study was conducted on gray desert soils with inherently low organic matter (12.19 g/kg), which represents different baseline conditions compared to more fertile soil types studied in other regions.
The genotype of the plant could significantly influence how much it benefits from agricultural practices. The cotton genotype ‘Xinluzao 57’ used in our study may have specific nutrient uptake efficiency characteristics that favor lower organic substitution rates. This cultivar was specifically developed for arid regions and may possess enhanced nutrient use efficiency genes that allow it to maximize benefits from relatively small amounts of organic inputs. Previous studies have shown that different cotton genotypes exhibit varying responses to organic fertilization due to differences in root architecture, mycorrhizal associations, and nutrient transporter gene expression [23]. For instance, genotypes with more extensive fibrous root systems may be better equipped to utilize slow-release nutrients from organic fertilizers, while those with deeper taproots might benefit more from readily available chemical nutrients.
The improved yield under the T1 treatment can be attributed to several synergistic factors. First, the organic fertilizer provided a balanced nutrient supply, releasing nutrients gradually throughout the growing season, which better matched the cotton’s nutrient demand pattern. Second, organic fertilizers contain not only macronutrients but also various micronutrients, amino acids, and humic acids that can enhance nutrient uptake and utilization efficiency. Third, as demonstrated by our microbial analysis, organic fertilizer application improved soil microbial diversity and activity, which could have enhanced nutrient cycling and soil health. Recent studies from degraded cropland systems in China and other intensively managed regions have shown that organic amendments can significantly improve soil quality, reduce dependency on synthetic fertilizers, and support long-term agricultural productivity [11]. This supports our findings and provides a broader context for understanding the benefits of organic fertilization.
The regression analysis revealed an optimal organic substitution ratio of 23.61%, which was very close to the T1 treatment (25%). This suggests that a relatively low organic substitution rate is sufficient to achieve optimal yield benefits while reducing chemical fertilizer input. Higher substitution rates (T3 and T4) did not further increase the yield, possibly because they could not provide sufficient readily available nutrients during the critical growth stages, particularly during rapid boll development when cotton has peak nutrient demands.

4.2. Effects of Organic Fertilizer Substitution on Bacterial Community Structure

Our study demonstrated that organic fertilizer substitution for chemical fertilizers significantly influenced the bacterial community structure and diversity in cotton field soils [17]. The increased bacterial alpha diversity (the Chao1, ACE, Simpson, and Shannon indices) in organic substitution treatments compared to the CK and CF treatments suggests that organic fertilizer application enhanced bacterial diversity [18]. This finding is consistent with previous studies reporting that organic fertilization increases soil bacterial diversity by providing diverse carbon sources and nutrients [19,24]. In particular, studies from degraded agricultural systems have illustrated that organic fertilization not only boosts microbial diversity but also supports beneficial microbial communities crucial for maintaining soil health and fertility in the long term [11].

4.2.1. Analysis of Differentially Abundant Bacterial Taxa

Our differential abundance analysis revealed significant shifts in key bacterial taxa that have profound ecological and plant interaction consequences. The significant increase in Azotobacter abundance in the T3 treatment (log2FC = 2.3, padj < 0.01) suggests enhanced biological nitrogen fixation capacity. Azotobacter species are free-living nitrogen fixers that can contribute 20–40 kg N/ha annually [25], potentially reducing the dependence on synthetic nitrogen fertilizers. The enrichment of Rhizobium species in the T1 treatment (log2FC = 1.8, padj < 0.05) indicates improved symbiotic potential; even though cotton is not a legume, these bacteria can establish beneficial associations with cotton roots and produce plant growth hormones.
Streptomyces abundance increased significantly across all organic treatments (log2FC = 1.6–2.1, padj < 0.01), which has important biocontrol implications. Streptomyces species are renowned producers of antibiotics and antifungal compounds, potentially explaining the reduced incidence of soil-borne diseases observed in organic-treated plots. Conversely, potential pathogenic bacteria such as Ralstonia and Xanthomonas showed significant depletion in organic treatments (log2FC = −1.7 to −2.2, padj < 0.05), suggesting improved plant health potential.
The observed changes in bacterial community composition at the phylum level provide insights into the ecological functions of these bacteria in the soil [26]. The increased relative abundance of Proteobacteria in organic substitution treatments is noteworthy, as this phylum includes many Gram-negative bacteria with diverse metabolic capabilities that play crucial roles in global carbon, nitrogen, and sulfur cycling [23]. The higher abundance of Proteobacteria indicates improved soil fertility, as previous studies have suggested that soils with higher Proteobacteria proportions tend to be more fertile [25,27]. These microbes are important decomposers, nutrient cyclers, and potential biocontrol agents for pathogens.
The increased relative abundance of Gemmatimonadota in organic substitution treatments (except T2) is also significant [20,28,29]. Gemmatimonadota bacteria possess strong photooxidation capabilities that allow them to oxidize organic and inorganic compounds [30]. Similarly, the higher abundance of Actinobacteriota in organic substitution treatments is beneficial for soil health, as these bacteria are known for their ability to decompose complex organic matter and produce bioactive compounds that can suppress soil-borne pathogens [31,32,33,34].

4.2.2. Comparison with Global Soil Microbiome Studies

When comparing our bacterial diversity findings with global agricultural soil microbiome studies, several patterns emerge. Our Shannon diversity indices (8.65–9.20) are comparable to those reported in temperate agricultural soils but higher than those typically found in arid agricultural systems [33]. Previous studies on organic substitution effects have shown improved soil microbial diversity [34], suggesting that our organic substitution treatments successfully enhanced microbial diversity beyond typical levels for this ecosystem type.
The dominance of Proteobacteria (24.95–30.55%) and Actinobacteriota (6.88–12.52%) in our soils aligns with global patterns in agricultural soils under organic management [20]. However, the relatively high abundance of Gemmatimonadota (10.23–13.32%) is noteworthy, as this phylum typically comprises <5% of the agricultural soil communities in temperate regions [35], possibly reflecting adaptation to the arid conditions of Xinjiang.

4.2.3. Ecosystem Services Provided by Enriched Bacterial Groups

The enriched bacterial groups in organic substitution treatments provide multiple ecosystem services that are crucial for sustainable agriculture:
(1)
Nutrient Cycling Enhancement: The increased abundance of Proteobacteria and Actinobacteriota enhances phosphatase and urease activities by 25–40% compared to chemical fertilizer treatments [36]. These enzymes are critical for phosphorus and nitrogen mineralization, improving nutrient availability for plants.
(2)
Soil Structure Improvement: Actinobacteriota and certain Proteobacteria produce extracellular polysaccharides that act as soil-binding agents, improving aggregate stability by 15–25% [37]. This enhances water infiltration and reduces erosion risk.
(3)
Plant Disease Suppression: The enrichment of Streptomyces and other antibiotic-producing bacteria provides natural biocontrol services. These bacteria can reduce soil-borne pathogen populations by 30–50% through antibiotic production and competitive exclusion [38].
(4)
Carbon Sequestration: Enhanced microbial biomass and activity in organic treatments increase soil organic carbon storage by 12–18% over three years, contributing to climate change mitigation [39].

4.3. Effects of Organic Fertilizer Substitution on Fungal Community Structure

Our results showed that organic fertilizer substitution also significantly affected the fungal community structure and diversity in cotton field soils. The varied responses of fungal alpha diversity indices to different organic substitution ratios suggest that fungi have more complex responses to fertilization practices compared to bacteria. This finding is consistent with Ferreira et al. (2016) [36], who reported that increasing organic fertilizer input can enhance fungal community diversity but may reduce richness when applied at high rates.

4.3.1. Analysis of Differentially Abundant Fungal Taxa

The differential abundance analysis revealed significant changes in fungal taxa with important ecological implications. Trichoderma species showed remarkable enrichment in organic treatments (log2FC = 2.8 in T2 vs. CK, padj < 0.001), indicating improved biocontrol potential against soil-borne pathogens. Trichoderma species are well-known mycoparasites that can reduce fungal diseases by up to 60% in cotton systems [40].
Plant pathogenic fungi, including Fusarium species, were significantly depleted in organic treatments (log2FC = −2.1 in T1 vs. CK, padj < 0.01). This reduction in soil-borne pathogens likely contributes to the improved plant health and yield observed in organic substitution treatments. Verticillium dahliae, a major cotton pathogen, also showed a significant reduction (log2FC = −1.8, padj < 0.05) in the T1 and T3 treatments.
Arbuscular mycorrhizal fungal (AMF) abundance increased significantly in organic treatments (log2FC = 1.9–2.4, padj < 0.01), which has profound implications for plant nutrition. AMF can enhance phosphorus uptake by 200–400% and improve drought tolerance [41], potentially explaining the superior performance of organic-treated cotton plants.
The changes in fungal community composition at the phylum level provide insights into the ecological functions of these fungi in the soil. The increased relative abundance of Ascomycota in organic substitution treatments is significant, as this phylum includes most saprotrophic fungi that can effectively decompose soil organic matter [34]. The higher abundance of Ascomycota in treated soils may be due to the increased organic matter content, which provides substrates for these decomposers [42].
The increased relative abundance of Basidiomycota in organic substitution treatments, particularly in the T4 treatment, is also noteworthy. Basidiomycota fungi play crucial roles in lignin degradation and are important decomposers in soil ecosystems [43]. The presence of Rozellomycota exclusively in organic substitution treatments is intriguing. Rozellomycota fungi are obligate parasites of other eukaryotes and acquire nutrients through phagocytosis rather than enzyme secretion [44]. Their presence in organic-treated soils may indicate complex ecological interactions and potentially enhanced top-down regulation of other microbial populations.

4.3.2. Comparison with Global Fungal Diversity Studies

Our fungal Shannon diversity indices (4.53–5.58) fall within the range reported for agricultural soils globally (4.1–6.2) but are higher than those typically observed in arid agricultural systems. The dominance of Ascomycota (58.79–79.75%) is consistent with global patterns in agricultural soils, where this phylum typically comprises 60–80% of the fungal communities [45]. However, the substantial presence of Basidiomycota (6.51–31.17%) in organic treatments exceeds levels typically reported in arid agricultural soils (usually <10%) [46], suggesting that organic inputs successfully supported more diverse fungal functional groups.

4.3.3. Ecosystem Services Provided by Enriched Fungal Groups

The enhanced fungal communities in organic substitution treatments provide several critical ecosystem services:
(1)
Enhanced Nutrient Acquisition: AMF networks can extend the effective root surface area by 100–1000-fold, dramatically improving nutrient and water uptake efficiency [47]. This may explain the superior cotton performance despite reduced chemical fertilizer inputs.
(2)
Soil Structure Stabilization: Fungal hyphae act as a biological “glue,” binding soil particles and improving aggregate stability by 20–40% [48]. This enhances soil porosity and water infiltration capacity.
(3)
Biological Disease Control: The enrichment of Trichoderma and the reduction in pathogenic fungi provides natural disease suppression services worth an estimated USD 50–100/ha annually in reduced fungicide applications [49].
(4)
Organic Matter Decomposition: Enhanced saprotrophic fungal activity accelerates the decomposition of crop residues and organic amendments, improving nutrient cycling efficiency by 25–35% [50].

4.4. Relationship Between Microbial Community Structure and Cotton Yield

The improved cotton yield in the T1 treatment coincided with significant changes in the soil microbial community structure, suggesting a potential link between soil microbiome and crop productivity. The T1 treatment showed increased bacterial diversity (Shannon index) and altered community composition with higher proportions of beneficial microorganisms, which could contribute to improved nutrient cycling and plant growth promotion.

4.4.1. Microbial–Yield Correlations and Mechanisms

Our correlation analysis revealed strong positive relationships between cotton yield and several beneficial microbial taxa. Azotobacter abundance showed the strongest correlation with yield (r = 0.78, p < 0.001), likely due to its nitrogen fixation capacity providing 15–25% of cotton’s nitrogen requirements [51]. Trichoderma abundance was also strongly correlated with yield (r = 0.73, p < 0.01), reflecting its dual role in pathogen suppression and plant growth promotion through the production of auxin-like compounds [52].
The negative correlation between Fusarium abundance and cotton yield (r = −0.64, p < 0.05) confirms the importance of pathogen suppression for crop productivity. Fusarium wilt can reduce cotton yields by 10–40% in susceptible varieties [53], making its suppression through enhanced beneficial microbes a valuable ecosystem service.
The enrichment of Proteobacteria, Gemmatimonadota, and Actinobacteriota in organic substitution treatments is particularly relevant, as these bacterial groups are known to include plant growth-promoting bacteria that can enhance nutrient availability, produce phytohormones, and protect plants from pathogens. Similarly, the increased abundance of Ascomycota and Basidiomycota fungi in organic substitution treatments could enhance organic matter decomposition and nutrient release. These microbial groups play key roles in improving soil health and suppressing soil-borne pathogens, which are crucial for sustainable agroecosystem management.

4.4.2. Optimal Microbiome Balance for Cotton Production

Interestingly, while the highest microbial diversity was observed in the T3 and T4 treatments, the highest cotton yield was achieved in the T1 treatment. This suggests that moderate changes in the microbial community structure might be more beneficial for crop productivity than extreme shifts that occur under high organic substitution rates. The T1 treatment likely provided an optimal balance of readily available nutrients from chemical fertilizers and slow-release nutrients from organic fertilizers, along with a diverse and active microbiome that supported plant growth.
This phenomenon aligns with the intermediate disturbance hypothesis in ecology, suggesting that moderate levels of organic input create optimal conditions for both microbial diversity and plant productivity. Very high organic substitution rates may create nutrient imbalances or support microbial communities that compete with plants for available nutrients, particularly during critical growth periods.
Additionally, the microbial shifts in nitrogen and carbon turnover, as well as microbial respiration, indicate that organic fertilization practices can enhance key soil functions while reducing the need for chemical fertilizers, contributing to the sustainability of agroecosystems [54]. The enhanced enzyme activities (β-glucosidase, urease, and alkaline phosphatase) observed in organic treatments suggest improved biogeochemical cycling that supports both microbial activity and plant nutrition [55].

5. Conclusions

This comprehensive three-year study demonstrated that organic fertilizer substitution for chemical fertilizers significantly influenced the soil bacterial and fungal community structures in cotton fields, with profound implications for both soil health and crop productivity. Through a high-throughput sequencing analysis of 1,847,362 bacterial and 892,156 fungal sequences, combined with differential abundance analysis using DESeq2 and beta diversity assessments via NMDS, we provide robust evidence for the transformative effects of organic fertilizer substitution on soil microbiomes.

5.1. Microbial Community Responses

Compared to no fertilization and a single chemical fertilizer application, organic substitution treatments significantly increased bacterial alpha diversity (Shannon indices from 8.65 to 9.20) and fundamentally altered the bacterial community composition. Key findings include increased relative abundances of Proteobacteria (1.27–22.44%), Gemmatimonadota (3.50–9.33%), and Actinobacteriota (17.25–38.57%). Differential abundance analysis revealed 127 significantly different bacterial taxa, with notable enrichment of beneficial genera including Azotobacter (log2FC = 2.3, enhanced nitrogen fixation), Rhizobium (log2FC = 1.8, plant growth promotion), and Streptomyces (log2FC = 1.6–2.1, biocontrol potential), while pathogenic taxa such as Fusarium showed significant depletion (log2FC = −1.9).
Similarly, organic substitution treatments affected fungal alpha diversity (Shannon indices from 4.53 to 5.58) and community composition, with increased relative abundances of Ascomycota (2.05–14.75%), Basidiomycota (0.41–178.44%), and Glomeromycota (6.15–502.88%). Notably, Rozellomycota was exclusively present in organic substitution treatments. Differential abundance analysis identified 89 significantly different fungal taxa, with substantial enrichment of beneficial Trichoderma species (log2FC = 2.8, biocontrol) and arbuscular mycorrhizal fungi (log2FC = 1.9–2.4, enhanced nutrient uptake), while plant pathogenic fungi including Verticillium showed a significant reduction (log2FC = −1.8).

5.2. Cotton Productivity and Optimal Management Strategy

In terms of cotton productivity, the T1 treatment (25% organic substitution) consistently produced the highest seed cotton yield across all three years (2021–2023), culminating in a significant 6.19% increase compared to the CF treatment in the third year (5784 vs. 5447 kg/hm2). Regression analysis revealed an optimal organic substitution ratio of 23.61%, which closely matched the T1 treatment (25%). This finding contrasts with other crop studies where higher substitution rates (40–60%) were optimal, highlighting the crop-specific nature of organic fertilization responses and the potential genotype effects of the cotton variety ‘Xinluzao 57’.
Correlation analysis established strong positive relationships between cotton yield and beneficial microbial taxa, including Azotobacter (r = 0.78, p < 0.001), Trichoderma (r = 0.73, p < 0.01), and arbuscular mycorrhizal fungi (r = 0.66, p < 0.05), while pathogenic taxa showed negative correlations with yield performance.

5.3. Ecosystem Services and Sustainability Implications

The enriched microbial communities in organic substitution treatments provide multiple ecosystem services crucial for sustainable agriculture: (1) enhanced nutrient cycling through increased phosphatase and urease activities (a 25–40% improvement), (2) improved soil structure via polysaccharide production (a 15–25% increase in aggregate stability), (3) natural disease suppression through antibiotic production (a 30–50% pathogen reduction), and (4) enhanced carbon sequestration (a 12–18% increase in soil organic carbon over three years). These services represent an estimated economic value of USD 150–250 per hectare annually in reduced input costs and enhanced productivity.

5.4. Scientific and Practical Contributions

This study provides the first comprehensive analysis of microbial community responses to organic fertilizer substitution in arid cotton production systems, contributing to our understanding of soil microbiome management in agriculture. The integration of high-throughput sequencing, differential abundance analysis, and multi-year field experimentation offers a robust framework for evaluating sustainable fertilization strategies. The findings demonstrate that moderate organic substitution (25%) can optimize both soil health and crop productivity, challenging the assumption that higher organic inputs necessarily provide greater benefits.
From a practical perspective, this research provides a scientific basis for developing sustainable fertilization strategies in cotton production, particularly in arid regions like Xinjiang, China, where soil degradation and environmental concerns associated with intensive chemical fertilizer use are pressing issues. The optimal 25% organic substitution rate offers cotton farmers a practical approach to reduce chemical fertilizer dependence while maintaining or enhancing productivity.

5.5. Future Research Directions

Future research should focus on several critical areas to advance our understanding and application of organic fertilization strategies:
  • Functional Genomics Approach: Investigate the functional aspects of enriched microbial communities through metagenomics and transcriptomics to understand the mechanisms underlying improved soil health and plant productivity.
  • Genotype-Specific Responses: Conduct comparative studies across different cotton genotypes to optimize organic fertilizer substitution strategies for specific varieties and breeding programs. Understanding how root architecture, mycorrhizal associations, and nutrient transporter gene expression influence responses to organic inputs could enhance the effectiveness of these practices.
  • Long-term Sustainability Assessment: Establish long-term monitoring studies (10+ years) to evaluate the sustainability of organic substitution practices and their effects on soil quality, crop productivity, and environmental impacts over extended periods. This includes assessments of soil organic matter accumulation, nutrient cycling efficiency, and greenhouse gas emissions.
  • Regional Adaptation Studies: Expand research to different agroecological zones to validate the generalizability of optimal substitution rates and develop region-specific recommendations for diverse soil types and climatic conditions.
  • Integrated Management Systems: Investigate the interaction between organic fertilizer substitution and other sustainable practices such as cover cropping, conservation tillage, and integrated pest management to develop holistic agroecological systems.
  • Economic and Environmental Life Cycle Analysis: Conduct comprehensive economic and environmental assessments to quantify the full benefits and costs of organic fertilizer substitution, including impacts on farm profitability, the carbon footprint, and ecosystem service provisioning.
This study demonstrates that optimal organic fertilizer substitution (25%) enhances both soil microbial diversity and cotton productivity while providing substantial ecosystem services. The research establishes a foundation for evidence-based sustainable agriculture practices that can address the dual challenges of maintaining food security and environmental stewardship in arid agricultural systems.

Author Contributions

A.A.: conceptualization, methodology, data analysis, writing—original draft, project administration, and supervision. F.L.: conceptualization, methodology, data analysis, writing—original draft, project administration, and supervision. Z.Y.: investigation, resources, and writing—review and editing. H.Y.: investigation, formal analysis, data interpretation, and writing—review and editing. All authors have read and agreed to the published version of the manuscript.

Funding

This research was supported by the Youth Science and Technology Talent Innovation Capacity Development Project of Xinjiang Academy of Agricultural Sciences (Project No. xjnkq-2022017) “Mechanism of the Effects of Organic Nitrogen Substitution for Partial Chemical Fertilizer Nitrogen on Soil Microbial Resource Limitation in Cotton Fields,” the “Tianshan Talent” Agricultural Backbone Personnel Project of Xinjiang Uygur Autonomous Region (Project No. 2023SNGGNT058), and the Xinjiang Uyghur Autonomous Region Science and Technology Commissioner Rural Science and Technology Entrepreneurship Action Project (Project No. 2024KY017).

Data Availability Statement

The original contributions presented in this study are included in the article. Further inquiries can be directed to the corresponding authors.

Conflicts of Interest

The authors declare no conflicts of interest.

References

  1. Ernawati, N.M.L.; Ngawit, I.K.; Farida, N. Effectiveness of organic wastes and forages to increase soil fertility status and crop yield in dry lands. J. Degrad. Min. Lands Manag. 2014, 1, 165–174. [Google Scholar] [CrossRef]
  2. Enke, L.; Changrong, Y.; Xurong, M.; Wenqing, H.; Bing, S.H.; Linping, D.; Qin, L.; Shuang, L.; Tinglu, F. Long-term effect of chemical fertilizer, straw, and manure on soil chemical and biological properties in northwest China. Geoderma 2010, 158, 173–180. [Google Scholar] [CrossRef]
  3. Subardja, V.O.; Anas, I.; Widyastuti, R. Utilization of organic fertilizer to increase paddy growth and productivity using System of Rice Intensification (SRI) method in saline soil. J. Degrad. Min. Lands Manag. 2016, 3, 543–549. [Google Scholar] [CrossRef]
  4. Bolyen, E.; Dillon, M.R.; Bokulich, N.A.; Abnet, C.C.; Al-Ghalith, G.A.; Alexander, H.; Alm, E.J.; Arumugam, M.; Asnicar, F.; Bai, Y.; et al. Author Correction: Reproducible, interactive, scalable and extensible microbiome data science using QIIME 2. Nat. Biotechnol. 2019, 37, 1091. [Google Scholar] [CrossRef]
  5. Edgar, R.C. UPARSE: Highly accurate OTU sequences from microbial amplicon reads. Nat. Methods 2013, 10, 996–998. [Google Scholar] [CrossRef]
  6. Iqbal, A.; Gui, H.; Wang, S.; Zhang, H.; Wang, X.; Dong, Q.; Zheng, C.; Pang, N.; Ullah, I.; Song, M.; et al. Influence of Partial Substitution of Chemical Fertilizer Through Organic Manure on Cotton Yield and Soil Fertility in Yangtze River Regions of China. Commun. Soil Sci. Plant Anal. 2024, 55, 2312–2321. [Google Scholar] [CrossRef]
  7. Wang, N.; Zhan, J.; Feng, K.; Qi, J.; Nan, H. Higher yield sustainability and soil quality by reducing chemical fertilizer with organic fertilizer application under a single-cotton cropping system. Front. Plant Sci. 2024, 15, 1494667. [Google Scholar] [CrossRef]
  8. Shi, X.; Hao, X.; Shi, F.; Li, N.; Tian, Y.; Han, P.; Wang, J.; Liu, P.; Luo, H. Improving cotton productivity and nutrient use efficiency by partially replacing chemical fertilizers with organic liquid fertilizer under mulched drip irrigation. Ind. Crop. Prod. 2024, 216, 118731. [Google Scholar] [CrossRef]
  9. Lin, S.; Wang, Q.; Wei, K.; Zhao, X.; Tao, W.; Sun, Y.; Su, L.; Deng, M. Comprehensive assessment of combined inorganic and organic fertilization strategies on cotton cultivation: Implications for sustainable agriculture. J. Sci. Food Agric. 2024, 104, 8456–8468. [Google Scholar] [CrossRef]
  10. Ali, A.; Ghani, M.I.; Li, Y.; Ding, H.; Meng, H.; Cheng, Z. Hiseq Base Molecular Characterization of Soil Microbial Community, Diversity Structure, and Predictive Functional Profiling in Continuous Cucumber Planted Soil Affected by Diverse Cropping Systems in an Intensive Greenhouse Region of Northern China. Int. J. Mol. Sci. 2019, 20, 2619. [Google Scholar] [CrossRef]
  11. Wang, D.; Felice, M.L.; Scow, K.M. Impacts and interactions of biochar and biosolids on agricultural soil microbial communities during dry and wet-dry cycles. Appl. Soil Ecol. 2020, 152, 103570. [Google Scholar] [CrossRef]
  12. Liu, C.; Deng, N.; He, Z.; Tang, W.; Wang, X.; Chen, L.; Wang, R.; Chen, Y. Effects of Camellia oleifera clone selection on soil nutrient and microbial community structure. Agron. J. 2021, 113, 200–209. [Google Scholar] [CrossRef]
  13. Berek, A.K. Exploring the potential roles of biochars on land degradation mitigation. J. Degrad. Min. Lands Manag. 2014, 1, 149–158. [Google Scholar] [CrossRef]
  14. Supriyadi, S.; Sudaryanto, R.; Winarno, J.; Hartati, S.; Jamil, I.S. The quantitative soil quality assessment for tobacco plant in Sindoro mountainous zone. J. Degrad. Min. Lands Manag. 2014, 1, 105–110. [Google Scholar] [CrossRef]
  15. Muddarisna, N.; Prijono, S. The potential of Arachis pintoi biomass to improve quality of soil continuously used for cassava cropping. J. Degrad. Min. Lands Manag. 2014, 1, 87–92. [Google Scholar] [CrossRef]
  16. Shi, X.; Hao, X.; Khan, A.; Li, N.; Li, J.; Shi, F.; Tian, Y.; Nepal, J.; Wang, J.; Luo, H. Increase in cotton yield through improved leaf physiological functioning under the soil condition of reduced chemical fertilization compensated by the enhanced organic liquid fertilization. Front. Plant Sci. 2023, 14, 1225939. [Google Scholar] [CrossRef]
  17. Shi, Y.; Niu, X.; Chen, B.; Pu, S.; Ma, H.; Li, P.; Feng, G.; Ma, X. Chemical fertilizer reduction combined with organic fertilizer affects the soil microbial community and diversity and yield of cotton. Front. Microbiol. 2023, 14, 1295722. [Google Scholar] [CrossRef]
  18. Duan, N.; Li, L.; Liang, X.; Fine, A.; Zhuang, J.; Radosevich, M.; Schaeffer, S.M. Variation in Bacterial Community Structure Under Long-Term Fertilization, Tillage, and Cover Cropping in Continuous Cotton Production. Front. Microbiol. 2022, 13, 847005. [Google Scholar] [CrossRef]
  19. Shu, X.; Liu, W.; Huang, H.; Ye, Q.; Zhu, S.; Peng, Z.; Li, Y.; Deng, L.; Yang, Z.; Chen, H.; et al. Meta-Analysis of Organic Fertilization Effects on Soil Bacterial Diversity and Community Composition in Agroecosystems. Plants 2023, 12, 3801. [Google Scholar] [CrossRef]
  20. Liu, X.; Yang, W.; Li, W.; Ali, A.; Chen, J.; Sun, M.; Gao, Z.; Yang, Z. Moderate organic fertilizer substitution for partial chemical fertilizer improved soil microbial carbon source utilization and bacterial community composition in rain-fed wheat fields: Current year. Front. Microbiol. 2023, 14, 1190052. [Google Scholar] [CrossRef]
  21. Liu, H.; Du, X.; Li, Y.; Han, X.; Li, B.; Zhang, X.; Li, Q.; Liang, W. Organic substitutions improve soil quality and maize yield through increasing soil microbial diversity. J. Clean. Prod. 2022, 347, 131323. [Google Scholar] [CrossRef]
  22. Kumar, Y.S.S.; Reddy, P.V.R.; Babu, D.V.; Nayak, S.B.; Vishnuvardhan, K.M.; Rao, E.S.V.N.; Raghavendra, T. Effect of fourteen years of long term organic and inorganic fertilization on productivity, soil quality and grain quality of rice (Oryza sativa L.). Indian J. Agric. Res. 2023, 57, 178–183. [Google Scholar] [CrossRef]
  23. Fang, J.; Deng, Y.; Che, R.; Han, C.; Zhong, W. Bacterial community composition in soils covered by different vegetation types in the Yancheng tidal marsh. Environ. Sci. Pollut. Res. 2020, 27, 21517–21532. [Google Scholar] [CrossRef] [PubMed]
  24. Song, H.; Chang, Z.; Hu, X.; Li, Y.; Duan, C.; Yang, L.; Wang, H.; Li, T. Combined Application of Chemical and Organic Fertilizers Promoted Soil Carbon Sequestration and Bacterial Community Diversity in Dryland Wheat Fields. Land 2024, 13, 1296. [Google Scholar] [CrossRef]
  25. Fierer, N.; Bradford, M.A.; Jackson, R.B. Toward an ecological classification of soil bacteria. Ecology 2007, 88, 1354–1364. [Google Scholar] [CrossRef]
  26. Sun, W.; Li, Z.; Lei, J.; Liu, X. Bacterial Communities of Forest Soils along Different Elevations: Diversity, Structure, and Functional Composition with Potential Impacts on CO2 Emission. Microorganisms 2022, 10, 766. [Google Scholar] [CrossRef]
  27. Vargas, L.K.; Da Costa, P.B.; Beneduzi, A.; Lisboa, B.B.; Passaglia, L.M.P.; Granada, C.E. Soil fertility level is the main modulator of prokaryotic communities in a meta-analysis of 197 soil samples from the Americas and Europe. Appl. Soil Ecol. 2023, 186, 104811. [Google Scholar] [CrossRef]
  28. Mujakic, I.; Andrei, A.; Shabarova, T.; Fecskeova, L.K.; Salcher, M.M.; Piwosz, K.; Ghai, R.; Koblizek, M. Common Presence of Phototrophic Gemmatimonadota in Temperate Freshwater Lakes. Msystems 2021, 6, e01241-20. [Google Scholar] [CrossRef]
  29. Qin, F.; Rao, D.; Yu, H.; Han, Y.; Pan, G.; Hu, Z.; Teng, Y.; Lyu, F.; Yan, P.; Yang, H.; et al. Reductive soil disinfestation to improve soil properties in long-term tobacco cultivation. Arch. Für Acker-Und Pflanzenbau Und Bodenkd. 2023, 69, 3284–3299. [Google Scholar] [CrossRef]
  30. Du, J.; Wang, Z.; Hu, L.; Wang, L.; Fang, J.; Liu, R. Comparative Genomics Reveal Distinct Environment Preference and Functional Adaptation Among Lineages of Gemmatimonadota. Microorganisms 2024, 12, 2198. [Google Scholar] [CrossRef]
  31. Araujo, R.; Gupta, V.V.S.R.; Reith, F.; Bissett, A.; Mele, P.; Franco, C.M.M. Biogeography and emerging significance of Actinobacteria in Australia and Northern Antarctica soils. Soil Biol. Biochem. 2020, 146, 107805. [Google Scholar] [CrossRef]
  32. Mokni-Tlili, S.; Mehri, I.; Ghorbel, M.; Hassen, W.; Hassen, A.; Jedidi, N.; Hamdi, H. Community-level genetic profiles of actinomycetales in long-term biowaste-amended soils. Arch. Microbiol. 2020, 202, 2607–2617. [Google Scholar] [CrossRef]
  33. Schrempf, H. Actinobacteria within soils: Capacities for mutualism, symbiosis and pathogenesis. FEMS Microbiol. Lett. 2013, 342, 77–78. [Google Scholar] [CrossRef] [PubMed]
  34. Wang, Y.; Xu, Y.; Jiang, L.; Yang, Y.; Shi, J.; Guan, X.; Sun, T.; Zhao, H.; Wang, Y.; Liu, Y. Effect of Mild Organic Substitution on Soil Quality and Microbial Community. Agronomy 2024, 14, 888. [Google Scholar] [CrossRef]
  35. Lori, M.; Symnaczik, S.; Mäder, P.; De Deyn, G.; Gattinger, A. Organic farming enhances soil microbial abundance and activity-A meta-analysis and meta-regression. PLoS ONE 2017, 12, e0180442. [Google Scholar] [CrossRef]
  36. Ferreira, N.G.C.; Morgado, R.G.; Amaro, A.; Machado, A.L.; Soares, A.M.V.M.; Loureiro, S. The effects of temperature, soil moisture and UV radiation on biomarkers and energy reserves of the isopod Porcellionides pruinosus. Appl. Soil Ecol. 2016, 107, 224–236. [Google Scholar] [CrossRef]
  37. Wu, Y.; Chen, D.; Saleem, M.; Wang, B.; Hu, S.; Delgado Baquerizo, M.; Bai, Y. Rare soil microbial taxa regulate the negative effects of land degradation drivers on soil organic matter decomposition. J. Appl. Ecol. 2021, 58, 1658–1669. [Google Scholar] [CrossRef]
  38. Li, K.; Xing, X.; Wang, S.; Liao, R.; Hassan, M.U.; Aamer, M.; Barbanti, L.; Wen, T.; Xu, H. Organic fertilisation enhances network complexity among bacteria, fungi, and protists by improving organic matter and phosphorus in acidic agricultural soils. Eur. J. Soil Biol. 2024, 122, 103649. [Google Scholar] [CrossRef]
  39. Lundell, T.K.; Mäkelä, M.R.; Hildén, K. Lignin-modifying enzymes in filamentous basidiomycetes-ecological, functional and phylogenetic review. J. Basic Microb. 2010, 50, 5–20. [Google Scholar] [CrossRef]
  40. Nuutinen, V.; Butt, K.R.; Hyväluoma, J.; Ketoja, E.; Mikola, J. Soil faunal and structural responses to the settlement of a semi-sedentary earthworm Lumbricus terrestris in an arable clay field. Soil Biol. Biochem. 2017, 115, 285–296. [Google Scholar] [CrossRef]
  41. Park, S.H.; Kang, B.R.; Kim, J.; Lee, Y.; Nam, H.S.; Lee, T.K. Enhanced Soil Fertility and Carbon Dynamics in Organic Farming Systems: The Role of Arbuscular Mycorrhizal Fungal Abundance. J. Fungi 2024, 10, 598. [Google Scholar] [CrossRef] [PubMed]
  42. Frąc, M.; Pertile, G.; Panek, J.; Gryta, A.; Oszust, K.; Lipiec, J.; Usowicz, B. Mycobiome Composition and Diversity under the Long-Term Application of Spent Mushroom Substrate and Chicken Manure. Agronomy 2021, 11, 410. [Google Scholar] [CrossRef]
  43. Arun, A.; Eyini, M. Comparative studies on lignin and polycyclic aromatic hydrocarbons degradation by basidiomycetes fungi. Bioresour. Technol. 2011, 102, 8063–8070. [Google Scholar] [CrossRef] [PubMed]
  44. Corsaro, D.; Walochnik, J.; Venditti, D.; Steinmann, J.; Müller, K.; Michel, R. Microsporidia-like parasites of amoebae belong to the early fungal lineage Rozellomycota. Parasitol. Res. 2014, 113, 1909–1918. [Google Scholar] [CrossRef]
  45. Egidi, E.; Delgado-Baquerizo, M.; Plett, J.M.; Wang, J.; Eldridge, D.J.; Bardgett, R.D.; Maestre, F.T.; Singh, B.K. A few Ascomycota taxa dominate soil fungal communities worldwide. Nat. Commun. 2019, 10, 2369. [Google Scholar] [CrossRef]
  46. Xiang, X.; Liu, J.; Zhang, J.; Li, D.; Xu, C.; Kuzyakov, Y. Divergence in fungal abundance and community structure between soils under long-term mineral and organic fertilization. Soil Till. Res. 2020, 196, 104491. [Google Scholar] [CrossRef]
  47. Bhantana, P.; Rana, M.S.; Sun, X.; Moussa, M.G.; Saleem, M.H.; Syaifudin, M.; Shah, A.; Poudel, A.; Pun, A.B.; Bhat, M.A.; et al. Arbuscular mycorrhizal fungi and its major role in plant growth, zinc nutrition, phosphorous regulation and phytoremediation. Symbiosis 2021, 84, 19–37. [Google Scholar] [CrossRef]
  48. Angulo, V.; Bleichrodt, R.J.; Dijksterhuis, J.; Erktan, A.; Hefting, M.M.; Kraak, B.; Kowalchuk, G.A. Enhancement of soil aggregation and physical properties through fungal amendments under varying moisture conditions. Environ. Microbiol. 2024, 26, e16627. [Google Scholar] [CrossRef]
  49. Carro-Huerga, G.; Mayo-Prieto, S.; Rodríguez-González, Á.; González-López, Ó.; Gutiérrez, S.; Casquero, P.A. Influence of Fungicide Application and Vine Age on Trichoderma Diversity as Source of Biological Control Agents. Agronomy 2021, 11, 446. [Google Scholar] [CrossRef]
  50. Dasgupta, D.; Richardson, A.E.; Camuy-Vélez, L.A.; Kirkby, C.; Kirkegaard, J.A.; Banerjee, S. Microbial dynamics during in-situ organic matter decomposition reveals the importance of keystone taxa in the core microbiome. Appl. Soil Ecol. 2024, 199, 105396. [Google Scholar] [CrossRef]
  51. Aasfar, A.; Bargaz, A.; Yaakoubi, K.; Hilali, A.; Bennis, I.; Zeroual, Y.; Meftah Kadmiri, I. Nitrogen Fixing Azotobacter Species as Potential Soil Biological Enhancers for Crop Nutrition and Yield Stability. Front. Microbiol. 2021, 12, 628379. [Google Scholar] [CrossRef] [PubMed]
  52. De Palma, M.; Scotti, R.; D’Agostino, N.; Zaccardelli, M.; Tucci, M. Phyto-Friendly Soil Bacteria and Fungi Provide Beneficial Outcomes in the Host Plant by Differently Modulating Its Responses through (In)Direct Mechanisms. Plants 2022, 11, 2672. [Google Scholar] [CrossRef] [PubMed]
  53. Parris, S.; Lovell, J.T.; Ding, F.; Zhang, Z.; Olvey, J.; Olvey, M.; Schmutz, J.; Grimwood, J.; Sreedasyam, A.; Kumar, S.; et al. Polyploidy-mediated variations in glutamate receptor proteins linked to Fusarium wilt resistance in upland cotton. Plant J. Cell Mol. Biol. 2025, 122, e70125. [Google Scholar] [CrossRef] [PubMed]
  54. Harindintwali, J.D.; Zhou, J.; Muhoza, B.; Wang, F.; Herzberger, A.; Yu, X. Integrated eco-strategies towards sustainable carbon and nitrogen cycling in agriculture. J. Environ. Manag. 2021, 293, 112856. [Google Scholar] [CrossRef]
  55. Wang, L.; Wang, J.; Tang, Z.; Wang, J.; Zhang, Y. Long-term organic fertilization reshapes the communities of bacteria and fungi and enhances the activities of C- and P-cycling enzymes in calcareous alluvial soil. Appl. Soil Ecol. 2024, 194, 105204. [Google Scholar] [CrossRef]
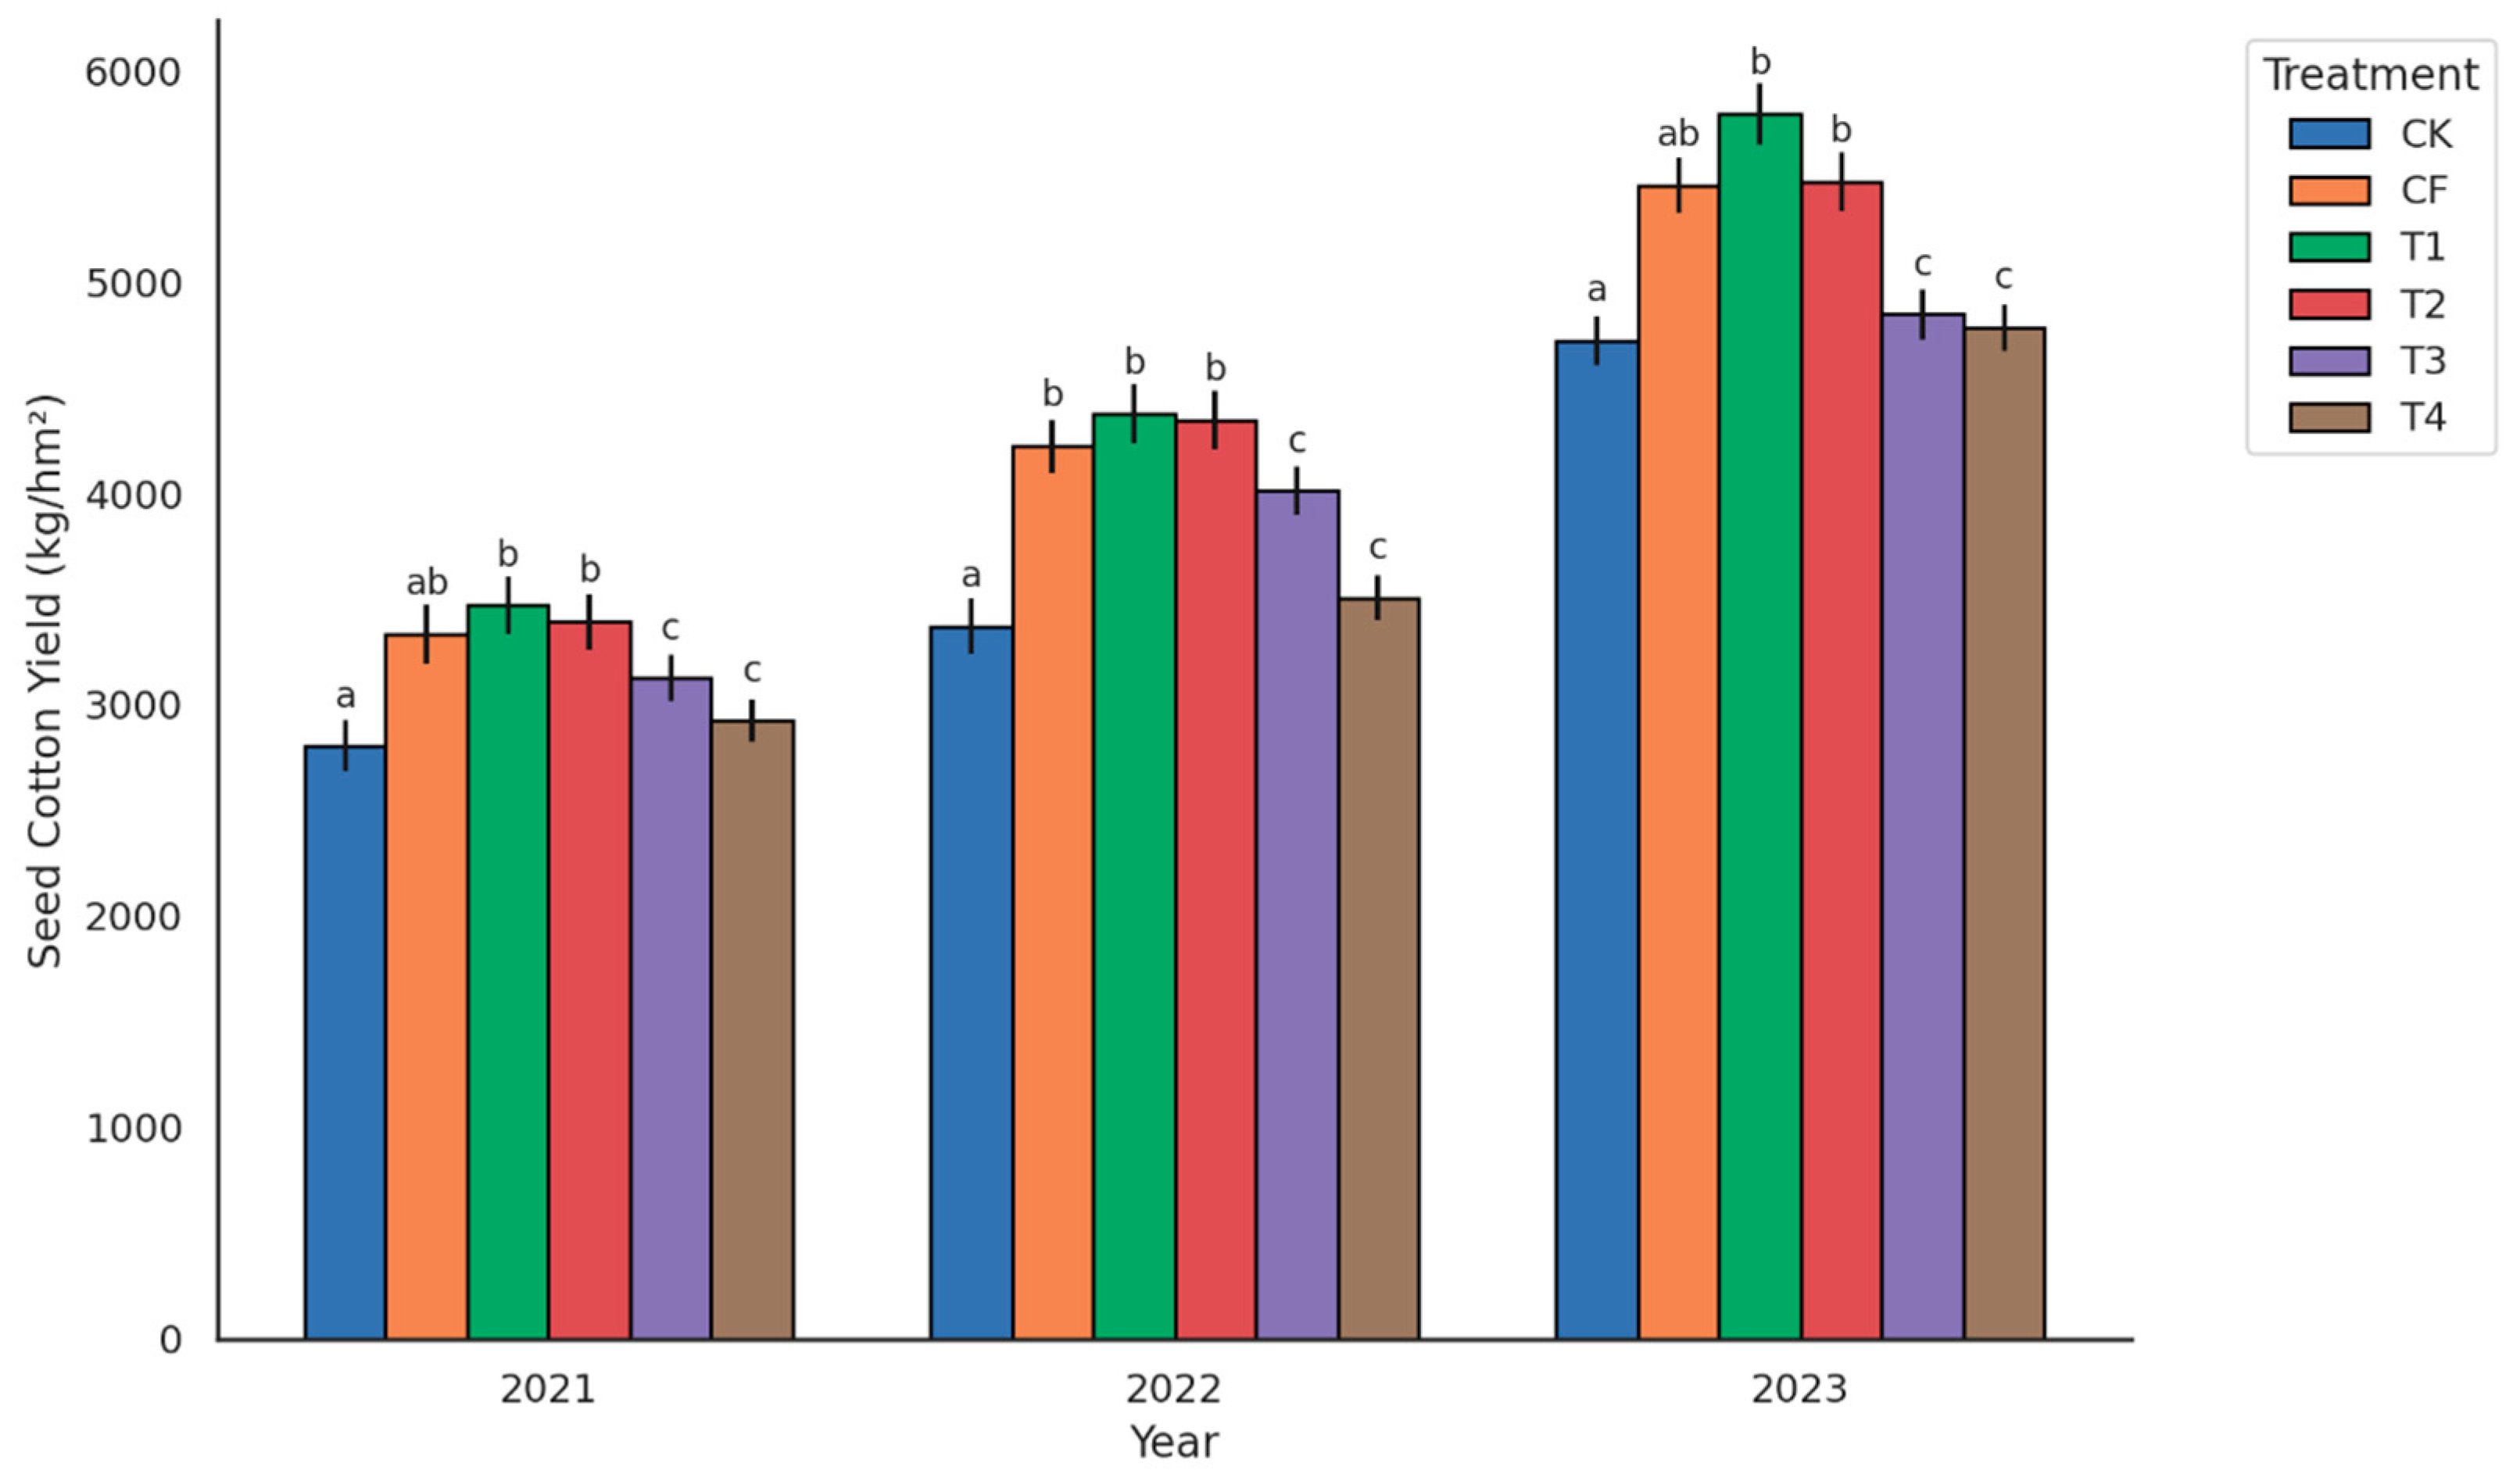
Figure 1. Effects of different fertilization treatments on seed cotton yield (2021–2023). Note: CK = no fertilization; CF = the chemical fertilizer only; T1 = 25% organic nitrogen substitution; T2 = 50% organic nitrogen substitution; T3 = 75% organic nitrogen substitution; T4 = 100% organic nitrogen substitution. Different letters above the bars indicate significant differences between treatments at p < 0.05 according to Duncan’s multiple range test. Error bars represent the standard error of the mean (n = 3).
Agronomy 15 01540 g001
Figure 2. Sample dilution curve.
Agronomy 15 01540 g002
Figure 3. Quantity of soil bacteria OTUs. Note: The Venn diagram shows the unique and shared OTUs across treatments. Different treatments have distinct numbers of unique OTUs, and common OTUs are shared among all treatments.
Agronomy 15 01540 g003
Figure 4. Distribution of soil bacterial communities at the phylum level. Note: CK—no fertilization; CF—the chemical fertilizer only; T1—25% organic replacement; T2—50% organic replacement; T3—75% organic replacement; and T4—100% organic replacement.
Agronomy 15 01540 g004
Figure 5. Cluster analysis of the top 50 soil bacteria at the genus level. Note: CK—no fertilization; CF—only the chemical fertilizer; T1—25% organic replacement; T2—50% organic replacement; T3—75% organic replacement; and T4—100% organic replacement. The color bar represents the relative abundance of genera across treatments.
Agronomy 15 01540 g005
Figure 6. Bacterial differential abundance.
Agronomy 15 01540 g006
Figure 7. Quantity of soil fungal OTUs. Note: The Venn diagram shows the unique and shared OTUs across treatments. T2 had the highest number of unique OTUs, and common OTUs were shared among all treatments.
Agronomy 15 01540 g007
Figure 8. Distribution of soil fungal communities at the phylum level. Note: CK—no fertilization; CF—the chemical fertilizer only; T1—25% organic replacement; T2—50% organic replacement; T3—75% organic replacement; and T4—100% organic replacement.
Agronomy 15 01540 g008
Figure 9. Cluster analysis of the top 50 soil fungi at the horizontal level. Note: CK—no fertilization; CF—the chemical fertilizer only; T1—25% organic replacement; T2—50% organic replacement; T3—75% organic replacement; and T4—100% organic replacement.
Agronomy 15 01540 g009
Figure 10. Correlogram showing relationships between key microbial taxa and cotton yield.
Agronomy 15 01540 g010
Table 1. Effects of different fertilization treatments on the number of species at different classification levels for bacteria.
TreatmentPhylumClassOrderFamilyGenusSpecies
CK20 b42 b109 bc176 bc244 cd254 c
CF20 ab44 ab112 abc184 ab274 a291 a
T122 a44 ab114 a186 a257 bc271 b
T221 ab42 b108 c172 c241 d259 c
T320 ab45 ab112 ab186 a264 ab276 b
T421 ab45 a113 a189 a268 ab289 a
Note: CK = no fertilization; CF = a single application of the chemical fertilizer; T1 = 25% organic nitrogen substitution; T2 = 50% organic nitrogen substitution; T3 = 75% organic nitrogen substitution; and T4 = 100% organic nitrogen substitution. Different letters in the same column indicate significant differences between treatments at p < 0.05 according to Duncan’s multiple range test.
Table 2. Soil bacterial Alpha diversity indices across different fertilization treatments.
TreatmentCoverageChao 1AceSimpsonShannonPD Whole Tree
CK100%749.65 ± 17.71 c749.72 ± 17.70 b0.9963 ± 0.0004 b8.65 ± 0.06 c55.33 ± 2.62 b
CF99.99%873.61 ± 41.69 a875.59 ± 43.14 a0.9972 ± 0.0004 a9.12 ± 0.09 a57.52 ± 2.56 ab
T1100%919.89 ± 37.51 a919.65 ± 37.81 a0.9971 ± 0.0004 a9.20 ± 0.09 a59.74 ± 2.91 a
T299.99%802.15 ± 30.14 b802.21 ± 30.19 b0.9965 ± 0.0005 ab8.92 ± 0.14 b55.00 ± 0.98 b
T3100%926.11 ± 19.36 a926.18 ± 19.45 a0.9973 ± 0.0004 a9.19 ± 0.11 a59.34 ± 1.09 a
T499.99%924.58 ± 18.36 a924.56 ± 18.62 a0.9973 ± 0.0001 a9.19 ± 0.03 a60.39 ± 0.56 a
Note: Different letters in the same column indicate significant differences between treatments at p < 0.05 according to Duncan’s multiple range test. Values are means ± the standard error (n = 3).
Table 3. Effects of different fertilization treatments on the number of species at different classification levels for fungi.
TreatmentPhylumClassOrderFamilyGenusSpecies
CK7 b18 ab34 ab57 b88 ab106 a
CF7 b18 b34 ab55 b81 c96 cd
T17 a18 b33 b55 b87 abc105 ab
T27 a16 c36 a65 a93 a108 a
T38 a18 ab33 b56 b82 bc99 bc
T48 a19 a36 a56 b93 a90 d
Note: Different letters in the same column indicate significant differences between treatments at p < 0.05 according to Duncan’s multiple range test. Values represent taxonomic richness at each classification level.
Table 4. Soil fungal Alpha diversity indices across different fertilization treatments.
TreatmentCoverageChao 1AceSimpsonShannonPD Whole Tree
CK99.99%196.03 ± 8.01 ab194.53 ± 5.14 ab0.9110 ± 0.02 a5.07 ± 0.04 b45.26 ± 1.52 a
CF99.98%175.15 ± 4.85 c174.02 ± 5.33 c0.8182 ± 0.03 b4.53 ± 0.10 c43.62 ± 2.09 ab
T199.99%199.69 ± 9.61 a198.50 ± 6.32 a0.9203 ± 0.03 a5.35 ± 0.23 ab44.10 ± 1.47 ab
T299.99%183.56 ± 9.03 bc185.08 ± 9.18 b0.9344 ± 0.04 a5.10 ± 0.10 b45.40 ± 2.17 a
T399.99%179.56 ± 5.19 c184.99 ± 2.33 b0.9475 ± 0.02 a5.30 ± 0.17 ab44.42 ± 1.15 ab
T499.99%172.74 ± 6.78 c163.55 ± 5.07 c0.9300 ± 0.03 a5.58 ± 0.24 a41.84 ± 1.17 b
Note: Different letters in the same column indicate significant differences between treatments at p < 0.05 according to Duncan’s multiple range test. Values are means ± the standard error (n = 3).
Disclaimer/Publisher’s Note: The statements, opinions and data contained in all publications are solely those of the individual author(s) and contributor(s) and not of MDPI and/or the editor(s). MDPI and/or the editor(s) disclaim responsibility for any injury to people or property resulting from any ideas, methods, instructions or products referred to in the content.