Article

Spatiotemporal Regulation of Starch–Sugar Metabolism by Potassium Enhances Carbon Partitioning and Processing Quality in Potatoes

1
State Key Laboratory of Aridland Crop Science, Gansu Agricultural University, Lanzhou 730070, China
2
College Agronomy, Gansu Agricultural University, Lanzhou 730070, China
3
College of Horticulture, Gansu Agricultural University, Lanzhou 730070, China
4
College of Water Conservancy and Hydropower Engineering, Gansu Agricultural University, Lanzhou 730070, China
*
Author to whom correspondence should be addressed.
Agronomy 2025, 15(6), 1481; https://doi.org/10.3390/agronomy15061481
Submission received: 30 April 2025 / Revised: 29 May 2025 / Accepted: 9 June 2025 / Published: 18 June 2025
(This article belongs to the Section Plant-Crop Biology and Biochemistry)

Abstract

:
To investigate the role of potassium in the regulation of potato growth, dynamic changes in starch–sugar metabolism, and processing quality. In this study, “Gannong Potato No. 9” was used as the test material, and five potassium concentration treatments of 0, 9.4, 23.5, 28.5, and 37.6 mmol/L were set. The results showed that moderate application of potassium (23.5 mmol/L) significantly enhanced plant height, stem thickness, and tuber yield. It also promotes starch accumulation in all tissues and reduces sucrose, fructose, and glucose content, thus optimizing processing quality. Dynamic analyses showed that potassium affects carbohydrate transport and partitioning among tissues by regulating the direction of carbon partitioning and the rate of conversion. Correlation analysis confirmed the synergistic effect of starch–sugar metabolism among tissues, forming a spatio-temporally linked carbon allocation network. This study reveals the pivotal role of potash in potato starch–sugar metabolism and provides a theoretical basis for precision potassium application and quality improvement.

1. Introduction

As a globally vital non-cereal crop, Potato (Solanum tuberosum L.) ranks fourth in the global food crop after wheat, maize, and rice, with annual yields surpassing 380 million tons. China, India, and Russia dominate production, collectively addressing food security and nutrition challenges. Its quality directly affects human food security and nutrition [1]. In China, potato cultivation spans over 5 million hectares, predominantly in arid and semi-arid regions. Beyond its role as a staple food, it serves as a dual-purpose crop: approximately 20% of global potato output is allocated to non-food industries, including starch-based products (e.g., potato chips, noodles) and livestock feed. Starch and sugar are key indicators for assessing potato quality, not only determining its taste and storage properties but also significantly affecting its application value in the food processing industry [2]. Potassium (K) demand in potatoes is inherently linked to crop phenology, with critical uptake periods varying across developmental stages. For instance, potassium requirements peak during tuber formation and expansion phases to support photosynthate transport and starch accumulation, while excessive or insufficient supply at specific phenological stages can disrupt carbon partitioning and yield formation [3].
In particular, the content of reducing sugars (e.g., glucose, fructose) in tubers is a pivotal determinant of processing quality [4]. While soluble sugars serve as energy sources during tuber development, excessive levels (e.g., reducing sugars > 0.4 mg/g fresh weight) can trigger Maillard reactions during frying, generating harmful compounds like acrylamide and compromising product safety and color. Conversely, premium-quality tubers for processing typically exhibit low reducing sugar content (<0.2 mg/g) and high starch content (>12% dry weight), ensuring minimal browning and optimal texture [5,6].
Potassium (K), as an essential bulk nutrient in plants, not only regulates crop growth, development, and physiological function but also plays a key role in carbohydrate metabolism [7]. An appropriate amount of potassium can optimize the transport and distribution of photosynthetic products, regulate the accumulation of starch and sugar [8], and promote the conversion and storage of carbohydrates by activating key enzymes (e.g., sucrose synthase and starch synthase) [9]. It has been shown that adequate potassium supply in rice and maize can significantly increase photosynthetic efficiency and photosynthetic products, thereby increasing starch accumulation [10,11]; potassium increases starch content in wheat kernels by enhancing starch synthase activity in the kernels [12]; in sugarcane, potassium can increase stem sucrose content by reducing the proportion of reducing sugars [13]; and in tomato and maize, potassium improves quality by modulating key carbon metabolism enzymes [14,15]. In addition, potassium regulates the expression of key genes and transcription factors involved in starch synthesis, thereby promoting starch accumulation [16,17]. In potatoes, studies have shown that moderate potassium application can reduce the content of reducing sugars and increase the content of starch in tubers, thereby improving processing quality [18,19,20]. However, the specific mechanism of the role of potassium in potato starch–sugar metabolism, especially the role of starch and sugar transport and partitioning in various tissues at different developmental stages, is not clear. Importantly, the form of potash fertilizer has a crucial influence on these results: chloride fertilizers (e.g., KCl) may increase reducing sugar content and impair processing quality, while sulfate fertilizers (e.g., K2SO4) may increase nitrogen use efficiency when combined with ammonium-nitrogen sources. In this study, potassium nitrate (KNO3), because it can Ammonium nitrate can balance the changes in nitrogen concentration caused by different concentrations of potassium treatments.
The hypothesis of this study was that moderate potassium nitrate supply optimizes carbon partitioning by enhancing starch synthesis and inhibiting reducing sugar accumulation, thereby improving tuber yield and processing quality. The aim of this study is to systematically investigate the regulatory mechanism of potassium on starch–sugar metabolism in potatoes and to reveal the role of potassium in the regulation of starch–sugar metabolism and its contribution to the formation of tuber quality by analyzing the dynamic changes in starch and sugar content in various tissues of potato under different levels of potassium application. The results of this study not only provide a scientific basis for the in-depth analysis of the role of potassium in plant carbon metabolism but also offer theoretical guidance for the optimization of potato planting management and fertilization strategies.

2. Materials and Methods

2.1. Test Plant

The test material was the potato variety “Gannong Potato No. 9” provided by the State Key Laboratory of Aridland Crop Science (Gansu Agricultural University). The tuber of this variety has high dry matter characteristics, a starch content of 19.64% (significantly higher than ordinary varieties), reducing sugar content of only 0.11% (much lower than the processing threshold <0.3%), both fresh food and industrial processing of the double advantages, especially low sugar, and high amylose processing characteristics in the same varieties of outstanding performance.

2.2. Test Plants Obtained

The test material was propagated into 300 seedlings in May 2024 and allowed to grow for 21 days. The seedlings were left at room temperature for 24 h with the corks open for acclimation. Healthy and uniformly growing horticulture seedlings were selected from the bottles, the seedling root substrate was washed, and the roots were cut to 1 cm and transplanted into pots (diameter d = 12 cm, depth h = 10 cm) containing 300 g vermiculite for culture (The vermiculite for culture used was vermiculite, a sterile, inert mineral substrate composed primarily of hydrated magnesium-aluminum silicates. Its porous structure provides excellent water retention (70–75% moisture capacity) and aeration, while its low nutrient content (≤5 mg/kg K, ≤2 mg/kg N) minimizes interference with experimental treatments. After 14 days of domestication, uniformly growing plants were selected and grown in an artificial climate chamber (16L/8D, 25 °C) in June 2024 in 150 pots, one plant per pot.

2.3. Experimental Treatment

This experiment used a completely random design. MS medium without KNO3 and NH4NO3 was used as the basal nutrient solution; different levels of KNO3 were added to set the potassium concentration gradient, and different levels of NH4NO3 were added to balance the N concentration. Five medium formulations were set up so that the potassium concentrations were 0, 9.4, 23.5, 28.5, and 37.6 mmol/L, which were denoted as CK, T1, T2, T3, and T4, respectively (Table 1). Each potassium concentration treatment is set in 30 pots, 1 seedling per pot. In the pre-tuber formation stage, the plants were watered with MS-based nutrient solutions (modified to exclude KNO3 and NH4NO3 as basal components) supplemented with varying KNO3 levels (0, 9.4, 23.5, 28.5, 37.6 mmol/L) and NH4NO3 (Table 1). 300 mL per pot, applied once every 3 days for a total of two times. Vermiculite water content was continuously monitored using a soil moisture meter (TDR350, Spectrum Technologies, Aurora, IL, USA) and maintained at 70–75% (w/w) to ensure optimal nutrient uptake. After the second fertilization, nutrient solution application was halted, and distilled water was used to gradually reduce the moisture content to 60–65% (w/w), mimicking natural soil drying conditions to induce tuber maturation and promote starch accumulation, as lower moisture at later stages is known to enhance carbon allocation to storage organs. The experiment was conducted from June to September 2024.

2.4. Sampling

After treatment, three healthy and representative plants were randomly selected from the potted plants treated with different potassium concentrations for sampling at the pre-tuber formation stage (SI), mid-tuber formation stage (SII), mid-late tuber formation stage (SIII), and tuber maturity stage (SIV), respectively. The fertility period was judged according to the growth status of above-ground plants, underground stolons, and tubers. In the experiment, the time when the plants were in bud and the tips of the stolons were enlarged was defined as the first stage of tuber formation, the time when the plants were in full bloom and the tubers were formed was defined as the middle stage of tuber formation, 15 days after the plants dropped flowers was defined as the mid-late tuber formation stage, and the time when the plants were naturally withered was defined as the maturity stage of the tubers. Plant height and stem thickness were measured; roots, stems, leaves, and tubers were sampled separately for the determination of various indices. Five pots from each treatment were selected for yield assessment after the plants reached maturity.

2.5. Assessment of Phenotypic and Physiological Traits

2.5.1. Morphological Traits

Plant height is the distance from the stem base to the apical meristem, measured with a straightedge. Stem thickness is the maximum diameter of the first internode from the stem base to the tip, measured with a vernier caliper.

2.5.2. Physiological Indices

Extraction of sugar reaction solution: A 0.3 g sample was weighed and placed into a mortar. In total, 2 mL of ultrapure water was added, and the mixture was ground. The homogenate was poured into a centrifuge tube and centrifuged at 15,000 rpm for 10 min at 4 °C. The supernatant was dispensed into new tubes and treated in a 90 °C water bath for 2–3 h, followed by freezing at −20 °C for subsequent experiments.
Determination of glucose content: The glucose content was determined using the anthrone-sulfuric acid method. 30 µL of the reaction solution was mixed with 150 µL of 0.2% anthrone-sulfuric acid reagent. The mixture was heated in a 100 °C water bath for 1 min. After cooling, the absorbance was measured at 630 nm, and the glucose concentration was calculated using the standard curve, which was the sample concentration.
Determination of fructose content: A total of 50 µL of the reaction solution was combined with 100 µL of 1 g·L−1 resorcinol and 50 µL of concentrated hydrochloric acid. The mixture was incubated in an 80 °C water bath for 10 min. After cooling, the absorbance was measured at 480 nm, and the fructose content was derived from the standard curve and the formula, which was the sample concentration.
Determination of sucrose content: A total of 5 µL of 2 g·L−1 NaOH solution was added to 50 µL of the reaction solution. The mixture was boiled at 100 °C for 10 min and cooled. Subsequently, 150 µL of 10 g·L−1 HCl solution and 50 µL of 1 g·L−1 resorcinol were added. The mixture was thoroughly mixed and reacted in a 100 °C water bath for 10 min. After cooling, the absorbance was measured at 500 nm, and the sucrose content was calculated using the standard curve and the formula [21], which was the sample concentration.
S u g a r   c o n t e n t   ( µ g / g ) = sample   concentration   ×   dilution   ×   ( 2 ÷ sample   volume ) sample   mass   ×   10 6
Determination of starch content: The starch content was measured using iodine colorimetry [22]. A 0.2 g sample was weighed, and 2 mL of ultrapure water was added, followed by grinding in a mortar. The homogenate was transferred to a 15 mL centrifuge tube, mixed with 2 mL of 60% perchloric acid, and shaken for 5 min. The mixture was allowed to stand for 5 min, centrifuged at 3000 rpm for 10 min, and 50 µL of the supernatant was transferred into a new 15 mL centrifuge tube. Subsequently, 3 mL of ultrapure water and 1 mL of iodine reagent were added to the supernatant. The mixture was shaken thoroughly and allowed to stand for 5 min. Finally, 200 µL of the solution was pipetted into an enzyme plate, and the absorbance was measured at 660 nm using a microplate reader.
s t a r c h   c o n t e n t   ( % ) = sample   concentration Sample   quality   ×   1 10 × 0.5 10 × 10 6 × 100
Calculation of metabolic rate:
V T = Y 2 - Y 1 S 2 - S 1
where Y2 is the concentration at sampling time; Y2 is the initial concentration; S1 is the initial time; and S2 is the sampling time.
Calculation of carbon conversion rate:
P 1 = starch   content   ( % ) glucose   content   ( µ g / g )   +   fructose   content   ( µ g / g )   + Sucrose   content   ( µ g / g )
P 2 = Sucrose   content   ( µ g / g ) glucose   content   ( µ g / g )   +   fructose   content   ( µ g / g )
P 3 = glucose   content   ( µ g / g ) fructose   content   ( µ g / g )
Calculation of the amount of change in the rate of carbon conversion:
ΔP = PS(a+1) − PSa
where P1 is starch decomposition rate, reflecting the change in the relative rate of starch synthesis or decomposition; P2 is sucrose decomposition rate, reflecting the dynamic balance of sucrose synthesis or decomposition; P3 is Glucose decomposition rate, reflecting the main form of carbon in reducing sugars; the change in ΔP is p value.
Chromatic aberration value. Potato tubers stored at 10 °C for 30 days after harvest were taken, and their skin was cleaned. After peeling, they were cut into 0.8 mm-thick slices. The surface moisture was gently wiped with paper towels, and the slices were quickly put into a thermostatic fryer at 180 °C for deep-frying. After frying for 1 min, the potatoes were quickly removed, and the excess oil was drained off on the operating table before their color was measured by a colorimeter (D25LT, Hunter Lab, Reston, VA, USA). A standard colorimeter was used by the colorimetric method to determine the color difference between the surface of fried potato chips in terms of L* value, a* value, and b* value (L, a, b are based on the human perception of the three dimensions of color space, in which ±L value represents light and dark, ±a value represents red and green, and ±b value represents yellow and blue). Each group of samples was measured three times and averaged, and the total color difference ΔE was derived from the formula:
Δ E = L * L 0 2 + a * a 0 2 + b * b 0 2
where L0, a0, and b0 represent the values measured of the chips before frying, and L*, a*, and b* represent the values measured of the chips after frying.
  • Note: All reagents in the test are from China National Pharmaceutical Group Co., Ltd. (Beijing, China).

2.5.3. Data Analysis

Data were analyzed using SPSS 25.0 (IBM Corporation, Armonk, NY, USA), Origin 2024b (MicroCal, Northampton, MA, USA), and Microsoft Office 2019 software. The data collation, calculation of indicators, and coefficient of variation were conducted using Microsoft Office 2019. For statistical analysis, three-way ANOVA was performed via SPSS 25.0 to test the effects of potassium treatment (W), developmental stage (S), tissue part (P), and their interactions (W × S × P) on starch/sugar contents and yield traits, with the null hypothesis (no effect) rejected at p < 0.05. When ANOVA indicated significance, Duncan’s multiple range test (p < 0.05) was used for post hoc comparison of treatment means, with significant differences denoted by different lowercase letters in tables/figures. Pearson correlation analysis was employed to evaluate relationships between starch/sugar contents and growth/yield parameters, with significance levels defined as * (p < 0.05) and ** (p < 0.01). Additionally, Origin 2024b was utilized for data visualization.

3. Results

3.1. Effects of Different K+ Concentrations on Potato Plant Growth

The promoting effect of each treatment group on plant height showed a significant time gradient difference (Figure 1a). The plant height under T2 treatment reached the peak growth (49.31%) at the SII stage, then the increase decayed period by period, but still maintained at the highest level (24.29–37.35%). The plant height growth rate plummeted to less than 5.5% after the SII stage under T4 treatment. Plant height also increased to varying degrees under the T1 and T3 treatments, but the increases were generally lower than in the T2 treatment but higher than in the T4 treatment.
Stem thickness showed a strong dose–response to potassium concentration (Figure 1b). The growth of stem thickness under T2 treatment (84.21–46.77%) was significantly higher than that of other treatment groups, and the growth peaked at the SI stage. Stem thickness increased under T4 treatment compared to CK at different periods, but was generally lower than other treatments. The optimal growth under T2 (23.5 mmol/L K) supports the Hypothesis, demonstrating that moderate K enhances vegetative vigor without inducing ionic stress.

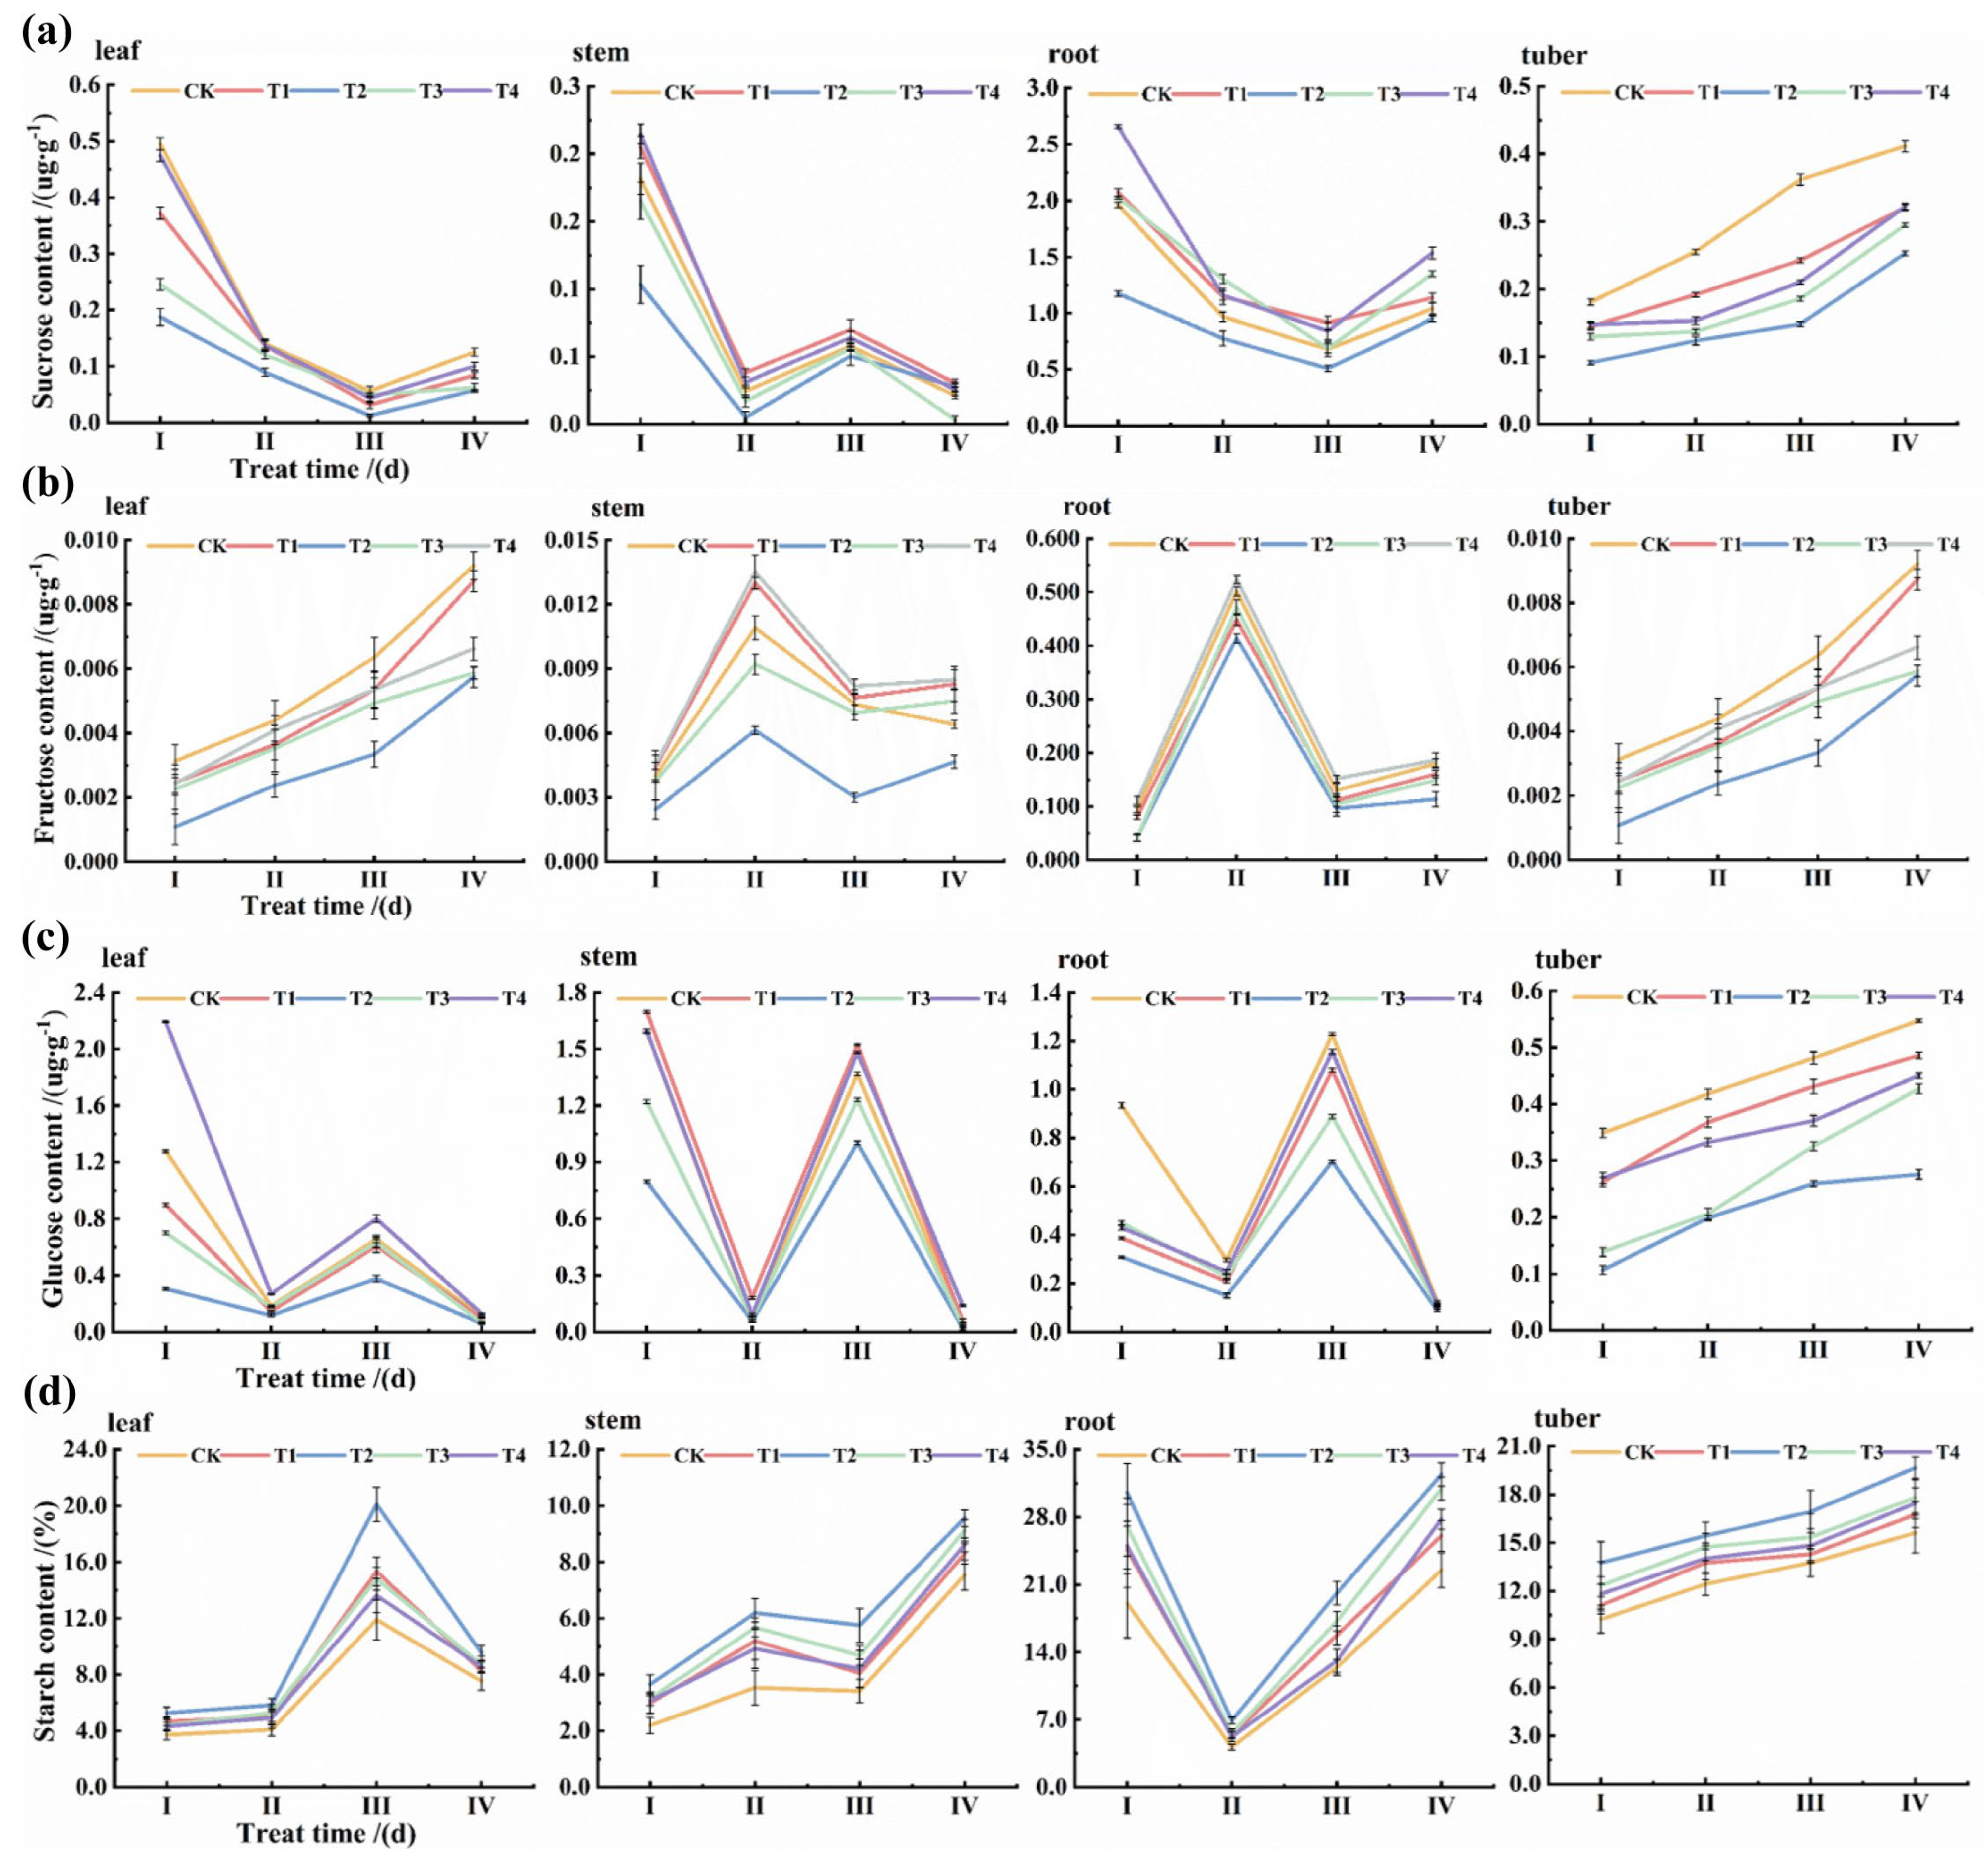
3.2. Effects of Different K+ Concentrations on Sucrose, Fructose, Glucose, and Starch Contents of Various Organs

As shown in Table 2, analysis of variance (ANOVA) on the contents of sucrose, fructose, glucose, and starch under different treatments, developmental periods, and tissue parts showed that different treatments significantly affected the metabolic levels of starch and sugar in potato, and metabolic characteristics of starch and sugar showed significant differences between different developmental periods and tissue parts. The significant reduction in reducing sugars and increase in starch under T2 validate the hypothesis, likely due to K-activated AGPase activity.

3.3. Dynamics of Sucrose, Fructose, Glucose, and Starch Contents

As shown in Figure 2a, among the different potassium concentration treatments, the T2 treatment significantly increased the starch content to 13.856% and significantly decreased the fructose and glucose contents (0.048 μg/g and 0.301 μg/g, respectively), suggesting that carbon partitioning was more in favor of starch synthesis under this treatment. In contrast, sucrose, fructose, and glucose contents (Figure 2b–d) were all highest in the T4 treatment. Starch and sugar metabolism remained dynamic and significantly different at different developmental periods. Starch content reached its highest value (15.641%) at SIV, while sucrose, fructose, and glucose reached their highest values at SI, SII, and SIII, respectively. Among the different tissue parts, starch and sucrose contents of underground tissue organs (roots and tubers) were significantly higher than those of aboveground tissue organs (stems and leaves), while the highest glucose content (0.714 μg/g) was found in the stems.

3.4. Trends of Starch and Sugar Metabolism and Forms of Carbon Storage Under Different Treatments, Periods, and Tissue Sites

P1, P2, and P3 and their dynamic changes showed the trends of starch and sugar metabolism and the main forms of carbon existence in different parts and at different times. Different treatments, tissues, and periods have significant effects on the dynamic balance of carbon metabolism in potatoes (Table 3). Among the treatments, the P1 values under the T2 treatment were significantly higher than the other treatments for each site and each period, whereas the CK and T4 treatments had lower levels of P1 values at all stages. P2 values were higher under T2 treatment than other treatments, higher in the roots under T4 treatment, while P2 values in leaves, stems, and tubers were lower under T4 treatment than other treatments. The hexose sugars in leaves and stems were dominated by glucose during SI and SIV, and the proportion of glucose in the hexose sugars decreased substantially during SII and SIV, but remained higher than that of fructose. The hexose sugars in roots were mainly dominated by glucose during SI and SIV, and were mainly dominated by fructose during SII and SIV. The hexose sugars in the tubers were mainly dominated by glucose. With tuber development, the proportion of glucose in tubers gradually and smoothly decreased, while the proportion of sucrose gradually and smoothly increased, indicating that the conversion of glucose to sucrose in tubers proceeded smoothly.

3.5. Trends in Starch–Sugar Metabolism and Forms of Carbon Presence in Different Treatments, Periods, and Tissue Sites

Trends of changes in starch and sugar metabolism and forms of carbon storage under different treatments, periods, and tissue sites (Table 4). Starch and sugar metabolism showed significant differences in the rates of accumulation and decomposition at different stages. Sucrose in leaves, stems, and roots mainly showed a decrease in content in the SII–I stage, whereas in the SIV–III stage, the rate of change in sucrose in leaves, roots, and tubers was mostly positive. The rate of change in fructose was small in all stages, with most values close to 0, reflecting its relatively smooth metabolism. The rate of change in glucose fluctuated significantly among different stages, with the rate of change being mainly positive in the SIII–II stage, while in the SIV–III stage, the rate of change in other parts, except tubers, mostly turned negative. The rate of change in starch in tubers had the fastest accumulation rate at the SII–I and SIV–III stages, indicating that these two stages were the critical periods for starch accumulation in tubers.
The different treatments significantly regulated the rate of starch and sugar metabolism. T2 treatment showed a higher rate of starch accumulation at several stages, especially in tubers, which were significantly higher than the other treatments at the SIII–II and SIV–III stages. In contrast, the CK treatment had a lower rate of sugar metabolism, a less fluctuating rate of starch change, and was slower in metabolic conversion.

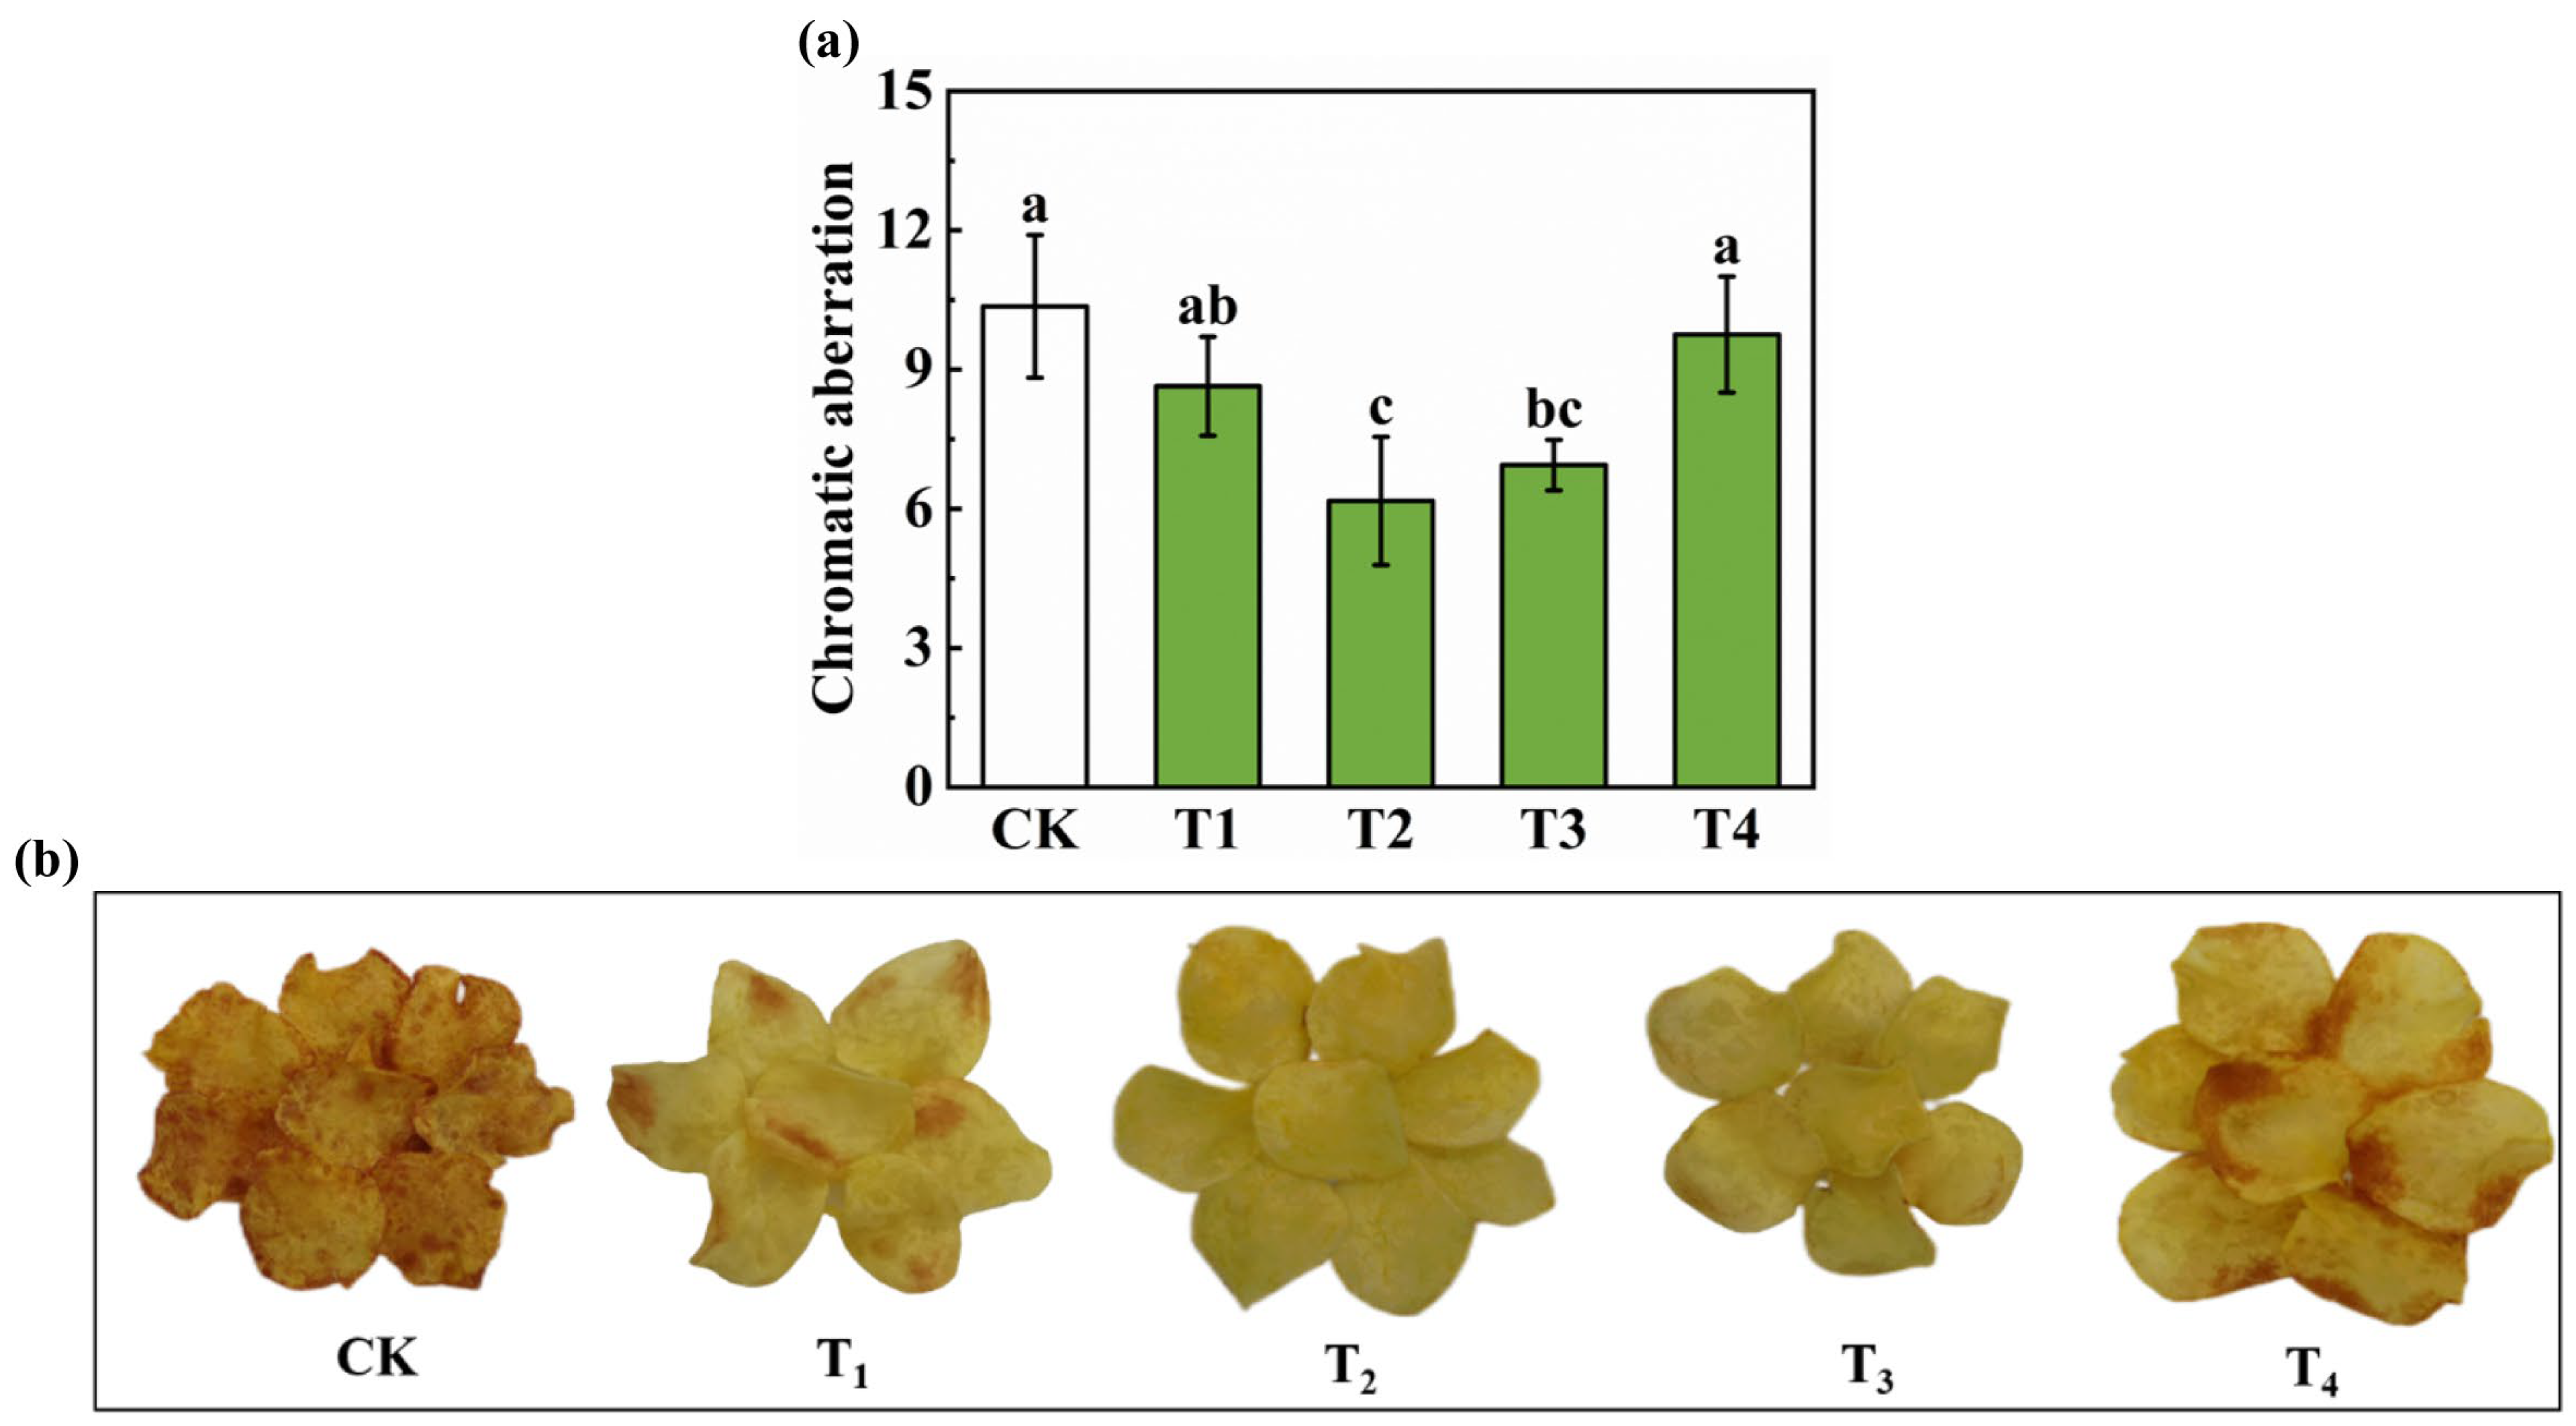
3.6. Effects of Different Potassium Treatments on Potato Yield Components and Quality of Fried Potato Chips

The effect of different treatments on potato tuber yield was significant (Table 5). The T2 treatment showed the best performance in three indicators: the number of tubers per plant, the weight of individual tubers, and the total yield per plant, with the number of tubers per plant at 7.766, the weight of individual tubers at 2.873 g, and the total yield amounting to 12.169 g, which was significantly higher than that of the other treatments. The T3 treatment was the next highest, with a total yield of 9.186 g per plant and a balanced performance in terms of the number and weight of tubers. The T1 and T4 treatments were close to each other, with total yields of 7.455 g and 7.644 g, respectively, whereas the CK treatment was the lowest in all the indicators, with a number of tubers per plant of 2.746 and a weight of only 0.31 g per individual tuber, resulting in a total yield of only 0.89 g (Table 5).
The color difference value is an important indicator of the quality of potato fritters, reflecting the effect of different potassium concentration treatments on potato color, with higher values indicating greater color variation. As shown in Figure 3a,b, the lowest color difference value was observed under the T2 treatment, indicating that this treatment had the least effect on color change. The higher color difference values for the CK (control) and T4 treatments indicate that these treatments may cause greater color variation.

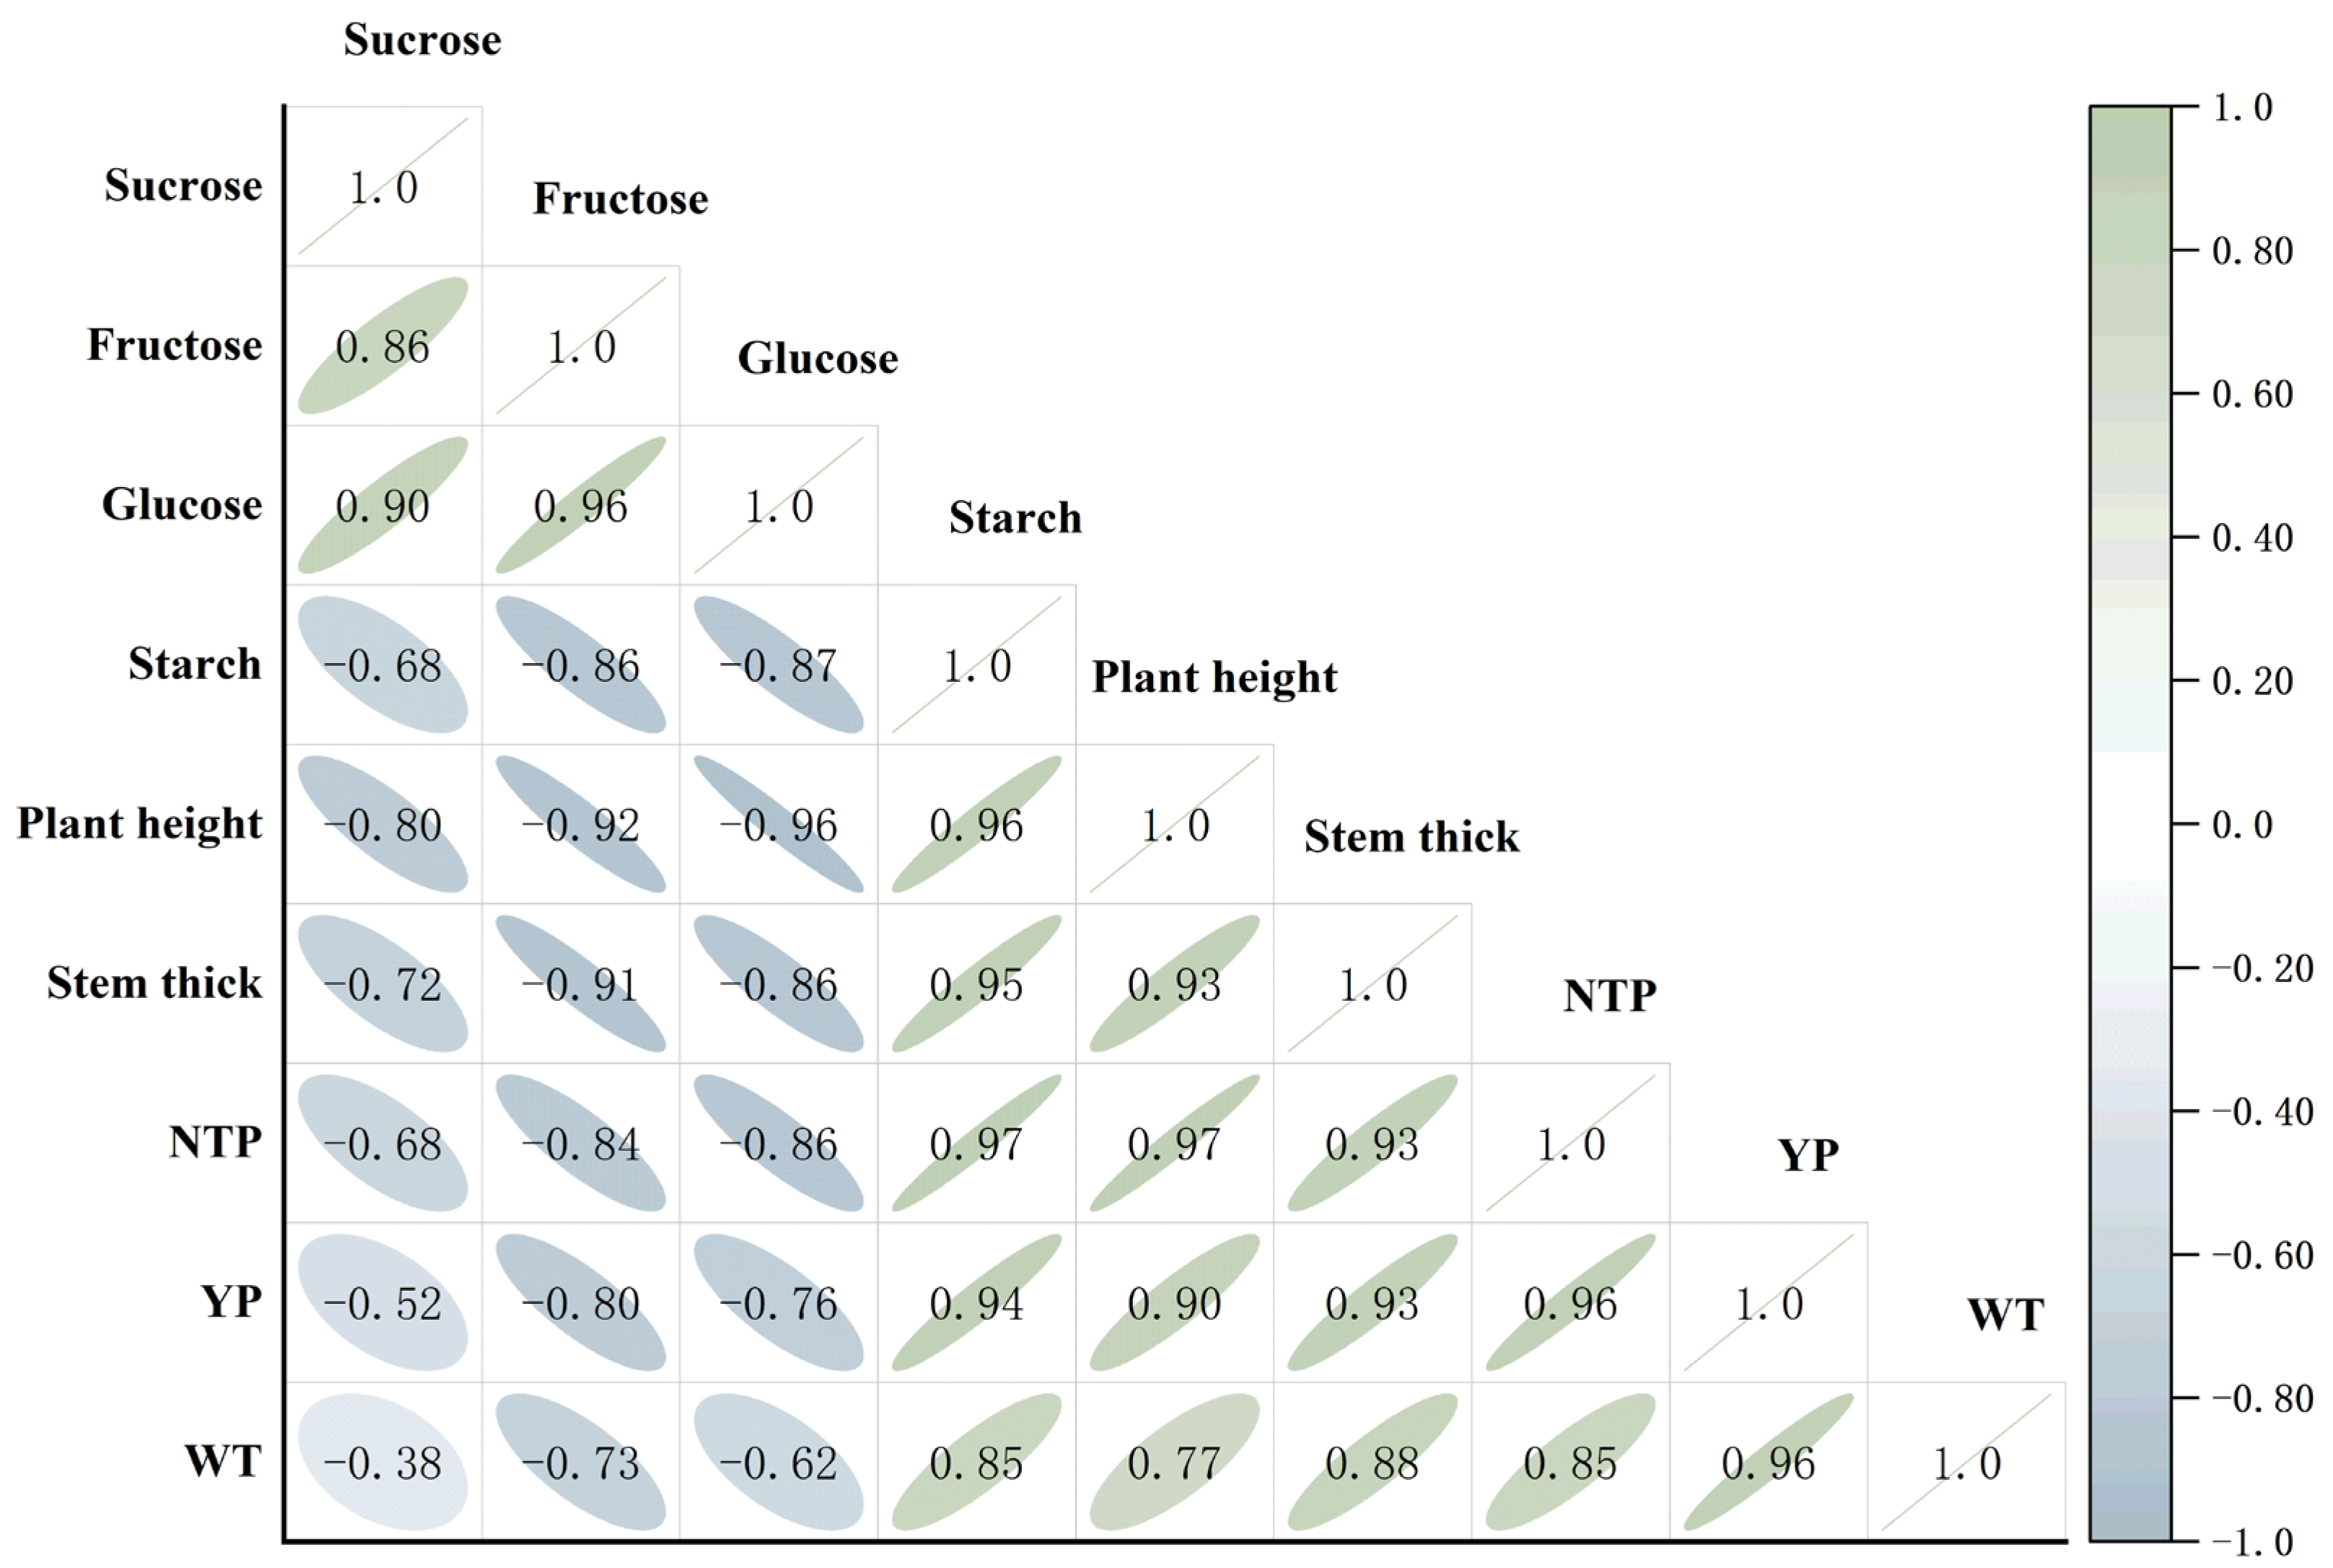
3.7. Relationships Between Starch and Sugar Contents and Potato Plant Growth and Yield

There were significant linear correlations among potato traits. The contents of sucrose, fructose, and glucose were all significantly (p < 0.01) negatively correlated with the number of potatoes formed on a single plant, single plant yield, and the weight of a single tuber, suggesting that an increase in sugar synthesis may be accompanied by a decrease in tuber yield (Figure 4). Among these, glucose content had the strongest negative correlation with the number of potatoes formed per plant (r = −0.86), and starch content was significantly positively correlated with the number of potatoes formed per plant and single plant yield (r = 0.97 ** and r = 0.94 **).

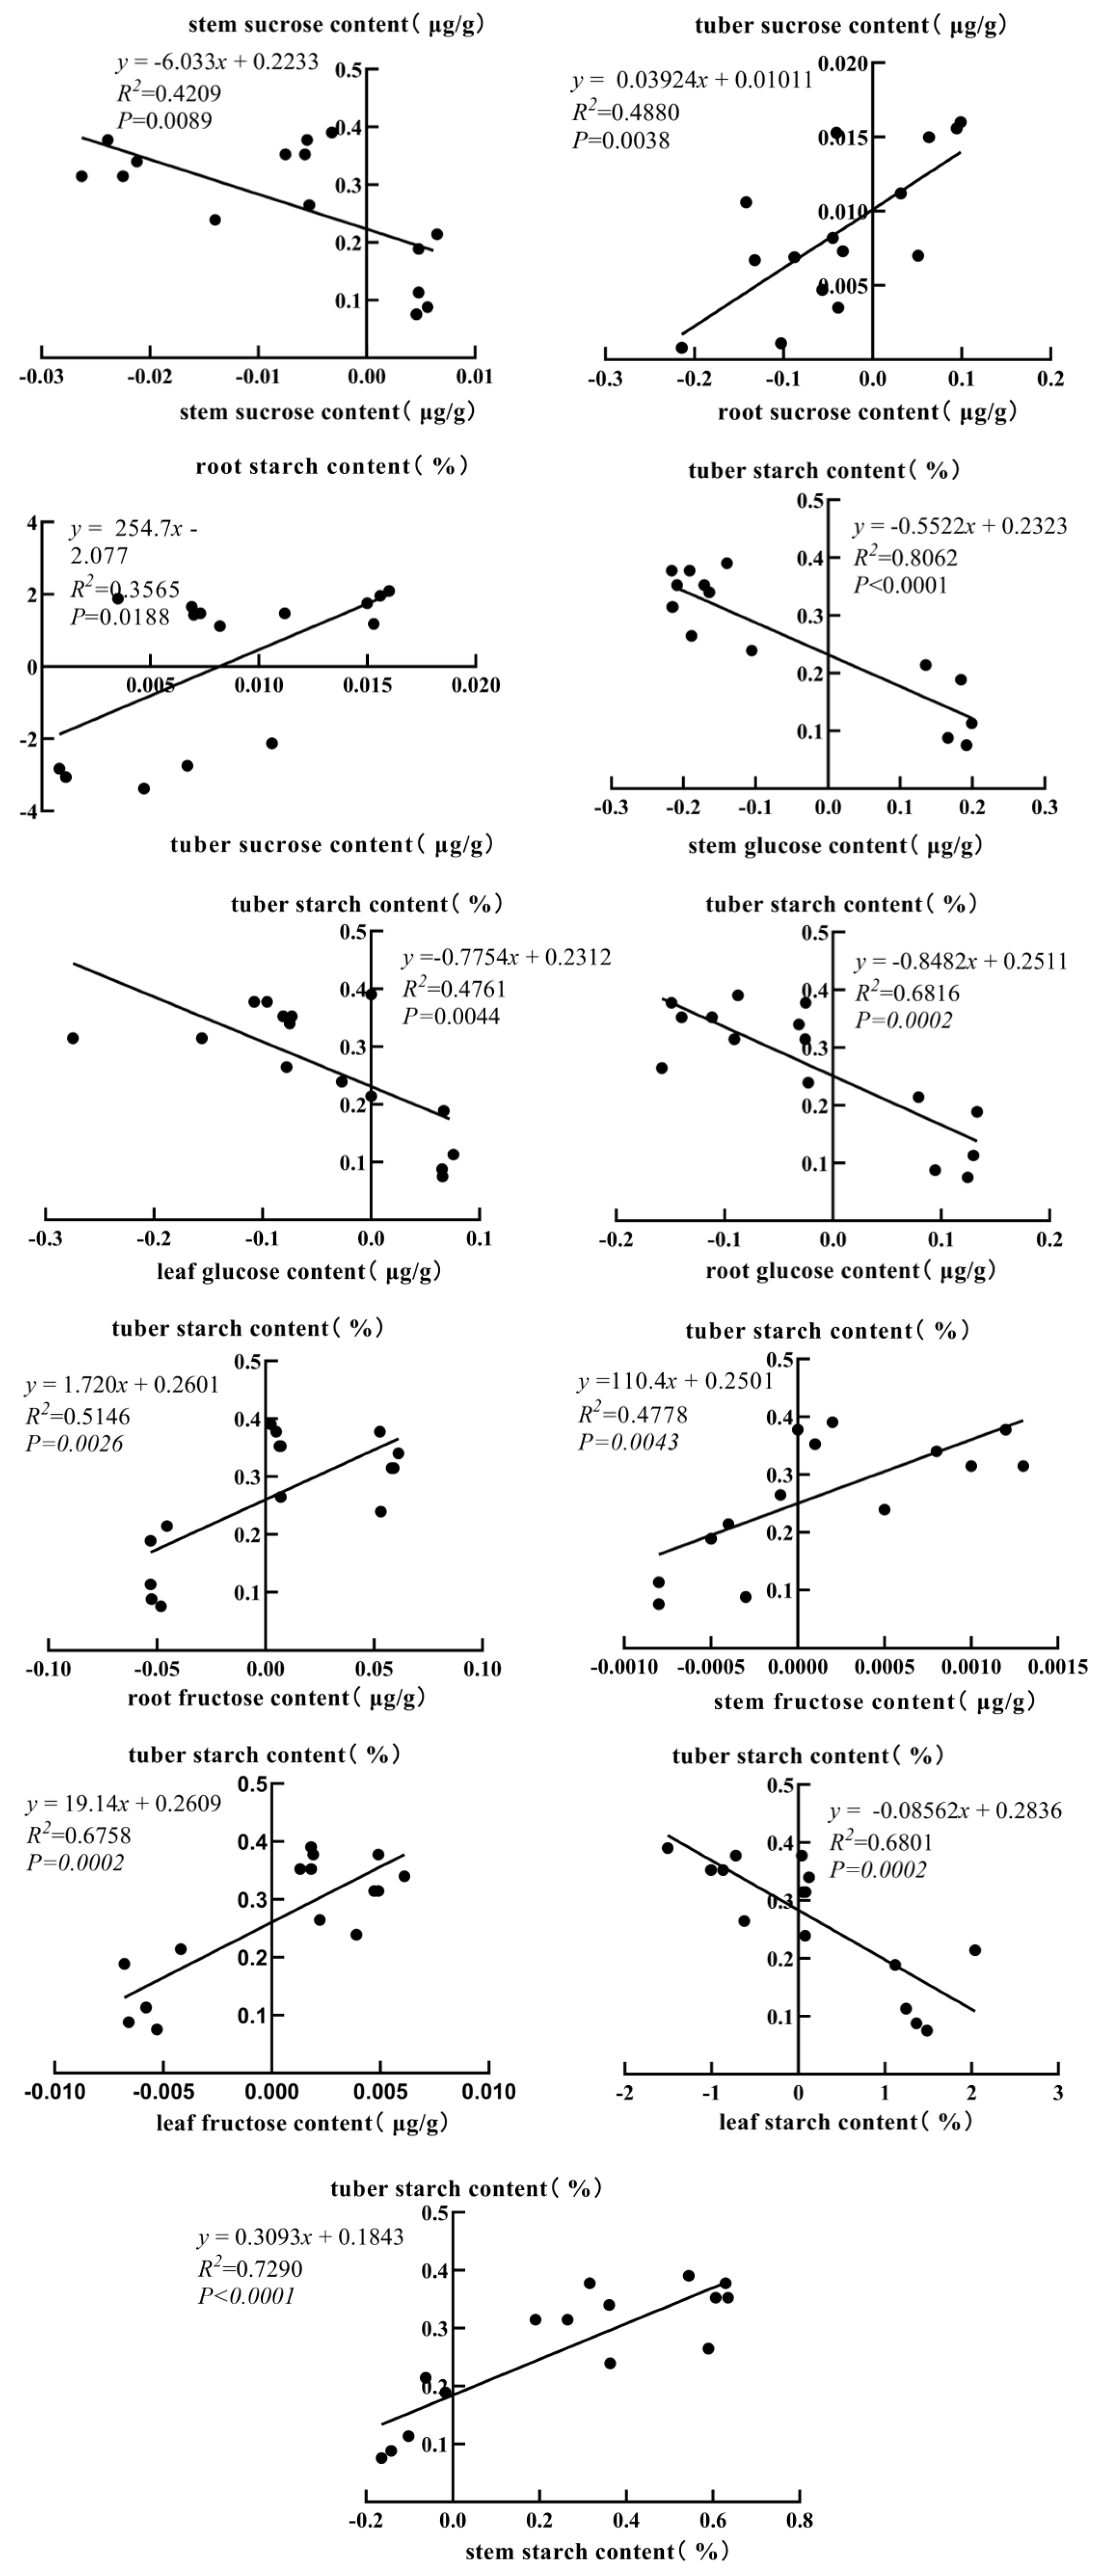
3.8. Correlation Analysis of Starch–Sugar Metabolic Rate Among Different Plant Tissues

As shown in Figure 5, starch–sugar metabolic rates in different potato tissues showed significant correlations, reflecting carbohydrate transport and partitioning patterns among tubers, stems, leaves, and roots. Sucrose in tubers was significantly and positively correlated with root sucrose and root starch (r = 0.699 and r = 0.597 *). Tuber starch was significantly and positively correlated with fructose in stems (r = 0.822 **), fructose in leaves (r = 0.691 **), and fructose in roots (r = 0.717 **). Tuber starch was significantly and negatively correlated with glucose in leaves (r = −0.690 **), glucose in stems (r = −0.898 **), and glucose in roots (r = −0.826 **). The analysis also revealed that tuber starch was significantly negatively correlated with starch in leaves (r = −0.825 **) and significantly positively correlated with starch in stems (r = 0.854 **).

4. Discussion

4.1. Effects of Potassium on Potato Plant Growth and Tuber Yield

The physiological and biochemical activities of potatoes are closely related to potassium, and moderate potassium fertilization can promote plant growth and improve yield [22,23], with plant height and stem thickness being important indicators of growth and development [24,25]. The results of different potassium concentration treatments in the experiment showed that the potato exhibited the best plant height, stem thickness, and tuber yield under moderate potassium application (23.5 mmol/L, T2). This result not only corroborates the findings of 27. Liu [26] found that moderate potassium application promotes stem and leaf growth, but also supports the conclusions of Shi and Clasen [27,28] that a moderate potassium concentration improves yield. In contrast, under low potassium (9.4 mmol/L, T1) and high potassium (37.6 mmol/L, T4) conditions, plants showed signs of growth limitation compared with the T2 treatment, which may be related to the blockage of chlorophyll synthesis, reduction in photosynthetic efficiency, and disruption of ionic homeostasis [29,30]. This threshold effect suggests that potassium uptake and utilization are positively promoted within a certain range, while growth is inhibited by ionic antagonism or metabolic imbalance beyond that range [31]. Potassium regulation of carbohydrate conversion and tuber quality.

4.2. Effects of Carbohydrate Composition, Content, and Metabolic Regulation on Potato Tuber Quality and Processing Performance

The composition and content of carbohydrates in potato tubers are key determinants of their quality and commercial value [32]. The starch accumulation rate, as the main storage form of photosynthetic products, directly affects the final yield. However, under low-temperature storage conditions, tuber starch can be converted to reducing sugars, causing the phenomenon of low-temperature saccharification. During deep-frying, reducing sugars and free amino acids may undergo a Maillard reaction, generating browning products and the toxic carcinogen acrylamide [33], thereby reducing processing quality. The results of this experiment showed that starch content under the T2 treatment was significantly higher than in the T1, T3, and T4 groups, while sucrose, fructose, and glucose contents were significantly lower than in the other treatments. The studies of Luo also showed that tuber-reducing sugar content was negatively correlated with the amount of potassium applied, while starch content increased with the increase in potassium application [34], indicating that within a certain range of potassium application, moderate potassium supplementation is beneficial for improving starch accumulation and reducing sugar content. Further analysis revealed that among the different developmental stages, the starch content of tubers was significantly higher in SIV than in other periods, while sucrose, fructose, and glucose reached their highest values in SI, SII, and SIII, respectively. This may be related to the rapid use of sugars for cell wall synthesis and starch storage during the pre-tuber formation period [35]. Meanwhile, in the later maturation stage, accompanied by the activation of specific gene expression, QTL localization studies showed that the expression of starch synthesis-related genes was significantly up-regulated during the late expansion stage, with rapid starch accumulation [36]. This simultaneously demonstrates the critical influence of the developmental period on starch–sugar metabolism and the importance of carbon metabolism regulation at specific stages for optimizing tuber processing quality.

4.3. Effect of Potassium on the Dynamics of Starch–Sugar Metabolism and Key Transformation Processes in Tubers

Starch–sugar metabolism in potato tubers is a dynamic process that is closely related to potassium application [37]. Benito [38] reported that moderate potassium application enhances starch accumulation. In this study, T2 treatment resulted in greater carbohydrate conversion to starch in all parts and at all developmental stages, indicating that suitable potassium fertilization facilitates starch storage. This may be because potassium activates adenosine diphosphate glucose pyrophosphorylase (AGPase) and starch synthase (SSS) while inhibiting sucrose synthase (SuSy) activity, thus reducing the ability to partition photosynthetic products and contributing to the accumulation of starch in the tubers [39]. Conversely, T4 treatment enhanced starch-to-sugar conversion at all stages, probably due to sustained high α-amylase and β-amylase activities under high potassium conditions, which accelerated starch breakdown [40]. In the conversion of sucrose to six-carbon sugars, T4 treatment promoted sucrose accumulation in roots and accelerated sucrose conversion to fructose and glucose in the leaves, stems, and tubers, which might be related to the enhancement of sucrose phosphate synthase (SPS) activity by potassium [41,42].

4.4. Carbohydrate Transport and Partitioning Characteristics of Potato Tissues

This study revealed the interrelationships between the rates of starch–sugar metabolism among potato tissues, reflecting the patterns of carbohydrate transport and partitioning among tubers, roots, stems, and leaves. Different from previous studies that only focused on single tissue or static metabolic results, this study demonstrated for the first time that moderate potassium application (23.5 mmol/L) could regulate the direction and conversion rate of carbon allocation by dynamically monitoring the carbon metabolism parameters of multi-stage and multi-tissues, and build a cross-tissue space-time collaborative carbon metabolism network. The results showed that sucrose in tubers was significantly positively correlated with sucrose and starch in roots, which may indicate that roots temporarily store photosynthetic products as sucrose, convert them to starch via sucrose transporter proteins, and release them through hydrolysis or direct transport during the tuber formation period. At the same time, tuber starch was significantly and positively correlated with fructose in stems, leaves, and roots, which suggests that fructose may serve as an important precursor of starch synthesis, while tuber starch was significantly and negatively correlated with glucose in all tissues, reflecting the existence of competition for carbon allocation. Furthermore, glucose in all tissues was significantly negatively correlated, reflecting the existence of competition for carbon allocation. In addition, the starch and sucrose contents of the underground organs (roots and tubers) were significantly higher than those of the aboveground organs (stems and leaves), suggesting that tubers play a key role in carbohydrate storage as the main storage organ; whereas the glucose content of the stems reached a maximum value of 0.714 μg/g, demonstrating an important function of the stems in the transportation of sugars [43,44,45].

4.5. Future Research Directions

In this study, a systematic analysis of the carbon metabolism process in potatoes was carried out by adopting the dynamic monitoring method at different stages and in different tissues, revealing the regulatory mechanism of balance between starch and sugar under different potassium concentrations, and providing a scientific basis for the precise management of potassium fertilizer for high-quality and high-yield potato cultivation. The results confirmed the hypothesis that a moderate supply of potassium nitrate could optimize carbon allocation by promoting starch synthesis and inhibiting reducing sugar accumulation, thereby improving tuber yield and processing quality. The experiment was conducted in greenhouse pot cultivation, and the effects of light, temperature fluctuations, and soil microbial interactions on potassium uptake under field conditions were not fully demonstrated. Future research should further validate this in multi-species and field-based trials. Furthermore, future studies can deeply explore the key enzyme activities and related molecular mechanisms, in combination with gene expression and protein function analysis, to elucidate the mechanism of potassium–enzyme–gene interactions and further reveal the molecular basis of potassium-regulated carbon metabolism, in order to promote the improvement of potato quality and precise fertilization management.

5. Conclusions

This study revealed the spatial and temporal regulation of potato starch–sugar metabolism by potassium, and the results are summarized as follows:
  • Effect of potassium on potato growth and tuber quality. The appropriate potassium concentration (23.5 mmol/L) promoted potato growth and increased tuber yield, and simultaneously increased starch accumulation and decreased the reducing sugar content within the tubers, thus improving processing quality.
  • Dynamic changes in starch and sugar contents. Starch and sugar contents showed significant changes at different developmental stages and in various organs (leaves, stems, roots, and tubers), with more allocation of carbon to starch synthesis under the 23.5 mmol/L potassium concentration treatment and a high and stable rate of starch accumulation in the tubers.
  • Correlations in starch–sugar metabolism rates among tissues. Further correlation analyses showed that the rates of starch–sugar metabolism were closely correlated among the tissues, suggesting a synergistic role of the tissues in the overall regulation of carbon metabolism.
Future research should validate these findings in field trials with different potato cultivars and explore molecular mechanisms, such as the role of potassium transporters and starch synthesis-related genes in mediating carbon partitioning. In addition, integrating soil microbial interactions and dynamic potassium uptake modeling could improve the accuracy of fertilizer management strategies.
This study clarified the positive regulatory effect of optimal potassium application on potato growth and quality, revealed the spatial and temporal characteristics of potassium concentration on the dynamic changes and rate regulation of starch–sugar metabolism in different developmental stages and tissue parts, and provided theoretical basis and practical guidance for the in-depth understanding of the role of potassium in potato carbon metabolism as well as the strategy of optimizing fertilizer management to improve the processing quality of potatoes.

Author Contributions

Conceptualization, J.-L.L. and B.Y.; Methodology, J.-L.L.; Software, J.-L.L.; Validation, J.-L.L., S.-L.F. and R.G.; Formal analysis, J.-L.L. and B.Y.; Resources, B.Y.; Data curation, J.-L.L.; Writing—original draft, J.-L.L.; Writing—review & editing, J.-L.L. and B.Y.; Visualization, B.Y. and J.L.; Supervision, B.Y. and J.L.; Project administration, B.Y. and J.L.; Funding acquisition, H.-Y.Y., L.-X.C. and B.Y. All authors have read and agreed to the published version of the manuscript.

Funding

This research was supported by the Gansu Province Science and Technology Program (25YFNA043), the Young Doctor Program Supported by the Department of Education of Gansu Province (2024QB-061), the Earmarked fund for Gansu Agriculture Research System (GSARS05), the Lanzhou Talent Innovation and Entrepreneurship Program (2022-RC-40), the Gansu Provincial Science and Technology Plan Project (23CXNA0008), the State Key Laboratory of Aridland Crop Science (GSCS-2023-Z05), and the National Natural Science Foundation of China (32360091).

Data Availability Statement

The data presented in this study are available on request from the corresponding authors.

Acknowledgments

We extend our sincere gratitude to the College of Agronomy at Gansu Agricultural University and the State Key Laboratory of Aridland Crop Science for their invaluable support in facilitating our experimental platform.

Conflicts of Interest

The authors declare no conflicts of interest.

References

  1. Mazadul, I.M.; Sauda, N.; Afroz, N.; Nasir, U.M.; Nurul, A.M.; Mushfiqur, R.M.; Hasan, T.M.M.; Mohammed, A.A.; Ahmed, G.; Sharif, A. Dry Matter, Starch Content, Reducing Sugar, Color and Crispiness Are Key Parameters of Potatoes Required for Chip Processing. Horticulturae 2022, 8, 362. [Google Scholar] [CrossRef]
  2. Šimková, D.; Lachman, J.; Hamouz, K.; Vokál, B. Effect of cultivar, location and year on total starch, amylose, phosphorus content and starch grain size of high starch potato cultivars for food and industrial processing. Food Chem. 2013, 141, 3872–3880. [Google Scholar] [CrossRef] [PubMed]
  3. Torabian, S.; Farhangi-Abriz, S.; Qin, R.; Noulas, C.; Loka, D.A. Potassium: A Vital Macronutrient in Potato Production—A Review. Agronomy 2021, 11, 543. [Google Scholar] [CrossRef]
  4. Zörb, C.; Senbayram, M.; Peiter, E. Potassium in agriculture—Status and perspectives. J. Plant Physiol. 2014, 171, 656–669. [Google Scholar] [CrossRef] [PubMed]
  5. Li, S.; Duan, Y.; Guo, T.; Zhang, P.; He, P.; Johnston, A.; Shcherbakov, A. Potassium management in potato production in Northwest region of China. Field Crops Res. 2015, 174, 48–54. [Google Scholar] [CrossRef]
  6. Neilson, J.; Lagüe, M.; Thomson, S.; Aurousseau, F.; Murphy, A.M.; Bizimungu, B.; Deveaux, V.; Bègue, Y.; Jacobs, J.M.E.; Tai, H.H. Gene expression profiles predictive of cold-induced sweetening in potato. Funct. Integr. Genom. 2017, 1, 459–476. [Google Scholar] [CrossRef]
  7. Hasanuzzaman, M.; Bhuyan, M.H.M.B.; Nahar, K.; Hossain, M.S.; Fujita, M. Potassium: A Vital Regulator of Plant Responses and Tolerance to Abiotic Stresses. Agronomy 2018, 8, 31. [Google Scholar] [CrossRef]
  8. Gao, Y.; Tang, Z.; Xia, H.; Sheng, M.; Liu, M.; Pan, S.; Li, Z.; Liu, J. Potassium Fertilization Stimulates Sucrose-to-Starch Conversion and Root Formation in Sweet Potato (Ipomoea batatas (L.) Lam.). Int. J. Mol. Sci. 2021, 22, 4826. [Google Scholar] [CrossRef]
  9. Jeddou, K.B.; Chaari, F.; Maktouf, S.; Nouri-Ellouz, O.; Helbert, C.B.; Ghorbel, R.E. Structural, functional, and antioxidant properties of water-soluble polysaccharides from potatoes peels. Food Chem. 2016, 205, 97–105. [Google Scholar] [CrossRef]
  10. Liu, Y.; Gao, J.; Zhao, Y.; Fu, Y.; Yan, B.; Wan, X.; Cheng, G.; Zhang, W. Effects of different phosphorus and potassium supply on the root architecture, phosphorus and potassium uptake, and utilization efficiency of hydroponic rice. Sci. Rep. 2024, 14, 21178. [Google Scholar] [CrossRef]
  11. Shah, I.H.; Wu, J.H.; Li, X.Y.; Hameed, M.K.; Manzoor, M.A.; Li, P.L.; Zhang, Y.D.; Niu, Q.L.; Chang, L.Y. Exploring the role of nitrogen and potassium in photosynthesis implications for sugar: Accumulation and translocation in horticultural crops. Sci. Hortic. 2024, 327, 112832. [Google Scholar] [CrossRef]
  12. Huang, L.; Tan, H.; Zhang, C.; Li, Q.; Liu, Q. Starch biosynthesis in cereal endosperms: An updated review over the last decade. Plant Commun. 2021, 2, 100237. [Google Scholar] [CrossRef] [PubMed]
  13. Luo, A.; Kang, S.; Chen, J. SUGAR Model-Assisted Analysis of Carbon Allocation and Transformation in Tomato Fruit Under Different Water Along with Potassium Conditions. Front. Plant Sci. 2020, 11, 712. [Google Scholar] [CrossRef]
  14. Martineau, E.; Domec, J.C.; Bosc, A.; Dannoura, M.; Gibon, Y.; Bénard, C.; Jordan-Meille, L. The role of potassium on maize leaf carbon exportation under drought condition. Acta Physiol. Plant. 2017, 39, 219. [Google Scholar] [CrossRef]
  15. Zhao, S.; Zhang, Y.; Tan, M.; Zhang, C.; Jiao, J.; Wu, P.; Feng, K.; Li, L. NnNF-YB1 induced by the potassium fertilizer enhances starch synthesis in rhizomes of Nelumbo nucifera. Ind. Crops Prod. 2023, 203, 117197. [Google Scholar] [CrossRef]
  16. Shi, L.; Wang, J.; Liu, Y.; Ma, C.; Guo, S.; Lin, S.; Wang, J. Transcriptome analysis of genes involved in starch biosynthesis in developing Chinese chestnut (Castanea mollissima Blume) seed kernels. Sci. Rep. 2021, 11, 3570. [Google Scholar] [CrossRef]
  17. Li, Y.; Yin, M.; Li, L.; Zheng, J.; Yuan, X.; Wen, Y. Optimized potassium application rate increases foxtail millet grain yield by improving photosynthetic carbohydrate metabolism. Front. Plant Sci. 2022, 13, 1044065. [Google Scholar] [CrossRef]
  18. Wilmer, L.; Pawelzik, E.; Naumann, M. Comparison of the Effects of Potassium Sulphate and Potassium Chloride Fertilisation on Quality Parameters, Including Volatile Compounds, of Potato Tubers After Harvest and Storage. Front. Plant Sci. 2022, 13, 920212. [Google Scholar] [CrossRef]
  19. Zhang, W.; Liu, X.; Wang, Q.; Zhang, H.; Li, M.; Song, B.; Zhao, Z. Effects of potassium fertilization on potato starch physicochemical properties. Int. J. Biol. Macromol. 2018, 117, 467–472. [Google Scholar] [CrossRef]
  20. Ali, M.M.E.; Petropoulos, S.A.; Abdelfattah, D.; Elbagory, M.; Mohamed, M.H. Plant Growth, Yield and Quality of Potato Crop in Relation to Potassium Fertilization. Agronomy 2021, 11, 675. [Google Scholar] [CrossRef]
  21. Sheng, W.; Wei, C. Screening methods for cereal grains with different starch components: A mini review. J. Cereal Sci. 2022, 108, 103557. [Google Scholar] [CrossRef]
  22. Liu, K.; Xv, J.; Si, C.; Shi, Q.; Ding, Z.; Tang, X.; Xv, M.; Shi, Y.; Liu, J. Effect of potassium fertilization on storage root number, yield, and appearance quality of sweet potato (Ipomoea batatas L.). Front. Plant Sci. 2023, 14, 1298739. [Google Scholar] [CrossRef] [PubMed]
  23. Wei, T.; Yun, Z.; Ya, L.; Xin, W.; Meng, K.; Hui, Y.; Dai, M.; Qiang, L. Quantifying cultivation technique and growth dynamics of purple-fleshed sweetpotato (Ipomoea batatas L.) in China. Field Crop Res. 2018, 227, 41–48. [Google Scholar] [CrossRef]
  24. Miao, Y.; Wang, L.; Peng, C.; Li, H.; Li, X.; Zhang, M. Banana plant counting and morphological parameters measurement based on terrestrial laser scanning. Plant Methods 2022, 18, 66. [Google Scholar] [CrossRef]
  25. Meng, Z.; Duan, A.; Chen, D.; Dassanayake, K.B.; Wang, X.; Liu, Z.; Liu, H.; Gao, S. Suitable indicators using stem diameter variation-derived indices to monitor the water status of greenhouse tomato plants. PLoS ONE 2017, 12, e0171423. [Google Scholar] [CrossRef] [PubMed]
  26. Liu, M.; Zhang, A.; Chen, X.; Jin, R.; Li, H.; Tang, Z. The Effect of Potassium Deficiency on Growth and Physiology in Sweetpotato [Ipomoea batatas (L.) Lam.] during Early Growth. HortScience 2017, 52, 1020–1028. [Google Scholar] [CrossRef]
  27. Shi, B.; Guo, X.; Liu, H.; Jiang, K.; Liu, L.; Yan, N.; Farag, M.A.; Liu, L. Dissecting Maillard reaction production in fried foods: Formation mechanisms, sensory characteristic attribution, control strategy, and gut homeostasis regulation. Food Chem. 2024, 438, 137994. [Google Scholar] [CrossRef]
  28. Clasen, B.M.; Stoddard, T.J.; Luo, S.; Demorest, Z.L.; Li, J.; Cedrone, F.; Tibebu, R.; Davison, S.; Ray, E.E.; Daulhac, A. Improving cold storage and processing traits in potato through targeted gene knockout. Plant Biotechnol. J. 2016, 14, 169–176. [Google Scholar] [CrossRef]
  29. Ji, S.; Grimm, B.; Wang, P. Chloroplast SRP43 and SRP54 independently promote thermostability and membrane binding of light-dependent protochlorophyllide oxidoreductases. Plant J. 2023, 115, 1583–1598. [Google Scholar] [CrossRef]
  30. Bhattarai, B. In Effect of Potassium on Quality and Yield of Potato Tubers—A Review. Int. J. Agric. Environ. Food Sci. 2018, 3, 7–12. [Google Scholar] [CrossRef]
  31. Sandaña, P.; Soratto, R.P.; Silva, J.C.A.; Valenzuela, A.; Parecido, R.J.; Fernandes, A.M.; Ciampitti, I.A. Critical potassium dilution curve for potato crops. Field Crops Res. 2024, 316, 109492. [Google Scholar] [CrossRef]
  32. Lal, M.K.; Tiwari, R.K.; Kumar, R.; Naga, K.C.; Kumar, A.; Singh, B.; Raigond, P.; Dutt, S.; Chourasia, K.N.; Kumar, D.; et al. Effect of potato apical leaf curl disease on glycemic index and resistant starch of potato (Solanum tuberosum L.) tubers. Food Chem. 2021, 359, 129939. [Google Scholar] [CrossRef]
  33. Tu, B.; Liu, C.; Tian, B.; Zhang, Q.; Liu, X.; Herbert, S.J. Reduced abscisic acid content is responsible for enhanced sucrose accumulation by potassium nutrition in vegetable soybean seeds. J. Plant Res. 2017, 130, 551–558. [Google Scholar] [CrossRef] [PubMed]
  34. Luo, A.; Zhang, X.; Wang, C.; Zhou, C. Effects of Different Water and Potassium Supply on Glucose, Fructose, and Sucrose Carbon Allocation in Tomato Fruit. Plant Growth Regul. 2022, 41, 684–700. [Google Scholar] [CrossRef]
  35. Liu, T.; Kawochar, M.A.; Liu, S.; Cheng, Y.; Begum, S.; Wang, E.; Zhou, T.; Liu, T.; Cai, X.; Song, B. Suppression of the tonoplast sugar transporter, StTST3.1, affects transitory starch turnover and plant growth in potato. Plant J. 2023, 113, 342–356. [Google Scholar] [CrossRef]
  36. Li, J.; Wang, Y.; Wen, G.; Li, G.; Li, Z.; Zhang, R.; Ma, S.; Zhou, J.; Xie, C. Mapping QTL underlying tuber starch content and plant maturity in tetraploid potato. Crop J. 2019, 7, 261–272. [Google Scholar] [CrossRef]
  37. Zhang, X.; Li, Y.; Dong, J.; Sun, Y.; Fu, H. Split Application of Potassium Reduces Rice Chalkiness by Regulating Starch Accumulation Process Under High Temperatures. Agronomy 2025, 15, 116. [Google Scholar] [CrossRef]
  38. Benito, P.; Bellón, J.; Porcel, R.; Yenush, L.; Mulet, J.M. The Biostimulant, Potassium Humate Ameliorates Abiotic Stress in Arabidopsis thaliana by Increasing Starch Availability. Int. J. Mol. Sci. 2023, 24, 12140. [Google Scholar] [CrossRef]
  39. Peng, L.; Xiao, H.; Li, R.; Zeng, Y.; Gu, M.; Moran, N.; Yu, L.; Xu, G. Potassium transporter OsHAK18 mediates potassium and sodium circulation and sugar translocation in rice. Plant Physiol. 2023, 193, 2003–2020. [Google Scholar] [CrossRef]
  40. Shankar, A.; Singh, A.; Kanwar, P.; Srivastava, A.K.; Pandey, A.; Suprasanna, P.; Kapoor, S.; Pandey, G.K. Gene expression analysis of rice seedling under potassium deprivation reveals major changes in metabolism and signaling components. PLoS ONE 2013, 8, e70321. [Google Scholar] [CrossRef]
  41. Shah, I.H.; Manzoor, M.A.; Azam, M.; Jinhui, W.; Li, X.; Rehman, A.; Li, P.; Zhang, Y.; Niu, Q.; Chang, L. Comprehensive characterization and expression profiling of sucrose phosphate synthase (SPS) and sucrose synthase (SUS) family in Cucumis melo under the application of nitrogen and potassium. BMC Plant Biol. 2025, 25, 285. [Google Scholar] [CrossRef] [PubMed]
  42. Ahmad, H.; Sajid, M.; Ullah, R.; Haya, S.; Shahab, M. Dose Optimization of Potassium (K) for Yield and Quality Increment of Strawberry (Fragaria ×ananassa Duch) Chandler. Exp. Agric. 2014, 4, 1526–1535. [Google Scholar] [CrossRef]
  43. Fan, W.; Gao, H.; Zhang, L.; Mao, D.; Li, Y.; Zhang, L.; Li, J.; Zhao, X.; Hou, H. Genome-wide identification and expression profiling of MST, SUT and SWEET transporters in Dendrobium catenatum. BMC Genom. 2024, 25, 1213. [Google Scholar] [CrossRef]
  44. Xinru, B.; Yunke, Z.; Guangcun, L.; Lu, L. Regulation of storage organ formation by long-distance tuberigen signals in potato. Hortic. Res. 2025, 12, uhae360. [Google Scholar] [CrossRef]
  45. Abelenda, J.A.; Bergonzi, S.; Oortwijn, M.; Sonnewald, S.; Du, M.; Visser, R.G.F.; Sonnewald, U.; Bachem, C.W.B. Source-Sink Regulation Is Mediated by Interaction of an FT Homolog with a SWEET Protein in Potato. Curr. Biol. 2019, 29, 1178–1186. [Google Scholar] [CrossRef]
Figure 1. Effects of different potassium concentrations on plant height (a) and stem thickness (b) in potato plants. I represents SI (pre-tuber formation); II represents SII (middle tuber formation); III represents SIII (middle-late tuber formation); IV represents SIV (late tuber formation). ** represents significant difference at p < 0.01; * represents significant difference at p < 0.05.
Agronomy 15 01481 g001
Figure 2. Dynamics of sucrose (a), fructose (b), glucose (c), and starch content (d).
Agronomy 15 01481 g002
Figure 3. Effect of different potassium concentration treatments on the color of potato chips. (a) Detection of color difference of potato chips; (b) Characterization of color of potato chips. Different lowercase letters indicate significant differences at p < 0.05.
Agronomy 15 01481 g003
Figure 4. Correlation between starch and sugar contents and potato plant growth and tuber yield. NTP stands for number of potatoes set per plant; YP stands for yield per plant; WT stands for number of individual tubers.
Agronomy 15 01481 g004
Figure 5. Correlation analysis of starch–sugar metabolic rate among different tissues.
Agronomy 15 01481 g005
Table 1. Concentrations of macroelements in five culture media.
TreatmentNH4NO3 (g·L−1)KNO3 (g·L−1)
CK240.180.00
T1202.6047.50
T2146.20118.75
T3127.40285.00
T4179.64380.00
Table 2. Analysis of variance for contents of sucrose, fructose, glucose, and starch. W represents potassium treatment; S represents stage; p represents site; different letters indicate significant differences according to one-way ANOVA followed by CK for multiple comparisons (p < 0.05); ** represents significant difference at p < 0.01; different lowercase letters indicate significant differences at p < 0.05.
Sucrose (µg/g)Fructose (µg/g)Glucose (µg/g)Starch (%)
Treatments (W)
CK0.44 ± 0.01 b0.07 ± 0.00 b0.61 ± 0.00 b9.63 ± 0.57 d
T10.45 ± 0.01 b0.06 ± 0.00 c0.53 ± 0.00 c11.35 ± 0.32 c
T20.29 ± 0.00 c0.05 ± 0.00 e0.30 ± 0.00 e13.86 ± 0.19 a
T30.43 ± 0.01 b0.06 ± 0.00 d0.43 ± 0.00 d12.30 ± 0.32 b
T40.51 ± 0.00 a0.07 ± 0.00 a0.63 ± 0.00 a11.34 ± 0.36 c
Stages (S)
I0.66 ± 0.00 a0.03 ± 0.00 d0.80 ± 0.00 b11.15 ± 0.46 c
II0.35 ± 0.01 c0.14 ± 0.00 a0.20 ± 0.00 c7.41 ± 0.17 d
III0.27 ± 0.01 d0.04 ± 0.00 c0.83 ± 0.01 a12.58 ± 0.12 b
IV0.41 ± 0.00 b0.05 ± 0.00 b0.17 ± 0.00 d15.64 ± 0.14 a
Parts (p)
leaf0.15 ± 0.00 c0.03 ± 0.00 b0.49 ± 0.00 b8.30 ± 0.16 c
stem0.07 ± 0.00 d0.01 ± 0.00 c0.71 ± 0.00 a5.29 ± 0.11 d
root1.25 ± 0.02 a0.21 ± 0.00 a0.46 ± 0.00 c18.59 ± 0.27 a
tuber0.22 ± 0.00 b0.01 ± 0.00 c0.34 ± 0.00 d14.60 ± 0.17 b
W × S318.61 **75.12 **967.60 **8.88 **
W × P96.71 **6.05 **1421.76 **2.93 **
S × P1684.37 **3813.62 **15079.85 **341.03 **
W × S × P53.51 **4.77 **692.99 **2.37 **
Table 3. Trends of starch and sugar metabolism under different potassium treatments. P1, P2, and P3 denote the carbon conversion rates under different treatment conditions throughout the tuber formation stage, and ΔP1, ΔP2, and ΔP3 denote the amount of change in carbon conversion rate. ** denotes a highly significant difference (p < 0.01); * denotes a significant difference (p < 0.05); ns denotes a non-significant difference.
PSTP1P2P3ΔSΔP1ΔP2ΔP3
LeafSICK2.070.3841.24 ---
T13.64 **0.41 ns54.85 *---
T210.50 **0.60 **29.45 *---
T34.60 **0.35 ns57.03 *---
T41.61 *0.21 *97.05 **---
SIICK10.470.562.83S(II-I)8.400.19−38.41
T114.90 *0.70 *2.87 ns11.26 *0.29 **−51.98 *
T224.06 **0.58 ns3.11 *13.56 **−0.02 **−26.34 *
T315.11 *0.52 ns3.18 *10.51 *0.18 ns−53.85 *
T410.66 ns0.42 *4.84 **9.05 ns0.21 *−92.22 **
SIIICK16.360.0837.21S(III-II)5.89−0.4834.38
T123.53 *0.05 *44.21 *8.64 *−0.65 *41.34 *
T250.40 **0.03 **45.52 *26.35 **−0.54 *42.41 *
T321.44 *0.08 ns70.55 **6.33 *−0.45 ns67.37 **
T415.86 ns0.05 *53.80 **5.20 *−0.37 *48.97 *
SIVCK28.130.883.33S(IV-III)11.760.80−33.87
T140.89 *0.70 *4.29 *17.35 *0.65 *−39.92 *
T269.15 **0.71 *2.86 *18.75 **0.67 *−42.66 *
T358.93 **0.71 *2.99 *37.49 **0.64 *−67.56 **
T433.40 *0.63 *4.54 *17.54 *0.58 *−49.27 *
SteamSICK1.230.11398.22 ---
T11.57 *0.12 ns386.37 ns---
T24.04 **0.13 *327.50 *---
T32.27 **0.14 *324.65 *---
T41.69 *0.13 *353.73 *---
SIICK30.140.267.50S(II-I)28.900.15−390.71
T122.37 *0.20 *13.95 **20.80 *0.07 **−372.42 ns
T290.87 **0.08 **9.26 *86.83 **−0.05 **−318.24 *
T359.26 **0.22 *7.55 ns56.99 **0.08 *−317.10 *
T436.65 *0.30 *6.65 ns34.96 *0.16 ns−347.08 *
SIIICK2.380.04186.27S(III-II)−27.76−0.22178.77
T12.53 ns0.05 *199.18 ns−19.84 *−0.15 *185.23 ns
T25.45 **0.05 *333.13 **−85.42 **−0.03 **323.87 **
T33.62 *0.05 *177.01 ns−55.64 **−0.17 *169.46 ns
T42.71 *0.04 ns181.02 ns−33.95 *−0.25 *174.37 ns
SIVCK104.720.426.94S(IV-III)102.330.37−179.33
T185.55 *0.45 ns7.06 ns83.020.41 *−192.12 ns
T2185.11 **1.15 **4.15 *179.651.10 **−328.98 **
T3219.21 **0.09 **4.11 *215.590.04 **−172.90 ns
T449.64 **0.17 **16.43 **46.930.13 **−164.58 ns
RootSICK6.371.919.96 ---
T19.68 **4.45 **4.83 **---
T220.03 **3.34 **7.35 *---
T310.71 **4.12 **10.54 ns---
T47.82 *4.92 **3.88 **---
SIICK2.361.210.59S(II-I)−4.01−0.70−9.36
T12.99 *1.75 *0.47 ns−6.70 **−2.70 **−4.36 **
T25.14 **1.38 *0.36 *−14.88 **−1.96 **−6.99 *
T32.79 *1.86 *0.49 *−7.92 **−2.25 **−10.06 ns
T42.71 *1.50 *0.48 *−5.11 *−3.42 **−3.40 **
SIIICK6.100.509.44S(III-II)3.74−0.718.85
T17.48 *0.77 **9.70ns4.49 *−0.98 *9.23 ns
T215.40 **0.64 *7.29 **10.26 **−0.74 ns6.93 *
T310.22 **0.69 *8.54 ns7.43 **−1.17 **8.05 ns
T46.08 ns0.65 *7.59 **3.37 *−0.85 *7.12 *
SIVCK16.743.430.69S(IV-III)10.642.92−8.76
T118.63 *4.32 *0.64 ns11.16 ns3.55 *−9.06 ns
T228.15 **4.71 *0.77 **12.75 *4.07 *−6.52 *
T319.26 *5.25 **0.72 ns9.04 *4.55 **−7.82 *
T415.12 *5.10 **0.61 **9.04 *4.46 **−6.98 *
TuberSICK19.190.51111.60 ---
T127.15 *0.55 ns106.41 ns---
T269.28 **0.84 **99.00 *---
T345.64 **0.92 **61.49 *---
T428.22 *0.54 ns110.46 ns---
SIICK18.360.6195.09S(II-I)−0.830.09−16.52
T124.42 *0.52 *101.14 ns−2.73 **−0.03 **−5.27 **
T247.50 **0.62 ns83.68 *−21.79 **−0.22 **−15.33 ns
T342.45 **0.66 ns58.53 *−3.19 **−0.26 **−2.96 **
T428.66 **0.46 *81.19 *0.44 **−0.09 **−29.28 **
SIIICK16.180.7475.83S(III-II)−2.180.14−19.26
T121.05 *0.56 *80.41 ns−3.37 **0.04 **−20.73 ns
T241.20 **0.56 *77.70 ns−6.29 **−0.05 **−5.98 **
T329.76 **0.56 *65.89 *−12.69 **−0.09 **7.36 **
T425.27 **0.56 *69.19 ns−3.39 **0.10 *−12.00 *
SIVCK16.130.7459.38S(IV-III)−0.050.00−16.45
T120.54 *0.65 *55.67 ns−0.51 **0.09 **−24.74 **
T236.82 **0.90 *47.89 *−4.38 **0.34 **−29.81 **
T324.48 **0.68 ns72.74 *−5.27 **0.12 **6.85 **
T422.42 *0.71 ns67.97 *−2.86 **0.15 **−1.22 **
Table 4. Rates of starch and sugar metabolism under different potassium concentrations. ** denotes a highly significant difference (p < 0.01); * denotes a significant difference (p < 0.05); ns denotes a non-significant difference.
STPSucroseFructoseGlucoseStarchPSucroseFructoseGlucoseStarch
S(II-I)CKLeaf−50 × 10−34.89 × 10−3−0.160.05Root−140 × 10−360 × 10−3−0.09−2.13
T1−30 × 10−3 *4.88 × 10−3 ns−0.11 *0.04 *−130 × 10−3 ns50 × 10−3 *−0.03 **−2.74 **
T2−10 × 10−3 **3.86 × 10⁻³ ns−0.03 **0.08 **−60 × 10−3 **50 × 10−3 *−0.02 **−3.38 **
T3−20 × 10−3 **10 × 10−3 **−0.08 **0.12 **−100 × 10−3 *60 × 10−3 ns−0.03 **−3.06 **
T4−50 × 10−3 ns4.71 × 10−3 ns−0.27 **0.09 **−210 × 10−3 **60 × 10−3 ns−0.03 **−2.82 **
S(III-II)CK−10 × 10−3−10 × 10−30.071.12−40 × 10−3−50 × 10−30.131.18
T1−20 × 10−3 **−10 × 10−3 ns0.07 ns1.48 *−30 × 10−3 *−50 × 10−3 ns0.12 ns1.48 *
T2−10 × 10−3 ns−4.16 × 10⁻³ **0.00 **2.04 **−40 × 10−3 ns−50 × 10−3 ns0.08 *1.89 *
T3−10 × 10−3 ns−10 × 10−3 ns0.07 ns1.36 *−90 × 10−3 **−50 × 10−3 ns0.09 *1.66 *
T4−10 × 10−3 ns−10 × 10−3 ns0.08 *1.24 *−40 × 10−3 ns−50 × 10−3 ns0.13 ns1.12 *
S(IV-III)CK10 × 10−3 ns2.19 × 10−3−0.08−0.6250 × 10−310 × 10−3−0.161.44
T110 × 10−3 ns1.26 × 10−3 *−0.07 *−1.01 **30 × 10−3 *10 × 10−3 ns−0.14 *1.47 ns
T210 × 10−3 ns1.82 × 10−3 *0.00**−1.51 **60 × 10−3 *2.50 × 10−3**−0.09 **1.76 *
T31.74 × 10−3 **1.82 × 10⁻³ *−0.08 ns−0.87 *90 × 10−3 **10 × 10−3 ns−0.11 **1.97 *
T410 × 10−3 ns1.93 × 10−3 *−0.10 *−0.72 *100 × 10−3 **4.91 × 10⁻³**−0.15 ns2.10 *
S(II-I)CKStem−20 × 10−30.99 × 10−3−0.220.19Tuber10 × 10−318.1 × 10−30.010.31
T1−20 × 10−3 ns1.23 × 10−3 **−0.22 ns0.32 **10 × 10−3 ns16.8 × 10−3 *0.02 **0.38 *
T2−10 × 10−3 **52.9 × 10⁻³ *−0.11 **0.36 **4.74 × 10⁻³ **18.5 × 10⁻³ ns0.01 ns0.24 *
T3−20 × 10−3 ns77.9 × 10−3 *−0.16 *0.36 **1.11 × 10⁻³ **18.1 × 10⁻³ ns0.01 ns0.34 *
T4−30 × 10−3 **1.29 × 10⁻³ **−0.22 ns0.26 *0.79 × 10−3 **23.7 × 10⁻³ ns0.01 ns0.31 ns
S(III-II)CK4.80 × 10−3−51.2 × 10−30.18−0.0220 × 10−328.0 × 10−30.010.19
T14.60 × 10−3 ns−76.6 × 10⁻³ **0.19 ns−0.16 **10 × 10−3 **2.45 × 10−3 *0.01 ns0.08 **
T210 × 10−3 **−44.8 × 10−3 *0.13 *−0.06 **3.48 × 10⁻³ **13.8 × 10⁻³ **0.01 ns0.21 *
T310 × 10−3 **−32.3 × 10−3 *0.17 ns−0.14 **10 × 10−3 **20.2 × 10−3 *0.02**0.09 *
T44.77 × 10−3 ns−76.2 × 10−3 *0.20 *−0.10 **10 × 10−3 **18.1 × 10−3 *0.01 ns0.11 *
S(IV-III)CK−10 × 10−3−13.3 × 10⁻³−0.190.5910 × 10−340.9 × 10−30.010.26
T1−10 × 10−3 ns904 × 10−3 **−0.21 *0.61 ns10 × 10−3 ns48.2 × 10−3 *0.01 ns0.35 *
T2−3.25 × 10⁻³ **23.7 × 10⁻³ **−0.14 *0.54 ns10 × 10−3 ns34.4 × 10−3 *0.00 **0.39 **
T3−10 × 10−3 ns775 × 10−3 **−0.17 *0.63 ns20 × 10−3 **13.3 × 10⁻³ **0.01 ns0.35 *
T4−10 × 10−3 ns430 × 10−3 **−0.19 ns0.63 ns20 × 10−3 **18.1 × 10⁻³ **0.01 ns0.38 *
Table 5. Potato yield components under different potassium treatments. Different lowercase letters indicate significant differences at p < 0.05.
TNumber of Tubers Per Plant/nWeight of Individual Tuber/gYield Per Plant/g
CK2.75 ± 0.17 e0.31 ± 0.06 c0.89 ± 0.09 d
T14.47 ± 0.17 d2.34 ± 0.08 b7.46 ± 0.19 c
T27.77 ± 0.23 a2.87 ± 0.11 a12.17 ± 0.19 a
T36.06 ± 0.18 b2.13 ± 0.12 b9.19 ± 0.19 b
T44.98 ± 0.12 c2.12 ± 0.24 b7.64 ± 0.23 c
Disclaimer/Publisher’s Note: The statements, opinions and data contained in all publications are solely those of the individual author(s) and contributor(s) and not of MDPI and/or the editor(s). MDPI and/or the editor(s) disclaim responsibility for any injury to people or property resulting from any ideas, methods, instructions or products referred to in the content.

