Article

Development of a Predictive Model Linking Electrical Characteristics to Semi-Lethal Temperature in Potted Apple Trees with Validation on Mature Specimens

1
College of Horticulture, Hebei Agriculture University, Lekai South Street 2596, Baoding 071000, China
2
Changli Institute of Pomology, Hebei Academy of Agricultural and Forestry Science, Qinhuangdao 066600, China
3
School of Forest Science, Faculty of Science and Forestry, University of Eastern Finland, 80101 Joensuu, Finland
*
Authors to whom correspondence should be addressed.
Agronomy 2025, 15(6), 1458; https://doi.org/10.3390/agronomy15061458
Submission received: 13 May 2025 / Revised: 6 June 2025 / Accepted: 12 June 2025 / Published: 16 June 2025
(This article belongs to the Section Horticultural and Floricultural Crops)

Abstract

:
In the context of increasingly frequent extreme low-temperature events, developing a rapid and non-destructive method to evaluate plant cold tolerance is of great scientific significance for accurately assessing the cold hardiness of fruit trees. In this study, the correlations between 23 electrophysiological features—including electrical signal and impedance parameters—and the cold tolerance indicator semi-lethal temperature (LT50) were analyzed. Principal component analysis (PCA) was used to identify the optimal electrical parameters reflecting cold resistance in apples. A multiple linear regression model was then constructed based on these parameters, and its accuracy was validated using 13-year-old field-grown apple trees. The results showed the following: (1) Six electrical parameters (r1, re, r, Min, Std, and Peak) were significantly correlated with LT50 (p < 0.05) and made major contributions to the first principal component (PC1), confirming their status as optimal indicators of cold tolerance. (2) A regression model for predicting LT50 was established using these parameters, achieving a coefficient of determination (R2) of 0.9187, indicating excellent model fit. (3) Model validation yielded R2 values of 0.9323 and 0.9999, MAE values of 1.243 and 0.900, MAPE values of 6.64% and 4.02%, and RMSE values of 1.29 and 1.12, respectively. The predicted LT50 values closely matched measured values in an overall trend, confirming the high accuracy of the model. These findings demonstrate that electrophysiological parameters can effectively reflect the dynamic changes in cold tolerance of apple trees during overwintering and provide a theoretical and methodological foundation for rapid and convenient cold hardiness assessment in other deciduous fruit species.

1. Introduction

Temperature is one of the most critical abiotic factors influencing plant geographic distribution, growth, and adaptability [1]. In recent years, increasing instability in the global climate system has led to more frequent extreme low-temperature events [2], particularly cold stress and freezing damage, which pose serious threats to agricultural production [3,4,5]. These threats arise from the multifaceted disruption of plant physiological structures and functions caused by low temperatures. Studies have shown that low temperature is a major environmental stressor that triggers a range of physiological and metabolic changes in plants [6]. Severe cold can damage cell membrane structures, impair normal growth and development, and, in extreme cases, lead to plant death [7,8]. For instance, cold temperatures can induce phase transitions in membrane lipids, causing membrane protein denaturation and reduced membrane fluidity, thereby disturbing plant metabolism and physiological functions [9]. During plant growth, low temperatures increase membrane permeability, resulting in electrolyte leakage and disrupting the ionic balance between the intracellular and extracellular environment. This ultimately affects germination rates and seedling growth of plants [10,11]. However, plants exhibit a range of physiological and biochemical responses to low-temperature stress, which have evolved over time as adaptive mechanisms [6]. Plants can maintain basic growth and metabolic processes under cold conditions by modifying external structures and adjusting internal physiological and biochemical responses, a capability referred to as cold tolerance [12]. The assessment of plant cold tolerance involves the systematic evaluation and analysis of a plant’s ability to withstand low-temperature conditions using specific indicators and methods [13].
Apple (Malus × domestica) is one of the most important fruit crops worldwide, with an annual production of approximately 93.1 million tons, ranking third among all fruit crops globally [14]. However, the plants exhibit a range of physiological and biochemical responses to low-temperature stress, which have evolved over time as adaptive mechanisms [15]. Severe low temperatures can cause branch injury, floral bud damage, and fruit drop, leading to significant reductions in both yield and quality, thereby hindering the sustainable development of the apple industry [16]. During the early developmental stages, especially the flowering phase, low temperatures can delay development or induce fruit abscission [17]. At the organ level, extreme cold can damage leaves, flowers, and fruits [18], and at the cellular level, extreme cold disrupts membrane integrity and triggers the accumulation of reactive oxygen species (ROS), resulting in oxidative damage and metabolic disturbances [19,20]. Therefore, improving the cold tolerance of apple trees is essential for securing production and maintaining stable yields and fruit quality under low-temperature conditions. In this context, developing scientific and accurate approaches to evaluate cold tolerance in apple trees has become a key focus of current research and practical orchard management.
At present, the electrical conductivity (EC) method is commonly used to comprehensively assess plant cold tolerance [21]. This method is widely regarded as a classical and reliable approach due to the relatively high credibility of its results [22]. In particular, when combined with logistic regression to fit the relationship between conductivity and temperature, it enables accurate estimation of the semi-lethal temperature (LT50) of plant tissues [23]. However, in practical applications, the EC method also presents certain limitations. The measurement process is influenced by multiple factors, such as sample treatment, temperature control precision, sample size, and physiological status, all of which can affect the rate of electrolyte leakage [24]. Moreover, the method typically requires water-bath heating and repeated shaking to fully release ions from the tissue, making the experimental procedure complex and time-consuming [25]. Studies have also shown that the EC method involves destructive sampling, which damages tissue structures and introduces additional confounding variables that may compromise measurement accuracy [26]. Therefore, there is an urgent need for a rapid, non-destructive, and reliable approach to evaluate plant cold tolerance.
In recent years, with the advancement of plant electrophysiology research, electrical properties within plant tissues have increasingly been recognized as important indicators of physiological status and stress responses [27,28]. When subjected to electrical stimulation, the distribution of current between extracellular spaces and intracellular compartments depends on the structural and physiological characteristics of plant tissues and organs [29]. The cytoplasm and vacuole exhibit resistive properties, while the cell membrane exhibits distinct capacitive behavior [30]. At low frequencies, due to the high capacitive reactance of the cell membrane, electrical current primarily flows through the extracellular space, making the total tissue impedance largely determined by extracellular resistance. As the frequency increases, the capacitive reactance of the membrane decreases, allowing part of the current to pass through the membrane into the intracellular space, such that the total impedance is jointly influenced by both extracellular and intracellular components [31]. When plant cells experience stress, the structure and function of the cell membrane are altered, subsequently affecting their electrical characteristics [32,33,34].
Studies have demonstrated that electrical properties are widely used to evaluate plant organ or tissue responses to water stress, cold damage, osmotic stress, and nutrient deficiency, and have made significant contributions to research on plant stress tolerance [35,36]. In terms of EIS, for example, Song et al. [37] employed Electrical Impedance Spectroscopy (EIS) to study freezing injury temperatures of trees under different cooling rates, demonstrating that EIS effectively detects impedance changes in plant tissues under cold stress. Serrano-Pallicer et al. [38] used EIS for early detection of tissue changes in Navelate orange during freezing processes. Zhang et al. [39] found that direct measurement of tissue impedance spectra can be used to evaluate plant cold tolerance. Romero Fogué et al. [40] applied EIS and equivalent circuit modeling to monitor tissue changes in grapefruit during freezing. In terms of electrical signals, Mudrilov et al. [41] summarized the mechanisms of electrical signal transduction in plants under abiotic stress (e.g., low temperature), revealing that cold stress induces specific electrical responses that are transmitted through calcium ion concentration shifts and membrane potential changes. Oyarce and Patricio [42] inserted Ag/AgCl microelectrodes into the stems of avocado trees (Persea americana) and continuously monitored potential differences, discovering a strong correlation between potential variation and temperature changes.
Although electrical impedance and related parameters have been used to assess freezing injury in plant tissues [37], systematic studies focusing on apple trees remain limited, and the specific electrical parameters that most accurately reflect cold tolerance in apples have not yet been identified. Therefore, investigating the electrical characteristics of apple tissues, identifying key indicators that best represent cold tolerance, and establishing a correlation model between electrical parameters and the cold tolerance indicator—semi-lethal temperature (LT50)—are of great significance for developing a rapid, non-destructive method to evaluate cold tolerance in apple trees.
In this study, we aimed to develop a rapid and non-destructive model for evaluating cold tolerance in apple trees using electrical indicators. One-year-old potted ‘Tianhong No. 2’ Fuji apple trees grafted on M9 and SH40 self-rooted rootstocks were used to investigate the relationship between electrical parameters and cold tolerance, measured by semi-lethal temperature (LT50). The optimal electrical parameters, identified through correlation analysis and principal component analysis (PCA), were incorporated into a multiple linear regression model to predict LT50. The model was validated for 13-year-old field-grown trees grafted on M9 and SH40 interstock rootstocks. This research could provide a theoretical and methodological basis for the rapid and convenient assessment of cold tolerance in apple trees, with potential applicability to other deciduous fruit crops.

2. Materials and Methods

2.1. Experimental Design

2.1.1. Pot Experiment

The experiment process is presented in (Figure 1). For the pot experiment, one-year-old self-rooted M9 and SH40 rootstocks were collected from Shunping County, Baoding City, Hebei Province, China (38°51′00.9″ N, 115°28′46.3″ E) and transplanted into plastic pots on 9 April 2023. We obtained permission from Shenlu Apple Company (Baoding, Hebei, China), and the plant samples collected were formally identified by Mr. Liang Bin. The pots had an upper diameter of 23.5 cm, a lower diameter of 20.5 cm, and a height of 14 cm, with drainage holes at the bottom. The pots were filled with a cultivation substrate composed of peat, perlite, and vermiculite at a ratio of 2:1:1, with a pH of 5.5–6.5. On 19 April 2023, ‘Tianhong No. 2’ Fuji scions were grafted onto the rootstocks. The experiment was conducted in an open-type greenhouse (40 m × 6 m × 2.5 m, L × W × H) located in the botanical garden of Hebei Agricultural University (38°50′00.0″ N, 115°26′00.0″ E). The greenhouse was equipped with a movable roof to regulate temperature, humidity, and light conditions, thereby reducing transpiration and environmental interference, promoting graft union healing, root regeneration, bud sprouting, and ultimately enhancing survival rate and plant establishment. During the experimental phase, the roof remained open to allow the plants to overwinter naturally. Soil moisture was monitored from 9 April 2023, until the end of the experiment using a soil moisture meter (TDR100, Spectrum Technologies, Inc., Plainfield, IL, USA). Soil water content was maintained at approximately 70% of field capacity.
A randomized block design was used in this experiment. For each variety, eight replicate blocks were established, each measuring 1.5 m × 2.0 m. Within each block, 24 potted apple seedlings were randomly arranged, resulting in a total of 384 seedlings (2 varieties × 8 blocks × 24 pots = 384 pots). To minimize systematic errors, the arrangement of seedlings within each plot was fully randomized. Sampling was conducted on seven dates: 20 September, 20 October, 20 November, and 20 December of 2023, and 20 January, 20 February, and 20 March of 2024. During the sampling period, the average monthly maximum temperatures were 27.4 °C, 22.5 °C, 10.2 °C, 1.4 °C, 4.4 °C, 7.0 °C, and 17.3 °C, respectively, while the average minimum temperatures were 16.9 °C, 7.8 °C, –1.8 °C, –10.6 °C, –8.8 °C, –3.5 °C, and 3.0 °C. All measurements were carried out between 8:30 and 11:00 a.m. on the respective sampling days and included both electrical property measurements and relative electrolyte leakage assessments.
For electrical property measurements, three pots were randomly selected from each of the eight blocks for both varieties, resulting in 24 plants per variety and a total of 48 plants. These same 48 plants were used throughout all seven sampling periods for repeated measurements of electrical parameters. For relative electrolyte leakage assessment, an additional set of 3 plants per block (not used for electrical measurements) was randomly selected for each variety, resulting in 48 additional plants in total (2 varieties × 8 blocks × 3 replicates = 48 pots). From each selected seedling, a straight, unbranched stem segment approximately 10 cm in length was excised from the middle of the main stem, immediately stored in an icebox, and transported to the laboratory. There, stem samples were rinsed thoroughly with deionized water. For each variety, the 24 stem segments were evenly distributed into six resealable plastic bags, with 4 segments per bag. These were then subjected to six different low-temperature treatments to determine relative electrolyte leakage.

2.1.2. Validation Experiment

The validation experiment (Figure 1) was conducted using 13-year-old ‘Fuji’ apple trees grafted on M9 self-rooted and SH40 interstock rootstocks, cultivated at the First Post Station in Shunping County, Baoding City, Hebei Province (38°45′00.0″ N, 114°58′48.0″ E). Sampling was performed on seven dates: 20 September, 20 October, 20 November, and 20 December of 2024, and 20 January, 20 February, and 20 March of 2025. The corresponding monthly average maximum temperatures were 26.2 °C, 20.3 °C, 13.8 °C, 6.1 °C, 5.5 °C, 7.2 °C, and 16.4 °C, respectively, while the average minimum temperatures were 16.5 °C, 8.3 °C, 2.7 °C, –6.6 °C, –6.9 °C, –5.1 °C, and 3.2 °C. All sampling and measurements were conducted between 8:30 and 11:00 a.m. on each sampling day, including both electrical property measurements and relative electrolyte leakage assessments.
For electrical measurements, eight trees were randomly selected from each variety. From each selected tree, three healthy, uniformly sized, pest- and disease-free current-year shoots were chosen for data collection. Across the two varieties, a total of 48 shoots were measured in each of the seven sampling events (2 varieties × 8 trees × 3 replicates = 48 shoots).
For relative conductivity determination, an additional 8 trees per variety (16 trees in total), different from those used for electrical measurements, were selected. These same trees were used throughout all seven sampling events. During each event, 3 healthy, uniformly sized, pest- and disease-free current-year shoots were collected from each tree, resulting in 48 shoots per sampling date. From each shoot, a 10 cm segment with uniform thickness and no lateral branches was excised from the middle portion, placed in an icebox for cold preservation, and transported to the laboratory. There, all stem segments were thoroughly rinsed with deionized water. For each variety, the 24 stem segments were evenly distributed into six resealable plastic bags, each containing 4 segments, for relative conductivity analysis.

2.2. Measurement Parameters

2.2.1. Low-Temperature Freezing Treatment

Low-temperature freezing treatment was conducted following the method described by Wilner [43]. Apple stem segments were first rinsed with ultrapure water and gently dried. The cleaned samples were then placed into resealable plastic bags labeled with the cultivar name and treatment temperature. A small amount of ultrapure water was sprayed inside each bag to prevent excessive supercooling of the samples. Freezing was carried out using a programmable ultra-low temperature freezer with a controlled cooling rate of 6 °C per hour. Six temperature gradients were set (as shown in Table 1), covering the full survival and full mortality temperature range for the samples. Once the target temperature was reached, samples were held at that temperature for 12 h. After freezing, the samples were thawed in a stepwise manner: first at 0 °C for 8 h, followed by 24 h at 4 °C. Upon completion of the thawing process, relative electrolyte leakage of the apple stem segments was measured to assess the extent of cold injury.

2.2.2. Measurement of Relative Electrolyte Leakage and Calculation of Semi-Lethal Temperature (LT50)

Relative electrolyte leakage (REL) and the semi-lethal temperature (LT50) were determined following the methods described by Wilner [43] and Zhang [44]. After low-temperature treatment, apple shoots were cut into 15 mm-long segments and split in a crosswise manner along the transverse axis. Each sample (consisting of four quarter-segments) was placed into a test tube containing 10 mL of ultrapure water. For each temperature treatment, eight independent replicates were prepared. The tubes were shaken on a shaker for 24 h, after which the initial conductivity (R1) and blank conductivity (R0) were measured using a DDS-307A conductivity meter (Shanghai Yidian Scientific Instrument Co., Ltd., Shanghai, China).
Subsequently, the tubes were placed in a boiling water bath for 30 min to fully release intracellular electrolytes and then shaken again for 24 h. The final conductivity (R2) was then recorded. The relative electrolyte leakage (E, %) was calculated using Equation (1):
E % = R 1 R 0 R 2 R 0 × 100
LT50 was calculated based on a logistic equation using Python (Anaconda3 distribution, accessed via the Anaconda Navigator interface). Curve fitting was performed using the curve_fit function from the scipy module. The inflection point of the fitted curve was considered the LT50, and the standard error was derived from parameter C in Equation (2):
y = A 1 + e B C X + D
where: y is the relative electrolyte leakage (%); X is the temperature of the freezing treatment (°C); A is the difference between the maximum and minimum E; B is the slope at the inflection point (%·°C−1); C is the inflection point temperature (i.e., LT50, in °C); and D is the minimum E value.

2.2.3. Acquisition of Electrical Properties

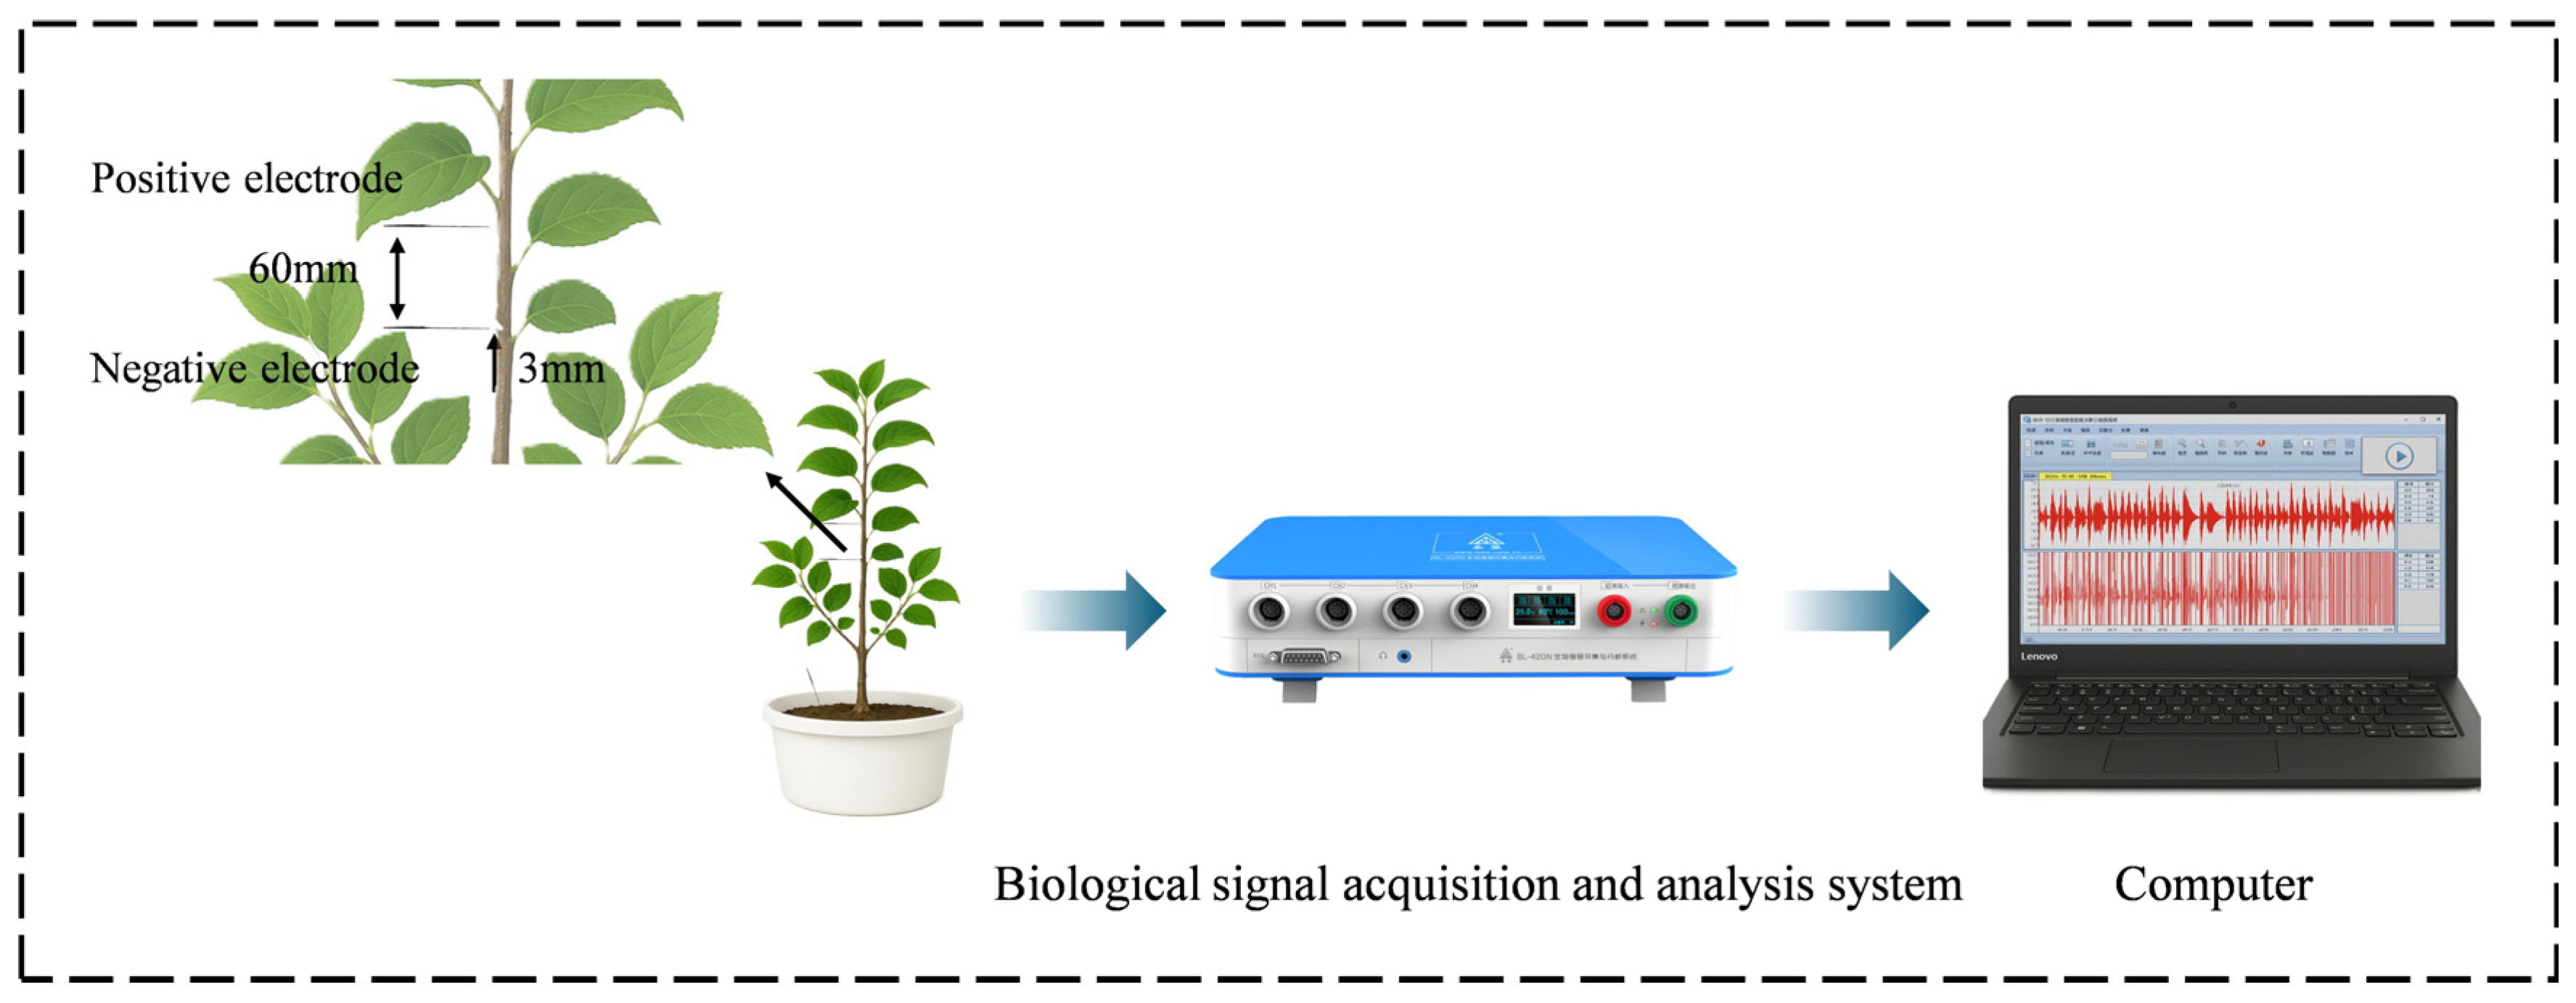
Electrical signals from apple seedlings were collected using the BL-420N biological signal acquisition and analysis system (Taimeng Technology Co., Ltd., Chengdu, China). As shown in Figure 2, Ag/AgCl electrodes (RC1, WPI, Ltd., Sarasota, FL, USA) were inserted into a uniform, unbranched stem segment at the middle part of the main trunk of each seedling. The electrodes were inserted 60 mm apart, penetrating from the phloem into the xylem to ensure contact with the sap. The ground electrode was inserted into the potting soil of each apple seedling. To minimize the influence of electrode insertion and reduce polarization artifacts, signal acquisition was initiated 30 min after electrode insertion. All measurements were conducted under non-stimulated (resting) conditions. Based on preliminary tests of signal fluctuation amplitudes, the acquisition parameters were set as follows: voltage range of 500 μV, sampling rate of 100 Hz, with a 50 Hz notch filter enabled to eliminate power-frequency interference. Since plant bioelectrical signals are typically below 20 Hz, the cutoff frequency of the low-pass filter was set to 20 Hz to reduce high-frequency noise and improve signal clarity.
Impedance measurements were performed using an impedance analyzer (Agilent E4980A, USA) to obtain the complex impedance spectra of each apple seedling at 42 frequencies ranging from 80 Hz to 1 MHz. Complex impedance is derived from the relationship between voltage and current and is associated with both amplitude and phase. It consists of two components: the real part (resistance, Re) and the imaginary part (reactance, Im). During measurement, the input voltage was set to 200 mV. Following the collection of bioelectrical signals, as shown in Figure 2, the Ag/AgCl electrodes (RC1, WPI, Ltd., Sarasota, FL, USA) were kept in their original positions. Without disturbing the electrode placement, the instrument was switched to the impedance analyzer to perform in situ impedance measurements at the same location.

2.3. Statistic Analysis

2.3.1. Processing of Electrical Property Data

In this study, electrical signal data were processed using Python 3.13 (Python Software Foundation, USA); signal filtering, time-domain, and frequency-domain analyses, as well as the extraction of relevant features, were performed using functions from the numpy, scipy.signal, and pandas libraries [45,46,47]. The time-domain parameters included the following: maximum (Max), minimum (Min), mean (Mean), peak (Peak), variance (Var), standard deviation (Std), kurtosis (Kurt), skewness (Skew), root mean square (Rms), waveform factor (WF), impulse factor (IF), and crest factor (CF). Frequency-domain parameters included: peak frequency (PeakF), center frequency (FC), mean square frequency (MSF), frequency variance (VF), and power spectral entropy (PsdE). Definitions and formulas for all electrical signal features are provided in the Supplementary Materials [48]. Data visualization was performed using Origin 2024 software (OriginLab, USA).
Impedance data were analyzed using LEVM version 8.06 software based on the DCE (Direct Current Equivalent) equivalent circuit model. A complex nonlinear least squares fitting method was employed to estimate key impedance parameters, including high-frequency resistance (r), low-frequency resistance (r1), intracellular resistance (ri), extracellular resistance (re), relaxation time (τ), and the relaxation time distribution coefficient (ψ). The equivalent circuit model consisted of one series resistor (R) and two distributed circuit elements, with the complex impedance model expressed in Equation (3) [49,50]:
Z = R + R 1 1 + i τ 1 ω φ 1 + R 2 1 + i τ 2 ω φ 2
Among them, R1 and R2 correspond to the re and ri, respectively, which are obtained by fitting the high-frequency and low-frequency parts; τ1 and τ2 are relaxation time constants, and φ1 and φ2 represent inhomogeneity. The above impedance parameters are normalized using the measured leaf width and thickness to obtain r, r1, re, and ri [51].

2.3.2. Construction and Evaluation of the Regression Model

SPSS 26.0 (IBM, USA) was used to perform correlation analysis and principal component analysis (PCA) to identify variables significantly associated with LT50. In the correlation analysis, the Pearson correlation coefficient (r) was used to measure the degree of linear correlation between variables. The correlation coefficient r ranges from −1 to +1, and the larger the absolute value, the stronger the correlation. The significance level p indicates whether the observed correlation is statistically valid, and the threshold value p < 0.05 is set to indicate a significant correlation.
In the principal component analysis, the eigenvalue decomposition method based on the Pearson correlation matrix was used to reduce the dimensionality of the original variables and extract the principal components that contributed most to cold tolerance. Before the analysis, the correlation between variables was evaluated by the Kaiser–Meyer–Olkin (KMO) test and the Bartlett sphericity test to determine whether the data were suitable for PCA analysis.
In the significance analysis, one-way ANOVA was used, and the Duncan multiple comparison method was used to test the significance of the differences between the indicators at different sampling times to evaluate the trend of the variables. At the same time, the normality and homogeneity of variance of the residuals were tested to ensure the reliability of the analysis results.
Based on the screened variables, a multiple linear regression model was constructed with LT50 as the dependent variable using Python 3.11.11. Stepwise regression was performed using the statsmodels and mlxtend libraries in Python to select the optimal predictors. Figures were generated using Origin 2024 (OriginLab, USA).
The comprehensive cold tolerance index for each variable was calculated using Equation (4):
D a = a = 1 n ( F a b × Y a b )
The weight of each indicator was calculated using Equation (5):
W a = D a / a = 1 n D a
where a denotes the a-th variable, b the b-th principal component, Fab the component loading of variable a on principal component b, Yab the contribution rate of component b, Da the contribution of variable a to cold tolerance, and Wa the weight of the variable.
After identifying the optimal electrophysiological parameters for cold tolerance evaluation, data augmentation was conducted using mean interpolation to increase the sample size for ‘Tianhong No. 2’ Fuji grafted on M9 and SH40 self-rooted rootstocks. Two varieties, Xi and Xj, were randomly selected and combined via weighted averaging to generate new samples, Xnew, using Equation (6):
X n e w = α X i + 1 α X j , α = 0.5
where Xi and Xj are the selected optimal electrical feature parameters from two varieties.
After data augmentation, PCA was applied to eliminate multicollinearity among independent variables and ensure their independence. All variables were normalized and standardized to remove differences in units and ensure comparability and balanced influence in regression modeling. Normalization was performed using Equation (7):
X n o r m = X X m i n X m a x X m i n
where X is the original value, Xmin and Xmax are the minimum and maximum values of the variable, and Xnorm is the normalized value in the [0, 1] range.
Standardization was applied using Equation (8):
X s t d = X μ σ
where X is the original value, μ is the mean, and σ is the standard deviation. Xstd is the standardized value, with a mean of 0 and a standard deviation of 1.
Multiple linear regression based on Partial Least Squares (PLSs) was used to model the relationship between LT50 and selected electrical features. This method is effective, rapid, and convenient for analyzing multi-factor problems. The general form of the regression model is shown in Equation (9):
y = β 0 + β 1 x 1 + β 2 x 2 + + β p x P + ε
where y represents LT50, x 1 , x 2 , … x P are the selected electrical characteristics, β 0 , β 1 , β 2 , β p are model parameters, and ε~N(0, σ2) the error term.
Model fitting results were analyzed in Microsoft Excel 2024, and model performance was evaluated using mean absolute error (MAE), mean absolute percentage error (MAPE), and root mean square error (RMSE), from Equations (10)–(12):
M A E = 1 N i = 1 n X ^ i X i
M A P E = 1 N i = 1 n X ^ i X i X i
R M S E = 1 N i = 1 n X i X ^ i 2
where X i is the observed value, X i is the predicted value, and n is the number of observations.

3. Results

3.1. Variation in Semi-Lethal Temperature (LT50) of Potted Apple Rootstock

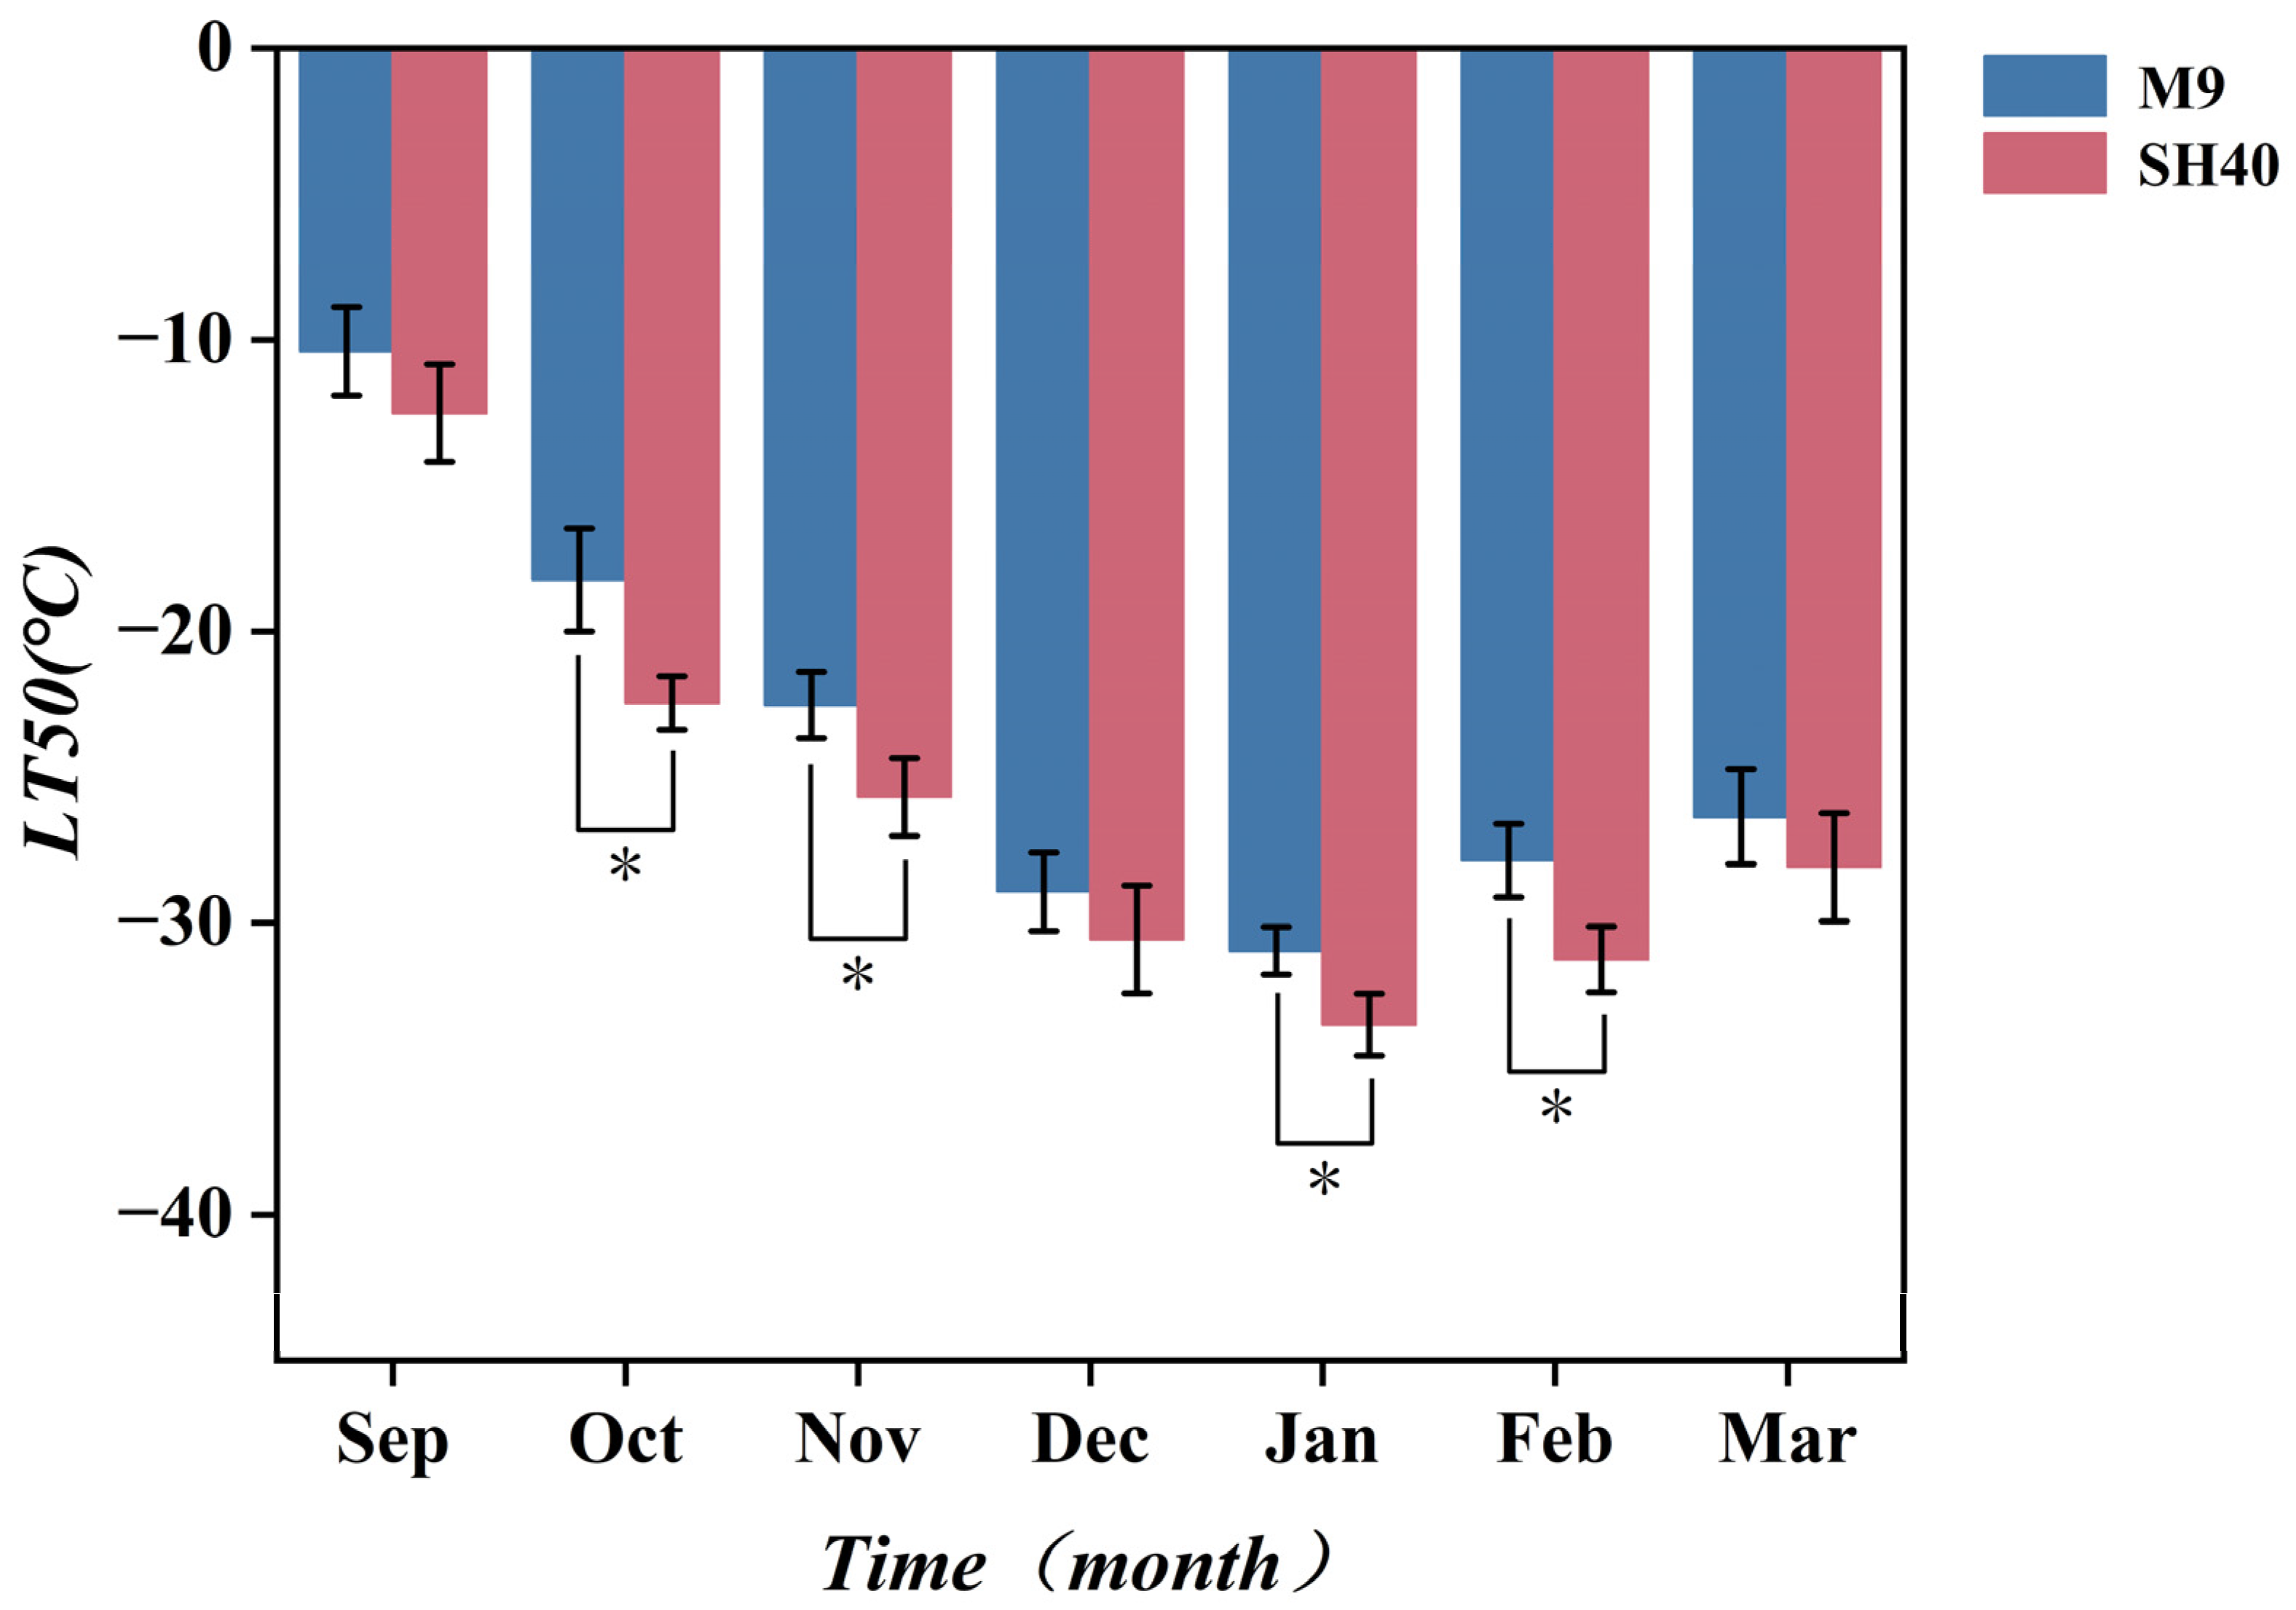
As shown in Figure 3, the LT50 values of potted ‘Tianhong No. 2’ Fuji grafted on M9 and SH40 self-rooted rootstocks decreased initially and then increased during natural overwintering, reaching their lowest points in January 2024 at –30.96 °C (M9) and –33.49 °C (SH40). From September to December 2023, LT50 values declined month by month, with each month showing a significant decrease compared to the previous one (p < 0.05). After reaching the minimum in January, values began to rise gradually. Throughout the overwintering period, LT50 values of ‘Tianhong No. 2’ Fuji grafted on M9 were consistently higher than those on SH40, with significant differences observed in October, November, January, and February (p < 0.05). These results suggest that the SH40 rootstock confers stronger cold tolerance than M9.

3.2. Correlation Analysis Between LT50 and Electrophysiological Features

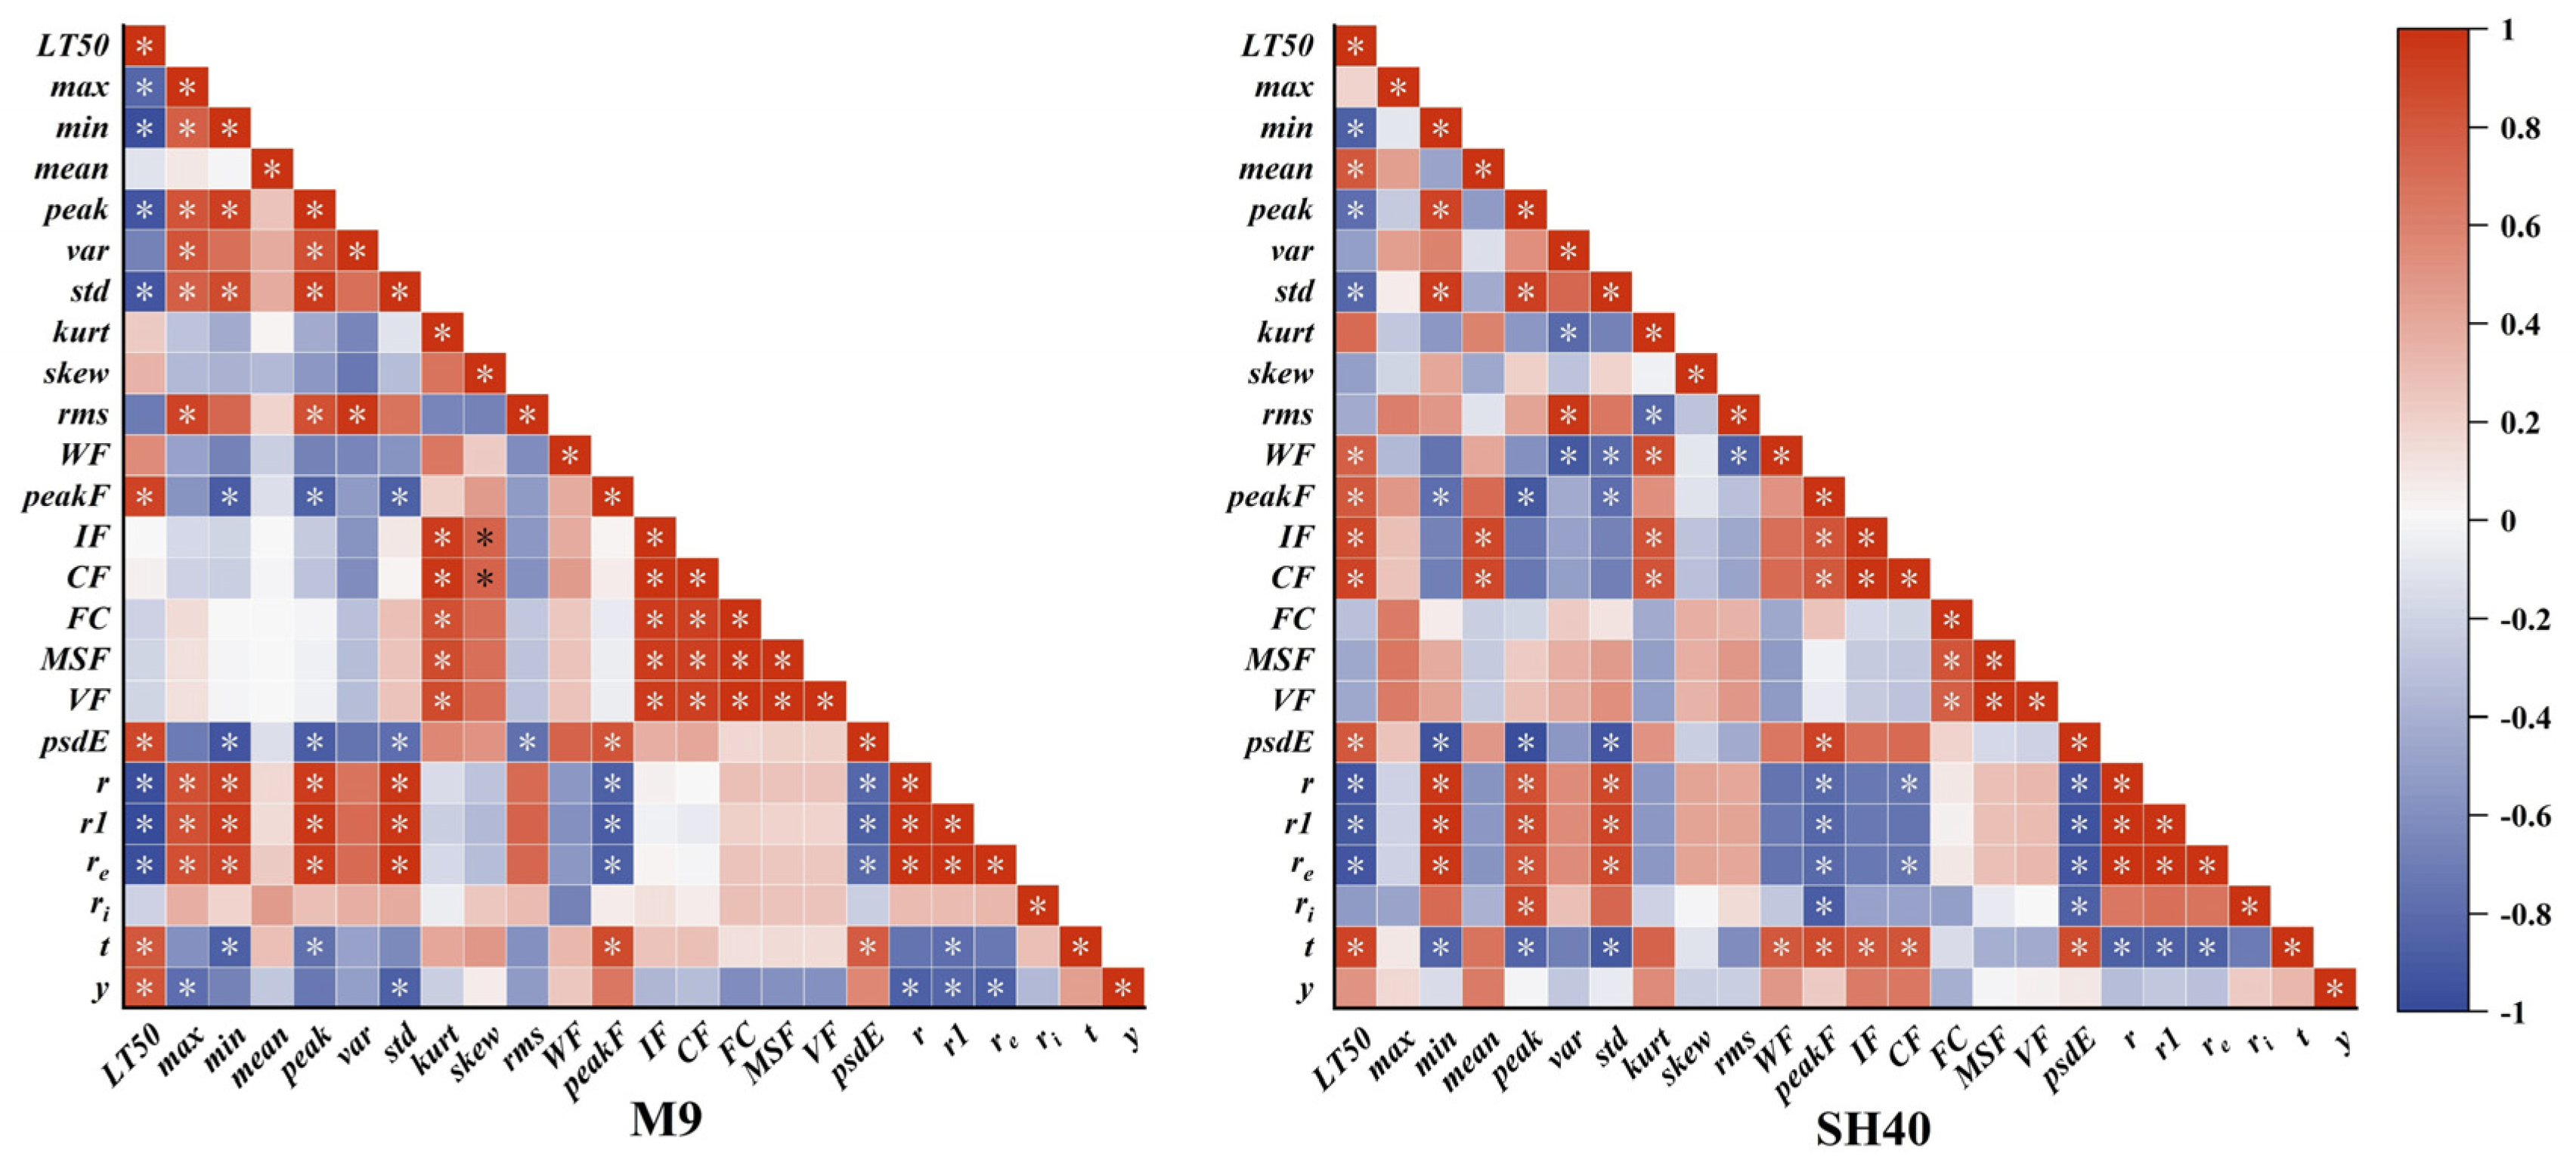
Figure 4 presents the Pearson correlation coefficients between LT50 and electrical parameters (r, re, ri, r1, t, y, Max, Min, Mean, Peak, Var, Std, Kurt, Skew, Rms, WF, IF, CF, peakF, FC, MSF, VF, PsdE) during cold acclimation. For M9-grafted plants, LT50 showed significant negative correlations with Max, Min, Peak, Std (p < 0.05), and significant positive correlations with peakF and PsdE. LT50 also exhibited significant negative correlations with r, r1, re and positive correlations with t, y.
For SH40-grafted plants, LT50 was significantly negatively correlated with Min, Peak, and Std, and positively correlated with Mean, WF, IF, and CF. Frequency-domain parameters peakF and PsdE again showed significant positive correlations with LT50, while impedance parameters r, r1, re were negatively correlated and τ positively correlated (p < 0.05). Based on these correlations, nine parameters—Min, Peak, Std, peakF, PsdE, r, r1, re, and t—were selected for subsequent PCA.

3.3. Principal Component Analysis (PCA) of Electrophysiological Features

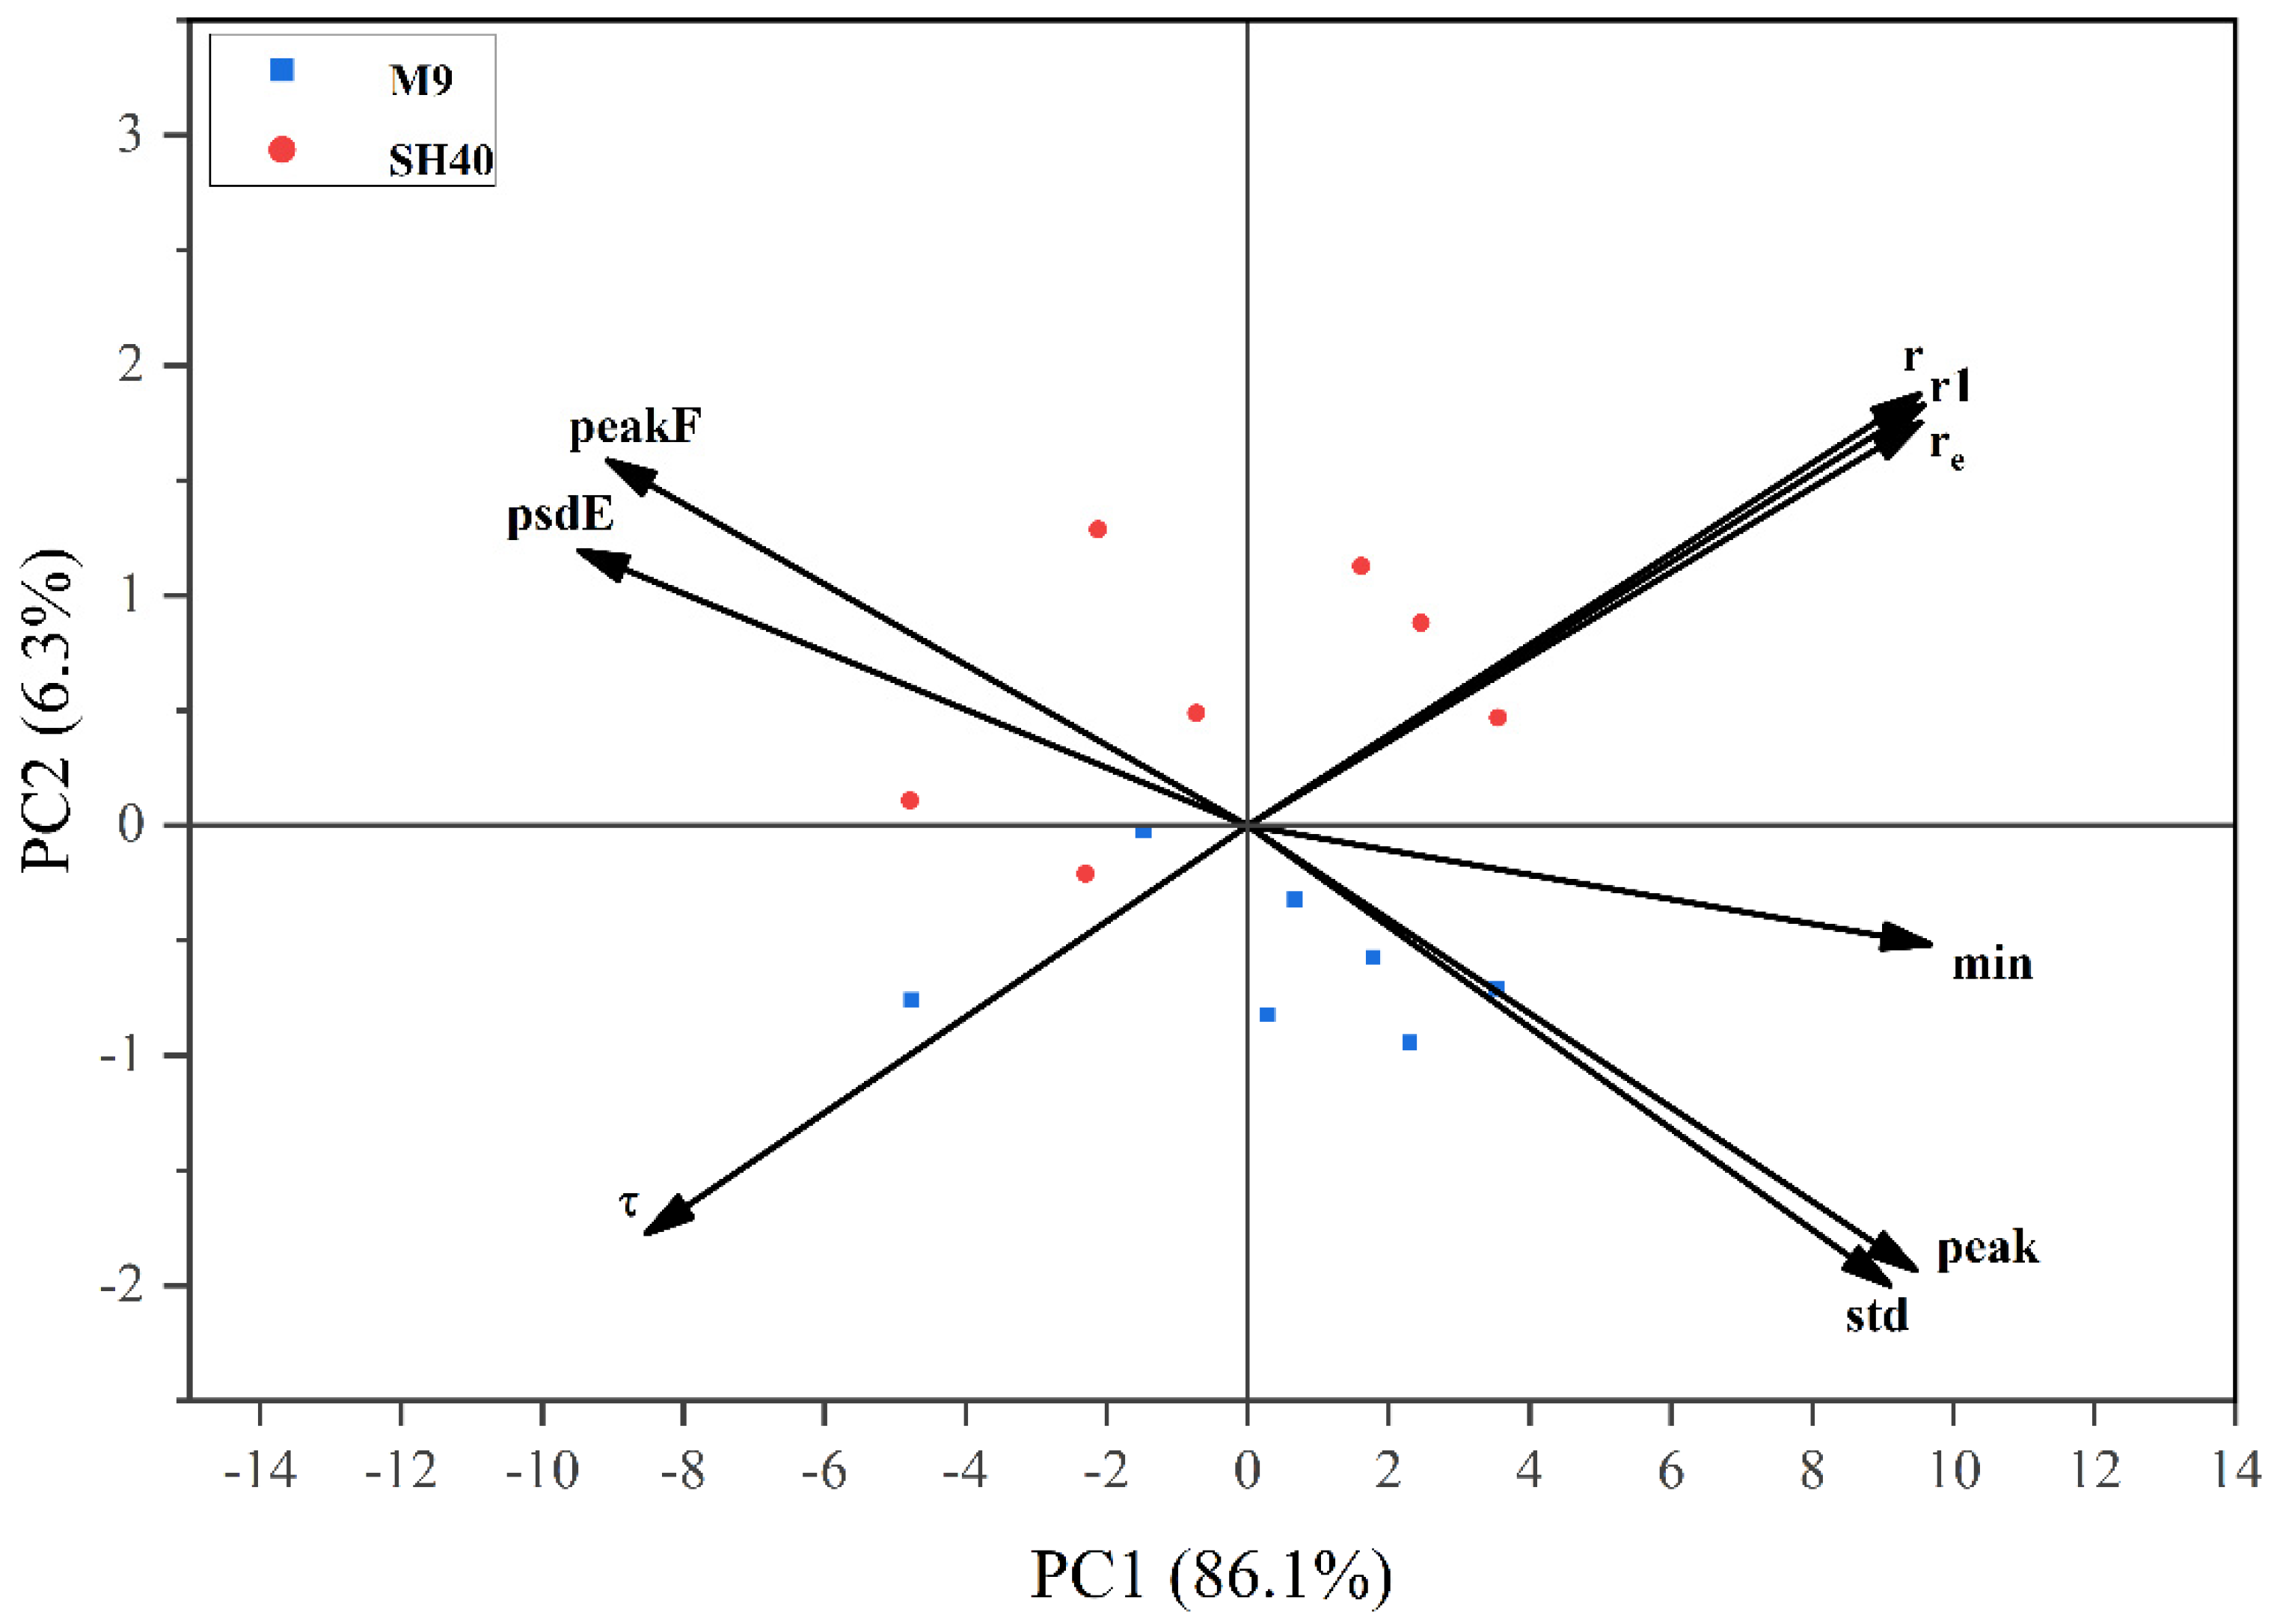
PCA was conducted on the nine selected parameters (Min, Peak, Std, peakF, PsdE, r, r1, re, and t). Two principal components with eigenvalues greater than one were extracted. As shown in Table 2 and Figure 5, PC1, mainly composed of Min, r1, re, r, Peak, std, and psdE, explained 86.13% of the total variance. PC2, mainly comprising psdE, Peak, r, r1, τ, re, and peakF, explained 6.26%. The cumulative contribution of the first two components was 92.39%, indicating they retained most of the information from the original variables. According to Equations (2) and (3), weights for each variable were calculated (Table 3). The top contributors to LT50 variation were r1, re, r, Min, std, Peak, peakF, psdE, and τ. Among these, r, r1, and re had the highest loadings on PC1, indicating strong correlations with LT50. Min, peak, and std also loaded heavily on PC1, whereas τ, PsdE, and peakF were more associated with PC2. Thus, six key variables—r1, rₑ, r, Min, Std, and Peak—were selected for regression modeling.

3.4. Changes in Electrical Characteristics During Overwintering

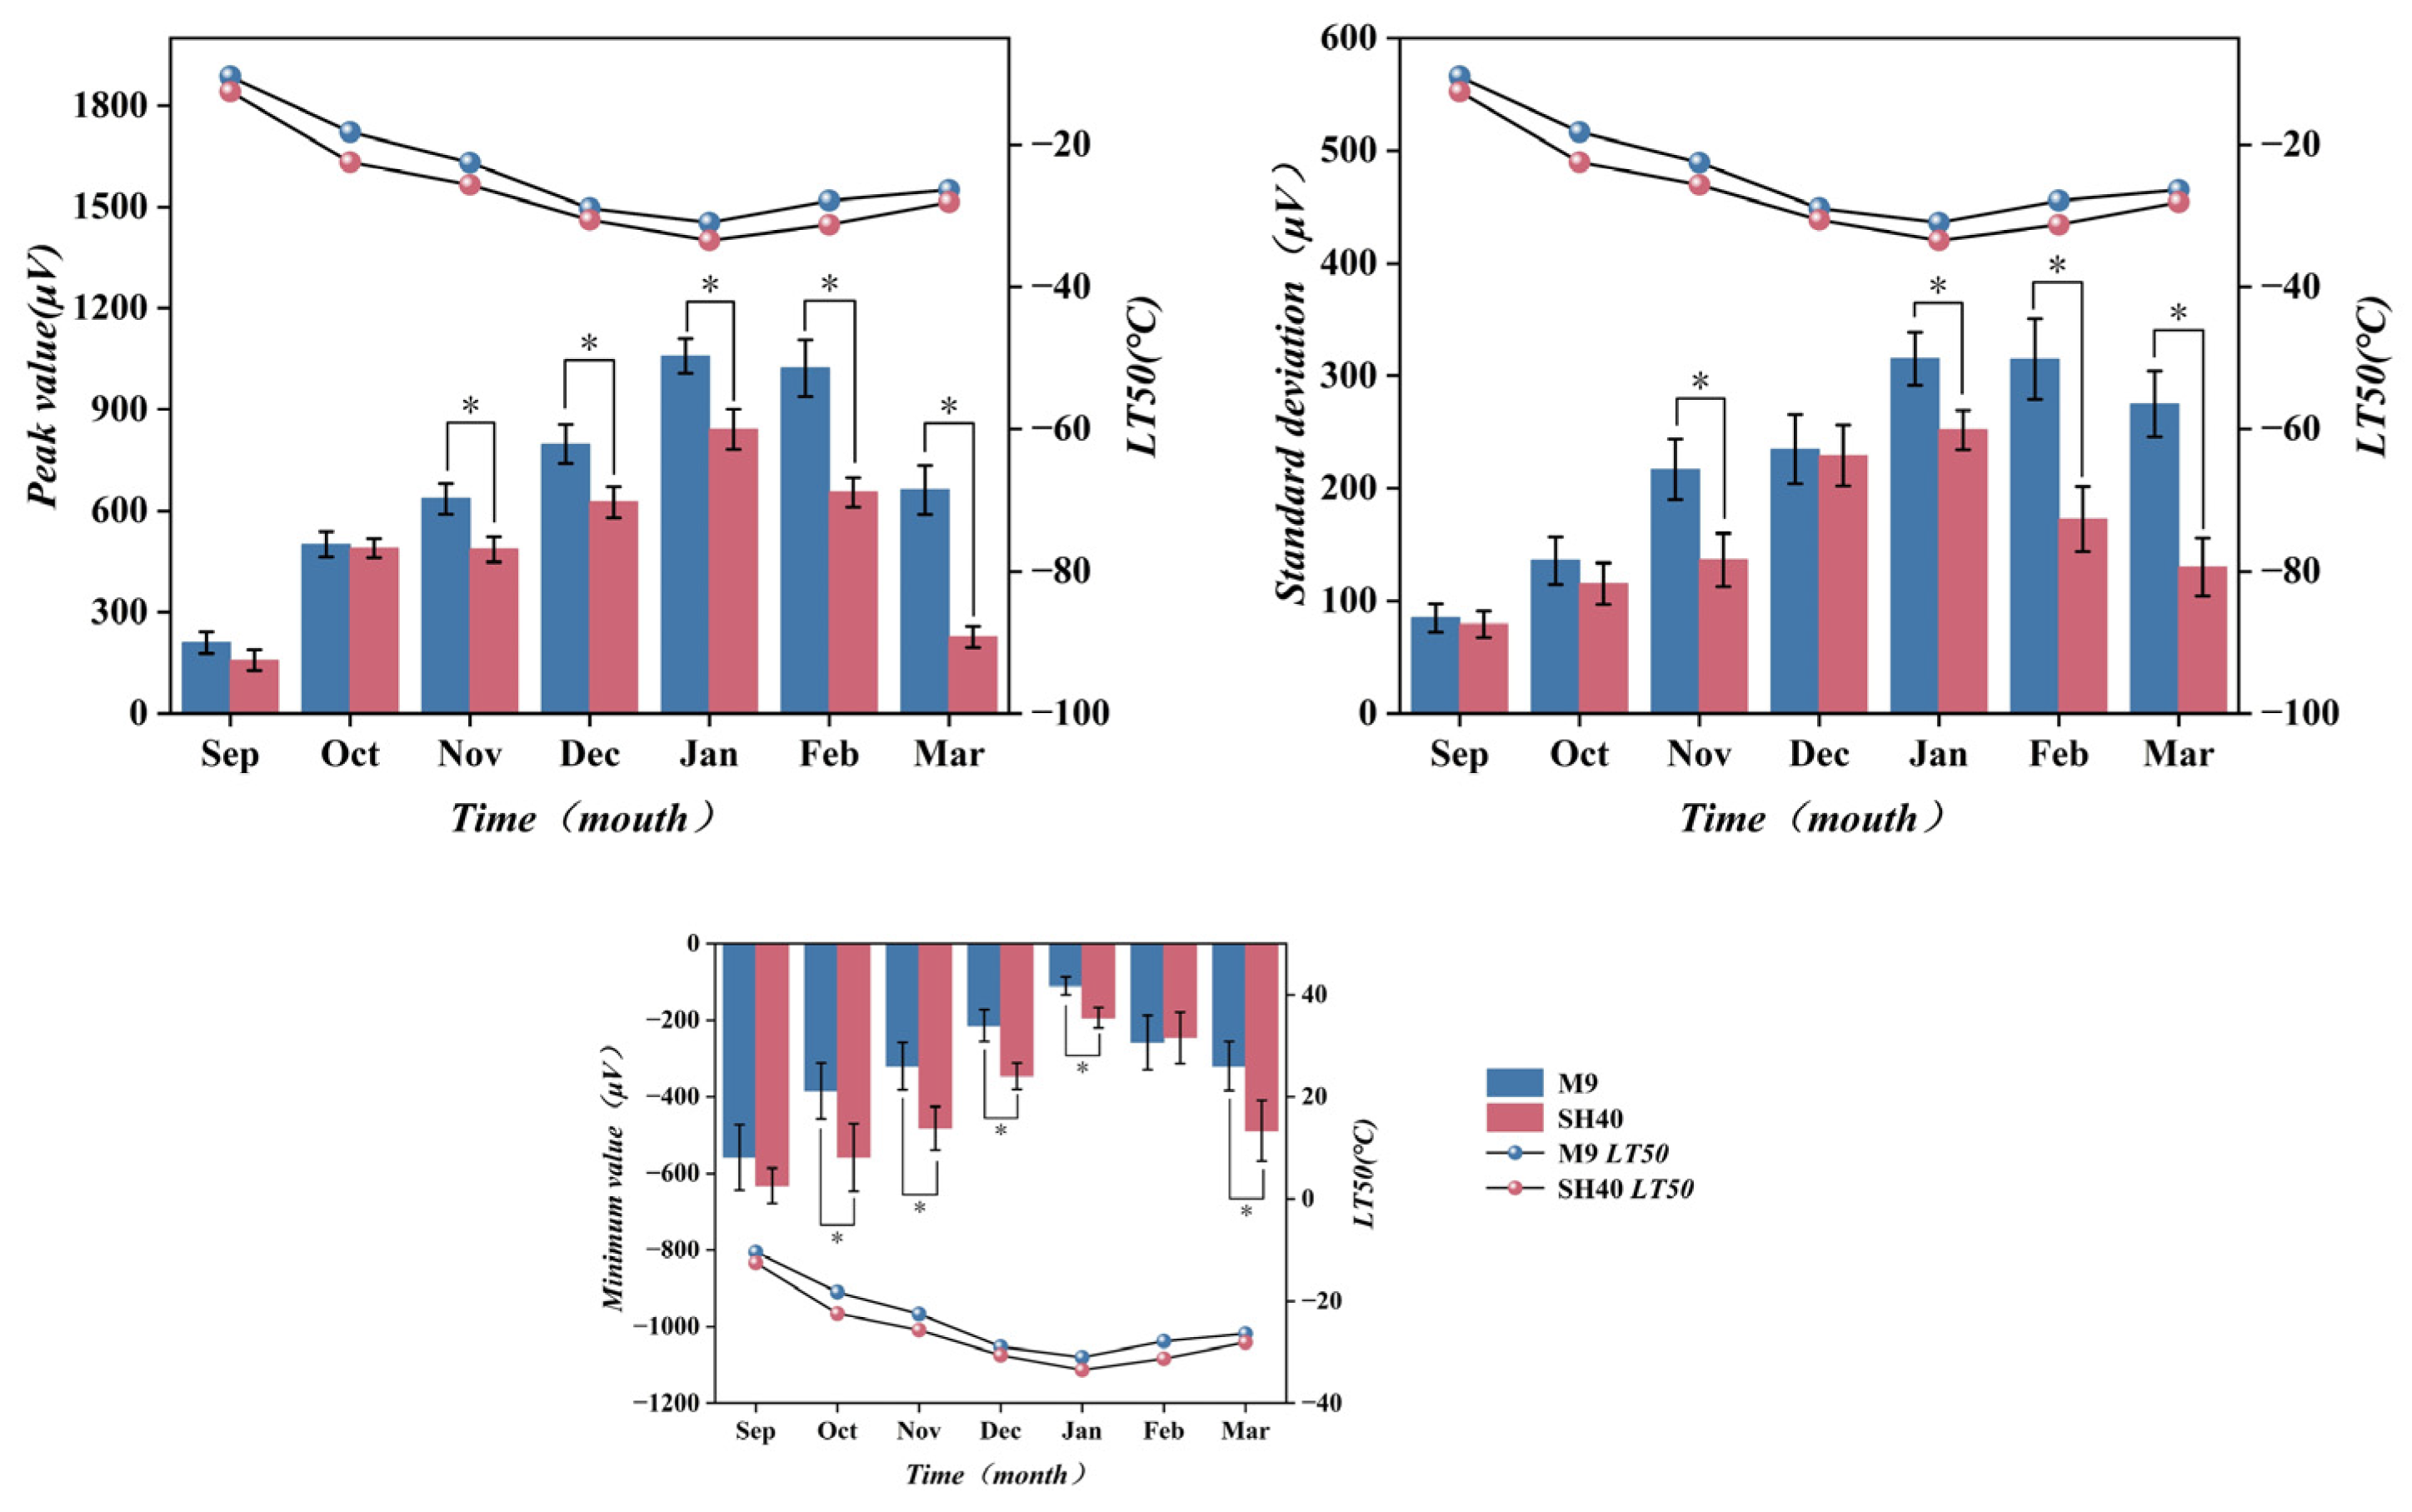
Figure 6 shows that LT50 of M9 and SH40 followed a general trend of decreasing and then increasing during overwintering, with LT50 of SH40 lower than M9, indicating SH40 better cold tolerance. Concurrently, electrical signal features Peak, Std, and Min also increased initially and then decreased. These values peaked in January 2024, when LT50 reached its minimum. Significant negative correlations were observed between LT50 and each of these features (p < 0.05).
M9 exhibited higher Peak, Std, and Min values throughout winter than SH40. Significant differences between M9 and SH40 were found in Peak (November–March), Std (November, January–March), and Min (October–January, March) (p < 0.05).
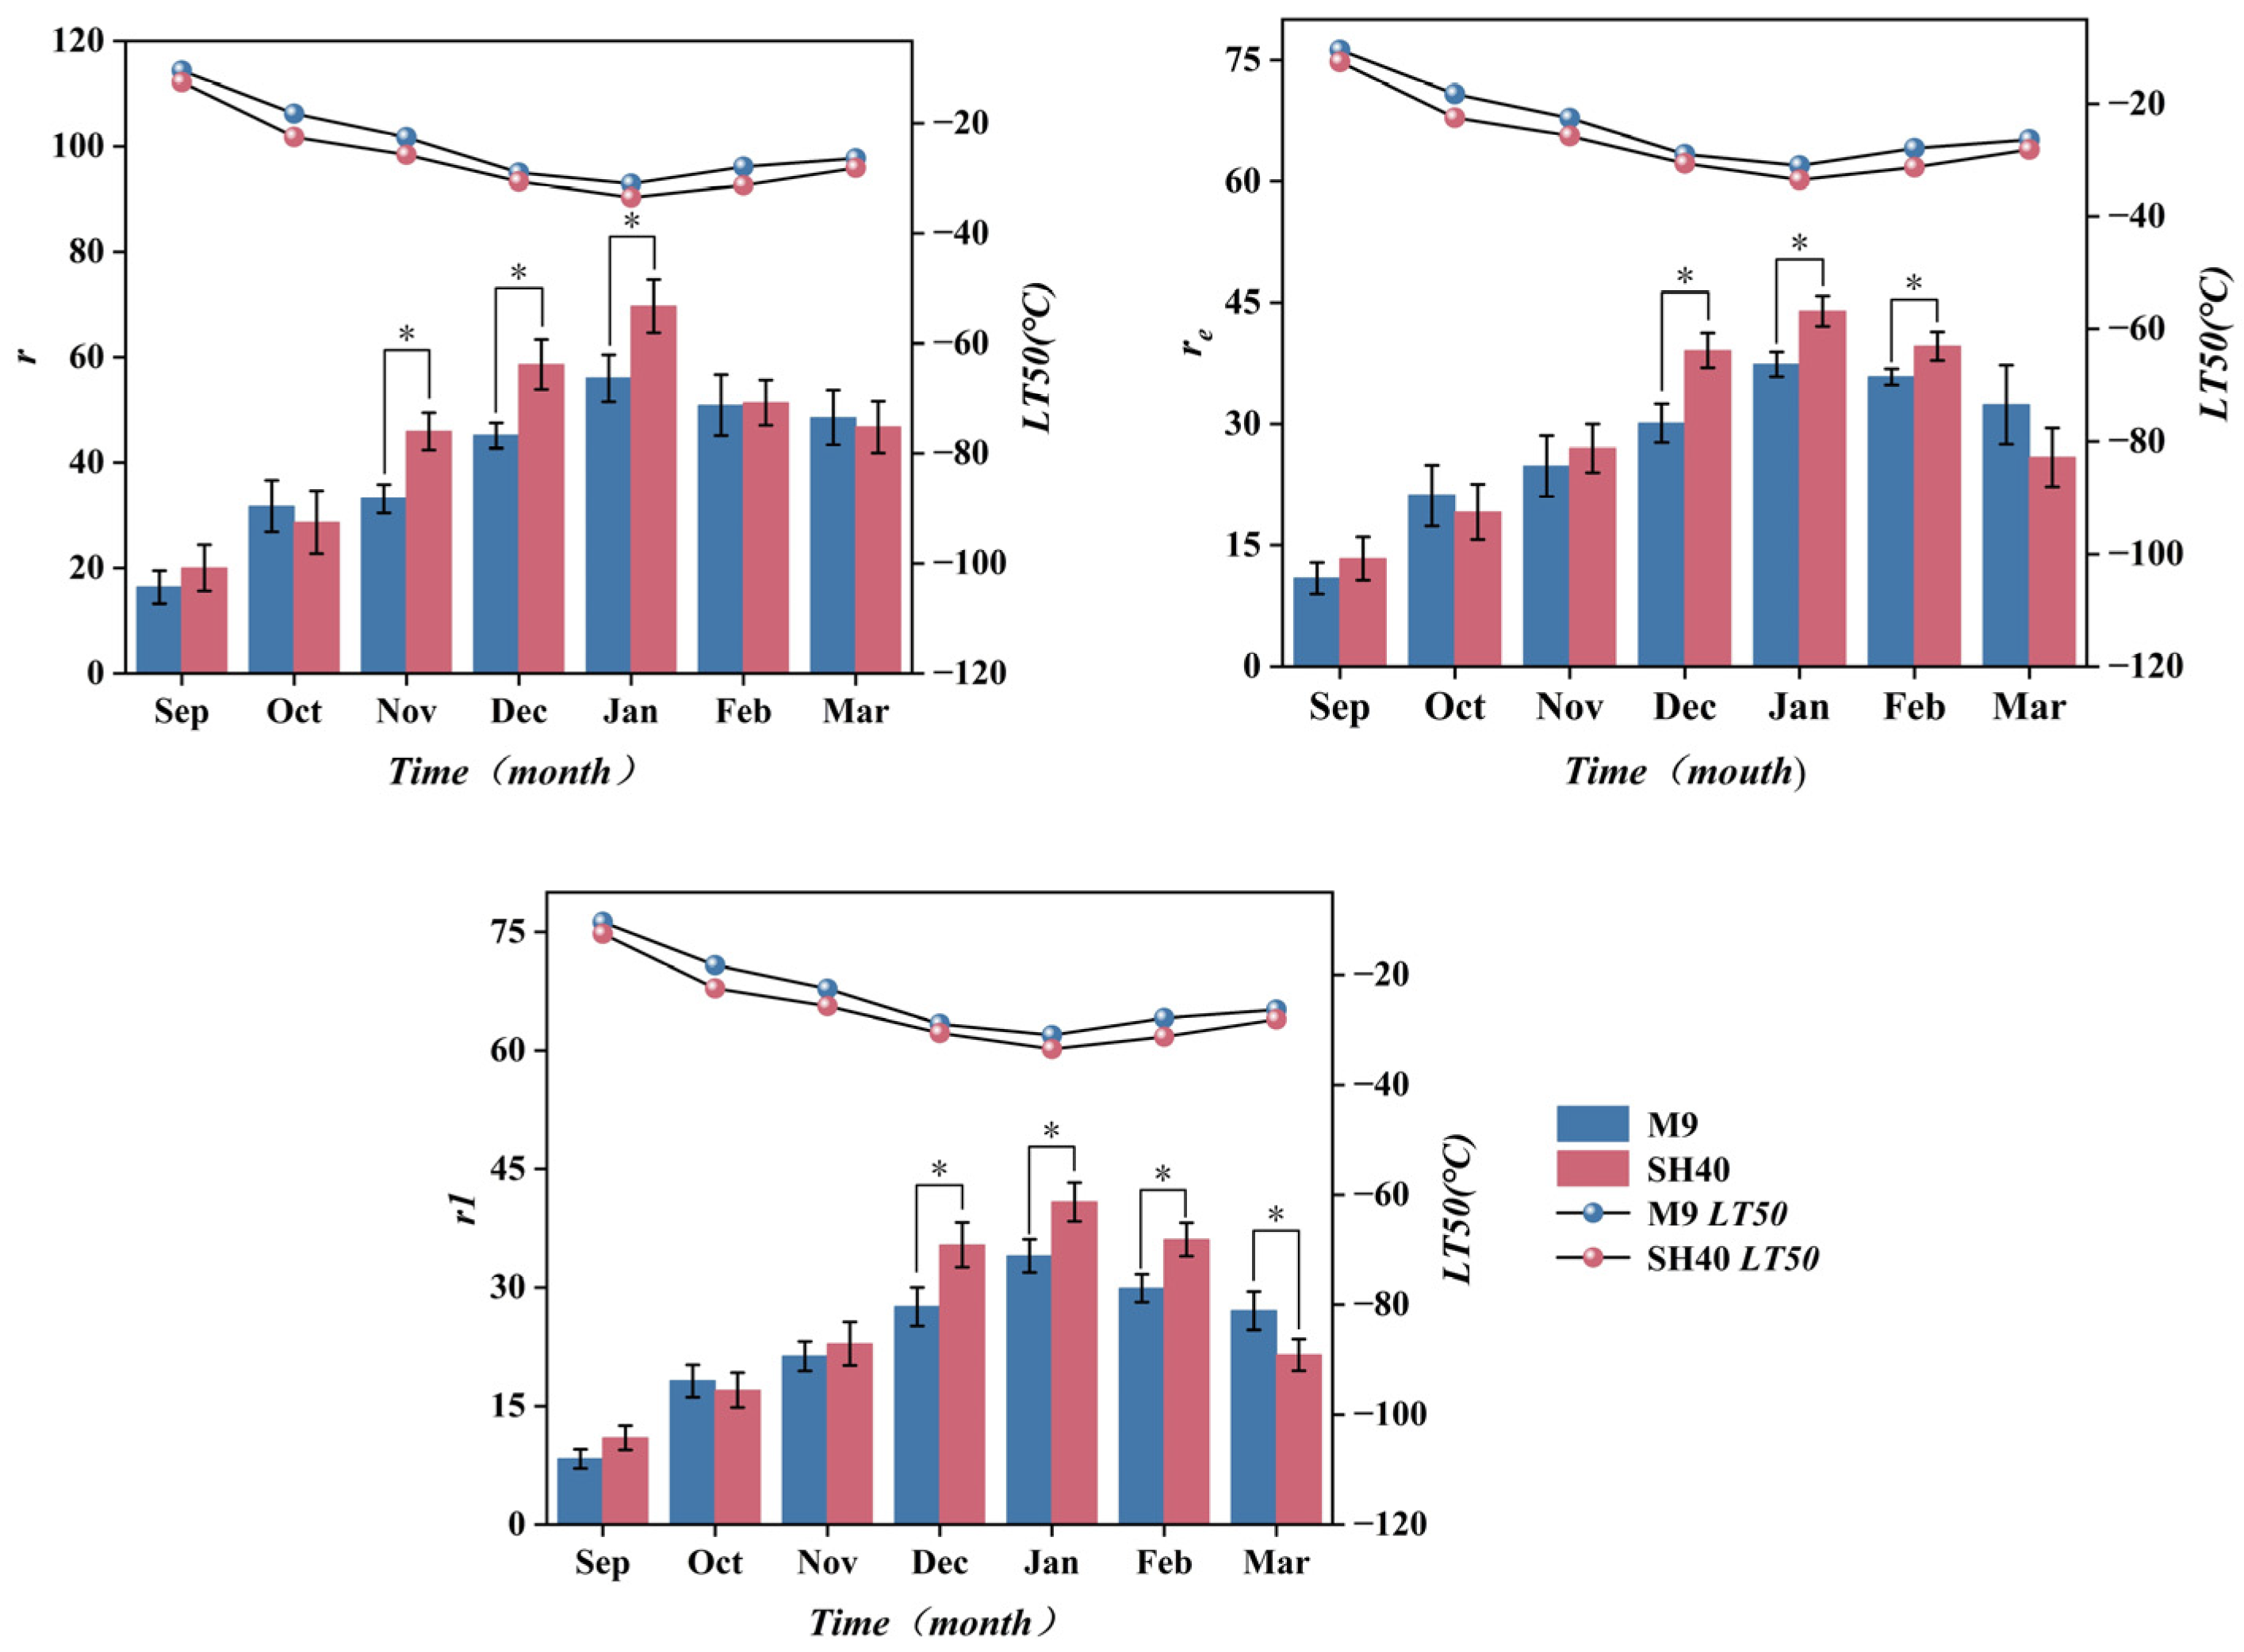
Figure 7 shows that impedance parameters r, re, and r1 also increased first and then decreased. These peaked when LT50 was at its lowest and declined as LT50 increased (2024 January). LT50 was significantly negatively correlated with all three impedance parameters (p < 0.05). SH40 showed higher impedance values than M9 in most sampling periods, with significant differences in re and r1 (December–February) and in r (November–January) (p < 0.05).

3.5. LT50 and Optimal Indicators of Cold Tolerance Regression Modeling

3.5.1. Model Construction

After preprocessing, six key predictors—Min, Peak, Std, r, re, r1—were used to construct a multiple linear regression model for LT50 (y). The fitted equation for ‘Tianhong No. 2’ Fuji on M9 and SH40 was:
y = 3.92 + 0.0013 M i n + 0.0012 P e a k + 0.0036 S t d 0.0331 r 0.1333 r e 0.0711 r 1
As shown in Table 4, the model’s F value was 81.0923 with a highly significant p value (<0.0001). The residual sum of squares was 52.6674, indicating a good fit. The coefficient of determination (R2) was 0.9187, and the adjusted R2 was 0.9123, demonstrating model robustness.

3.5.2. Model Validation

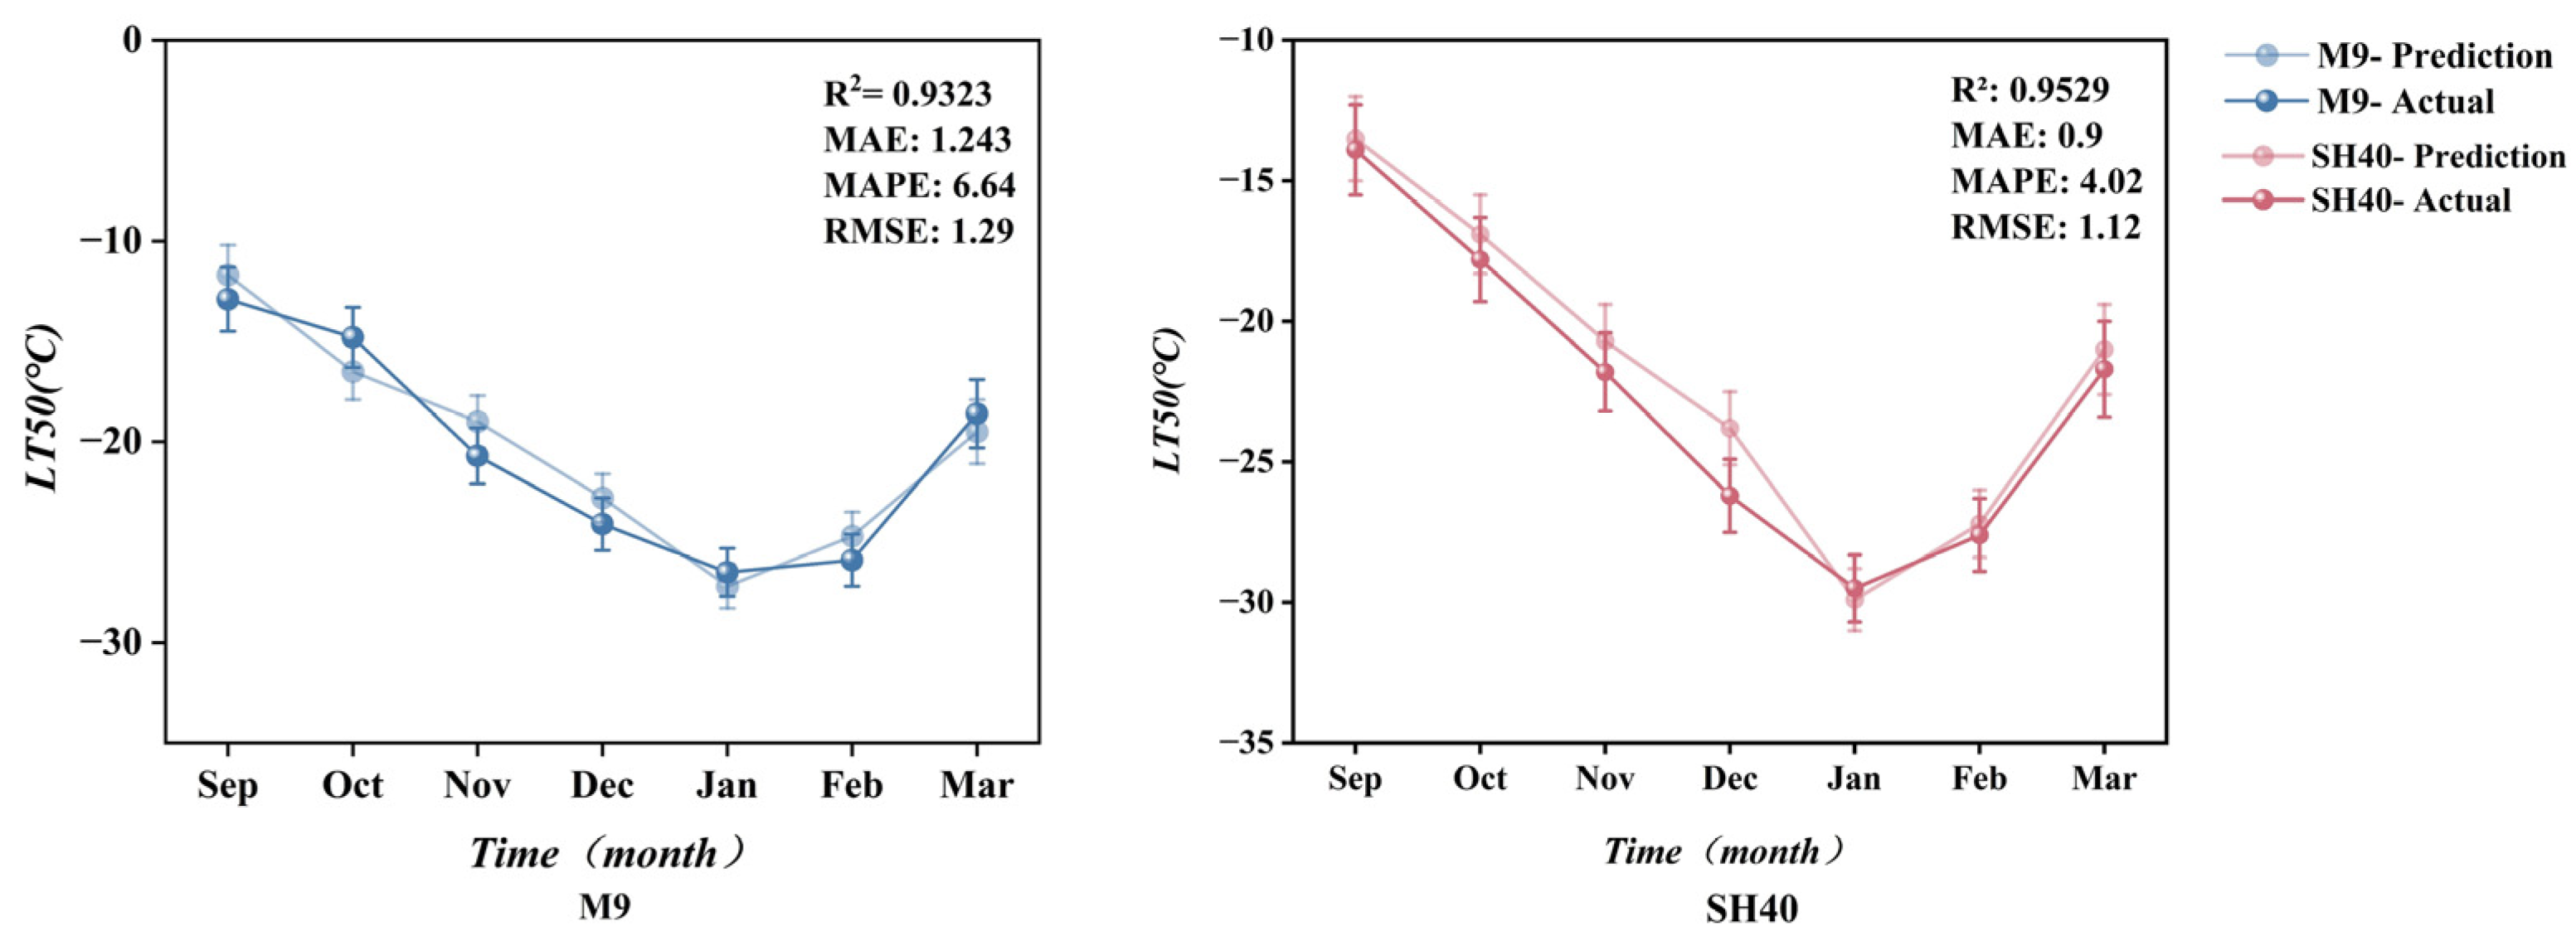
To validate the regression model, electrical features (Min, Peak, Std, r, re, r1) from the 13-year-old M9 and SH40 serve as input to predict LT50 values for each month and are compared to actual measurements. As shown in Figure 8, the R2 values ranged from 0.9323 to 0.9999. The MAE was higher in M9 (1.243) than SH40 (0.900). SH40 also showed lower MAPE and RMSE values, indicating better predictive performance. The predicted LT50 trends closely matched observed values, confirming the model’s accuracy.

4. Discussion

During natural overwintering, the LT50 values of ‘Tianhong No. 2’ Fuji grafted on M9 and SH40 self-rooted rootstocks both showed a trend of first decreasing and then increasing (Figure 3). With the gradual decline in air temperature, plants underwent a cold acclimation phase, during which physiological processes such as membrane stabilization and the accumulation of soluble sugars and proteins contributed to enhanced cold tolerance, as reflected by a gradual decrease in LT50. In mid-winter, cold tolerance was maintained at a high level, and LT50 remained low. As temperatures rose later in the season, the plants became physiologically more active, membrane fluidity increased, and the levels of protective substances decreased, resulting in elevated LT50 values and weakened cold resistance [52].
Throughout the overwintering period, LT50 values of ‘Tianhong No. 2’ Fuji grafted on M9 were consistently higher than those grafted on SH40, suggesting that SH40 rootstock more effectively enhances the cold tolerance of the scion. The differences were especially significant in October and November of 2023 and January and February of 2024 (p < 0.05). These results indicate that SH40 is associated with greater cold tolerance under critical low-temperature conditions, likely due to its stronger water regulation capacity, more stable membrane systems, and increased accumulation of cold-related protective substances. These traits are reflected in its consistently lower LT50 values [53]. In the future, we can further combine antioxidant enzyme activity, osmotic regulation substances, and molecular-level indicators for comprehensive analysis to more comprehensively evaluate the cold resistance of varieties. These findings confirm that ‘Tianhong No. 2’ Fuji grafted on SH40 exhibits stronger cold tolerance than on M9.
The correlation analysis revealed that LT50 was significantly related to several electrophysiological parameters, including Min, Peak, Std, peakF, PsdE, r, r1, re, and t (p < 0.05). LT50 showed significant negative correlations with Peak, Std, and Min. These time-domain parameters reflect the electrophysiological responses of cells to low-temperature stress, indicating the amplitude and stability of membrane potential changes. As temperatures drop, plants activate cold sensing mechanisms and signal transduction pathways. Membrane permeability increases, ions redistribute, and electrical activity intensifies [54]—evidenced by increases in Peak, Std, and Min. This rapid response enables the activation of cold-responsive genes and accumulation of protective osmolytes, improving membrane stability and enhancing cold tolerance [55], thus reducing LT50. In late winter, physiological activity stabilizes, membrane potential fluctuations decrease [56], and cold resistance weakens, leading to a rise in LT50.
LT50 was positively correlated with PeakF and PsdE. These frequency-domain parameters represent the most active response frequency and spectral energy distribution of cellular electrical signals [57]. During sudden temperature drops, the lipid bilayer of the membrane undergoes phase transitions, reducing membrane stability and disrupting ion channel activity [58]. This manifests as stronger PeakF and PsdE values. The enhanced frequency response may reflect an overstimulated membrane system with impaired regulation, which fails to activate effective cold-tolerance pathways in time, ultimately leading to cellular damage and reduced cold hardiness [59].
Electrical impedance parameters r, re, and r1 were significantly negatively correlated with LT50. In the early stages of cold stress, membrane lipid remodeling, accumulation of soluble sugars and proteins, and activation of antioxidant enzymes (such as SOD and POD, which scavenge reactive oxygen species) help maintain membrane integrity and selective permeability [60]. These optimizations reduce electrolyte leakage and increase impedance values, improving cold resistance and lowering LT50 [36]. In late overwintering, although average air temperature increases, greater diurnal fluctuations can damage membranes, causing electrolyte leakage and reduced impedance values [61]. Meanwhile, weakened metabolic activity and slower membrane repair result in higher LT50.
The parameter τ showed a significant positive correlation with LT50. τ reflects the time constant of signal propagation, representing the membrane’s responsiveness and buffering capacity to charge changes [62]. A higher τ under cold stress indicates slower membrane responses and reduced ability to regulate ion fluxes, leading to impaired osmoregulation and greater susceptibility to freezing injury [5]. A lower τ indicates faster response and better membrane regulation, helping maintain cellular homeostasis and thus stronger cold tolerance [26].
Principal Component Analysis (PCA) was employed in this study to address the high multicollinearity observed among variables correlated with LT50. The strong intercorrelation among variables indicated redundancy in the information they conveyed, and PCA allowed us to reduce dimensionality while preserving most of the data’s variability. The first two principal components (PC1 and PC2) accounted for 92.39% of the total variance, indicating that the majority of the dataset’s information was effectively retained in the reduced component space.
Based on loading values and comprehensive weight scores, six parameters—r1, re, r, Min, Std, and Peak—were identified as the most important contributors to cold resistance [63]. Among them, r1, which represents the initial response strength of the electrical signal, exhibited the highest loading in PC1, suggesting it may be the most critical parameter in reflecting cold-induced physiological changes. This is consistent with its biological role, as rapid changes in membrane potential are one of the earliest plant responses to cold stress. Similarly, re and r represent recovery and response durations, which may be associated with membrane stability and signaling efficiency under low-temperature conditions. The parameters Min and Std reflect the extent and variability of membrane potential fluctuations, while Peak indicates the signal intensity at maximum stress.
These six parameters not only contributed most to the principal components statistically but also showed clear biological relevance to cold tolerance mechanisms. Therefore, their inclusion in the regression model is justified both from a data-driven and physiological perspective [64].
Model validation showed high consistency between predicted and observed LT50 values. These results indicate that the selected parameters accurately reflect dynamic changes in cold tolerance during overwintering. As temperatures decreased, changes in cellular water dynamics, charge transport, and membrane integrity were reflected in electrical parameters [65]. The regression model built on one-year-old potted plants also performed well on 13-year-old field-grown trees, indicating the stability of the relationship between electrical characteristics and cold tolerance across different rootstock combinations and growth stages. The model provides a rapid, non-destructive method for evaluating apple cold tolerance and enhances the efficiency and convenience of traditional LT50 testing. It also offers a theoretical and methodological reference for cold tolerance assessment in other deciduous fruit trees.

5. Conclusions

This study analyzed the correlation between electrical parameters and cold tolerance—measured as the semi-lethal temperature (LT50)—in potted apple seedlings and identified optimal electrical indicators through principal component analysis (PCA). A correlation-based regression model was then constructed and validated using 13-year-old field-grown apple trees. The key findings are as follows: (1) Six electrical parameters—r1, re, r, Min, std, Peak—showed significant correlations with LT50 (p < 0.05) and contributed strongly to the first principal component (PC1), indicating their close association with cold tolerance and their suitability as optimal predictors. (2) A multiple linear regression model was developed to predict LT50 based on these selected parameters. The resulting model achieved a coefficient of determination (R2) of 0.9187, demonstrating excellent goodness of fit. (3) Validation using mature apple trees yielded R2 values of 0.9323 and 0.9999, MAE values of 1.243 and 0.900, MAPE values of 6.64% and 4.02%, and RMSE values of 1.29 and 1.12, respectively. Predicted LT50 values closely matched observed values across time, confirming the model’s high accuracy. Overall, the results demonstrate that electrophysiological parameters can reliably reflect dynamic changes in cold tolerance during overwintering and provide a theoretical and methodological basis for rapid, non-destructive cold hardiness assessment in apple and other deciduous fruit trees.

Supplementary Materials

The following supporting information can be downloaded at: https://www.mdpi.com/article/10.3390/agronomy15061458/s1.

Author Contributions

Conceptualization, X.Z. and J.Q.; methodology, S.W.; software, B.S.; validation, B.S. and S.W.; formal analysis, X.N. and L.J.; investigation, S.W.; resources, X.Z. and J.Q.; data curation, B.S.; writing-original draft preparation, B.S.; writing-review and editing, J.Q.; visualization, B.S.; supervision, J.Q.; project administration, X.Z.; funding acquisition, X.Z. and J.Q. All authors have contributed substantially to the work reported. All authors have read and agreed to the published version of the manuscript.

Funding

This work was supported by the Hebei Agriculture Research System (HBCT2024150205) and Baoding City Science & Technology Bureau Innovation Ability Promotion Project (2494N003).

Data Availability Statement

The datasets presented in this article are not readily available because the data are part of an ongoing study.

Conflicts of Interest

The funders had no role in the design of the study; in the collection, analyses, or interpretation of data; in the writing of the manuscript; or in the decision to publish the results.

References

  1. Boinot, M.; Karakas, E.; Koehl, K.; Pagter, M.; Zuther, E. Cold stress and freezing tolerance negatively affect the fitness of Arabidopsis thaliana accessions under field and controlled conditions. Planta 2022, 255, 39. [Google Scholar] [CrossRef] [PubMed]
  2. Raza, A.; Charagh, S.; Najafi-Kakavand, S.; Abbas, S.; Shoaib, Y.; Anwar, S.; Sharifi, S.; Lu, G.; Siddique, K.H.M. Role of phytohormones in regulating cold stress tolerance: Physiological and molecular approaches for developing cold-smart crop plants. Plant Stress 2023, 8, 100152. [Google Scholar] [CrossRef]
  3. Powell, N.; Ji, X.; Ravash, R.; Edlington, J.; Dolferus, R. Yield stability for cereals in a changing climate. Funct. Plant Biol. 2012, 39, 539. [Google Scholar] [CrossRef] [PubMed]
  4. Ågren, J.; Schemske, D.W. Reciprocal transplants demonstrate strong adaptive differentiation of the model organism Arabidopsis thaliana in its native range. New Phytol. 2012, 194, 1112–1122. [Google Scholar] [CrossRef] [PubMed]
  5. Yadav, S.K. Cold stress tolerance mechanisms in plants. A review. Agron. Sustain. Dev. 2010, 30, 515–527. [Google Scholar] [CrossRef]
  6. Wang, S.; Zhang, Y.; Ye, X.; Shen, Y.; Liu, H.; Zhao, X.; Guo, L.; Cao, L.; Du, Y.; Wu, W. A phylotranscriptomic dataset of angiosperm species under cold stress. Sci. Data 2023, 10, 399. [Google Scholar] [CrossRef]
  7. Ding, Y.; Shi, Y.; Yang, S. Advances and challenges in uncovering cold tolerance regulatory mechanisms in plants. New Phytol. 2019, 222, 1690–1704. [Google Scholar] [CrossRef]
  8. Chinnusamy, V.; Zhu, J.; Zhu, J.-K. Cold stress regulation of gene expression in plants. Trends Plant Sci. 2007, 12, 444–451. [Google Scholar] [CrossRef]
  9. Zhou, L.; Ullah, F.; Zou, J.; Zeng, X. Molecular and Physiological Responses of Plants that Enhance Cold Tolerance. Int. J. Mol. Sci. 2025, 26, 1157. [Google Scholar] [CrossRef]
  10. Qi, J.; Song, C.; Wang, B.; Zhou, J.; Kangasjärvi, J.; Zhu, J.; Gong, Z. Reactive oxygen species signaling and stomatal movement in plant responses to drought stress and pathogen attack. J. Integr. Plant Biol. 2018, 60, 805–826. [Google Scholar] [CrossRef]
  11. Anwar, M.P.; Khalid, M.A.I.; Islam, A.M.; Yeasmin, S.; Sharif, A.; Hadifa, A.; Ismail, I.A.; Hossain, A.; El Sabagh, A. Akbar Hossain Potentiality of Different Seed Priming Agents to Mitigate Cold Stress of Winter Rice Seedling. Phyton-Int. J. Exp. Bot. 2021, 90, 1491–1506. [Google Scholar] [CrossRef]
  12. Satyakam; Zinta, G.; Singh, R.K.; Kumar, R. Cold adaptation strategies in plants—An emerging role of epigenetics and antifreeze proteins to engineer cold resilient plants. Front. Genet. 2022, 13, 909007. [Google Scholar] [CrossRef] [PubMed]
  13. Qi, W.; Wang, F.; Ma, L.; Qi, Z.; Liu, S.; Chen, C.; Wu, J.; Wang, P.; Yang, C.; Wu, Y.; et al. Physiological and Biochemical Mechanisms and Cytology of Cold Tolerance in Brassica napus. Front. Plant Sci. 2020, 11, 1241. [Google Scholar] [CrossRef]
  14. Vuković Vimić, A.; Vujadinović Mandić, M.; Fotirić Akšić, M.; Vukićević, K.; Meland, M. Climate Potential for Apple Growing in Norway—Part 1: Zoning of Areas with Heat Conditions Favorable for Apple Growing under Observed Climate Change. Atmosphere 2023, 14, 993. [Google Scholar] [CrossRef]
  15. Pfleiderer, P.; Menke, I.; Schleussner, C.F. Increasing risks of apple tree frost damage under climate change. Clim. Change 2019, 157, 515–525. [Google Scholar] [CrossRef]
  16. Mei, C.; Yang, J.; Mei, Q.; Jia, D.; Yan, P.; Feng, B.; Mamat, A.; Gong, X.; Guan, Q.; Mao, K.; et al. MdNAC104 positively regulates apple cold tolerance via CBF-dependent and CBF-independent pathways. Plant Biotechnol. J. 2023, 21, 2057–2073. [Google Scholar] [CrossRef]
  17. Feng, X.-M.; Zhao, Q.; Zhao, L.-L.; Qiao, Y.; Xie, X.-B.; Li, H.-F.; Yao, Y.-X.; You, C.-X.; Hao, Y.-J. The cold-induced basic helix-loop-helix transcription factor gene MdCIbHLH1encodes an ICE-like protein in apple. BMC Plant Biol. 2012, 12, 22. [Google Scholar] [CrossRef]
  18. Yu, D.J.; Lee, H.J. Evaluation of freezing injury in temperate fruit trees. Hortic. Environ. Biotechnol. 2020, 61, 787–794. [Google Scholar] [CrossRef]
  19. Niu, Y.; Liu, Z.; He, H.; Han, X.; Qi, Z.; Yang, Y. Gene expression and metabolic changes of Momordica charantia L. seedlings in response to low temperature stress. PLoS ONE 2020, 15, e0233130. [Google Scholar] [CrossRef]
  20. Yu, J.; Cang, J.; Lu, Q.; Fan, B.; Xu, Q.; Li, W.; Wang, X. ABA enhanced cold tolerance of wheat ‘dn1’ via increasing ROS scavenging system. Plant Signal. Behav. 2020, 15, 1780403. [Google Scholar] [CrossRef]
  21. Strimbeck, G.R.; Schaberg, P.G.; Fossdal, C.G.; Schröder, W.P.; Kjellsen, T.D. Extreme low temperature tolerance in woody plants. Front. Plant Sci. 2015, 6, 884. [Google Scholar] [CrossRef] [PubMed]
  22. Kovaleski, A.P.; Grossman, J.J. Standardization of electrolyte leakage data and a novel liquid nitrogen control improve measurements of cold hardiness in woody tissue. Plant Methods 2021, 17, 53. [Google Scholar] [CrossRef]
  23. Lindén, L.; Palonen, P.; Lindén, M. Relating Freeze-induced Electrolyte Leakage Measurements to Lethal Temperature in Red Raspberry. J. Am. Soc. Hortic. Sci. 2000, 125, 429–435. [Google Scholar] [CrossRef]
  24. Wilson, B.C.; Jacobs, D.F. Effect of Storage Temperature and Duration on Cold Hardiness and Dormancy of Northern Red Oak Seedlings: Use of the Electrolyte Leakage Procedure; U.S. Department of Agriculture: Washington, DC, USA, 2005. [Google Scholar]
  25. Ilík, P.; Špundová, M.; Šicner, M.; Melkovičová, H.; Kučerová, Z.; Krchňák, P.; Fürst, T.; Večeřová, K.; Panzarová, K.; Benediktyová, Z.; et al. Estimating heat tolerance of plants by ion leakage: A new method based on gradual heating. New Phytol. 2018, 218, 1278–1287. [Google Scholar] [CrossRef]
  26. Li, Y.; Zhang, G.; Que, S.; Zhu, L.; Di, B.; Jin, X. Relationship between parameters of electrical impedance spectroscopy and frost hardiness in stems and needles of Pinus bungeana. Front. For. China 2009, 4, 242–248. [Google Scholar] [CrossRef]
  27. Zhang, C.; Wu, Y.; Su, Y.; Xing, D.; Dai, Y.; Wu, Y.; Fang, L. A Plant’s Electrical Parameters Indicate Its Physiological State: A Study of Intracellular Water Metabolism. Plants 2020, 9, 1256. [Google Scholar] [CrossRef]
  28. Ruth Wairimu, N.; Kuria, K.P.; Tuwei, K.A. Action and variation potential electrical signals in higher plants. Afr. J. Biol. Sci. 2021, 3, 1–18. [Google Scholar] [CrossRef]
  29. Jócsák, I.; Végvári, G.; Vozáry, E. Electrical impedance measurement on plants: A review with some insights to other fields. Theor. Exp. Plant Physiol. 2019, 31, 359–375. [Google Scholar] [CrossRef]
  30. Hussain, M.I.; El-Keblawy, A.; Akhtar, N.; Elwakil, A.S. Electrical Impedance Spectroscopy in Plant Biology. In Sustainable Agriculture Reviews 52; Lichtfouse, E., Ed.; Springer International Publishing: Cham, Switzerland, 2021; Volume 52, pp. 395–416. [Google Scholar] [CrossRef]
  31. Dean, D.A.; Ramanathan, T.; Machado, D.; Sundararajan, R. Electrical impedance spectroscopy study of biological tissues. J. Electrost. 2008, 66, 165–177. [Google Scholar] [CrossRef]
  32. Abdelrady, W.A.; Ma, Z.; Elshawy, E.E.; Wang, L.; Askri, S.M.H.; Ibrahim, Z.; Dennis, E.; Kanwal, F.; Zeng, F.; Shamsi, I.H. Physiological and biochemical mechanisms of salt tolerance in barley under salinity stress. Plant Stress 2024, 11, 100403. [Google Scholar] [CrossRef]
  33. Bita, C.E.; Gerats, T. Plant tolerance to high temperature in a changing environment: Scientific fundamentals and production of heat stress-tolerant crops. Front. Plant Sci. 2013, 4, 273. [Google Scholar] [CrossRef] [PubMed]
  34. Saud, S.; Wang, D.; Fahad, S.; Javed, T.; Jaremko, M.; Abdelsalam, N.R.; Ghareeb, R.Y. The impact of chromium ion stress on plant growth, developmental physiology, and molecular regulation. Front. Plant Sci. 2022, 13, 994785. [Google Scholar] [CrossRef] [PubMed]
  35. Zhang, M.; Wu, Y.; Xing, D.; Zhao, K.; Yu, R. Rapid Measurement of Drought Resistance in Plants Based on Electrophysiological Properties. Trans. ASABE 2015, 58, 1441–1446. [Google Scholar] [CrossRef]
  36. Liu, Y.; Li, D.; Qian, J.; Di, B.; Zhang, G.; Ren, Z. Electrical impedance spectroscopy (EIS) in plant roots research: A review. Plant Methods 2021, 17, 118. [Google Scholar] [CrossRef]
  37. Song, X.; Gao, T.; Ai, M.; Gao, S. Experimental investigation of freeze injury temperatures in trees and their contributing factors based on electrical impedance spectroscopy. Front. Plant Sci. 2024, 15, 1326038. [Google Scholar] [CrossRef] [PubMed]
  38. Serrano-Pallicer, E.; Muñoz-Albero, M.; Pérez-Fuster, C.; Masot Peris, R.; Laguarda-Miró, N. Early Detection of Freeze Damage in Navelate Oranges with Electrochemical Impedance Spectroscopy. Sensors 2018, 18, 4503. [Google Scholar] [CrossRef]
  39. Zhang, G.; Xiao, J.; Chen, D. Electrical Impedance Spectroscopy Method for Determining Plant Cold Resistance. J. Plant Physiol. Mol. Biol. 2005, 31, 19–26. [Google Scholar]
  40. Romero Fogué, D.; Masot Peris, R.; Ibáñez Civera, J.; Contat Rodrigo, L.; Laguarda-Miro, N. Monitoring Freeze-Damage in Grapefruit by Electric Bioimpedance Spectroscopy and Electric Equivalent Models. Horticulturae 2022, 8, 218. [Google Scholar] [CrossRef]
  41. Mudrilov, M.; Ladeynova, M.; Grinberg, M.; Balalaeva, I.; Vodeneev, V. Electrical Signaling of Plants under Abiotic Stressors: Transmission of Stimulus-Specific Information. Int. J. Mol. Sci. 2021, 22, 10715. [Google Scholar] [CrossRef]
  42. Oyarce, P.; Gurovich, L. Electrical signals in avocado trees: Responses to light and water availability conditions. Plant Signal. Behav. 2010, 5, 34–41. [Google Scholar] [CrossRef]
  43. Wilner, J. Note on an electrolytic procedure for differentiating between frost injury of roots and shoots in woody plants. Can. J. Plant Sci. 1959, 39, 512–513. [Google Scholar] [CrossRef]
  44. Zhang, B.Q.; Yang, L.T.; Li, Y.R. Physiological and Biochemical characteristics related to cold resistance in sugarcane. Sugar Tech 2015, 17, 49–58. [Google Scholar] [CrossRef]
  45. Verma, N.; Verma, A.K. Performance analysis of wavelet thresholding methods in denoising of audio signals of some Indian musical instruments. Int. J. Eng. Sci. Technol. 2012, 4, 6. [Google Scholar]
  46. Gao, X.; Xi, G.; Liu, K.; Liu, Q. The study of de-noising method about plant electrical signal based on wavelet. J. Xi’an Univ. Technol. 2013, 29, 92–97. [Google Scholar]
  47. Valencia, D.; Orejuela, D.; Salazar, J.; Valencia, J. Comparison analysis between rigrsure, sqtwolog, heursure and minimaxi techniques using hard and soft thresholding methods. In Proceedings of the 2016 XXI IEEE Symposium on Signal Processing, Images and Artificial Vision (STSIVA), Bucaramanga, Colombia, 31 August–2 September 2016; pp. 1–5. [Google Scholar]
  48. Zhou, J.; Yuan, W.; Di, B.; Zhang, G.; Zhu, J.; Zhou, P.; Ding, T.; Qian, J. Relationship among Electrical Signals, Chlorophyll Fluorescence, and Root Vitality of Strawberry Seedlings under Drought Stress. Agronomy 2022, 12, 1428. [Google Scholar] [CrossRef]
  49. Zhang, G.; Ryyppö, A.; Vapaavuori, E.; Repo, T. Quantification of additive response and stationarity of frost hardiness by photoperiod and temperature in Scots pine. Can. J. For. Res. 2003, 33, 1772–1784. [Google Scholar] [CrossRef]
  50. Serrano-Finetti, E.; Castillo, E.; Alejos, S.; León Hilario, L.M. Toward noninvasive monitoring of plant leaf water content by electrical impedance spectroscopy by electrical impedance spectroscopy. Comput. Electron. Agric. 2023, 210, 107907. [Google Scholar] [CrossRef]
  51. Repo, T.; Zhang, M.I.N.; Ryyppö, A.; Vapaavuori, E.; Sutinen, S. Effects of freeze-thaw injury on parameters of distributed electrical circuits of stems and needles of Scots pine seedlings at different stages of acclimation. J. Exp. Bot. 1994, 45, 823–833. [Google Scholar] [CrossRef]
  52. Uemura, M.; Steponkus, P.L. Cold Acclimation in Plants: Relationship Between the Lipid Composition and the Cryostability of the Plasma Membrane. J. Plant Res. 1999, 112, 245–254. [Google Scholar] [CrossRef]
  53. Moran, R.E.; Sun, Y.; Geng, F.; Zhang, D.; Fazio, G. Cold Temperature Tolerance of Trunk and Root Tissues in One- or Two-year-old Apple Rootstocks. HortScience 2011, 46, 1460–1464. [Google Scholar] [CrossRef]
  54. Zheng, G.; Li, L.; Li, W. Glycerolipidome responses to freezing- and chilling-induced injuries: Examples in Arabidopsis and rice. BMC Plant Biol. 2016, 16, 70. [Google Scholar] [CrossRef] [PubMed]
  55. Lee, Y.; Hoang, N.V.; Do, V.G.; Foster, T.M.; McGhie, T.K.; Kim, S.; Yang, S.J.; Park, J.-H.; Park, J.; Lee, J.-Y. Identification of genes associated with the regulation of cold tolerance and the RNA movement in the grafted apple. Sci. Rep. 2023, 13, 11583. [Google Scholar] [CrossRef] [PubMed]
  56. Li, X.-L.; Meng, D.; Li, M.-J.; Zhou, J.; Yang, Y.-Z.; Zhou, B.-B.; Wei, Q.-P.; Zhang, J.-K. Transcription factors MhDREB2A/MhZAT10 play a role in drought and cold stress response crosstalk in apple. Plant Physiol. 2023, 192, 2203–2220. [Google Scholar] [CrossRef]
  57. Chen, X.; Yao, C.; Li, C.; Sun, C.; Mi, Y.; Li, C.; Hu, L. Frequency Response Model and Simulation of Transmembrane Potentials on Cellular Inner and Outer Membranes. In Proceedings of the 2007 29th Annual International Conference of the IEEE Engineering in Medicine and Biology Society, Lyon, France, 23–26 August 2007; pp. 5818–5821. [Google Scholar] [CrossRef]
  58. Alessandrini, A.; Facci, P. Changes in single K+ channel behavior induced by a lipid phase transition. Integr. Biol. 2010, 99, 3675–3683. [Google Scholar] [CrossRef]
  59. Miura, K.; Furumoto, T. Cold Signaling and Cold Response in Plants. Int. J. Mol. Sci. 2013, 14, 5312–5337. [Google Scholar] [CrossRef] [PubMed]
  60. Qian, Z.; He, L.; Li, F. Understanding cold stress response mechanisms in plants: An overview. Front. Plant Sci. 2024, 15, 1443317. [Google Scholar] [CrossRef]
  61. Zhang, M.I.N.; Willison, J.H.M. Electrical impedance analysis in plant tissues: In vivo detection of freezing injury. Can. J. Bot. 1992, 70, 2254–2258. [Google Scholar] [CrossRef]
  62. Isokawa, M. Membrane time constant as a tool to assess cell degeneration. Brain Res. Protoc. 1997, 1, 114–116. [Google Scholar] [CrossRef]
  63. Bañoc, D.M.; Yamauchi, A.; Kamoshita, A.; Wade, L.J.; Pardales, J.R. Genotypic Variations in Response of Lateral Root Development to Fluctuating Soil Moisture in Rice. Plant Prod. Sci. 2000, 3, 335–343. [Google Scholar] [CrossRef]
  64. Ding, J.; Zhang, Z.; Zhu, X.; Hou, Y. Comprehensive evaluation of physiological response and cold tolerance of domesticated Cinnamomum camphora (L.) Presl under low temperature stress. PeerJ 2024, 12, e18590. [Google Scholar] [CrossRef]
  65. Campos, P.S.; Quartin, V.N.; Ramalho, J.C.; Nunes, M.A. Electrolyte leakage and lipid degradation account for cold sensitivity in leaves of Coffea sp. plants. J. Plant Physiol. 2003, 160, 283–292. [Google Scholar] [CrossRef] [PubMed]
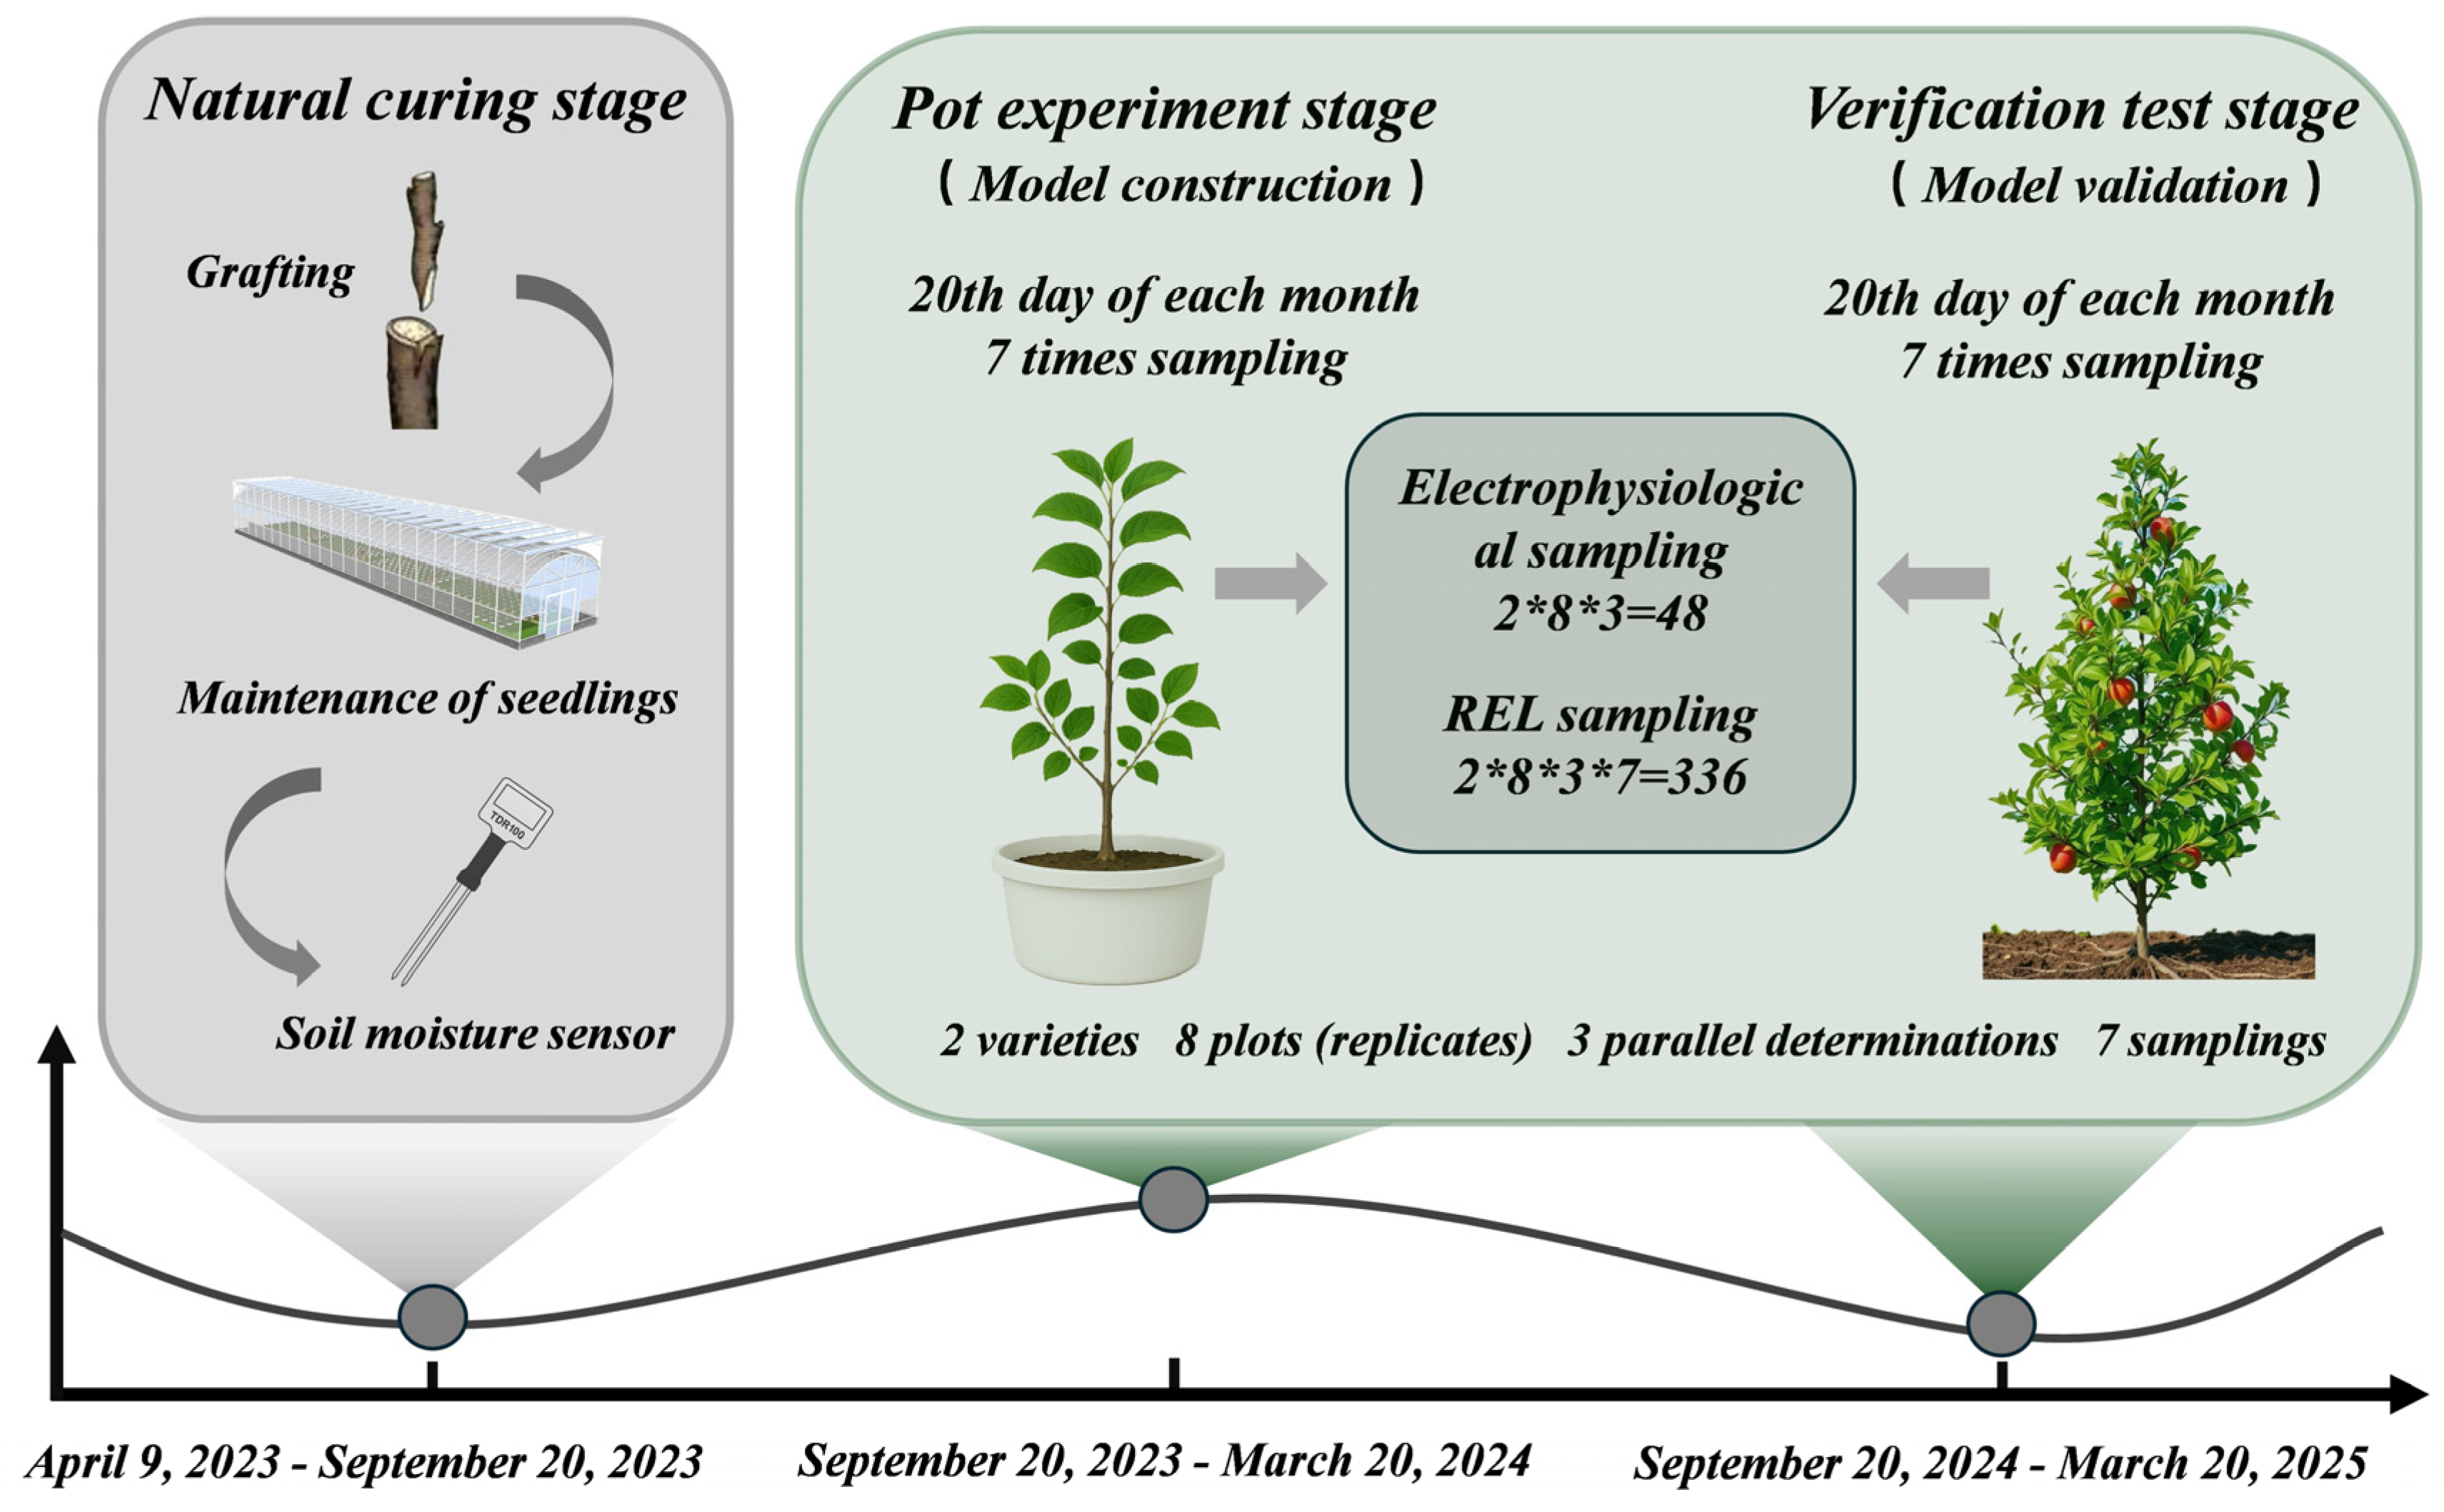
Figure 1. Experimental design of this study. (REL: relative electrolyte leakage).
Agronomy 15 01458 g001
Figure 2. Schematic diagram of the sampling and measurement locations for electrical property acquisition in apple seedlings.
Agronomy 15 01458 g002
Figure 3. Dynamic variation in LT50 of ‘Tianhong No. 2’ Fuji grafted on M9 and SH40 during natural overwintering. Error bars indicate standard error (n = 24). * indicates p < 0.05.
Agronomy 15 01458 g003
Figure 4. Pearson correlation between LT50 and electrophysiological parameters during natural overwintering. (Notes: Right scale shows correlation; dark blue = strong negative, white = near zero, dark red = strong positive. * indicates that the correlation is statistically significant (p < 0.05)).
Agronomy 15 01458 g004
Figure 5. PCA score plot of electrophysiological cold tolerance indicators during overwintering. (Blue = M9; red = SH40).
Agronomy 15 01458 g005
Figure 6. Dynamic changes in Min, Peak, and Std (bars) and LT50 (line) during overwintering. (Notes: Error bars indicate standard error (n = 24), * indicates p < 0.05).
Agronomy 15 01458 g006
Figure 7. Dynamic changes in r, rₑ, and r1 (bars) and LT50 (line) during overwintering. (Notes: Error bars indicate standard error (n = 24), * indicates p < 0.05).
Agronomy 15 01458 g007
Figure 8. Comparison between predicted and measured LT50 values of 13-year-old M9 and SH40 ‘Fuji’ during overwintering.
Agronomy 15 01458 g008
Table 1. Set temperatures for low-temperature freezing treatments.
Date (Year-Month-Day)Temperature (°C)
2023-09-204−10−20−30−35−45
2023-10-204−10−20−30−35−45
2023-11-204−10−20−30−35−45
2023-12-204−15−25−35−45−80
2024-01-204−15−25−35−45−80
2024-02-204−15−25−35−45−80
2024-03-204−10−20−30−45−80
Table 2. Eigenvalues, contribution rates, and eigenvectors of principal components.
Principal Component First Principal ComponentSecond Principal Component
Eigenvalue 15.5031.127
Proportion (%) 86.1286.260
Cumulative (%) 86.12892.387
EigenvectorMin0.244−0.073
r10.2420.259
re0.2410.248
r0.2400.265
std−0.2390.170
Peak0.239−0.273
psdE0.230−0.283
peakF−0.2290.224
t−0.215−0.250
Table 3. Loadings and weights of cold tolerance indicators for M9 and SH40.
Load CapacityF1 × Y1 + F2 × Y2Weight
IndexesComponent
12
Min0.962−0.0771.4820.320
r10.9520.2751.5070.326
re0.9490.2631.5010.324
r0.9460.2811.4990.324
std−0.9420.180−1.439−0.311
Peak0.941−0.2901.4260.308
psdE0.905−0.3001.3690.296
peakF−0.9020.238−1.372−0.297
t−0.848−0.266−1.345−0.291
Table 4. ANOVA and regression coefficient significance test for the model.
SourceDegrees of FreedomSum of SquaresMean Square SumF-Numberp-Number
Model 6595.004299.167481.0923p < 0.0001
Error 4352.66741.2248
Total 49647.6716
Variable Degrees of FreedomEstimated valueStandard errort-valuep-value
Constant 1−3.92000.0086−455.81p < 0.0001
Min 10.00130.01840.0701p < 0.0001
Peak 10.00120.01980.0596p < 0.0001
Std 10.00360.02100.1695p < 0.0001
r 1−0.03310.0192−1.7240p < 0.0001
re 1−0.13330.0202−6.5980p < 0.0001
r1 1−0.07110.0214−3.3234p < 0.0001
Disclaimer/Publisher’s Note: The statements, opinions and data contained in all publications are solely those of the individual author(s) and contributor(s) and not of MDPI and/or the editor(s). MDPI and/or the editor(s) disclaim responsibility for any injury to people or property resulting from any ideas, methods, instructions or products referred to in the content.