Article

Transcriptome Differential Expression Regulation Analysis of the Narrow-Leaf Mutant of Sorghum Bicolor

1
Sorghum Research Institute, Liaoning Academy of Agricultural Sciences, Shenyang 110161, China
2
School of Life Science and Engineering, Shenyang University, Shenyang 110044, China
3
Shenyang Institute of Applied Ecology, Chinese Academy of Sciences, Shenyang 110016, China
4
Key Laboratory of Ecological Restoration of Regional Polluted Environment, Ministry of Education, Shenyang University, Shenyang 110044, China
*
Authors to whom correspondence should be addressed.
Agronomy 2025, 15(6), 1432; https://doi.org/10.3390/agronomy15061432
Submission received: 15 April 2025 / Revised: 28 May 2025 / Accepted: 9 June 2025 / Published: 12 June 2025
(This article belongs to the Section Plant-Crop Biology and Biochemistry)

Abstract

:
Leaf morphology influences photosynthesis, transpiration, and, ultimately, crop yield. To elucidate the molecular regulatory mechanisms underlying narrow leaves in Sorghum bicolor, we identified key DEGs (differentially expressed genes) influencing leaf morphology. The nal6 (the narrow-leaf mutant6) was obtained through 0.1% EMS (ethyl methane sulfonate) chemical mutagenesis of the WT (BTX623). Compared with the WT leaves, there were significant differences in leaf width and length at the flowering stage. A total of 1520 DEGs between the nal6 and WT were screened at the flowering stage based on the transcriptome analysis of sword leaves. KEGG and GO enrichment analyses revealed that DEGs were significantly enriched in pathways such as plant signal transduction, cytokinin biosynthesis, photosynthetic antenna proteins, and secondary metabolite biosynthesis. Further analysis indicated that four DEGs are involved in regulating auxin signaling transduction, thirteen DEGs are involved in regulating zeatin signal transduction, and two DEGs are involved in regulating zeatin biosynthesis. These genes are differentially expressed in nal6, directly affecting the signaling of auxin and zeatin and the biosynthesis of zeatin. Our findings provide a theoretical foundation for understanding the molecular regulation of narrow leaves and breeding ideal plant types in Sorghum bicolor.

1. Introduction

The leaves are the main organ for photosynthesis in sorghum (Sorghum bicolor (L.) Moench). In particular, the leaves are slightly narrow, thick, straight, and curled, encompassing the basic requirements for breeding the ideal plant type [1]. Narrow leaves, as an important feature of the leaf shape, can be used for the morphological improvement of plant types. A suitable leaf area index is the basis for high yield. A study of the rice variety IR8 by the International Rice Research Institute found that during the milky stage, 80% of the supply source of seed assimilates originated from the upper three leaves of rice [2]. The growth rate of stem-grown leaves and the leaf size directly influence the leaf area index after the internode growth stage [3]. The proportion of individual plant size within a population also affects the size and productivity of the population leaf area, while the trait, size, and leaf pinch angle of inverted rice trilobes impacts the leaf area index of individual plants, which in turn affects the leaf area index and photosynthetic products of the population. Excessively wide and long upper leaves cause leaf pendency and shade the lower leaves, decreasing the fruiting rate and ultimately affecting yield [4]. Therefore, moderately narrowing sorghum leaves can increase the permeability of the population, improve photosynthetic efficiency, and thus improve the population yield or quality [5].
A large number of narrow-leaf mutants have been obtained in rice, maize, and other crops by various approaches such as radiation-based methods, EMS mutagenesis, and T-DNA insertion mutations. At present, 41 narrow-leaf mutant genes have been located. Plant hormones are the most widely distributed hormones in plants and play a core role in the growth and development of plants. They specifically regulate the elongation and growth of plants, cell morphology construction, and directional reaction [6,7]. Active transport from the upper end of the plant morphology to the lower end of the morphology. PAT (Polar Auxin Transport) can actively transport from the upper of the morphology to the lower of the morphology, affecting the growth and development of the plant throughout its life cycle [8]. PAT is crucial for blade formation and division. NAL1 encodes a plant-specific protein involved in PAT and acts upstream in the auxin signaling pathway, playing a role in regulating the polar transport of auxin and cell division and differentiation. The polar transport capacity of auxin and PIN1 protein expression decreased, resulting in changes in the distribution pattern of leaf vascular bundle tissue and finally narrowing the leaf in nal1 [9]. NAL7 encodes a flavin monooxidase, a member of the YUCCA family, that participates in auxin synthesis to regulate the development of leaf shape. Compared with WT, the level of auxin in the nal7 is reduced, resulting in the narrowing of leaves [10]. Similarly, RML1 (RiceMinute-Like1) encodes the ribosomal large subunit protein L3B, whose main function is to regulate ribosome synthesis, auxin distribution, and transport. The loss of RML1 function leads to a loss of auxin polar transport and a decrease in vascular bundle size, resulting in a decrease in leaf width [11]. FIB (Fish Bone) encodes a tryptophan transferase that regulates the synthesis of rice auxin. The fib mutants show phenotypes such as smaller leaves, increased leaf inclination, and abnormal vascular tissue development. OsSAUR45 negatively regulates cell elongation and affects leaf morphology by inhibiting auxin synthesis and transport in rice [8].
Cell division can also affect rice leaf development. The leaves decreased cell division, decreased the number of plastid spheres in chloroplasts and thylakoid degeneration, and decreased leaf length and width in nal8 [12]. A deficiency in NAL22 function inhibits cell division, reduces the width of the vascular bundle, and leads to a decrease in leaf width [13]. OsWOX4 is involved in maintaining SAM division activity and plays a role in leaf development [14]. The absence of the gene function leads to a significant reduction in the expression levels of the CTK synthesis-related genes LOGL3 (LOG-like 3) and LOGL10, as well as in cytokinin content, which subsequently affects leaf development [15]. CKX (Cytokinin oxidase/dehydrogenase) irreversibly inactivates cytokinins. Using CRISPR/Cas9 technology, multiple mutants of the CKX family of genes were created in rice. Among them, the double mutant ckx1/ckx2-19 showed a significant increase in leaf blade width, while the single mutant osckx4-6 and the double mutant osckx4/osckx9 exhibited a significant decrease in leaf blade width. This indicates that OsCKXs influence leaf width through different regulatory mechanisms [16].
Scholars have also localized and cloned several genes associated with narrow leaves, such as srl2, avb, nrl1, nrl2, naal1, and chr729 [17,18,19,20]. The srl2 gene regulates narrow curly leaf traits and plays an important role in the regulatory pathway of leaf development on the distal axis [21]. The transcriptional activity of yabby genes is associated with leaf development and was reported to be significantly altered in the srl2. In addition, avb exhibits increased individual vascular bundle area and a reduced number of vascular bundles, resulting in a narrow leaf phenotype. Avb, which is induced by auxin, is involved in cell division maintenance, and thus, it is a conserved protein specific to land plants. The mutations in CslD1 (Cellulose Synthase-Like D1) resulted in a decrease in the number of cells and an increase in the cell width of maize leaves, but the leaf width was still reduced compared with WT leaves [22,23,24,25,26,27].
In this study, EMS mutagenesis of variety BTX623 was utilized to obtain nal6. Functional annotation, enrichment analysis, and key gene mining were performed on the sword leaves of WT and nal6 at the flowering stage. This study aims to provide a theoretical basis for research on the molecular mechanism of narrow leaf traits in sorghum and cultivating ideal plant types [28,29].

2. Materials and Methods

2.1. Materials

The nal6 sorghum mutant was derived from the inbred variety BTX623 by chemical mutagenesis with 0.1% EMS [30]. The mutagenized seeds were planted at the Scientific Research Experimental Base of Liaoning Academy of Agricultural Sciences (42°11′51″ N, 123°25′9″ E, 47 m). The M1 generation was retained as a single plant, and nal6 with narrow leaves was identified in the M2 population. The nal6 gene was stably inherited with the narrow leaf trait after three years of continuous self-crossing. Sword leaves were selected for transcriptome analysis during the flowering period.

2.2. Methods

2.2.1. Morphological Investigation of Sorghum Mutant and Analytical Stoma

The nal6 and WT plants were sown in May 2023 at the experimental field of the Liaoning Academy of Agricultural Sciences, Shenyang, Liaoning Province, China. Randomized blocks with three replications were used to investigate the leaf length, leaf width, and plant height traits in the nal6 and WT by selecting uniformly growing, healthy, disease-free, and pest-free plants at the three-leaf stage, five-leaf stage, flowering stage, and maturity, respectively, with 10 replications.
A total of 10 plants from the nal6 and WT sorghum were selected at the flowering stage, respectively. For each plant, we selected the sword leaves and applied transparent nail polish evenly on the abaxial surface, avoiding the leaf veins. After naturally drying the leaves for 0.5 h, the epidermis was gently torn off, and temporary slices were made [31]. Images of the slices were taken under a light microscope (Leica DM3000, Mannheim, Germany), and the number of epidermal cells and stomata were counted in 3 randomly selected fields of view. The stomatal density was then calculated as follows:
Stomatal density = number of pores/total area.

2.2.2. RNA Extraction, cDNA Library Construction, and Sequencing

During the flowering stage, the sword leaves of the nal6 and WT plants were sampled and immediately placed in a liquid nitrogen container for transcriptome sequencing. Total RNA was extracted using the TRizol (Invitron) method, and the purity and concentration of RNA were measured using an ultraviolet–visible spectrophotometer (Thermo NDC2000, Wilmington, NC, USA). Qualified RNA was enriched for mRNA with a PolyA tail using Oligo (dT) magnetic beads. mRNA was fragmented using a fragmentation buffer, and the fragmented RNA was used as a template to synthesize the first-strand cDNA with random primers. Double-stranded cDNA was synthesized using dNTPs (dUTP, dATP, dGTP, and dCTP) and DNA polymerase I. After purification of the double-stranded cDNA, end repair was performed, followed by A-tailing, adapter ligation, and PCR enrichment to obtain cDNA libraries [32].
Three biological replicates were implemented for each sample, denoted as WT-1, WT-2, and WT-3 for the WT and nal6-1, nal6-2, and nal6-3 for the nal6. Library quality testing was then performed. After the cDNA was qualified by quality testing, different libraries were pooled according to the target number of downstream machines and sequenced on an Illumina HiSeq platform (Illumina Inc., San Diego, CA, USA).

2.2.3. Alignment of Sequencing Data with the Reference Genome Sequence

Raw data obtained from the Illumina HiSeq sequencing platform were subjected to quality control and filtering to obtain clean reads. The clean reads were then aligned to the reference genome sequence from the Phytozome database using the HISAT2 short sequence alignment tool. This obtains information about the position of sequenced fragments on the reference genome, as well as characteristic information of individual sequences of sequenced samples.

2.2.4. Gene Expression Quantification and Differential Gene Screening

The number of reads for each gene was counted based on the comparison results and the position information of the gene on the reference genome. The fragments per kilobase of transcript per million fragments mapped (FPKM) was used as a measure of transcript or gene expression level by normalizing the number of mapped reads and transcript length in the samples [33]. Pearson’s correlation was used to assess the biological repeat correlations, and the significance of the two samples was analyzed using DESeq2 1.42.0. The DESeq2 1.42.0 package is available at http://www.bioconductor.org/packages/release/bioc/html/DESeq2.html (accessed on 14 March 2024) [34]. The false discovery rate (FDR) was then determined. The FDR values of DEGs were considered significant if |log2Fold Change| ≥ 1 and FDR < 0.05 [35,36].

2.2.5. Real-Time PCR Analysis

Primers for PCR sequence-specific oligonucleotides were designed via the primer designing tool from https://www.ncbi.nlm.nih.gov/tools/primer-blast/index.cgi?LINK_LOC=BlastHome (accessed on 24 June 2024), with actin used as an internal reference gene. The primers used are listed in Table 1 and were synthesized by Beijing Kinko Bio Co. (Beijing, China). Total RNA was extracted using the TRizol method. The TaKaRa reverse transcription kit (Prime Script RT reagent kit with gDNA Eraser, Dalian, China) was used to obtain the cDNA, and the SYBR kit (Power SYBR Green PCR Master Mix, Dalian, China) was employed for fluorescence quantitative PCR tests [37].
The qRT-PCR system specifications were as follows: DNA 0.5 μL; SYBR Green PCR Master Mix enzyme 5 μL; and ddH2O 4.1 μL. The PCR program was as follows: pre-denaturation at 95 °C for 1 min; denaturation at 95 °C for 5 s, annealing at 58 °C for 25 s, extension at 72 °C for 18 s, 50 cycles; 72 °C for 10 min [38,39]. These data were analyzed using the 2−ΔΔCt method and plotted with GraphPad Prism 9.0.

2.2.6. Data Statistics and Analysis

The MetWare Cloud platform (https://cloud.metware.cn/, accessed on 13 May 2024) was employed for the KEGG pathway enrichment analysis of DEGs. Statistical analysis and visualization of the samples (with three biological replicates each) were performed using GraphPad Prism 10.2 software.

3. Results and Analysis

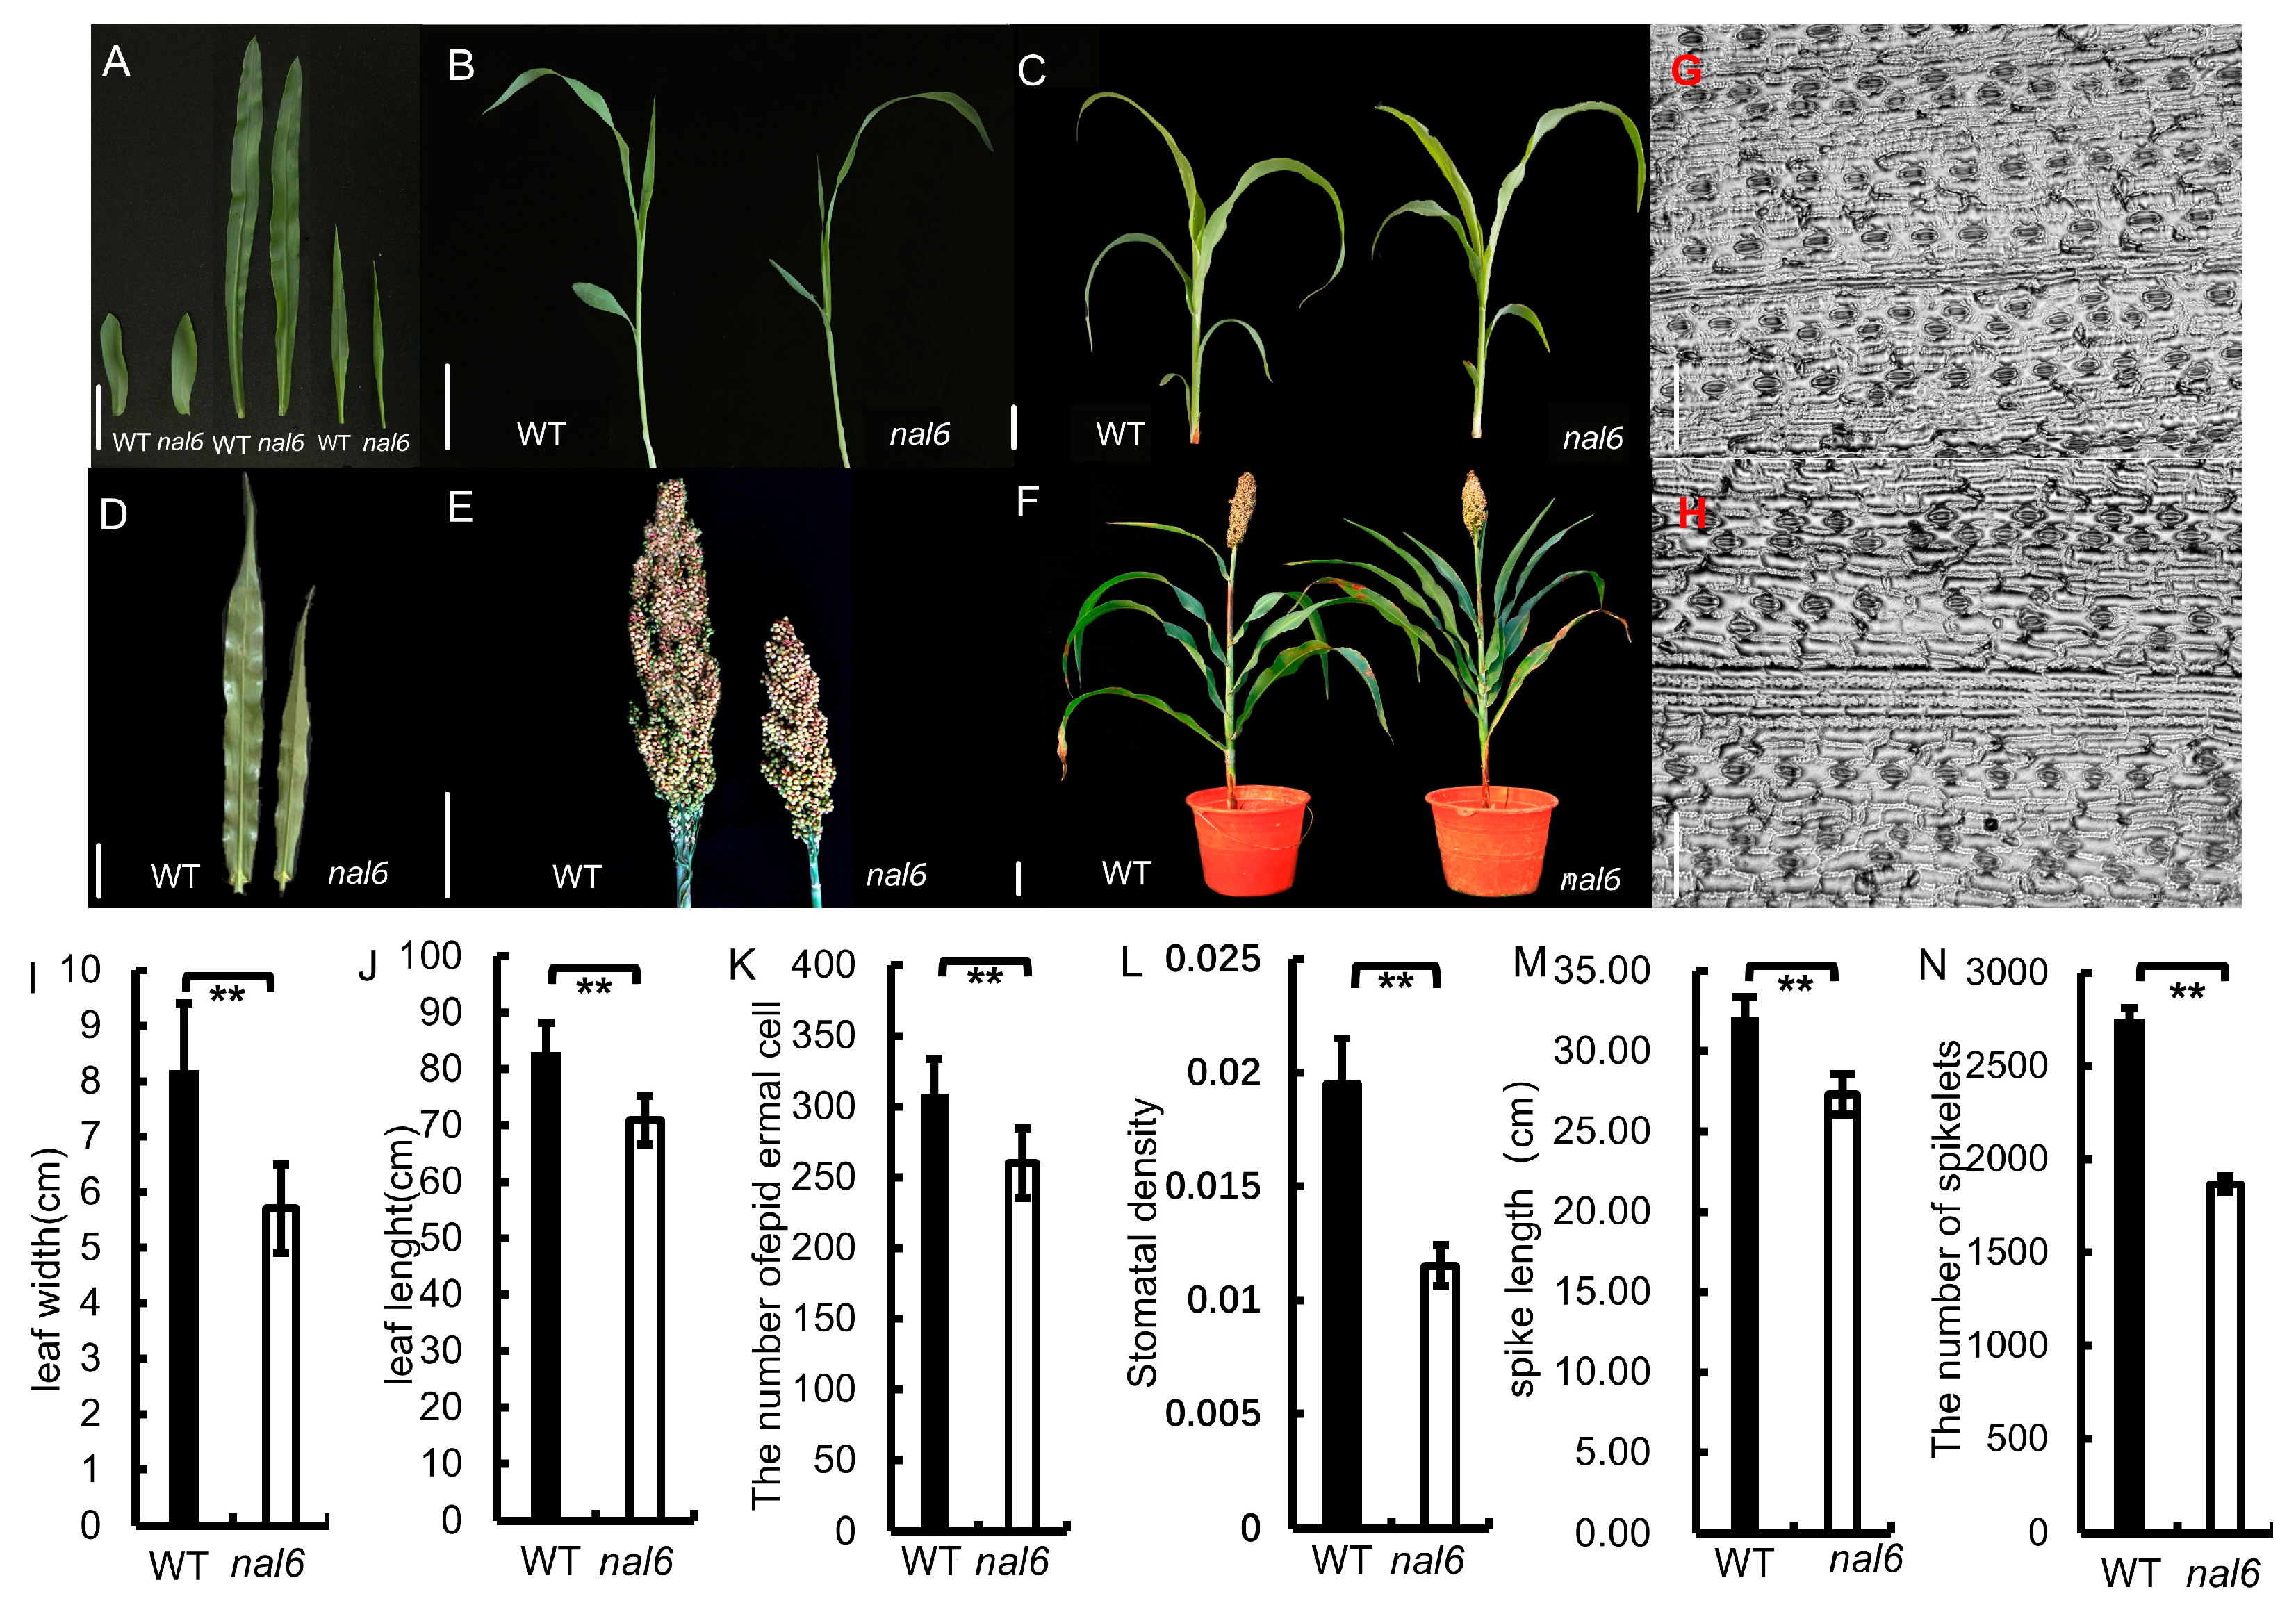
3.1. Phenotypic Characterization of the nal6 and Stomatal Density Analysis

The nal6 is obtained by 0.1% EMS mutagenesis from seeds of the sorghum maintenance line BTx623, which was self-crossed in successive generations in Shenyang and Hainan. Compared with WT, the second leaf of nal6 plants began to narrow (Figure 1A) while showing no significant difference in plant height (Figure 1B). During subsequent development, no marked change in plant height was observed between nal6 and WT at the five-leaf stage. However, nal6 leaves displayed reductions in both length and width, along with decreased leaf angles compared with WT (Figure 1C). At the heading stage, the sword leaves of nal6 showed significant reductions in both length and width compared with WT sword leaves (Figure 1D,I,J). Concurrently, the epidermal cell number and stomatal density in nal6 sword leaves were significantly lower than those in WT (Figure 1G,H,K,L), suggesting that the leaf narrowing phenotype might result from abnormal cell division in leaf tissues. During the maturation phase, nal6 demonstrated significantly shorter panicles and fewer grains per panicle compared with WT (Figure 1E,F,M,N), while showing no significant differences in 1000-grain weight or final plant height (Supplementary Figure S1A,B) [40,41,42,43,44].

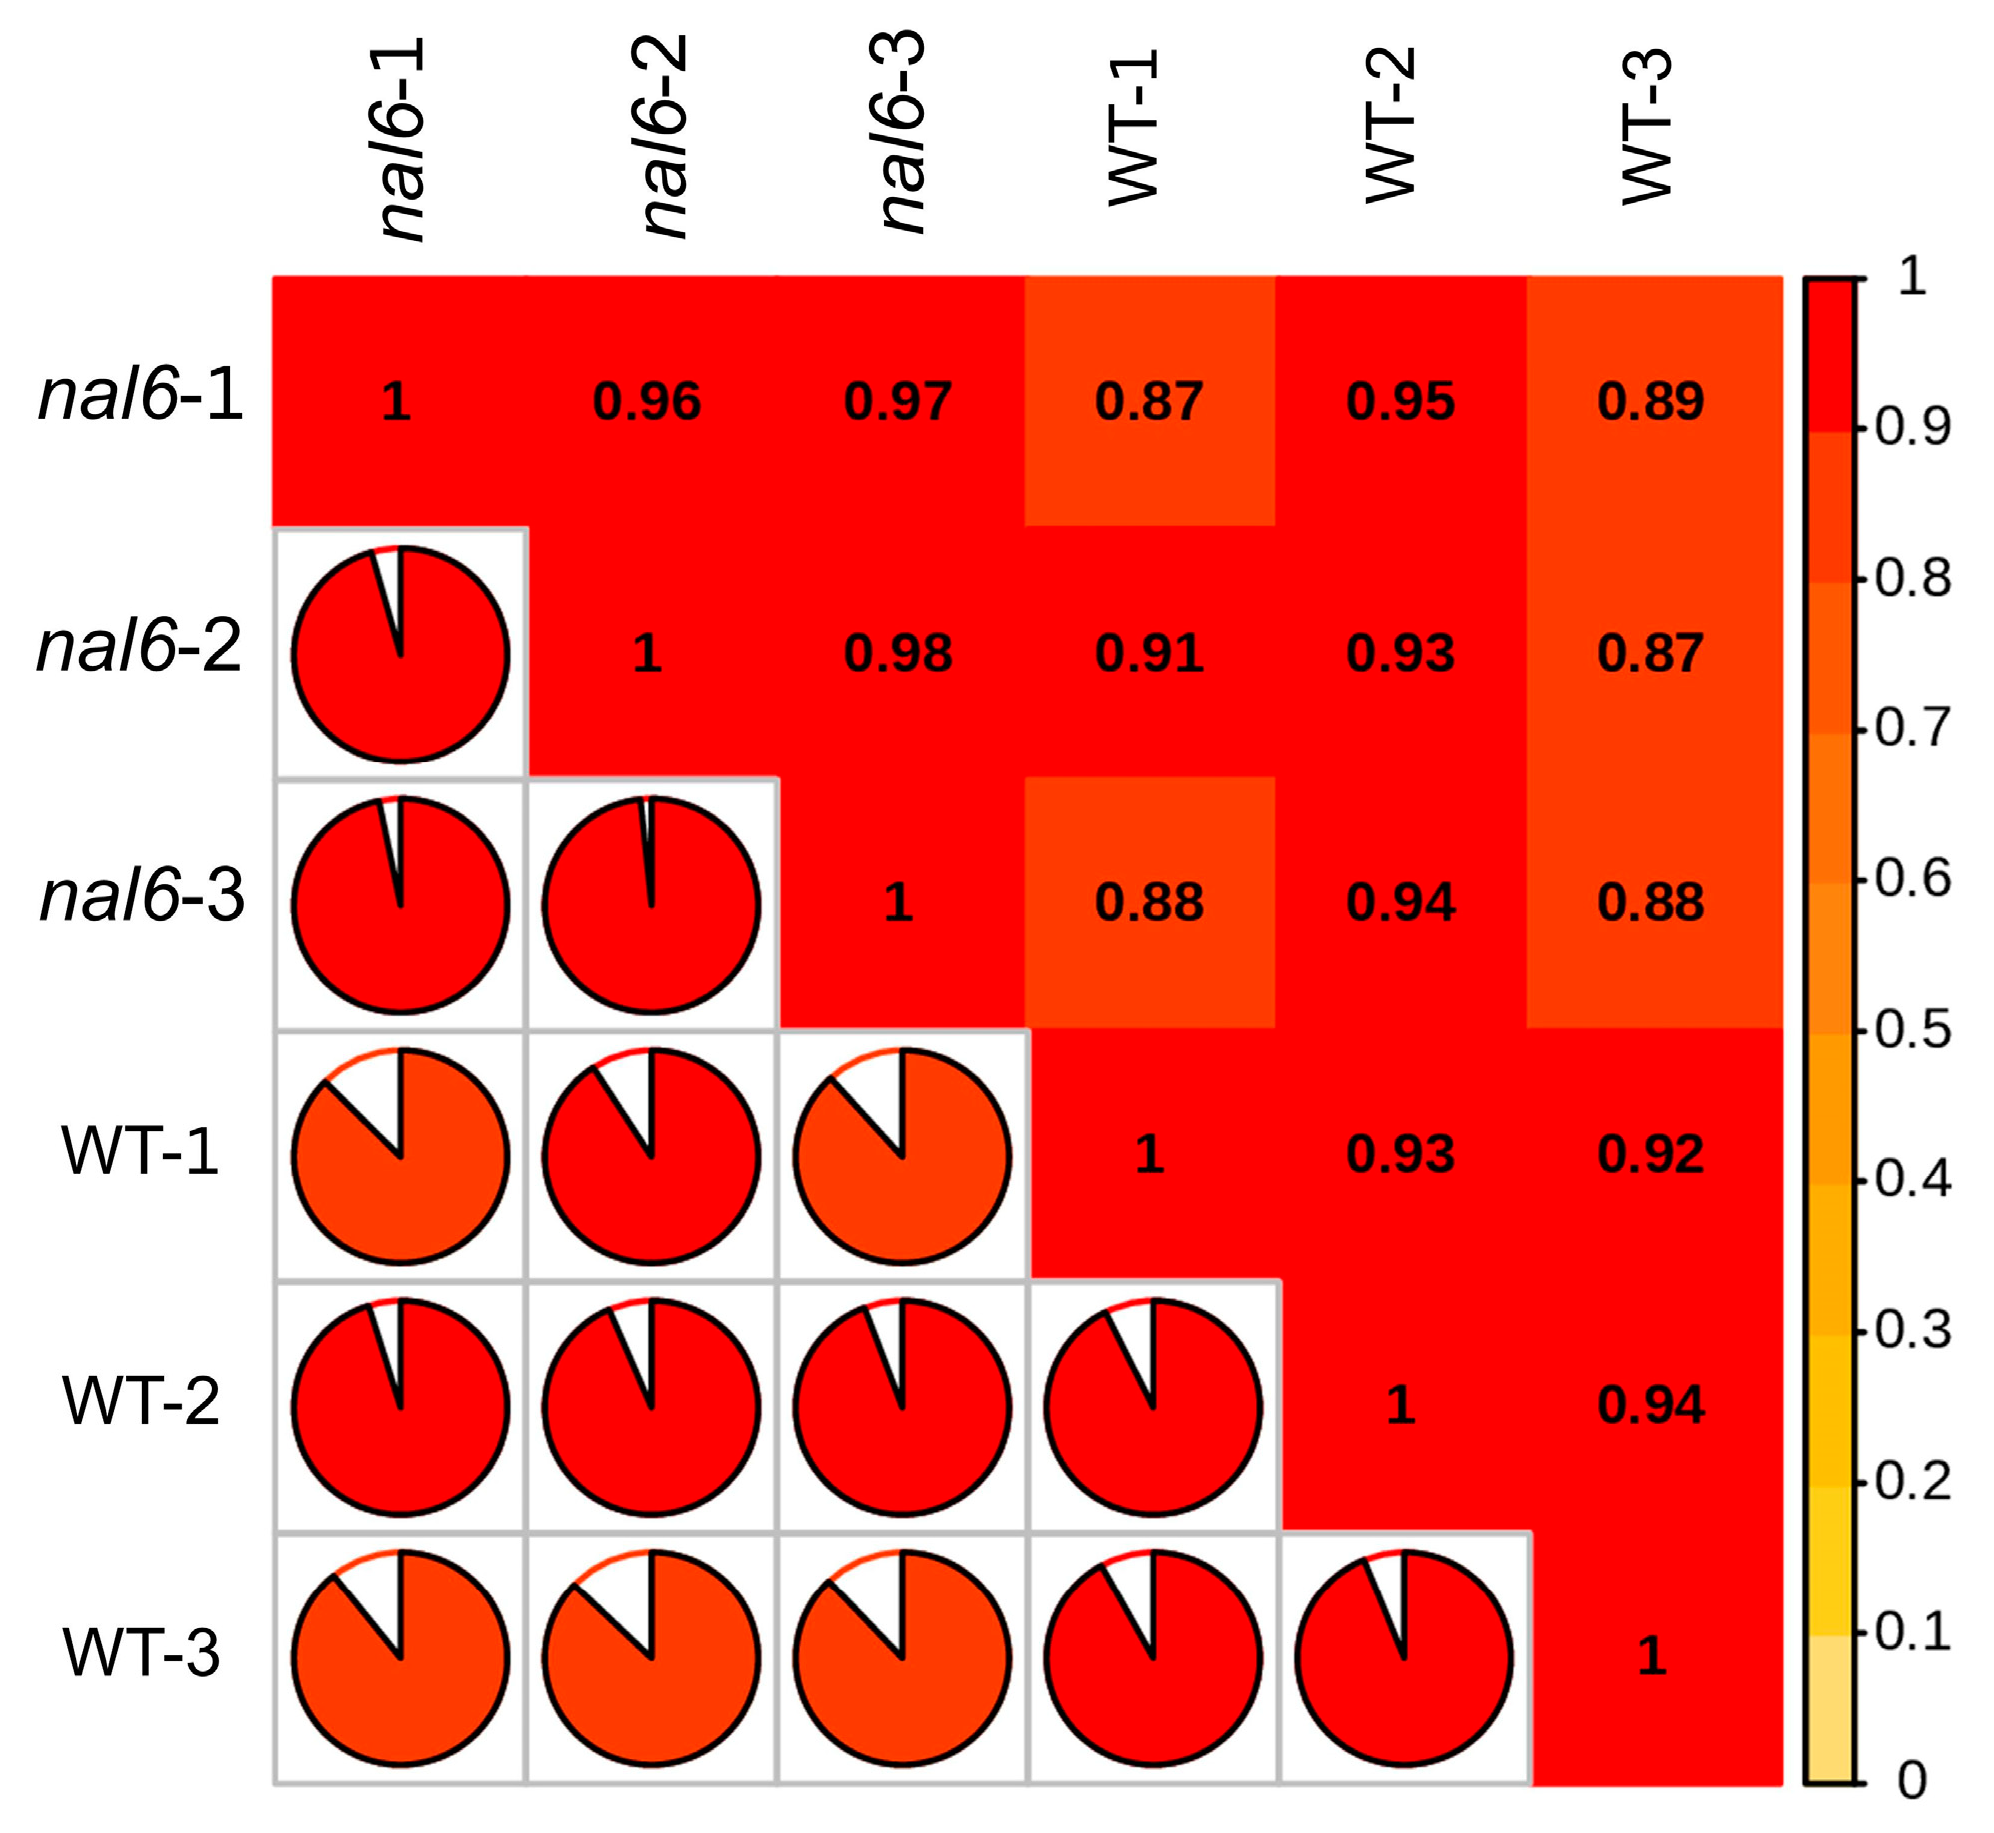
3.2. Comparison and Analysis of Transcriptome Data

Six cDNA libraries were constructed using nal6 and WT. After quality control and filtering, a total of 3.18 G clean reads were obtained. The clean reads for each sample reached more than 96% of the number of reads in these raw data; the total number of bases in the obtained high-quality reads amounted to 48.07 Gb, and the percentage of the Q30 bases exceeded 94%.
The clean reads of each sample were compared with the respective reference genome sequence. The efficiency of the comparison between the clean reads of each sample and the reference genome was more than 96.4%, and the number of reference genome reads on the unique comparison accounted for more than 94.2% of the clean reads.
The Pearson correlation coefficient was used to assess the correlation between biological replicates, with correlations and the R2 value being at least greater than 0.8. The R2 value between the six samples exceeded 0.8, with the strongest correlation observed between nal6-2 and nal6-3 (R2 = 0.98). The R2 values between samples nal6-1 and WT-1 and between samples nal6-2 and WT-3 were the lowest among the 15 comparator groups at 0.87. The results indicate high transcriptome sequencing quality and strong sample correlations (Figure 2).

3.3. DEG Selection, Functional Annotation, and Enrichment Analysis

3.3.1. DEG Statistical Screening

We screened the DEGs between the leaves of the WT and nal6 at flowering. A total of 1520 DEGs were screened, with the number of up and downregulated expressed genes determined to be 767 and 753, respectively (Figure 3 and Supplementary Figures S2 and S3).

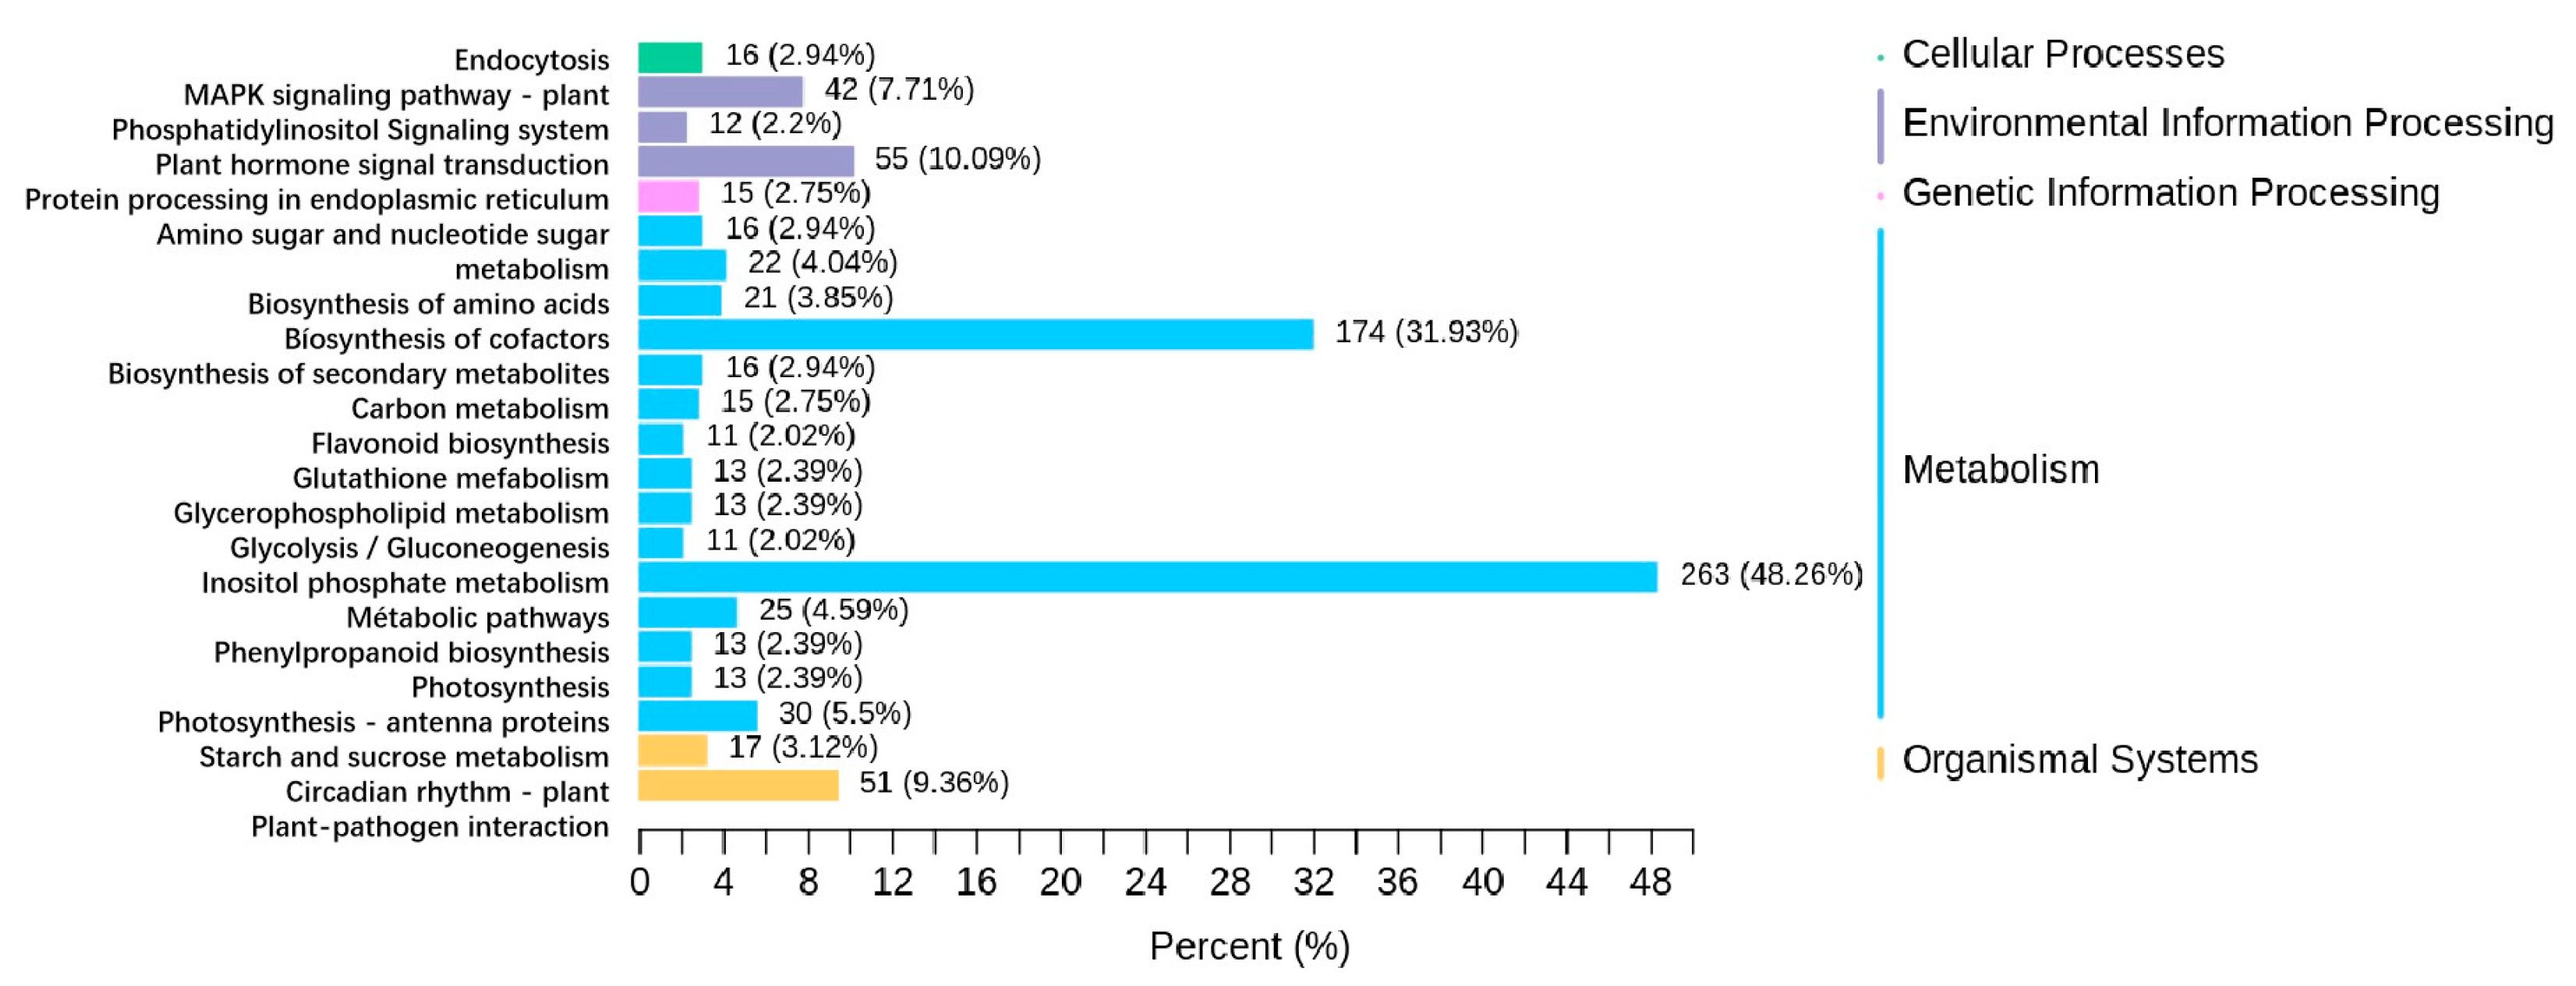
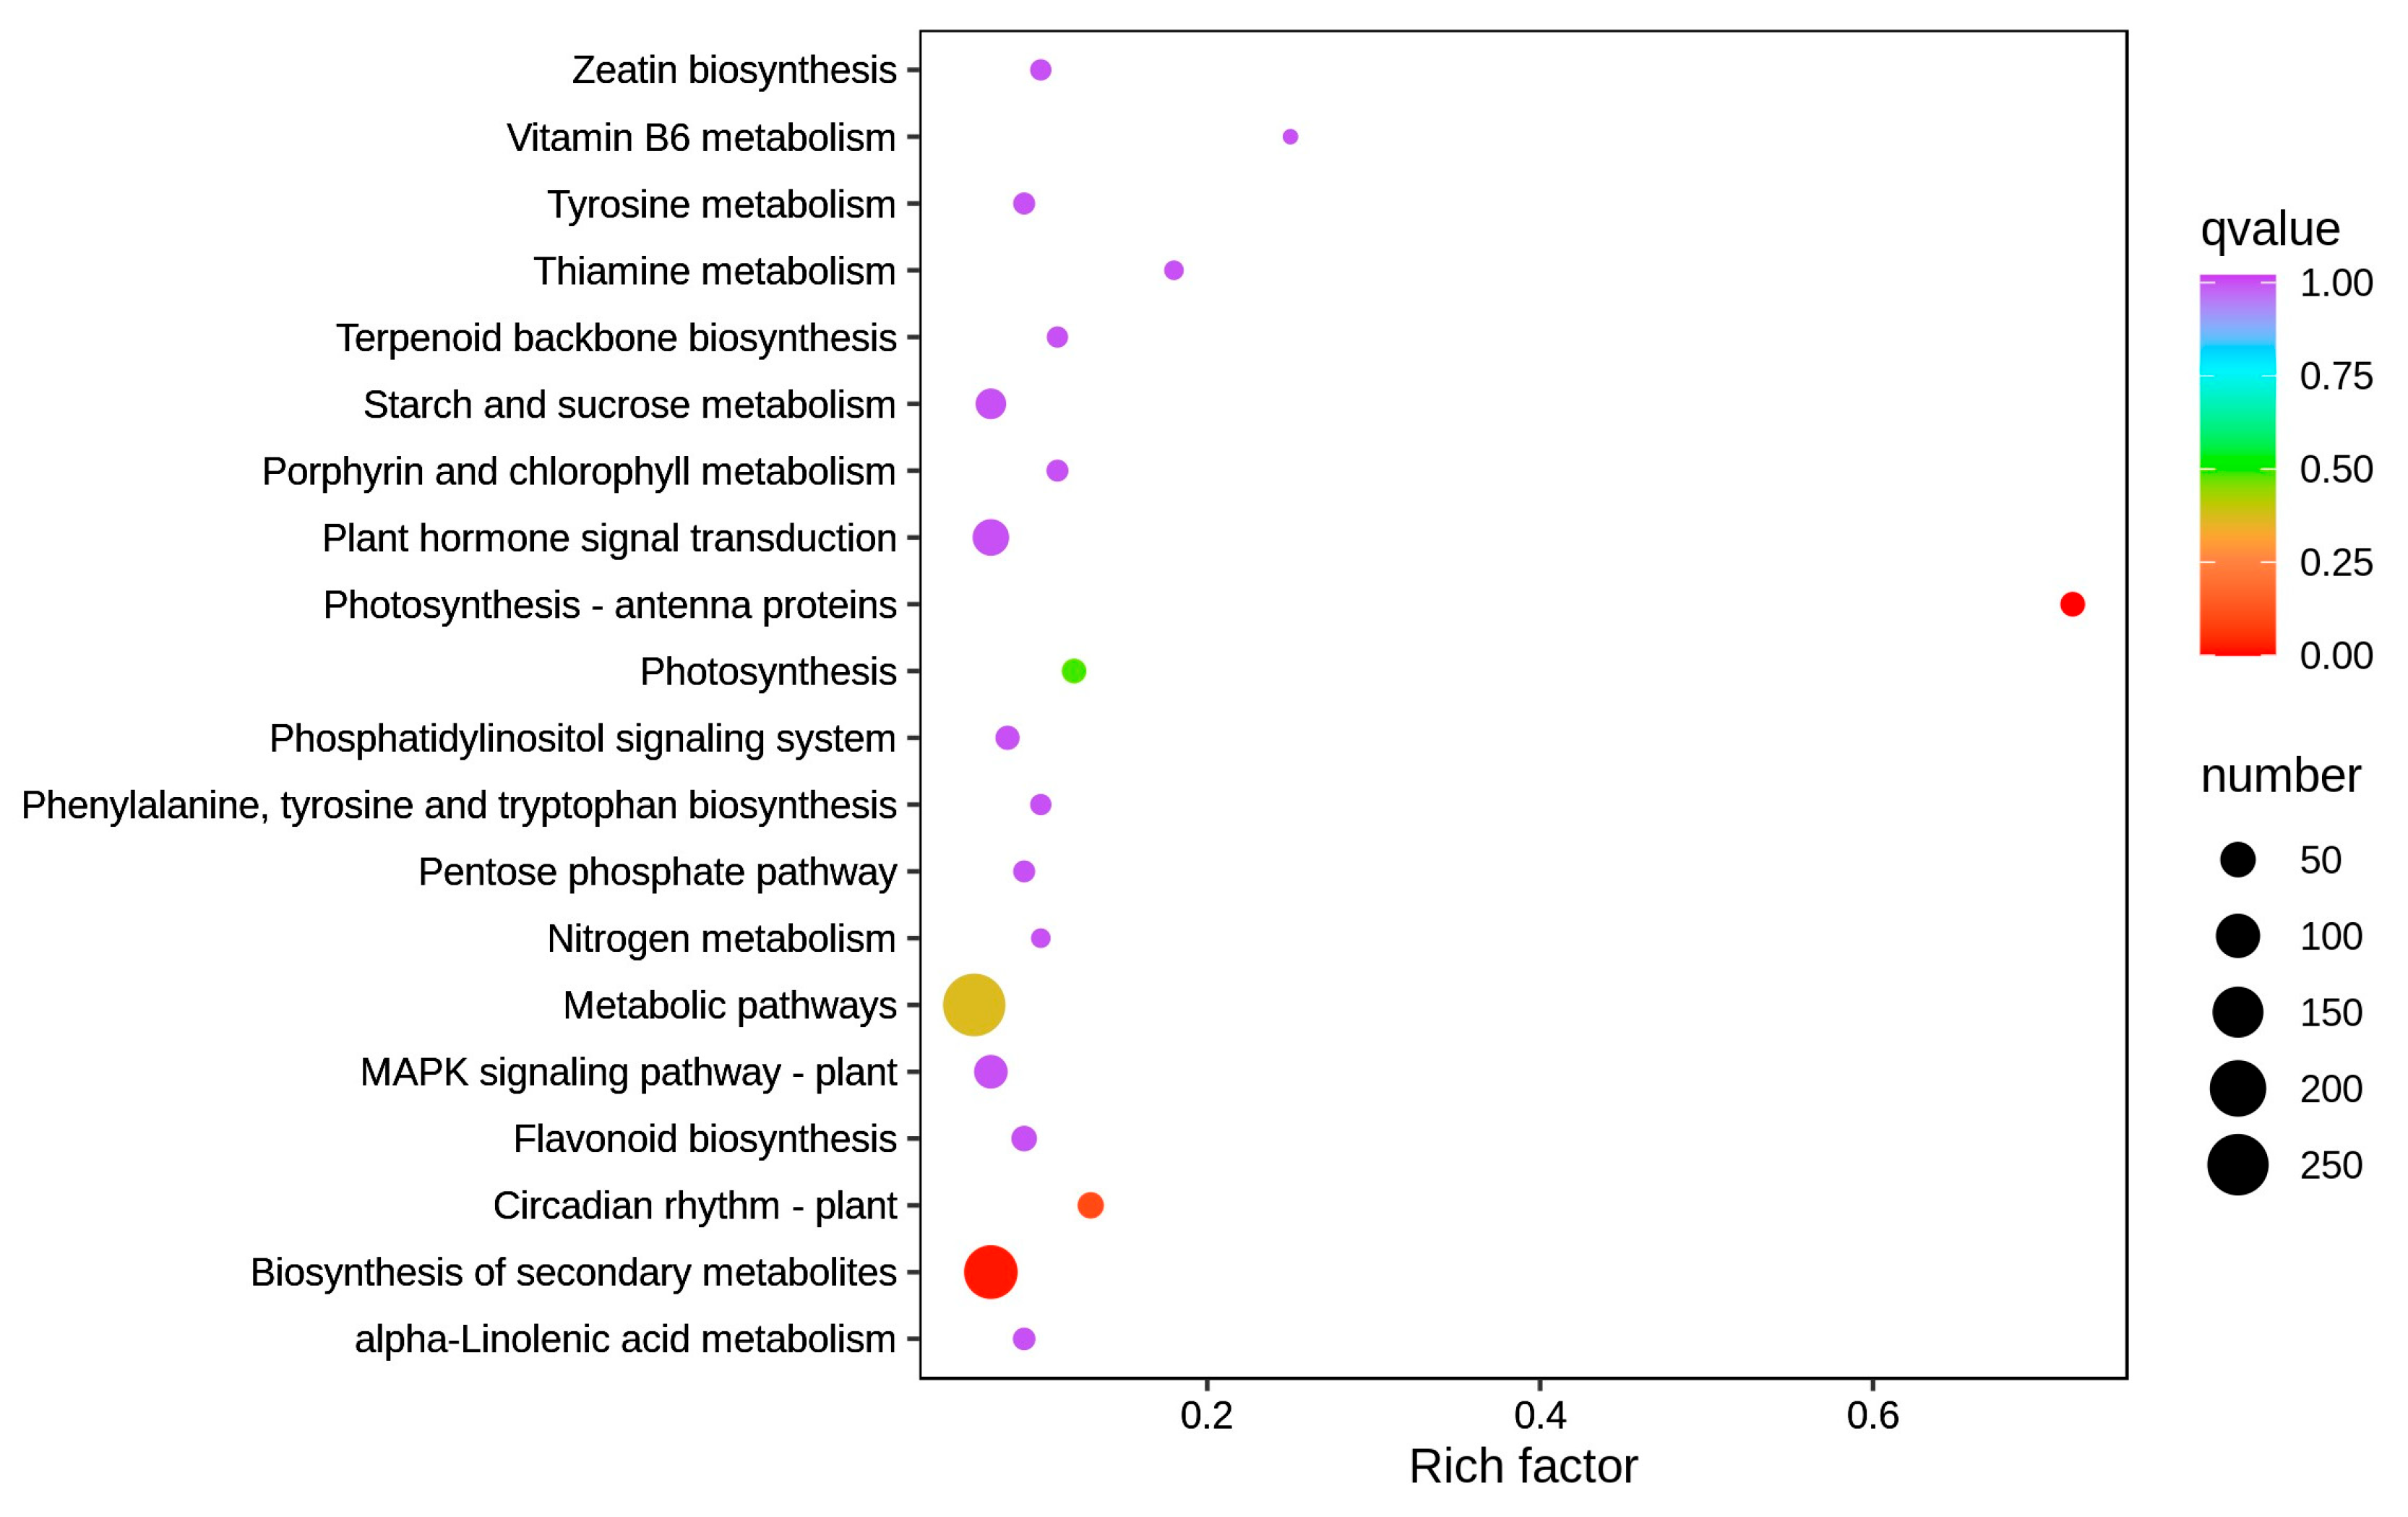
3.3.2. KEGG Annotation and Enrichment Analysis of DEGs

The annotation and enrichment analysis of the KEGG pathway of 1520 DEGs from the nal6 and WT comparator groups showed that 545 of these genes were annotated, and the annotated genes were enriched into 124 KEGG pathways. Among them, a total of 11 pathways were enriched, including metabolic pathways, biosynthesis of secondary metabolites, flavonoid biosynthesis, and plant hormone signal transduction. In particular, 263 DEGs were annotated to metabolic pathways, accounting for 48.26% of the total annotated DEGs, 174 DEGs were annotated to secondary metabolite biosynthesis pathways, accounting for 31.93% of the total annotated DEGs, and 55 DEGs were annotated to the plant hormone signal transduction pathway, accounting for 10.09% of the total number of annotated DEGs (Figure 4).
The annotated 545 DEGs were subjected to KEGG pathway enrichment analysis, and the DEGs were significantly enriched into photosynthesis–antenna proteins, biosynthesis of secondary metabolites, and two other pathways (p < 0.05). Among them, the biosynthesis of secondary metabolites was less enriched, but it was enriched to a higher number of differential genes. This may be attributed to a larger base of DEGs enriched in the pathways (Figure 5).

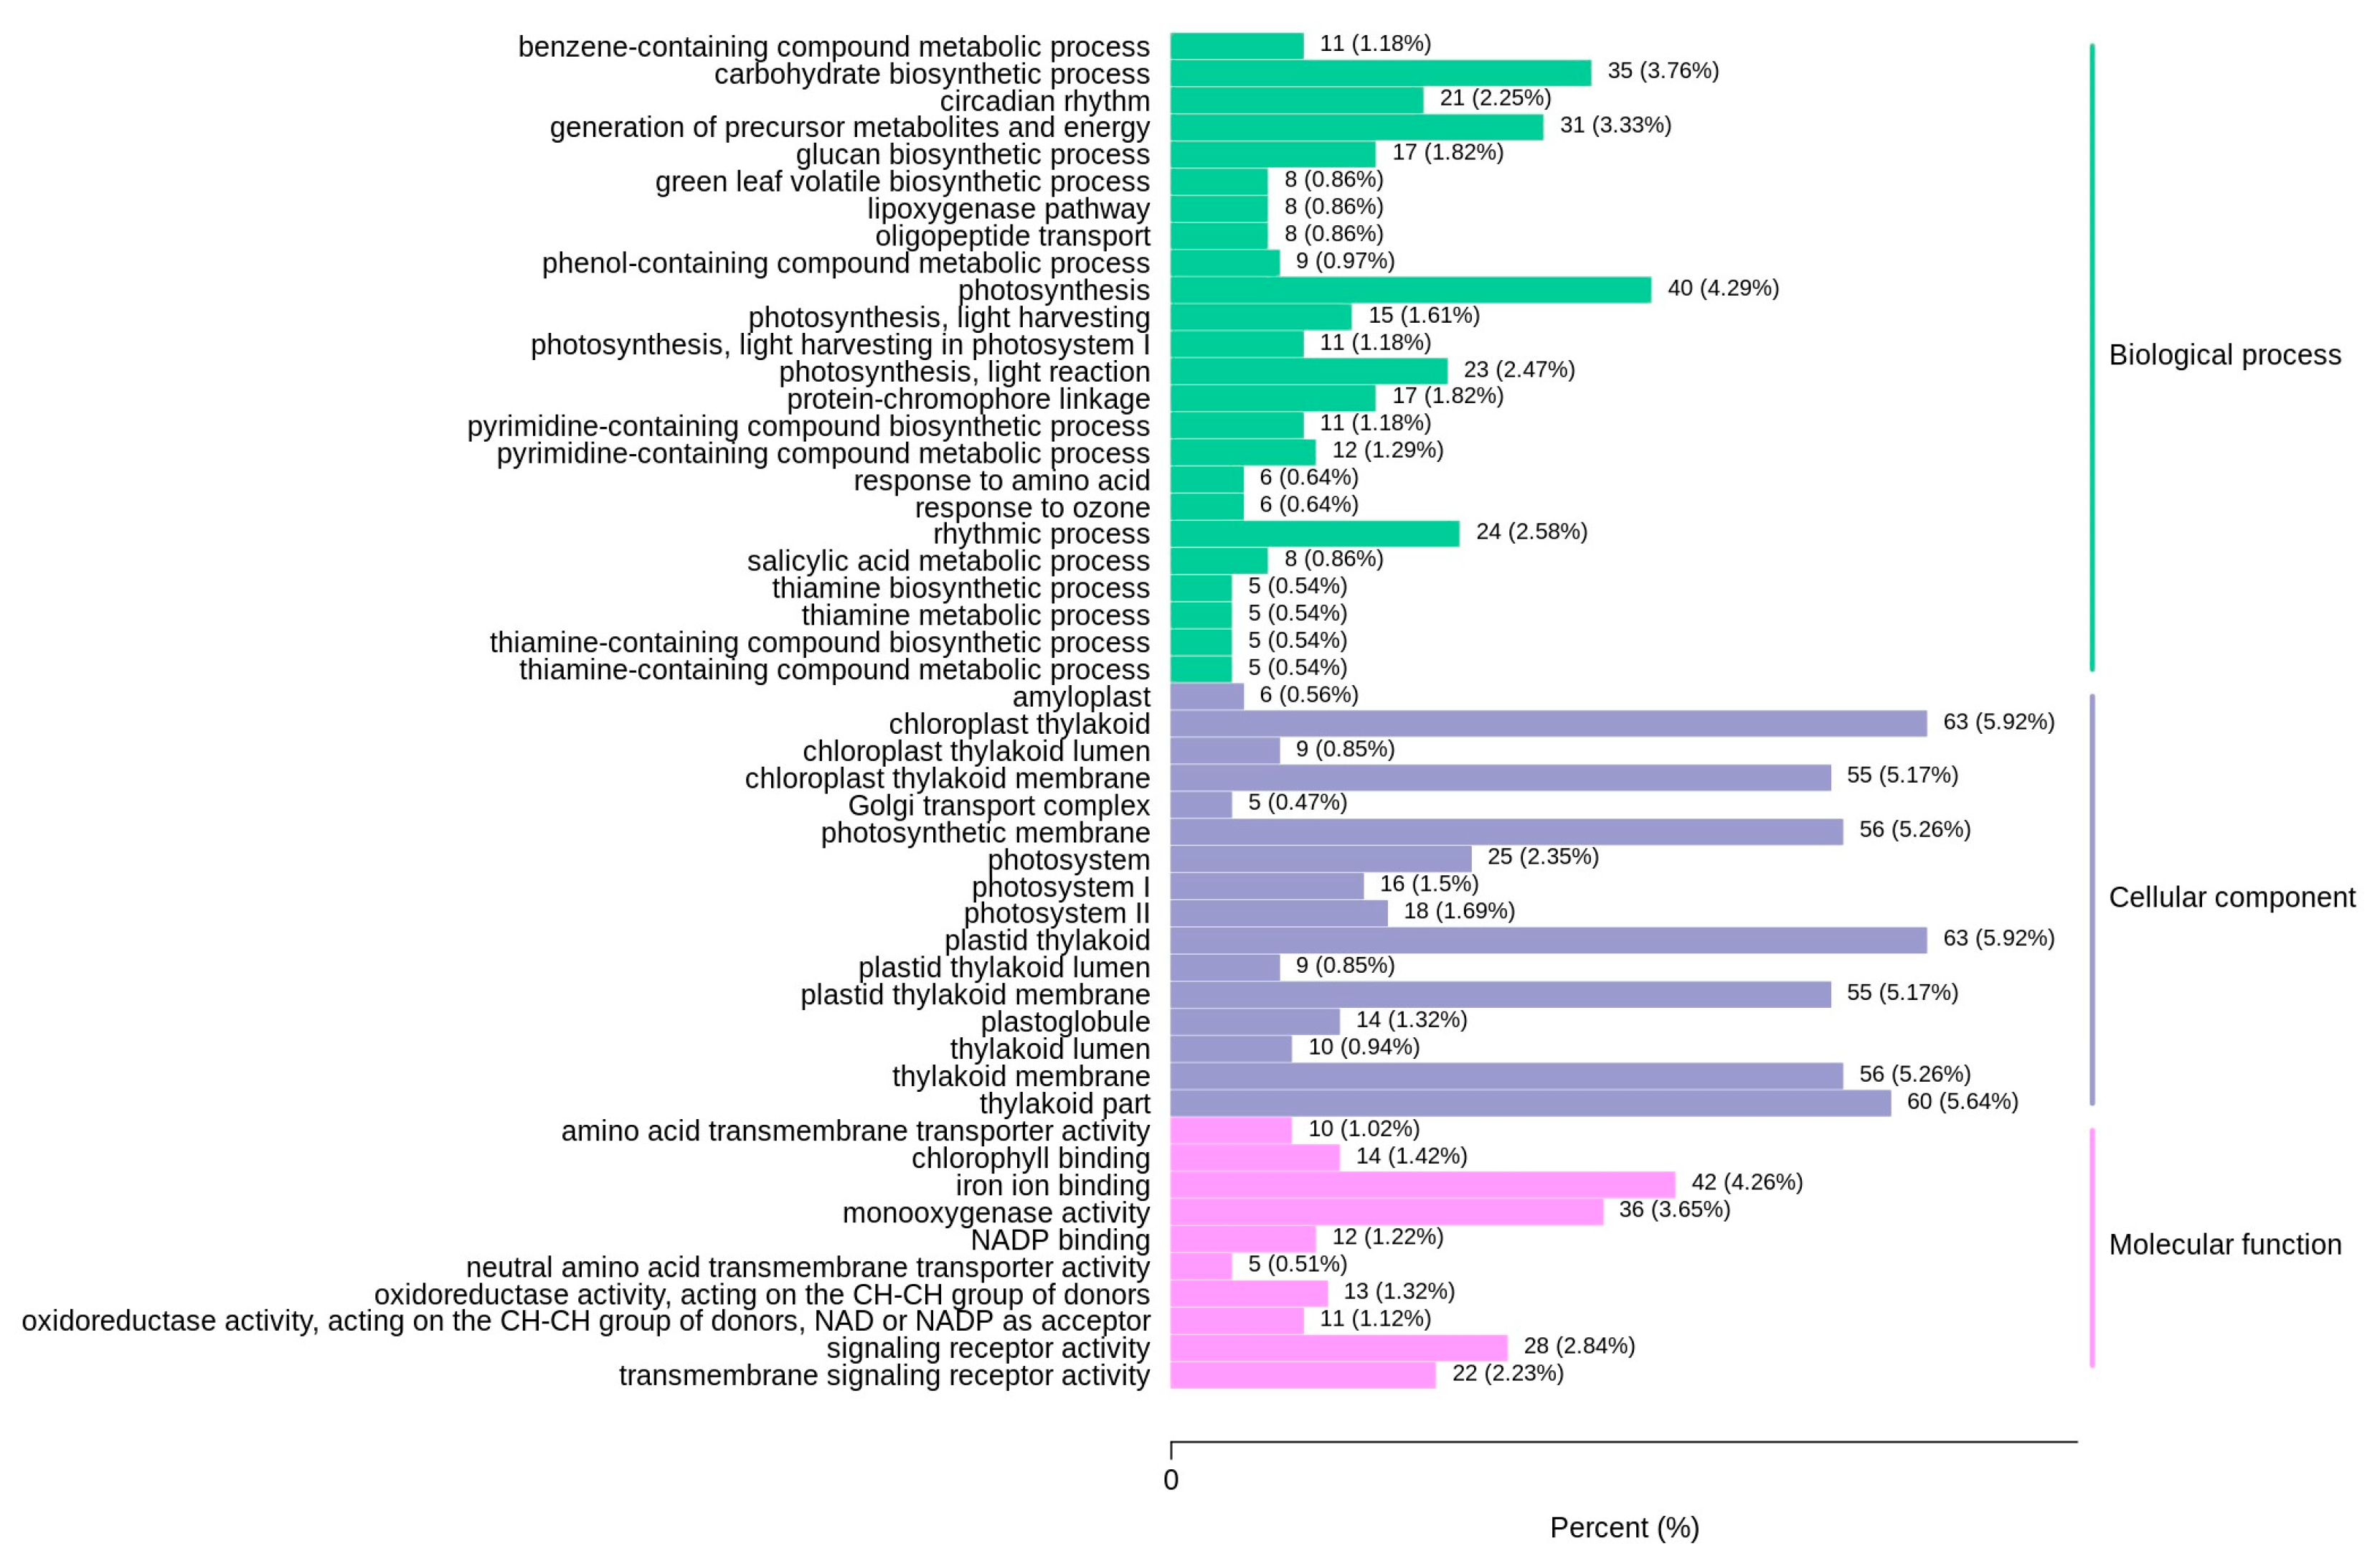
3.3.3. GO Classification and Enrichment Analysis of DEGs

To characterize the distribution of DEGs between nal6 and WT during the flowering stage, GO functional annotation and enrichment analysis were performed on the 1520 DEGs to determine their important biological functions. The genes that received annotations were mainly found in 53 GO items. The three types of annotations, namely, cellular components, molecular function, and biological processes, accounted for 51%, 30%, and 19%, respectively (Figure 6). The GO terms significantly enriched in DEGs were identified by GO-term significant enrichment analysis. In terms of cellular components, DEGs were significantly enriched in chloroplast thylakoid, plastid thylakoid, thylakoid, and membrane structures related to photosynthesis. In molecular function, DEGs were significantly enriched in iron ion binding, monooxygenase activity, and signaling receptor activity. The significant enrichment of DEGs in biological processes was observed in three GO entries: photosynthesis, carbohydrate biosynthetic process, and the generation of precursor metabolites and energy (Figure 7).

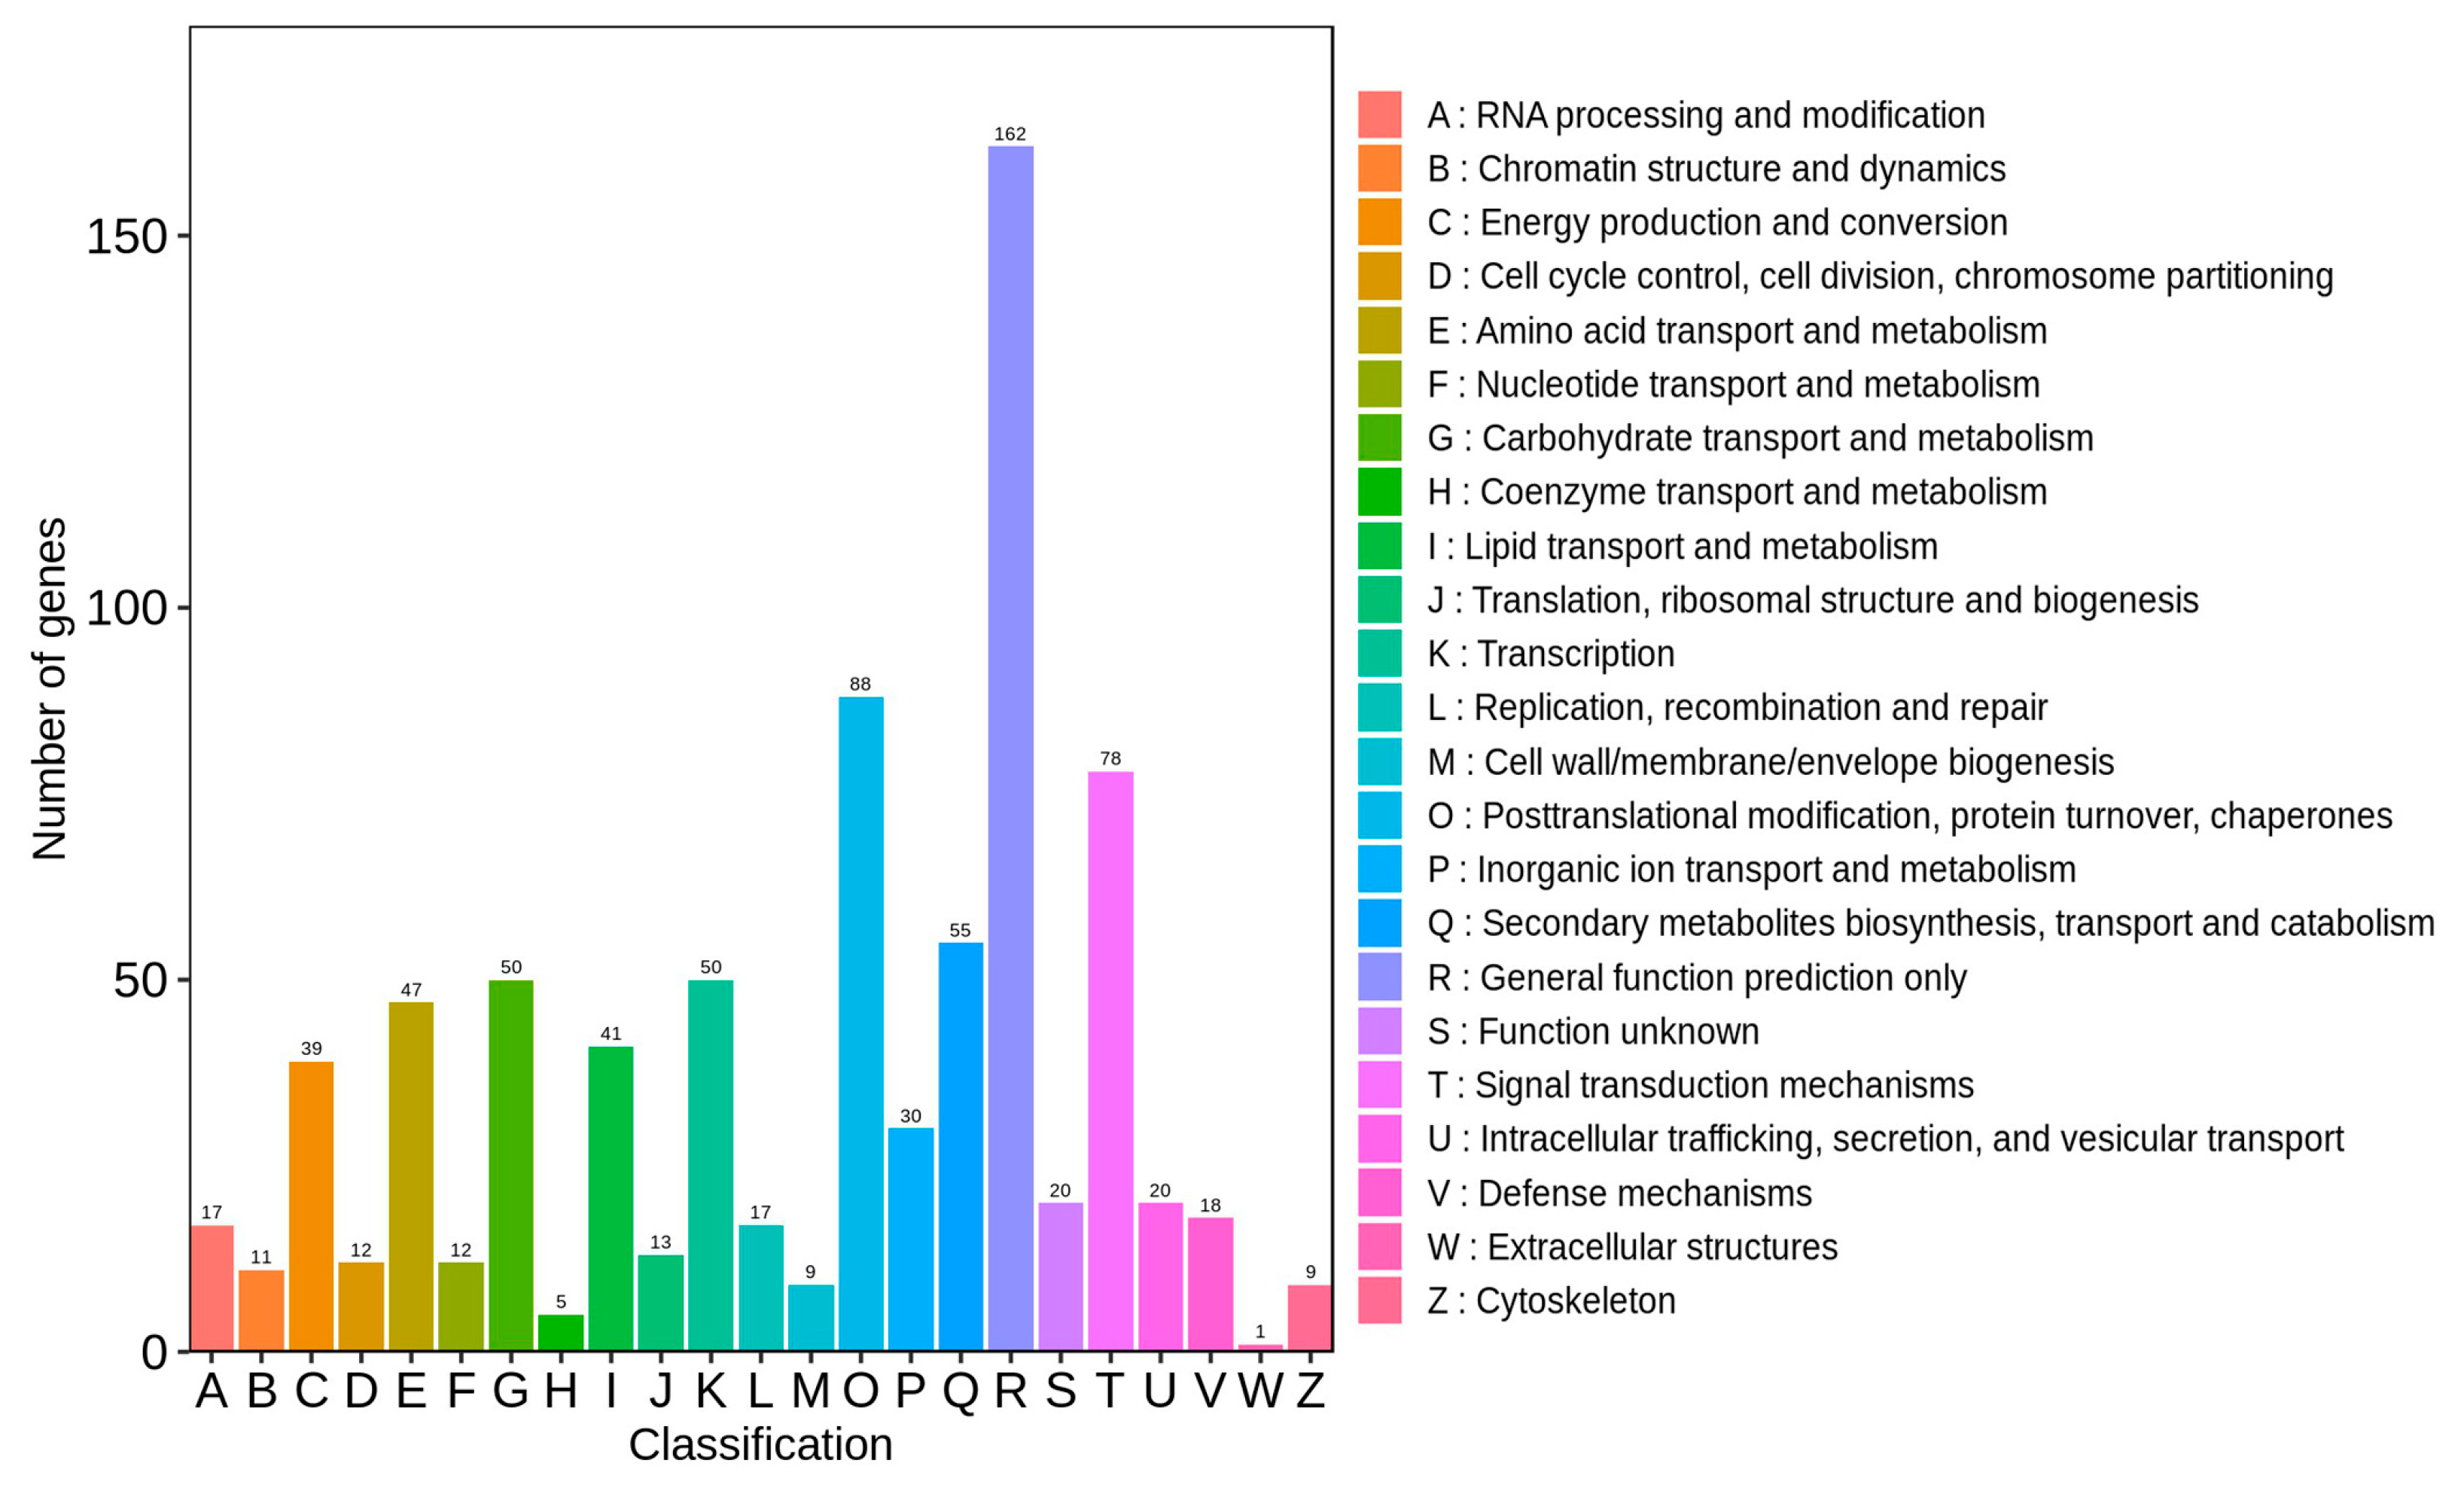
3.3.4. KOG Classification and Enrichment Analysis of DEGs

The DEGs were mainly concentrated in posttranslational modification, protein turnover, chaperones, signal transduction mechanisms, secondary metabolites biosynthesis, transport and catabolism, carbohydrate transport and catabolism, carbohydrate transport and metabolism, secondary metabolites biosynthesis, transport and catabolism, carbohydrate transport and metabolism, transcriptional modification, protein turnover, chaperones, metabolism, transcription, and amino acid transport and metabolism (Figure 8).

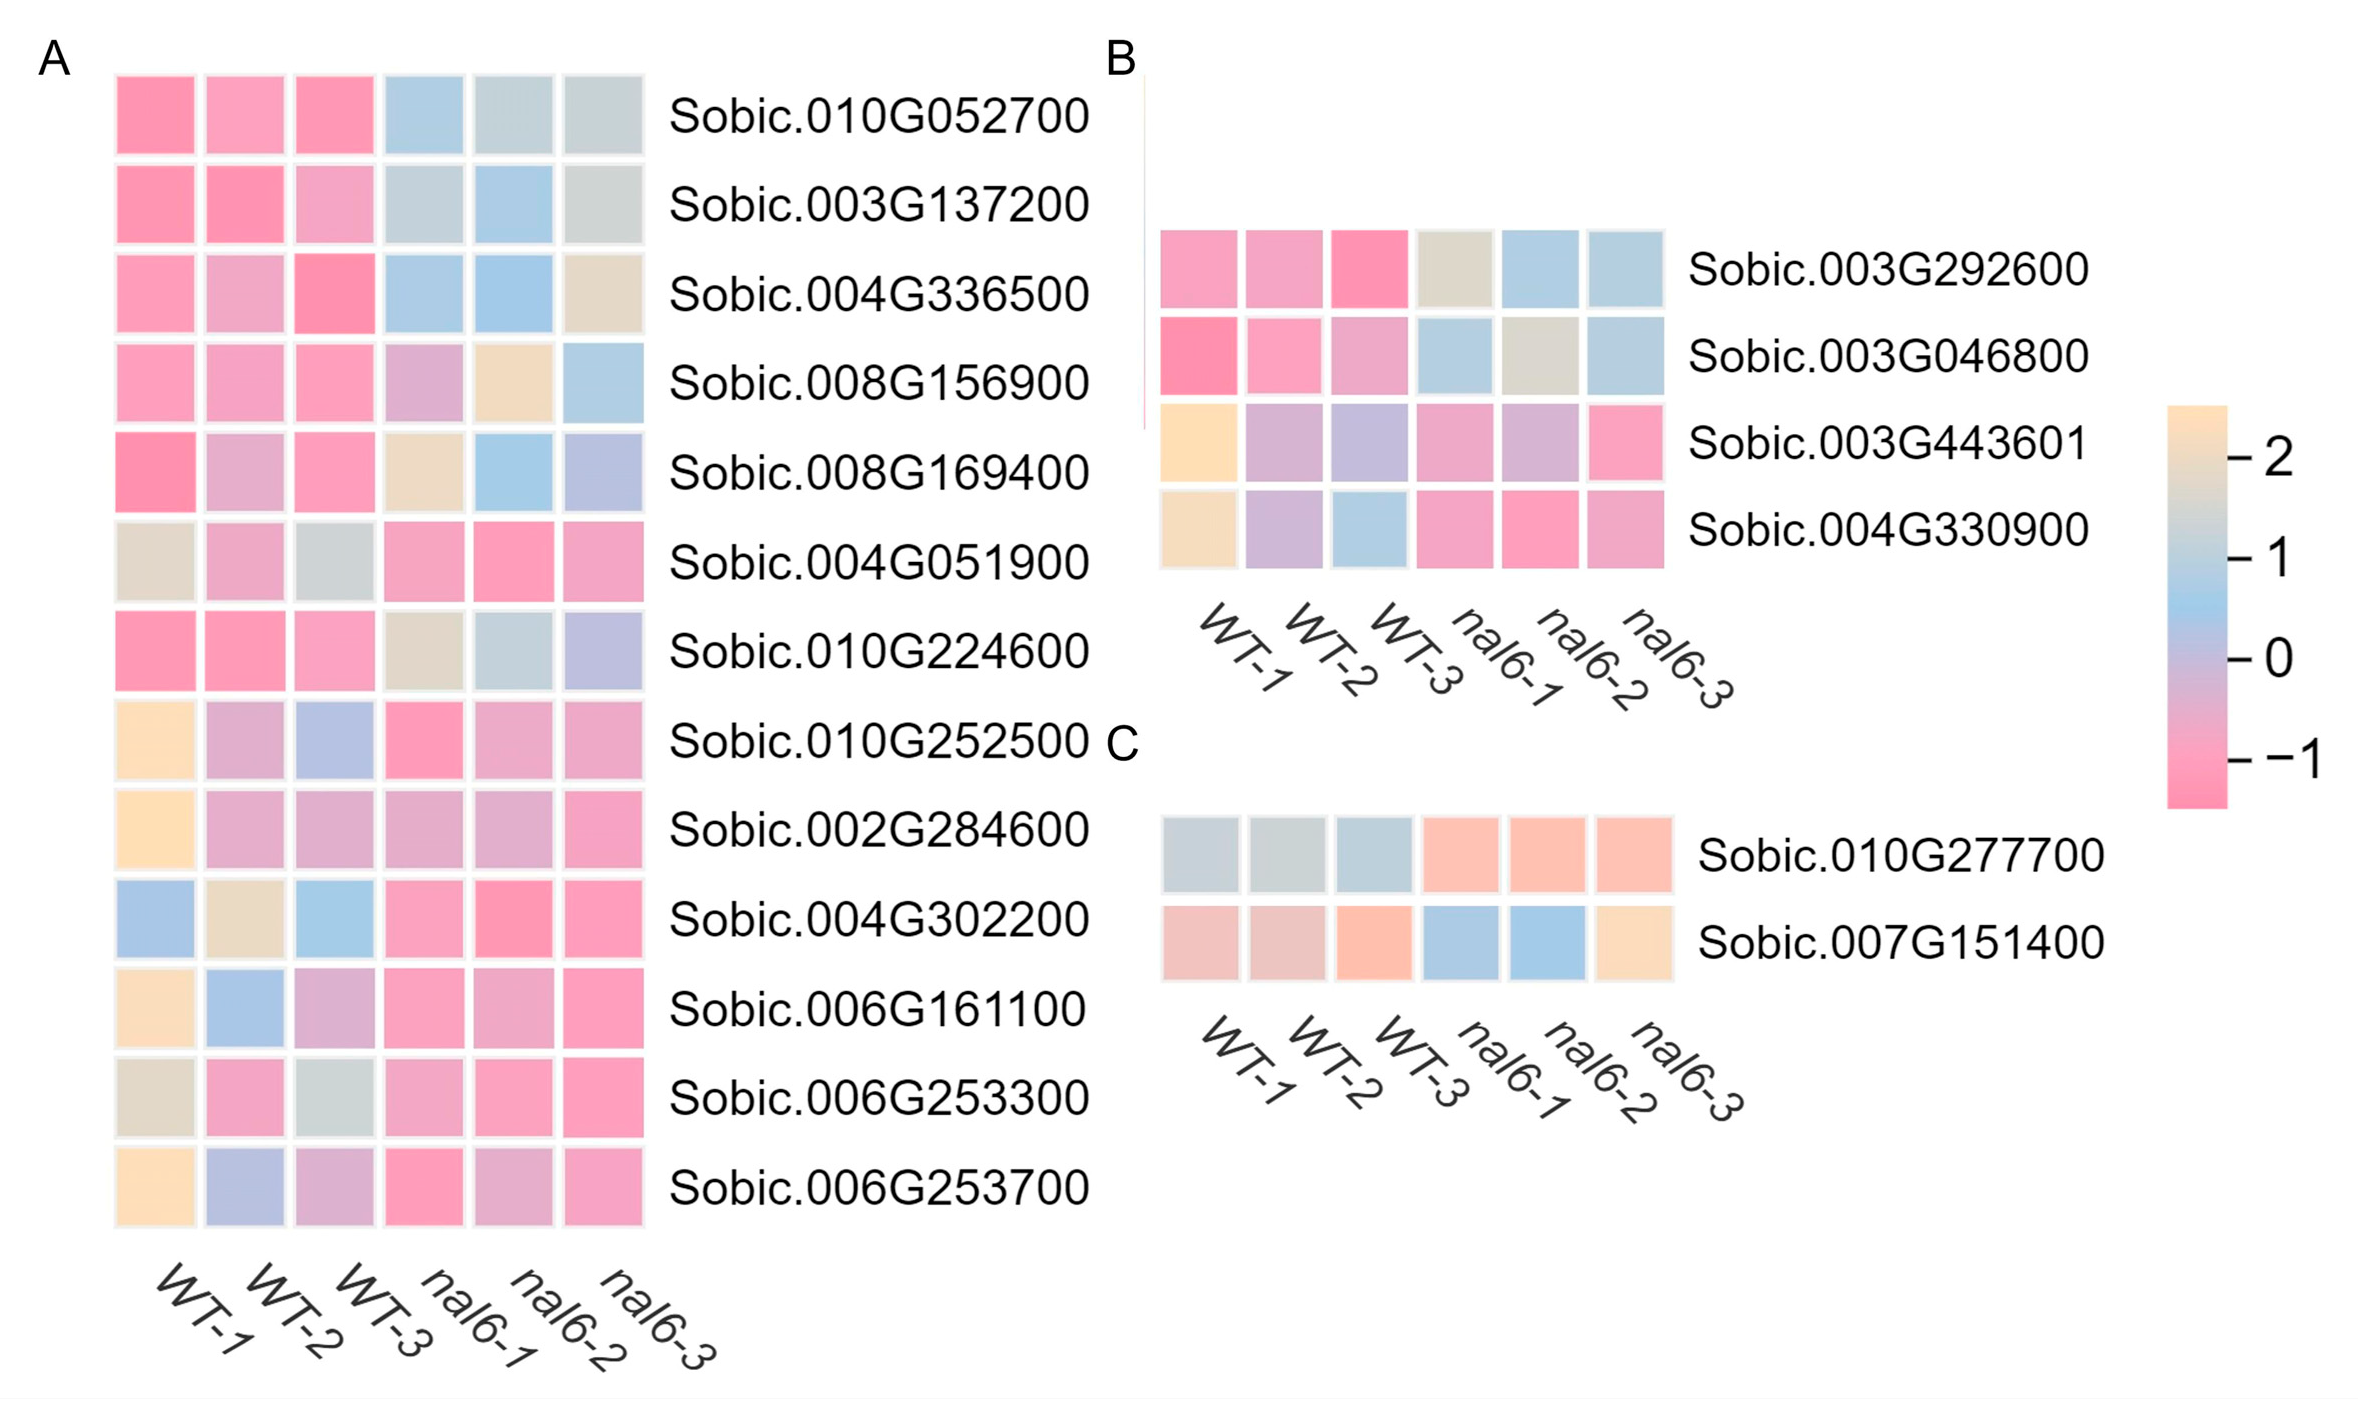
3.4. Mining and Analysis of Key Functional Genes

Compared with WT, nal6 plants have narrower and shorter leaves, and hormones regulate leaf development by influencing cell division and elongation growth during plant development. Combined with the transcriptome analysis, among the 1520 DEGs of WT and nal6, we screened thirteen DEGs related to auxin signal transduction, four DEGs related to zeatin signal transduction, and two DEGs related to zeatin biosynthesis (Supplementary Table S1).

3.4.1. Mining of Genes Associated with Auxin Signaling and Zeatin Signaling

Three auxin signaling pathways have previously been identified, namely, the AUX/IAA-TIR1 nuclear signaling pathway, the cell surface-initiation signaling pathway, and the SKP2A-mediated signaling pathway [36]. In this study, SAUR (the small auxin-up RNA), auxin-responsive GH3 (Gretchen Hagen3), and Aux/IAA (AUXIN/INDOLE-3-ACETIC ACID) families were involved in the transcriptional regulation mechanism of auxin in the AUX/IAA-TIR1 signaling pathway, resulting in changes in the transcription levels of related genes.
The Aux/IAA gene family is a dimer formed by auxin-inducible genes and ARFs (auxin response factors). It inhibits the transcriptional regulation of ARFs [45]. In this study, four genes encoding Aux/IAA family proteins—Sobic.010G052700, Sobic.003G137200, Sobic.004G336500, and Sobic.008G156900—were upregulated (Figure 9A and Figure 10, and Supplementary Table S1). The upregulated expression of these genes directly affects ubiquitin-mediated proteolytic processes. The expression levels of ARFs-encoding genes were also altered; Sobic.008G169400 was upregulated, while Sobic004G051900 was downregulated (Figure 9A and Figure 10, and Supplementary Table S1).
SAUR is an early response gene to auxin and is mainly involved in regulating the synthesis and transport of auxin, thereby affecting cell expansion [46]. The overexpression of AtSAUR19 in Arabidopsis thaliana resulted in an increase in leaf area and hypocotyl elongation in transgenic plants [47]. In this study, all seven genes encoding SAUR family proteins were downregulated in Sobic.010G224600, Sobic.010G252500, Sobic.002G284600, Sobic.004G302200, Sobic.006G161100, Sobic.006G253300, and Sobic.006G253700, except for gene Sobic.010G224600 (Figure 9A and Figure 10 and Supplementary Figure S4A).
Zeatin, as a cytokinin, affects cell division and the growth of bud meristems and delays leaf senescence [48]. In this study, four DEGs were identified to be involved in zeatin signaling: Sobic.003G292600, Sobic.003G046800, Sobic.003G443601, and Sobic.004G330900. Among them, Sobic.003G292600 and Sobic.003G046800 were upregulated, and Sobic.003G443601 and Sobic.004G330900 were downregulated (Figure 9B and Figure 10, and Supplementary Table S1). Sobic.003G292600 encodes AHP5 (histidine-containing phosphotransfer peotein5), and its overexpression in the Arabidopsis protoplasts system does not affect the expression of major auxin-responsive genes [9]. Therefore, the upregulation of Sobic.003G292600 in the leaves of nal6 may not affect the whole zeatin signaling process. In the binary component system of cytokinin signaling, RR (response regulators) are divided into two types, namely, type-A ARR and type-B ARR, both of which are involved in signal transduction. In this study, three genes involved in encoding type-B ARRs (Sobic.003G046800, Sobic.003G443601, and Sobic.004G330900) encode the transcription factor NIGTH1 (NITRATE-INDUCIBLE, GARP-TYPE TRANSCRIPTIONAL REPRESSOR), the transcription factor PCL1(PHYTOCLOCK 1), and the two-component response regulator ARR10, respectively. The differential expression of these three genes may affect the zeatin signaling process.

3.4.2. Mining of Genes Associated with Zeatin Biosynthesis

Plant hormone signal transduction pathways influence leaf development. Similarly, the biosynthesis of plant hormones also affects the process of leaf development [47]. In this study, DEGs were significantly enriched in the zeatin biosynthesis pathway, with two DEGs identified (Figure 9C and Figure 10, Supplementary Table S1, and Supplementary Figure S4B). Sobic.010G277700 is involved in encoding tRNA dimethylallyltransferase, and the gene is involved in the synthesis pathway of the important transferase cis-zeatin O-beta-D-glucosyltransferase and UDP (uridine diphosphate). The expression of the gene was downregulated in nal6 leaves, and thus, it may have a direct effect on the synthesis of cis-zeatin. In contrast, Sobic.007G151400 was also involved in encoding CKX (cytokinin dehydrogenase) in this pathway. CKX is involved in the oxidative cleavage of cytokinins and plays a role in regulating cytokinin homeostasis, which directly affects the stability of cytokinins. The upregulated expression of Sobic.007G151400 in nal6 affects cytokinin dehydrogenase biosynthesis and can directly influence cytokinin stability.

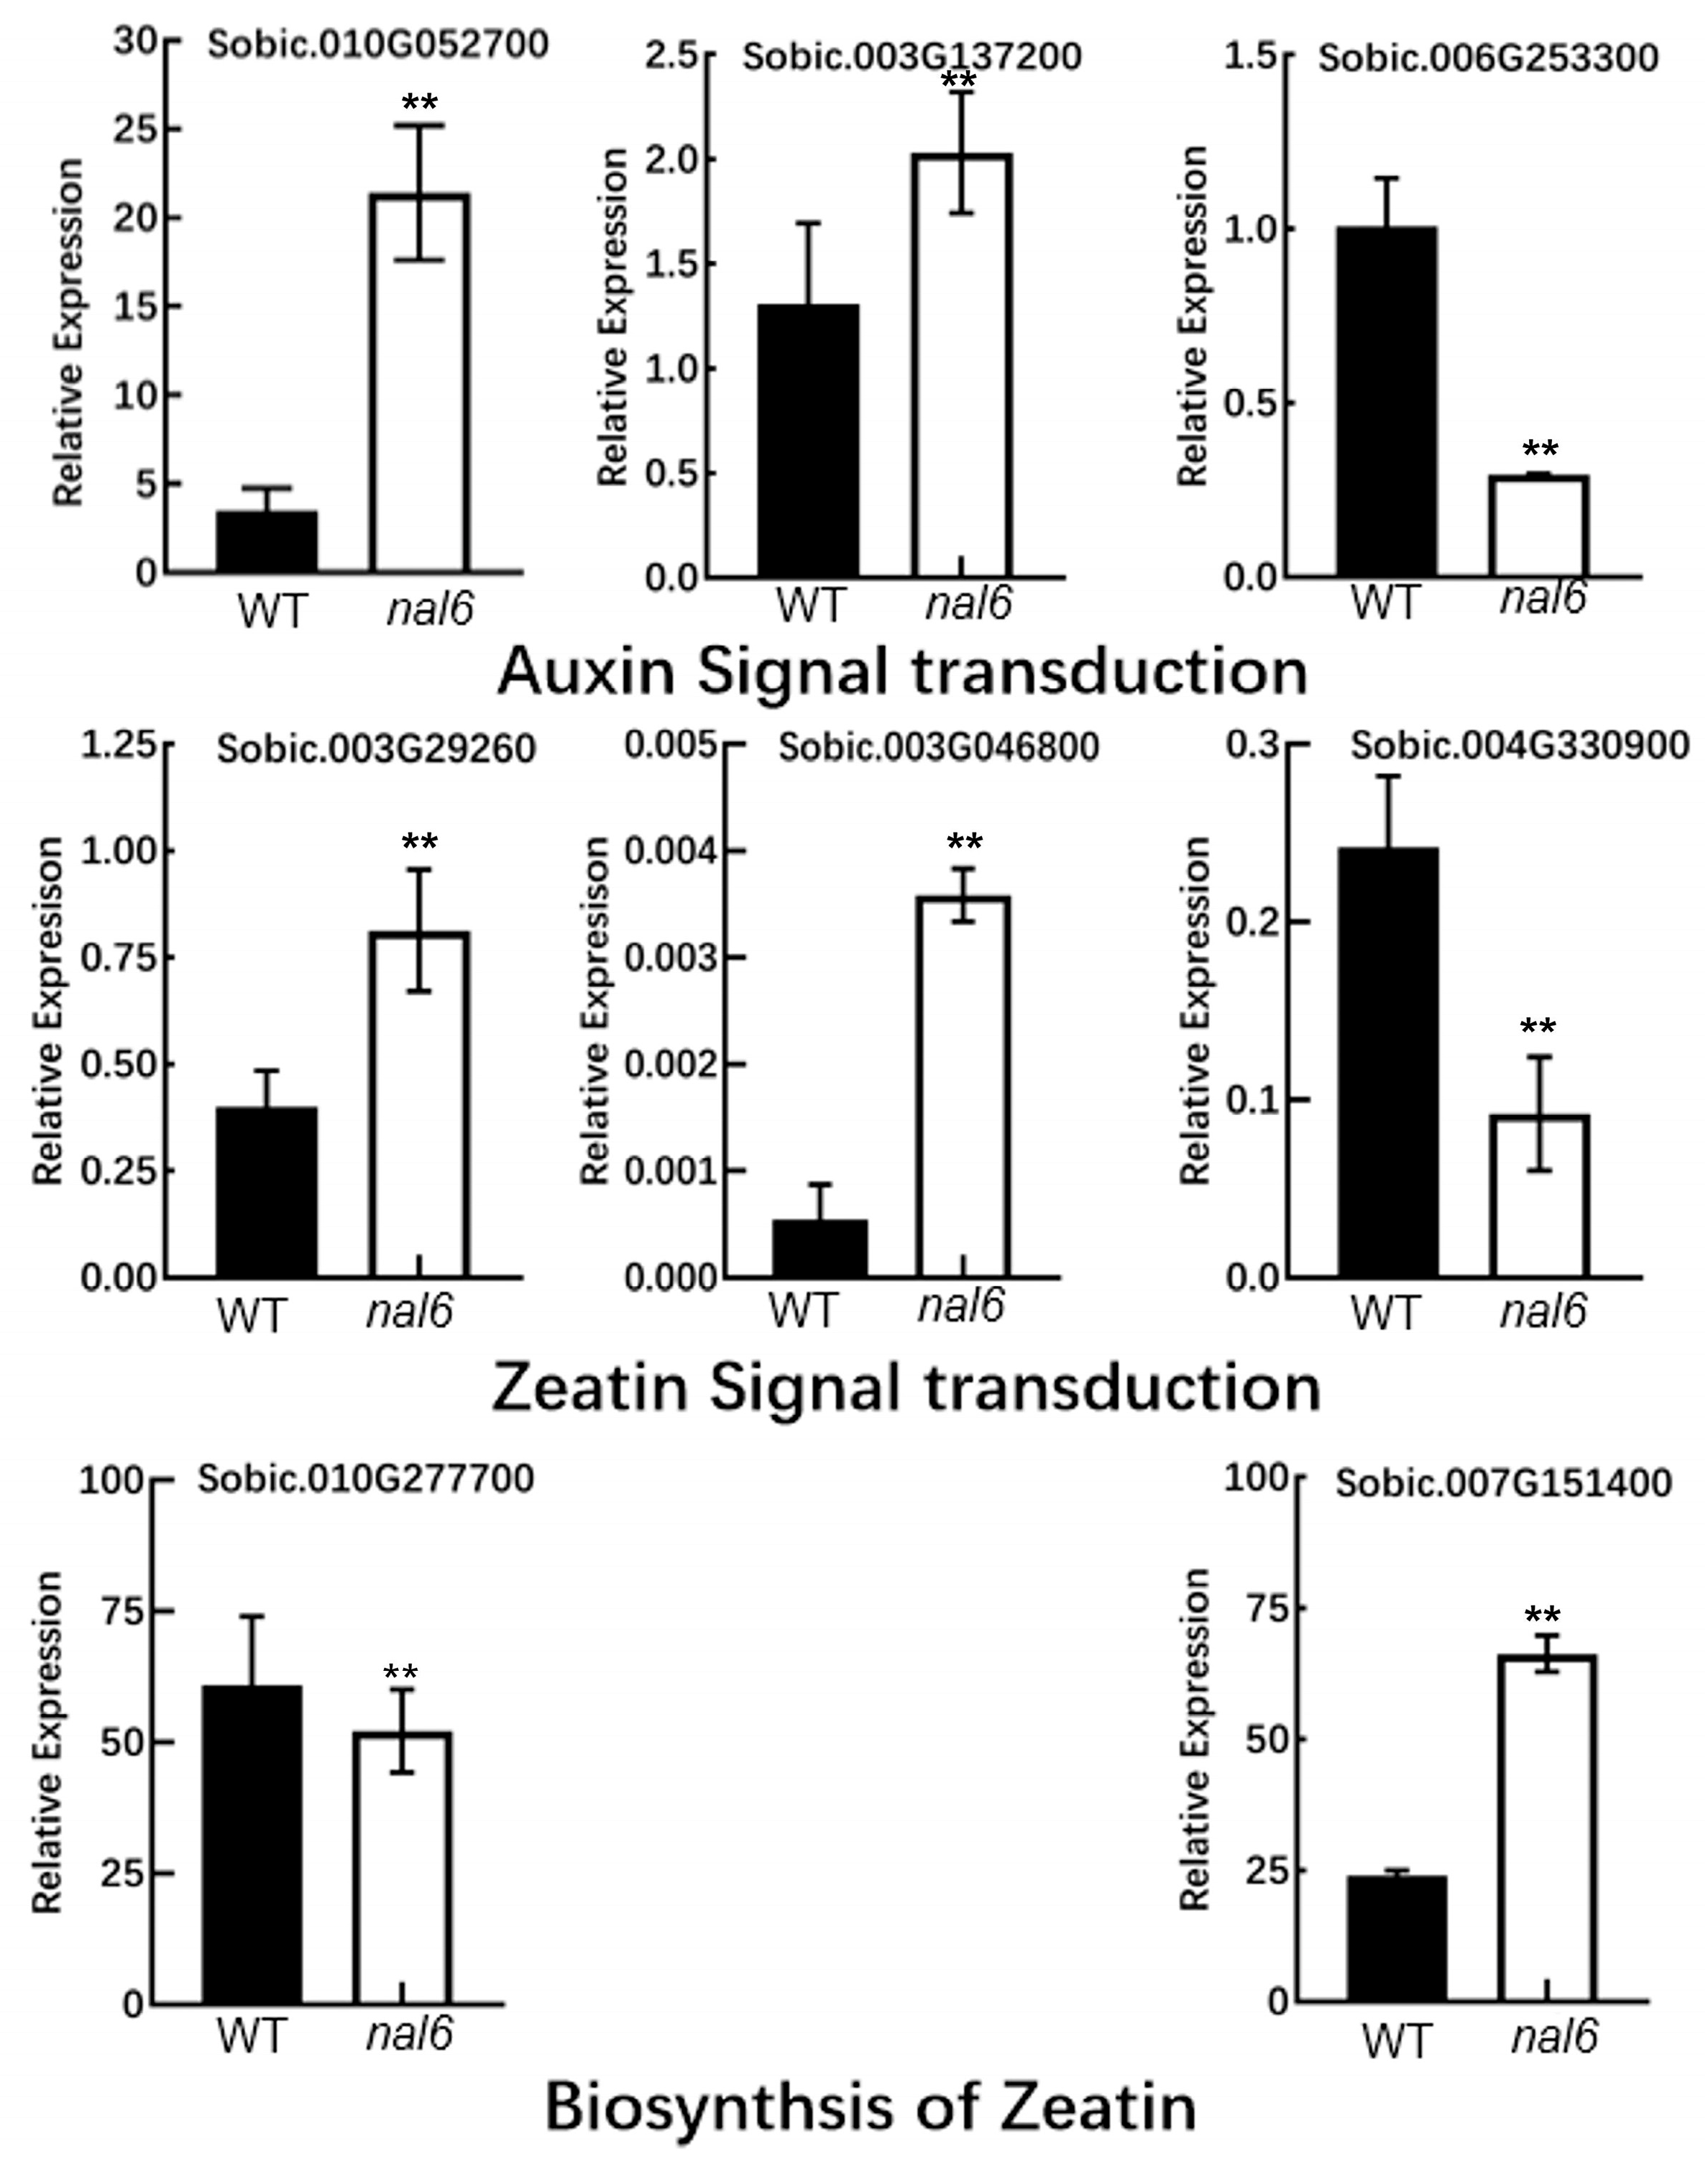
3.5. DEG Analysis by qRT-PCR

The DEGs involved in auxin signal transduction, zeatin signal transduction, and zeatin synthesis were verified by qRT-PCR. A total of eight DEGs were randomly verified by RT-PCR. The expression levels of eight genes were consistent with the transcriptome data (Figure 11, Table 1, Supplementary Table S1), indicating that eight genes directly or indirectly affect auxin, zeatin signal transduction, and zeatin biosynthesis.

4. Discussion and Conclusions

Exploring the molecular mechanisms behind the formation of narrow leaves in sorghum and identifying genes that regulate leaf and narrow leaf development for application in breeding practices is crucial for increasing sorghum yields. Therefore, for complex traits such as narrow sorghum leaves, research on the molecular mechanisms of gene interactions should be conducted to clearly understand the combined effects. At the same time, it should be integrated with international production practices, fully considering the effectiveness and rationality of gene pyramiding breeding.
The transcriptome is a set of transcripts that characterize the developmental period or physiological conditions of a cell. Transcriptome sequencing is the comprehensive and rapid acquisition of total cDNA sequence information of a particular characterization sample through high-throughput sequencing technology [14,22,49,50,51]. The information obtained through transcriptome sequencing can be mined for functional genome elements. It can also reveal the molecular components and biological processes within the cells or tissues, thus elucidating the developmental mechanisms of plants [52]. Transcriptome sequencing has, therefore, become an important tool for studying gene expression [47]. Researchers performed transcriptome analysis on the roots, stems, and leaves of the tall WT material GM437 and the nld (the dwarf narrow-leaf) in soybean. The authors found that the DEGs were mainly concentrated in two pathways, phytohormone signaling and phenylpropane biosynthesis, and exogenous spraying of gibberellin partially restored the growth of the short-stalked, narrow-leaved mutant [53].
Transcriptome technology is used to analyze the internode tissues of the maize dnl2 (dwarf-narrow-leaf 2) and WT. The results showed that DEGs were mainly enriched in pathways such as plant hormone biosynthesis, signal transduction, and cell wall biosynthesis, in which more than 100 DEGs were related to the synthesis and signaling of phytohormones, such as IAA, GA, ABA, ETH, and BR [36,54]. This suggests that DEGs affect cell proliferation and elongation by interacting with different hormones, which in turn induce the narrow leaf phenotype. Regulatory genes related to maize leaf morphology by RNA-seq and clarified that the dynamic balance among plant hormones plays an important role in leaf development, especially the interaction between auxin and brassinolide, cytokinin and gibberellin plays an important role in regulating leaf morphology [55]. An increasing number of studies have shown that the homeostatic regulation, polar transport, and signal transduction of auxin and cytokinin are closely linked to leaf development and leaf morphogenesis [56,57].
In this study, transcriptome analysis of nal6 and WT sword leaves revealed 1520 DEGs. Further analysis showed that there were 13 auxin early response factors. Aux/IAA, ARF, and SAUR were directly involved in auxin signal transduction, the level of auxin increased in the auxin signaling pathway, and the membrane receptor AUX1 (auxin resistant 1) assisted auxin in entering the cell. The F-box protein TIR1 (transport inhibitor response 1) recognizes and binds to auxin, resulting in a conformational change in the SCFTIR1 of the E3 ubiquitin ligase complex. The SCFTIR1 complex tags the AUX/IAA protein through the ubiquitination pathway, which is degraded by the 26S proteasome, thereby releasing ARF transcription factors on the dimer. This can activate or inhibit downstream genes, regulate auxin signaling, and maintain the homeostatic balance of auxin levels in plants, thus influencing cell elongation (Figure 10).
A total of four genes are involved in zeatin signal transduction. In the zeatin signal transduction pathway, the intracellular receptor CRE1 (cytokinin response 1) can recognize and bind zeatin. Autophosphorylation occurs after binding, and the phosphate group and zeatin are delivered to the downstream signaling molecule AHP. The phosphorylated AHP then enters the nucleus, which transmits the phosphate group to type-B ARRs and activates their transcriptional activity, thereby regulating the expression of downstream genes and affecting cell division. Moreover, type-A ARRs inhibit the activity of type-B ARRs and form a negative feedback regulatory mechanism to maintain the normal progress of zeatin signal transduction (Figure 10).
The biosynthesis of zeatin involves two genes. Zeatin can be synthesized through two pathways, namely, the tRNA pathway and the de novo synthesis pathway. The latter starts from DMAPP (dimethylallyl diphosphate) and adenylic acid (such as AMP, ADP, or ATP). The tRNA pathway, also known as the mevalonate pathway, synthesizes cis-zeatin. tRNA-DMAT (tRNA dimethylallyltransferase) catalyzes the binding of DMAPP to adenine on tRNA to form prenyl-tRNA. Following this, prenyl-tRNA is degraded intracellularly, releasing adenine nucleotides containing cis-prenene groups, which are further catalyzed to form cZRMP (cis-zeatin riboside monophosphate). cZRMP is hydrolyzed at phosphate bonds, removing ribose groups and finally forming cZ (cis-zeatin) (Figure 10).
The de novo synthesis pathway, also known as the deoxyxylulose pathway, synthesizes tZ (trans-zeatin) and IPT (isopentenyltransferase), which catalyzes the combination of DMAPP and adenylate (AMP, ADP, or ATP) to form iPRMP, iPRDP, and iPRTP. CYP735A further converts isoprene adenine nucleotide to tZ RMP (trans-zeatin riboside monophosphate). The LOG enzyme further converts tZ RMP into a free tZ. After the synthesis of zeatin, it will undergo further side-chain modification to form different derivatives. In this study, the changes in differential genes in the zeatin synthesis pathway altered enzyme activities such as CKX11 (cytokinin dehydrogenase 11) and UDP-glycosyltrans ferase, which affected the synthesis and content of different derivatives in the nal6 (Figure 10).
In addition to the upregulation of the expression of Aux/IAA (an early response factor involved in auxin signaling), other DEGs involved in auxin signaling, zeatin signaling, and zeatin biosynthesis were both upregulated and downregulated. We, therefore, hypothesize that the regulation of the dynamic equilibrium of growth hormones and zeatin, as well as the signaling pathways, were the key factors affecting cell division. nal6 may inhibit cell proliferation and growth by modulating the signal transduction of auxin and zeatin and the biosynthesis of zeatin, resulting in the narrow leaf phenotype. However, further research is required to determine their involvement in hormone signaling, their effects on zeatin biosynthesis, and whether the interactions between them are synergistic or antagonistic.

Supplementary Materials

The following supporting information can be downloaded at: https://www.mdpi.com/article/10.3390/agronomy15061432/s1, Supplementary Figure S1. (A) The 1000-grain weight at maturitybetween WT and the nal6. (B) The plant height at maturitybetween WT and the nal6. Data are mean ± SD (Student’s t test, ** p < 0.01, n = 10). Supplementary Figure S2. Statistical analysis of DEGs. Supplementary Figure S3. Expression heatmap of DEGs clustering. Supplementary Figure S4. KEGG pathway. (A) KEGG pathway of plant hormone signal transduction. (B) KEGG pathway of zeatin biosynthesis. The red box-labeled proteins were associated with up-regulated genes, the green box-labeled proteins were associated with down-regulated genes, the blue box-labeled enzymes were associated with both upregulated and downregulated genes, and no DEGs was found for the non-color-labeled enzymes. The number in the box represents the number of the enzyme. Supplementary Table S1. Functional annotation of DEGs.

Author Contributions

Conceptualization: J.L.; data curation: Y.W., Y.Z. (Yuche Zhao) and Y.Z. (Yanpeng Zhang); formal analysis: Y.W. and S.Z.; funding acquisition: J.L., S.G., and X.L.; investigation: S.Z. and J.L.; methodology: C.W.; project administration: J.L.; resources: C.W. and L.C.; supervision: X.L. and S.G.; validation: S.Z.; visualization: Y.W. and Y.Z. (Yanpeng Zhang); writing-original draft: S.Z. and J.L.; writing-review and editing: Y.Z. (Yuche Zhao) and J.L. All authors have read and agreed to the published version of the manuscript.

Funding

This research was funded by the Natural Science Foundation of Liaoning Province (project no. 2024-MSLH-507, 2022-MS-056, and 2021-MS-341), the National Modern Agricultural Industry Technology System (project no. CARS-06-14.5-A3), and the Liaoning Provincial Germplasm Innovation Grain Storage and Technology Special Program (project no. 2023020530-JH1/102).

Data Availability Statement

Queries for data supporting conclusions in this study can be directed to the corresponding authors.

Conflicts of Interest

The authors declare no conflicts of interest.

Abbreviations

The following abbreviations are used in this manuscript:
KEGGKyoto Encyclopedia of Genes and Genomes
GOGene Ontology

References

  1. Bai, S.; Yu, H.; Wang, B.; Li, J. Retrospective and perspective of rice breeding in China. J. Genet. Genom. 2018, 45, 603–612. [Google Scholar] [CrossRef] [PubMed]
  2. Yoshida, S. Grown and development of the rice plant. In Fundamentals of Rice Crop Science; IRRI: Los Banos, Philippines, 1981; pp. 1–61. [Google Scholar]
  3. Zhang, L.Q.; Song, Z.F.; Zhang, Y.J.; Yang, Y.H.; Zhu, X.Y. Study on the relationship between stem tillering structure and leaf area index and yield of rice jointing stage. J. Yangzhou Univ. 2004, 25, 55–58. [Google Scholar] [CrossRef]
  4. Chen, Z.X.; Pan, X.B.; H, J. Relationship between rice leaf curling traits and ideal plant shape. Jiangsu Agric. Res. 2001, 22, 88–91. [Google Scholar] [CrossRef]
  5. Yang, S.R.; Zhang, L.B.; Wang, J.M. Preliminary theory and method of ideal plant shape breeding in rice. Sci. Agric. Sin. 1984, 3, 6–13. [Google Scholar]
  6. Sazuka, T.; Kamiya, N.; Nishimura, T.; Ohmae, K.; Sato, Y.; Imamura, K.; Nagato, Y.; Koshiba, T.; Nagamura, Y.; Ashikari, M.; et al. A rice tryptophan deficient dwarf mutant, tdd1, contains a reduced level of indole acetic acid and develops abnormal flowers and organless embryos. Plant J. 2009, 60, 227–241. [Google Scholar] [CrossRef] [PubMed]
  7. Jiang, D.; Fang, J.J.; Lou, L.; Zhao, J.F.; Yuan, S.J.; Yin, L.; Sun, W.; Peng, L.X.; Guo, B.T.; Li, X.Y. Characterization of a null allelic mutant of the rice NAL1 gene reveals its role in regulating cell division. PLoS ONE 2015, 10, e0118169. [Google Scholar] [CrossRef]
  8. Xu, Y.X.; Xiao, M.Z.; Liu, Y.; Fu, J.L.; He, Y.; Jiang, D.A. The small auxin-up RNA OsSAUR45 affects auxin synthesis and transport in rice. Plant Mol. Biol. 2017, 94, 97–107. [Google Scholar] [CrossRef]
  9. Qi, J.; Qian, Q.; Bu, Q.Y.; Li, S.Y.; Chen, Q.; Sun, J.Q.; Liang, W.X.; Zhou, Y.H.; Chu, C.C.; Li, X.G.; et al. Mutation of the rice Narrow leaf1 gene, which encodes a novel protein, affects vein patterning and polar auxin transport. Plant Physiol. 2008, 147, 1947–1959. [Google Scholar] [CrossRef]
  10. Fujino, K.; Matsuda, Y.; Ozawa, K.; Nishimura, T.; Koshiba, T.; Fraaije, M.W.; Sekiguchi, H. NARROW LEAF 7 controls leaf shape mediated by auxin in rice. Mol. Genet. Genom. 2008, 279, 499–507. [Google Scholar] [CrossRef]
  11. Ohmori, Y.; Tanaka, W.; Kojima, M.; Sakakibara, H.; Hirano, H.Y. WUSCHEL-RELATED HOMEOBOX4 is involved in meristem maintenance and is negatively regulated by the CLE gene FCP1 in rice. Plant Cell 2013, 25, 229–241. [Google Scholar] [CrossRef]
  12. Chen, K.; Guo, T.; Li, X.M.; Yang, Y.B.; Dong, N.Q.; Shi, C.L.; Ye, W.W.; Shan, J.X.; Lin, H.X. NAL8 encodes a prohibitin that contributes to leaf and spikelet development by regulating mitochondria and chloroplasts stability in rice. BMC Plant Biol. 2019, 19, 395. [Google Scholar] [CrossRef] [PubMed]
  13. Xu, Y.C.; Yan, S.Y.; Jiang, S.; Bai, L.; Liu, Y.C.; Peng, S.S.; Chen, R.B.; Liu, Q.; Xiao, Y.H.; Kang, H.X. Identification of a Rice Leaf Width Gene Narrow Leaf 22 (NAL22) through Genome-Wide Association Study and Gene Editing Technology. Int. J. Mol. Sci. 2023, 24, 4073. [Google Scholar] [CrossRef] [PubMed]
  14. Yasui, Y.; Ohmori, Y.; Takebayashi, Y.; Sakakibara, H.; Hirano, H.Y. WUSCHEL-RELATED HOMEOBOX4 acts as a key regulator in early leaf development in rice. PLoS Genet. 2018, 14, e1007365. [Google Scholar] [CrossRef] [PubMed]
  15. Honda, E.; Yew, C.L.; Yoshikawa, T.; Sato, Y.; Hibara, K.I.; Itoh, J.I. LEAF LATERAL SYMMETRY1, a Member of the WUSCHEL-RELATED HOMEOBOX3 Gene Family, Regulates Lateral Organ Development Differentially from Other Paralogs, NARROW LEAF2 and NARROW LEAF3 in Rice. Plant Cell Physiol. 2018, 59, 376–391. [Google Scholar] [CrossRef]
  16. Zheng, X.L.; Zhang, S.; Liang, Y.L.; Zhang, R.; Liu, L.; Qin, P.C.; Zhang, Z.; Wang, Y.; Zhou, J.P.; Tang, X.; et al. Loss-function mutants of OsCKX gene family based on CRISPR-Cas systems revealed their diversified roles in rice. Plant Genome 2023, 16, e20283. [Google Scholar] [CrossRef]
  17. Guo, T.T.; Wang, D.F.; Fang, J.J.; Zhao, J.F.; Yuan, S.J.; Xiao, L.T.; Li, X.Y. Mutations in the rice OSCHR4 gene, encoding a CHD3 family chromatin remodeler, induce narrow and rolled leaves with increased cuticular wax. Int. J. Mol. Sci. 2019, 20, 2567. [Google Scholar] [CrossRef]
  18. Ma, L.; Sang, X.C.; Zhang, T.; Yu, Z.Y.; Li, Y.F.; Zhao, F.M.; Wang, Z.W.; Wang, Y.T.; Yu, P.; Wang, N.; et al. Abnormal VASCULAR Bundles regulates cell proliferation and procambium cell establishment during aerial organ development in rice. New Phytol. 2017, 213, 275–286. [Google Scholar] [CrossRef]
  19. Wang, H.M.; Shi, Y.F.; Zhang, X.B.; Xu, X.; Wu, J.L. Characterization of a novel rice dynamic narrow-rolled leaf mutant with deficiencies in aromatic amino acids. Int. J. Mol. Sci. 2020, 21, 1521. [Google Scholar] [CrossRef]
  20. Liu, X.F.; Li, M.; Liu, K.; Tang, D.; Sun, M.F.; Li, Y.F.; Shen, Y.; Du, G.J.; Cheng, Z.K. Semi-rolled Leaf2 modulates rice leaf rolling by regulating abaxial side cell differentiation. J. Exp. Bot. 2016, 67, 2139–2150. [Google Scholar] [CrossRef]
  21. Akoglu, H. User’s guide to correlation coefficients. Turk. J. Emerg. Med. 2018, 18, 91–93. [Google Scholar] [CrossRef]
  22. Lanctot, A.; Nemhauser, J.L. It’s morphin’ time: How multiple signals converge on ARF transcription factors to direct development. Curr. Opin. Plant Biol. 2020, 57, 1–7. [Google Scholar] [CrossRef] [PubMed]
  23. Ma, Y.; Miotk, A.; Šutiković, Z.; Ermakova, O.; Wenzl, C.; Medzihradszky, A.; Gaillochet, C.; Forner, J.; Utan, G.; Brackmann, K.; et al. WUSCHEL acts as an auxin response rheostat to maintain apical stem cells in arabidopsis. Nat. Commun. 2019, 10, 5093. [Google Scholar] [CrossRef] [PubMed]
  24. Yoshikawa, T.; Eiguchi, M.; Hibara, K.-I.; Ito, J.-I.; Nagato, Y. Rice slender Leaf 1 gene encodes cellulose synthase-like D4 and is specifically expressed in M-phase cells to regulate cell proliferation. J. Exp. Bot. 2013, 64, 2049–2061. [Google Scholar] [CrossRef]
  25. Zhao, S.S.; Zhao, L.; Liu, F.X.; Wu, Y.Z.; Zhu, Z.F.; Sun, C.Q.; Tan, L.B. Narrow and rolled Leaf 2 regulates leaf shape, male fertility, and seed size in rice. J. Integr. Plant Biol. 2016, 58, 983–996. [Google Scholar] [CrossRef]
  26. Li, J.H.; Dong, S.; Li, W.H.; Zhang, L.X.; Lu, X.C. Phenotypic Identification and Genetic Analysis of the Leaf Angle Mutant LA1 in Sorghum. J. Shenyang Agric. Univ. 2021, 52, 460–466. [Google Scholar]
  27. Dong, S.; Lu, X.C.; Li, J.H.; Han, J.Y. Phenotypic Identification and Genetic Analysis of an Upright Leaf Mutant in Sorghum. J. Plant Genet. Resour. 2022, 23, 177–182. [Google Scholar] [CrossRef]
  28. Corchete, L.A.; Rojas, E.A.; Alonso-López, D.; De Las Rivas, J.; Gutiérrez, N.C.; Burguillo, F.J. Systematic comparison and assessment of Rna-seq procedures for gene expression quantitative analysis. Sci. Rep. 2020, 10, 19737. [Google Scholar] [CrossRef]
  29. Gao, Z.X.; Gang, S.; Lu, X.C.; Wang, P.; Li, Z.J.; Wang, Y.W.; Li, J.H. Mapping and Candidate Gene Analysis of the Yellow Seed 2 Gene for Yellow Grains in Sorghum. J. Plant Genet. Resour. 2024, 25, 1565–1572. [Google Scholar] [CrossRef]
  30. Meng, B.X.; Wang, T.; Luo, Y.; Xu, D.Z.; Li, L.Z.; Diao, Y.; Gao, Z.Y.; Hu, Z.L.; Zheng, X.F. Genome-wide association study identified novel candidate loci/genes affecting lodging resistance in rice. Genes 2021, 12, 718. [Google Scholar] [CrossRef]
  31. Ran, X.J.; Zhao, F.; Wang, Y.J.; Liu, J.; Zhuang, Y.L.; Ye, L.H.; Qi, M.F.; Cheng, J.F.; Zhang, Y.J. Plant regulomics: A data-driven interface for retrieving upstream regulators from plant multi-omics data. Plant J. 2020, 101, 237–248. [Google Scholar] [CrossRef]
  32. McDermaid, A.; Monier, B.; Zhao, J.; Liu, B.; Ma, Q. Interpretation of differential gene expression results of Rna-seq data: Review and integration. Brief. Bioinf. 2019, 20, 2044–2054. [Google Scholar] [CrossRef] [PubMed]
  33. Wang, Z.; Gerstein, M.; Snyder, M. Rna-seq: A revolutionary tool for transcriptomics. Nat. Rev. Genet. 2009, 10, 57–63. [Google Scholar] [CrossRef] [PubMed]
  34. Love, M.I.; Huber, W.; Anders, S. Moderated estimation of fold change and dispersion for Rna-seq data with Deseq2. Genome Biol. 2014, 15, 1–21. [Google Scholar] [CrossRef]
  35. Han, L.L.; Jiang, C.G.; Zhang, W.; Wang, H.W.; Li, K.; Liu, X.G.; Liu, Z.F.; Wu, Y.J.; Huang, C.L.; Hu, X.J. Morphological characterization and transcriptome analysis of new dwarf and narrow-leaf (dnl2) mutant in maize. Int. J. Mol. Sci. 2022, 23, 795. [Google Scholar] [CrossRef] [PubMed]
  36. Fang, X.F.; Gu, J.Y.; Zhao, M.H.; Zhao, L.S.; Guo, H.J.; Xiong, H.C.; Xie, Y.D.; Zhao, S.R.; Ding, Y.P.; Qiao, W.C.; et al. Transcriptome analysis of wheat erect leaf mutant Mths29. J. Plant Genet. Resour. 2022, 23, 871–880. [Google Scholar] [CrossRef]
  37. Guo, S.L.; Lu, X.M.; Qi, J.S.; Wei, L.M.; Zhang, X.; Han, X.H.; Yue, R.Q.; Wang, Z.H.; Tie, S.G.; Chen, Y.H. Exploration of regulatory genes related to morphogenesis in maize leaves using Rna-seq. Chin. J. Agric. Sci. 2020, 53, 1–17. [Google Scholar] [CrossRef]
  38. Israeli, A.; Capua, Y.; Shwartz, I.; Tal, L.; Meir, Z.; Levy, M.; Bar, M.; Efroni, I.; Ori, N. Multiple auxin-response regulators enable stability and variability in leaf development. Curr. Biol. 2019, 29, 1746–1759. [Google Scholar] [CrossRef]
  39. Satterlee, J.W.; Scanlon, M.J. Coordination of leaf development across developmental axes. Plants 2019, 8, 433. [Google Scholar] [CrossRef]
  40. Lawson, T.; Matthews, J. Guard cell metabolism and stomatal function. Annu. Rev. Plant Biol. 2020, 71, 273–302. [Google Scholar] [CrossRef]
  41. Qin, W.T.; Yang, C.Q.; Deng, J.C.; Iqbal, N.; Yang, F.; Wang, X.C.; Yang, W.Y.; Liu, J. Transcriptomic analysis of soybean seed aging. J. Northeast Agric. Univ. 2018, 49, 1–9. [Google Scholar] [CrossRef]
  42. Saha, A.; Das, S.; Moin, M.; Dutta, M.; Bakshi, A.; Madhav, M.S.; Kirti, P.B. Genome-wide identification and comprehensive expression profiling of ribosomal protein small subunit (RPS) genes and their comparative analysis with the large subunit (RPL) genes in rice. Front. Plant Sci. 2017, 8, 1553. [Google Scholar] [CrossRef] [PubMed]
  43. Sun, Z.X.; Wang, X.F.; Liu, R.H.; Du, W.; Ma, M.C.; Han, Y.H.; Li, H.Y.; Liu, L.L.; Hou, S.Y. Comparative transcriptomic analysis reveals the regulatory mechanism of the gibberellic acid pathway of tartary buckwheat (Fagopyrum tataricum (L.) Gaertn.) dwarf mutants. BMC Plant Biol. 2021, 21, 206. [Google Scholar] [CrossRef]
  44. Wang, C.Y.; Zhu, Z.X.; Li, D.; Cong, L.; Zhang, L.X. Screening and identification of EMS mutagenesis and mutants in sorghum. Biotechnol. Bull. 2014, 9, 78–83. [Google Scholar] [CrossRef]
  45. Yang, Q.; Yin, J.J.; Li, G.; Qi, L.; Yang, F.; Wang, R.; Li, G.J. Reference gene selection for Qrt-pcr in Caragana korshinskii Kom. under different stress conditions. Mol. Biol. Rep. 2014, 41, 2325–2334. [Google Scholar] [CrossRef]
  46. Bae, K.-D.; Um, T.-Y.; Yang, W.-T.; Park, T.-H.; Hong, S.-Y.; Kim, K.-M.; Chung, Y.-S.; Yun, D.-J.; Kim, D.-H. Characterization of dwarf and narrow leaf (dnl-4) mutant in rice. Plant Signal. Behav. 2021, 16, 1849490. [Google Scholar] [CrossRef]
  47. Spartz, A.K.; Lee, S.H.; Wenger, J.P.; Gonzalez, N.; Itoh, H.; Inzé, D.; Peer, W.A.; Murphy, A.S.; Overvoorde, P.J.; Gray, W.M. The SAUR19 subfamily of SMALL AUXIN UP RNA genes promote cell expansion. Plant J. 2012, 70, 978–990. [Google Scholar] [CrossRef] [PubMed]
  48. Gajdosová, S.; Spíchal, L.; Kamínek, M.; Hoyerová, K.; Novák, O.; Dobrev, P.I.; Galuszka, P.; Klíma, P.; Gaudinová, A.; Zizková, E.; et al. Distribution, biological activities, metabolism, and the conceivable function of cis-zeatin-type cytokinins in plants. J. Exp. Bot. 2011, 62, 2827–2840. [Google Scholar] [CrossRef]
  49. Thilakarathne, A.S.; Liu, F.; Zou, Z. Plant Signaling Hormones and Transcription Factors: Key Regulators of Plant Responses to Growth, Development, and Stress. Plants 2025, 14, 1070. [Google Scholar] [CrossRef]
  50. Korasick, D.A.; Jez, J.M.; Strader, L.C. Refining the nuclear auxin response pathway through structural biology. Curr. Opin. Plant Biol. 2015, 27, 22–28. [Google Scholar] [CrossRef]
  51. Zhou, D.; Li, Y.J.; Xie, X.R.; Ding, W.Y.; Chen, L.B.; Li, T.; Tang, J.N.; Tan, X.Y.; Liu, W.Z.; Heng, Y.Q. Copy number variation of NAL23 causes narrow-leaf development in rice. J. Genet. Genom. 2024, 51, 880–883. [Google Scholar] [CrossRef]
  52. Jain, M.; Tyagi, A.K.; Khurana, J.P. Genome-wide analysis, evolutionary expansion, and expression of early auxin-responsive SAUR gene family in rice (Oryza sativa). Genomics 2006, 88, 360–371. [Google Scholar] [CrossRef]
  53. Du, M.Y.; Li, R.; Ruan, G.X.; Li, Y.S.; Wan, P.; Yang, K. Transcriptome analysis and hormone response of adzuki bean dwarf stalk narrow leaf mutant. J. Beijing Univ. Agric. 2020, 35, 18–24. [Google Scholar] [CrossRef]
  54. Wang, B.; Smith, S.M.; Li, J.Y. Genetic regulation of shoot architecture. Annu. Rev. Plant Biol. 2018, 69, 437–468. [Google Scholar] [CrossRef] [PubMed]
  55. Zhao, B.Q.; Liu, Q.Y.; Wang, B.S.; Yuan, F. Roles of phytohormones and their signaling pathways in leaf development and stress responses. J. Agric. Food Chem. 2021, 69, 3566–3584. [Google Scholar] [CrossRef] [PubMed]
  56. Jiang, S.; Wang, D.; Yan, S.; Liu, S.M.; Liu, B.; Kang, H.X.; Wang, G.-L. Dissection of the genetic architecture of rice tillering using a genome-wide association study. Rice 2019, 12, 43. [Google Scholar] [CrossRef]
  57. Roy, N.; Kabir, A.H.; Zahan, N.; Mouna, S.T.; Chakravarty, S.; Rahman, A.H.; Bayzid, M.S. Genome wide association studies on seven yield-related traits of 183 rice varieties in Bangladesh. Plant Direct 2024, 8, e593. [Google Scholar] [CrossRef]
Figure 1. Gross morphology of WT and nal6. (A) Comparison of WT and the nal6 leaves at the three-leaf stage. Scale bar = 1 cm. (B) Plant morphology at the three-leaf stage. Scale bar = 1 cm. (C) Plant morphology at the five-leaf stage. Scale bar = 1 cm. (D) Comparison of WT and nal6 leaves at the sword leaf. Scale bar = 10 cm. (E) Comparison of WT and nal6 panicles at maturity. Scale bar = 10 cm. (F) Plant height at maturity. Scale bar = 10 cm. (G) Stoma of the sword leaf in WT. Scale bar = 50 μm. (H) Stoma of the sword leaf in nal6. Scale bar = 50 μm. (I) Statistical comparison of the sword leaf width. (J) Statistical comparison of the sword leaf length. (K) Statistical comparison of the number of epidermal cells. (L) Statistical comparison of the stomatal density. (M) Statistical comparison of spikelet length. (N) Statistical comparison of the number of spikelets. Data are mean ± SD (Student’s t-test, ** p < 0.01, n = 10).
Agronomy 15 01432 g001
Figure 2. Sample correlation heatmap of WT and nal6.
Agronomy 15 01432 g002
Figure 3. Volcano map of DEGs between WT and nal6.
Agronomy 15 01432 g003
Figure 4. KEGG classification between WT and nal6.
Agronomy 15 01432 g004
Figure 5. Statistics of KEGG enrichment between WT and nal6.
Agronomy 15 01432 g005
Figure 6. Classification chart of GO secondary entries for DEGs.
Agronomy 15 01432 g006
Figure 7. GO enrichment for DEGs.
Agronomy 15 01432 g007
Figure 8. KOG classification annotation results for DEGs.
Agronomy 15 01432 g008
Figure 9. Expression heatmap of DEGs. (A) Heat map of DEGs in the auxin signaling. (B) Heat map of DEGs in the zeatin signaling. (C) Heat map of DEGs in the zeatin biosynthesis.
Agronomy 15 01432 g009
Figure 10. Molecular mechanisms involved in leaf development. Green solid line arrows indicate activation or positive regulation, red T-shaped arrows indicate inhibition or negative regulation.
Agronomy 15 01432 g010
Figure 11. qRT-PCR expression analysis of DEGs. Data are mean ± SD (Student’s t-test, ** p < 0.01, n = 10).
Agronomy 15 01432 g011
Table 1. qRT-PCR primer sequence.
Primer NamePathway Name/FunctionSequence
Sobic.010G052700FAuxin signal transductionAAGGTCAAGATGGAAGGGGTG
Sobic.010G052700RAuxin signal transductionTTCTTCTGCATGACCTGCATC
Sobic.003G137200FAuxin signal transductionTCGTCCATGGATAGCAGCAC
Sobic.003G137200RAuxin signal transductionGCGTAGAAGGGATGCTCCTC
Sobic.006G253300FAuxin signal transductionAGGAGGAGTACGGCTTCCC
Sobic.006G253300RAuxin signal transductionGTTGTGATCCACGGCCATTC
Sobic.003G292600FZeatin signal transductionGTGGAAGACTTGCAGGACGA
Sobic.003G292600RZeatin signal transductionCCTTGAAGCACCAATGCTGG
Sobic.003G046800FZeatin signal transductionCGTAGTACAGAACGGCGTCA
Sobic.003G046800RZeatin signal transductionATCCACCTTCATCAGCTCGC
Sobic.004G330900FZeatin signal transductionGTCCAGCTGCCACAAAAGTG
Sobic.004G330900RZeatin signal transductionACATTCTGCTGGGATGCACA
Sobic.010G277700FBiosynthesis of zeatinAGTGCCATCGGTTACAAGCA
Sobic.010G277700RBiosynthesis of zeatinTGCAGCCATGGTAAGCATCA
Sobic.007G151400FBiosynthesis of zeatinCGGAGGGCGAGATCTTCTAC
Sobic.007G151400RBiosynthesis of zeatinATCGCCAGCGGGTCGTA
Sobic.001G112600Finternal standardATGGCTGACGCCGAGGATATCCA
Sobic.001G112600Rinternal standardGAGCCACACGGAGCTCGTTGTAG
Disclaimer/Publisher’s Note: The statements, opinions and data contained in all publications are solely those of the individual author(s) and contributor(s) and not of MDPI and/or the editor(s). MDPI and/or the editor(s) disclaim responsibility for any injury to people or property resulting from any ideas, methods, instructions or products referred to in the content.

