Article

Dynamic Effects of Sodium Selenite on the Rhizospheric Microenvironment, Growth, and Antioxidative Responses of Wheat (Triticum aestivum L.)

College of Resources and Environment, Shanxi Agricultural University, Taigu 030801, China
*
Author to whom correspondence should be addressed.
Agronomy 2025, 15(6), 1427; https://doi.org/10.3390/agronomy15061427
Submission received: 29 April 2025 / Revised: 31 May 2025 / Accepted: 9 June 2025 / Published: 11 June 2025
(This article belongs to the Section Soil and Plant Nutrition)

Abstract

:
Soil selenium (Se) speciation characteristics and their influence on the Se enrichment pattern and physiological characteristics of wheat are poorly understood. Based on the rhizobag experiment, we systematically investigated rhizosphere dynamics, as well as biomass and antioxidant responses, in wheat at five exogenous Se levels (0, 1.0, 2.5, 5.0, and 10.0 mg kg−1 Se in sodium selenite). The results showed that the rhizosphere pH and dissolved organic carbon (DOC) in the soil solution were higher than those in the non-rhizosphere soil solution and that the total and inorganic Se levels in the soil solution increased as the Se application concentration was increased. Meanwhile, in the rhizosphere soil, the concentrations of water-soluble Se (SOL-Se), exchangeable Se (EX-Se), and organically bound Se (OM-Se) significantly increased in response to increases in Se application rates. The ratio of the sum of the three forms of Se to total Se increased by 20.9–56.5%, 19.8–54.6%, and 17.9–53.0% at weeks 4, 6, and 8, respectively. The Se content in both the shoots and roots parts of wheat increased significantly as the Se application concentration was increased. The Se levels in the shoots and roots increased alongside wheat growth in low-level Se (≤2.5 mg kg−1). However, when using high-concentration Se treatments (≥5.0 mg Se kg−1), the trend in these plant parts was for the Se levels to initially increase and then decrease as the wheat grew, with the significant increases of 43-fold and 96-fold at week 6, reaching the highest levels. Under the 5 mg Se kg−1 treatment, the shoot bioaccumulation factor (BCFss) increased by 1.5-fold, 2.0-fold, and 1.6-fold at weeks 4, 6, and 8, respectively. The root bioaccumulation factor (BCFrs) increased with increasing Se concentration. The root-to-shoot translocation factor (TF) tends to increase and then decrease with application concentration increased; all factors had values of less than 1. The TF reached its maximum value at weeks 4 and 6 under 2.5 mg Se kg−1 treatment, while it was highest at week 8 under 5 mg Se kg−1 treatment. When using 5 mg Se kg−1 treatment, the shoot and root biomass of wheat increased by 17% and 22%, and 29% and 32%, respectively, at weeks 6 and 8, timepoints when the highest levels were reached. The application of 5.0 mg Se kg−1 treatment significantly increased the activity of superoxide dismutase (32%, 68%, and 17%) and glutathione peroxidase (34%, 70%, and 43%) in wheat leaves at weeks 4, 6, and 8, while reducing the malondialdehyde content (37%, 46%, and 26%). In summary, applying 5 mg kg−1 of Se to the soil is beneficial for wheat growth. The results of this study reveal the response of wheat to soil-applied Se in terms of wheat growth and physiological characteristics, rhizosphere and non-rhizosphere soil properties, and changes in the morphology of Se.

1. Introduction

As an essential trace element for the human body, selenium (Se) plays an important role in regulating the body’s redox balance, antioxidant defense, immune system, and other aspects [1]. Insufficient Se intake can cause health disorders in the human body, including diseases related to the oxidative stress system, reducing fertility and immune function, and increasing risk of cancer, etc. [2,3]. Selenium deficiency has been reported in over 40 countries [4], such as volcanic areas of the former Yugoslavia, Poland, China, and Russia [5]. According to a survey, there are 5.0–1.1 billion people worldwide who lack Se to varying degrees, accounting for 15% of the total population [6]. The insufficient intake of Se in the daily diet of the human body is mainly due to low total Se content in soil or low bioavailability of Se in soil, resulting in low Se content in crops, and then affects human health [7,8]. To increase Se nutrition level of the population, biofortification technology has been widely applied in agricultural production to cope with the issue of Se deficiency [9,10].
In crop production, selenium fertilizer is often used to enhance plant Se content and resistance to abiotic stresses such as drought [11]. Previous studies have reported the beneficial effects of Se on plant growth and development, such as in wheat, maize, rice, barley, and quinoa [12,13,14,15,16]. Sadak and Bakhoum [16] demonstrated that foliar spraying of Se, especially at a concentration of 50 mg L−1, significantly enhanced the growth and productivity of quinoa plants under water stress. Gorni et al. [17] showed that Se improved growth parameters and yield of maize plants by promoting total carotenoids and antioxidant metabolism under water shortage stress. In another study, selenium application (10 μmol L−1) increased the concentration of chlorophyll and carotenoids in sugarcane leaves and improved CO2 assimilation rate, stomatal conductance, and internal CO2 concentration [18]. Many studies have confirmed that low concentrations of Se are beneficial to plants. However, excessive levels of Se may be toxic to plants, leading to metabolic disorders, growth retardation, yellowing, necrosis, reduced protein biosynthesis, impaired function, and altered uptake and translocation of essential nutrients [19]. Wheat (Triticum aestivum L.) has received a lot of attention as the staple food for more than 30% of the world population [20]. According to Chinese Health Industry Standard (WS/T 578.3-2017), dietary recommended intakes of Se are 60–400 μg kg−1. However, the average Se concentration in wheat grain in China is 64.6 μg kg−1, which is not sufficient to meet the population’s health demand for Se [21]. The production of Se-rich wheat grain has become an effective measure to increase the dietary Se intake in many Se-deficient areas. Currently, the effects of exogenous Se application on the growth and Se content of wheat have been investigated [12,22,23], but the mechanism of transport and transformation of exogenous Se in the soil-wheat system after its application is not clear. Meanwhile, root and rhizosphere soil interactions play an important role in the effectiveness and mobility of soil nutrients. Therefore, an experiment needs to be carried out to investigate time-dependent changes in the absorption, transformation, and distribution of Se in wheat under agronomic biofortification measures.
It is well documented that root-soil interactions in the rhizosphere play a key role in controlling element bioavailability to plants. The bioavailability of Se in soil depends not only on total Se concentration but also on its speciation [7,24]. Based on water solubility and bonding strength, soil Se fractions can be divided into soluble (SOL-Se), exchangeable (EXC-Se), iron–manganese oxide-bound (FMO-Se), organic matter-bound Se (OM-Se), and residual (RES-Se) Se [8]. Both SOL-Se and EXC-Se can be easily taken up by plants, which is regarded as available Se [25,26]. Liu et al. [27] found a significant increase of SOL-Se and EXC-Se content in the rhizosphere soil of L-selenocysteine-treated wheat. The study found that phosphate ions can displace Se(IV) from soil fixed sites and enhance the concentration of Se in the soil solution, thereby improving the bioavailability of Se [28]. In addition, Kikkert et al. [29] demonstrated that the presence of sulfate ions enhances the partitioning of Se in soil solution because sulfate competes with Se(VI) for the same adsorption sites on soil components. Plants also have the ability to transform element fractions for easier uptake through root exudation or pH changes in the rhizosphere [30,31]. Previous studies have analyzed elements such as zinc, iron, manganese, phosphorus, arsenic, and mercury [32,33,34,35], while there is relatively little research on Se. The geochemical cycle of Se in soil is affected by soil pH, microbial activity, electron acceptors and donors, adsorbent and competitive ions, and other factors [7,25,36]. Matos et al. [37] found that the negative charge on soil particle surfaces typically increases with rising pH, leading to enhanced electrostatic repulsion between selenate and selenite ions and the negative charges, thereby promoting the release of Se from the soil solid phase and increasing its bioavailability. Wang et al. [38] found that soil Se can be adsorbed, chelated, or complexed by organic compounds, thereby reducing the amount of available Se in the soil. In the rhizosphere environment, these factors are different from the non-rhizosphere environment. Given that the rhizosphere soil solution is the medium through which the element exerts its effects on plants [39,40], the analysis of the rhizosphere soil solution can provide valuable information concerning the potential availability of Se in the soil.
In the present study, a rhizobag experiment was conducted to systematically investigate the dynamic effects of sodium selenite on the rhizospheric microenvironment, growth, and antioxidative responses of wheat. The specific objectives of this study were (1) to monitor the temporal variation in the bioavailable Se and several physicochemical parameters in the rhizosphere soil solution during the different growth stages of the wheat plants, (2) to determine the effect of sodium selenite on Se accumulation and distribution in different wheat parts, as well as Se speciation in soil, and (3) to investigate the changes in plant biomass and the antioxidant enzyme activities in wheat leaves under different Se levels. The results of the study were anticipated to obtain the optimal Se application dosage based on the utilization efficiency of exogenous Se and plant physiological response parameters.

2. Materials and Methods

2.1. Experimental Materials

The soil, comprising 10% clay, 45% silt, and 45% sand, was collected from the surface layer (0–20 cm) in Yongjia County of Wenzhou, Zhejiang Province, China. The principal soil properties were pH (H2O), 4.95; organic carbon, 13.63 g kg−1; organic nitrogen, 1.48 g kg−1; total Se, 0.23 mg kg−1; soluble Se, 2.82 µg kg−1; exchangeable Se, 0.02 mg kg−1; and organic matter-bound Se, 0.03 mg kg−1. The soil was air-dried, ground, and passed through a 2 mm sieve. Chemical fertilizers, including 150 mg N kg−1 dry soil as urea, 30 mg P kg−1, and 75.5 mg K kg−1 as K2HPO4, were applied into the soil and mixed thoroughly. Wheat seed (Triticum aestivum L., Wenmai No. 10) was provided by the agricultural technological station (Wenzhou, China).

2.2. Experimental Design

There were five Se treatments, including 0.0, 1.0, 2.5, 5.0, and 10 mg Se kg−1, which were achieved via irrigation with different concentrations of selenite solution. The soil was wetted with deionized water and placed in plastic boxes for one month to stabilize the soil Se [41]. The Se-amended soil was air-dried, thoroughly mixed, and passed through a 2 mm sieve prior to the experiment. A cylindrical rhizobag (30 µm nylon mesh, 10 cm diameter, and 9 cm height) was filled with 120 g of Se-amended soil and then placed in the center of a PVC pot (18 cm diameter, 11 cm height) filled with 360 g of dry weight of the same soil. In this system, the surfaces of soil inside and outside the rhizobag were at the same level, which was designed similar to Zeng et al. [42]. The pots were arranged in a completely randomized block design, all potted plants were randomized to ensure the accuracy of the test results and to eliminate subjective bias. A total of 75 pots were used for the experiment and were arranged in a 5 × 15 pattern. Each row and column was placed randomly, and grown under natural daylight conditions.
We sowed 25 sterilized seeds evenly in each rhizobag at a depth of 2.0–2.5 cm. After germination, the seedlings were thinned to 15 plants per pot. Rhizobags were used to distinguish between rhizosphere and non-rhizosphere soil. To ensure the normal progress of the experiment, 15 replicates were prepared for each treatment, and 4 pots with uniformly grown and healthy plants were selected from each treatment at 4, 6, and 8 weeks after planting. During the plant growth period, tap water was supplied daily to maintain the soil moisture at around 65% of the water holding capacity. To ensure the proper conduct of the experiment, each treatment was prepared with fifteen replications, and each treatment selected four potted plants with uniform and good growth at 4, 6, and 8 weeks after planting. Tap water was supplied daily during plant growth to maintain soil moisture level near 65% water holding capacity.

2.3. Sampling

Pot experiments were conducted in May 2019 in the greenhouse of Beijing Forestry University. Every time, approximately 3 g of fresh wheat leaf from each pot were firstly harvested, rinsed with deionized water, blotted, weighed, and immediately frozen in liquid nitrogen or stored at −80 °C for enzyme activity assays when sampling. Remaining plants were then collected by cutting the shoots at the soil surface and the roots were separated from the rhizobag soils. Shoots and roots were washed, blotted, weighed, oven-dried, weighed again and pulverized to a fine powder for the content of Se analysis. Soil in the rhizobags was collected and regarded as rhizosphere soil. The soil in the pot 5 mm away from the rhizobag was collected, mixed, and considered to be non-rhizosphere soil. All of the soil samples were air-dried, ground, and sieved through 2 mm and kept for further analysis.

2.4. Analysis Methods

2.4.1. Se Speciation in Soil Solution

To evaluate Se speciation and concentration in the soil solution, we used 0.01 M CaCl2 solution, which is often used to assess the bioavailability of plant nutrients in soils [43,44]. Twenty grams of soil was mixed with 50 mL of 0.01 M CaCl2 solution in 100-mL centrifuge tubes and shaken for 2 h at 20 °C in darkness on a reciprocal shaker. The mixture was then centrifuged at 3000 rpm for 25 min, and the supernatant was filtered over 0.45 µm membrane.
The extracted soil solutions were separated into several sub-samples. The pH and dissolved organic carbon (DOC) were determined using a pH meter (PHB-4) and TOC analyzer (Shimadzu, Kyoto, Japan), respectively. The detailed procedure for soil Se speciation analysis in this study was described by Kulp and Pratt [45]. Inorganic Se concentration was measured by heating the extract for 30 min at 100 °C in 6 M HCl solution. Total Se concentration was determined by adding 2 mL HNO3/70% HClO4 (1:1) mixture to 5 mL extract, heating the solution for 30 min at 170 °C, and then for 30 min at 100 °C in 6 M HCl solution.

2.4.2. Se Fractionation in Soil

Fractionation of Se was determined for soil samples using sequential extraction with deionized water, 0.1 M KH2PO4/K2HPO4 (pH 7.0), and 0.1 M NaOH [7]. The sequential extraction was carried out as follows:
(1)
Soluble Se (SOL-Se): 10 mL of deionized water was added to 2 g soil in a 15 mL polycarbonate centrifuge tube. After shaking for 2 h at 200 cpm, the mixture centrifuged for 30 min at 5000 rpm and filtered through a 0.45 µm filter. The supernatant was separated from the residue and provided an estimate of soluble Se. The remaining precipitate was used for the next step of extraction.
(2)
Exchangeable Se (EX-Se): 10 mL of 0.1 M KH2PO4/K2HPO4 (pH 7.0) was added to the above tube and shaken for 2 h, and the sampling procedure was repeated.
(3)
Organic matter-bound Se (OM-Se): 10 mL of 0.1 M NaOH was added to the remaining soil. The mixture was shaken for 30 min, heated in a water bath at 90 °C for 2 h with intermittent shaking. The suspensions were again centrifuged and filtered, and the supernatant was collected. The sample was rinsed once with 10 mL of deionized water and shaken for 30 min. After centrifugation and filtering, the supernatants were combined.
Five milliliters of the supernatants in each step were transferred to graduated tubes, treated with 2 mL of HNO3/70% HClO4 (1:1) mixture, heated for 30 min at 170 °C, and then reduced using 6 M HCl solution and cooled to detect.

2.4.3. Se Concentrations in Plant

The determination of total Se referred to national standards on the determination of Se in foods (GB/T 5009.93-2017 [46]). Plant samples were digested in a mixture of concentrated HNO3 and HClO4 (V1:V2 = 9:1) on a hot plate below 170 °C until the solution became clear. After cooling, 6 M HCl was added and heated for about 10 min at 100 °C to reduce Se (VI) to Se (IV).

2.4.4. Determination of Se Concentration

Se concentration in the solution was determined by hydride generation-atomic fluorescence spectrometry (HG-AFS 8230, Titan Instrument Co., Ltd., Beijing, China). Quality control was monitored using reagent blanks, duplicated samples, and national standard reference materials (GBW10010 and GBW08513 for plant and GBW07410 for soil; obtained from the National Standard Sample Study Center in Beijing, China). Ten percent of the samples in each batch were randomly selected as replicates. The results showed good agreement between the measured values and the certified reference values, with the recoveries between 94% and 105%. The relative standard deviation in duplicated samples was <6%.

2.4.5. Assay of Enzyme Activities and Lipid Peroxidation

The activities of superoxide dismutase (SOD), catalase (CAT), and glutathione peroxidase (GPx), and malondialdehyde (MDA) content were determined by microplate reader using different biochemical kits (No. SOD-1-Y, CAT-1-Y, GPX-1-W, and MDA-1-Y; Suzhou Keming Biotechnology Co., Ltd., Suzhou, China), according to the manufacturer’s protocols. The absorbance from the activity of SOD was 560 nm, which was expressed as U g−1 FW, and that of CAT was 240 nm, which was expressed as nmol min−1 g−1. The absorbance value at 340 nm was recorded, and the unit was expressed as nmol min−1 g−1 for GPx activity. For MDA content, the absorbance was recorded at 532 nm and 600 nm, and the unit was expressed as nmol g−1.

2.5. Data Analysis

Statistical analyses were conducted using the SPSS 25.0 software program. The data were first tested for normality. The differences of biochemical parameters in soils and plants between the treatments were determined using one-way analysis of variance (ANOVA) followed by a homogeneity test and the Duncan’s test. All tests for significance were two-sided, and p < 0.05 was considered statistically significant. Data reported in this paper are presented as mean values ± standard deviations of four replicates and were plotted with SigmaPlot 12.0.

3. Results

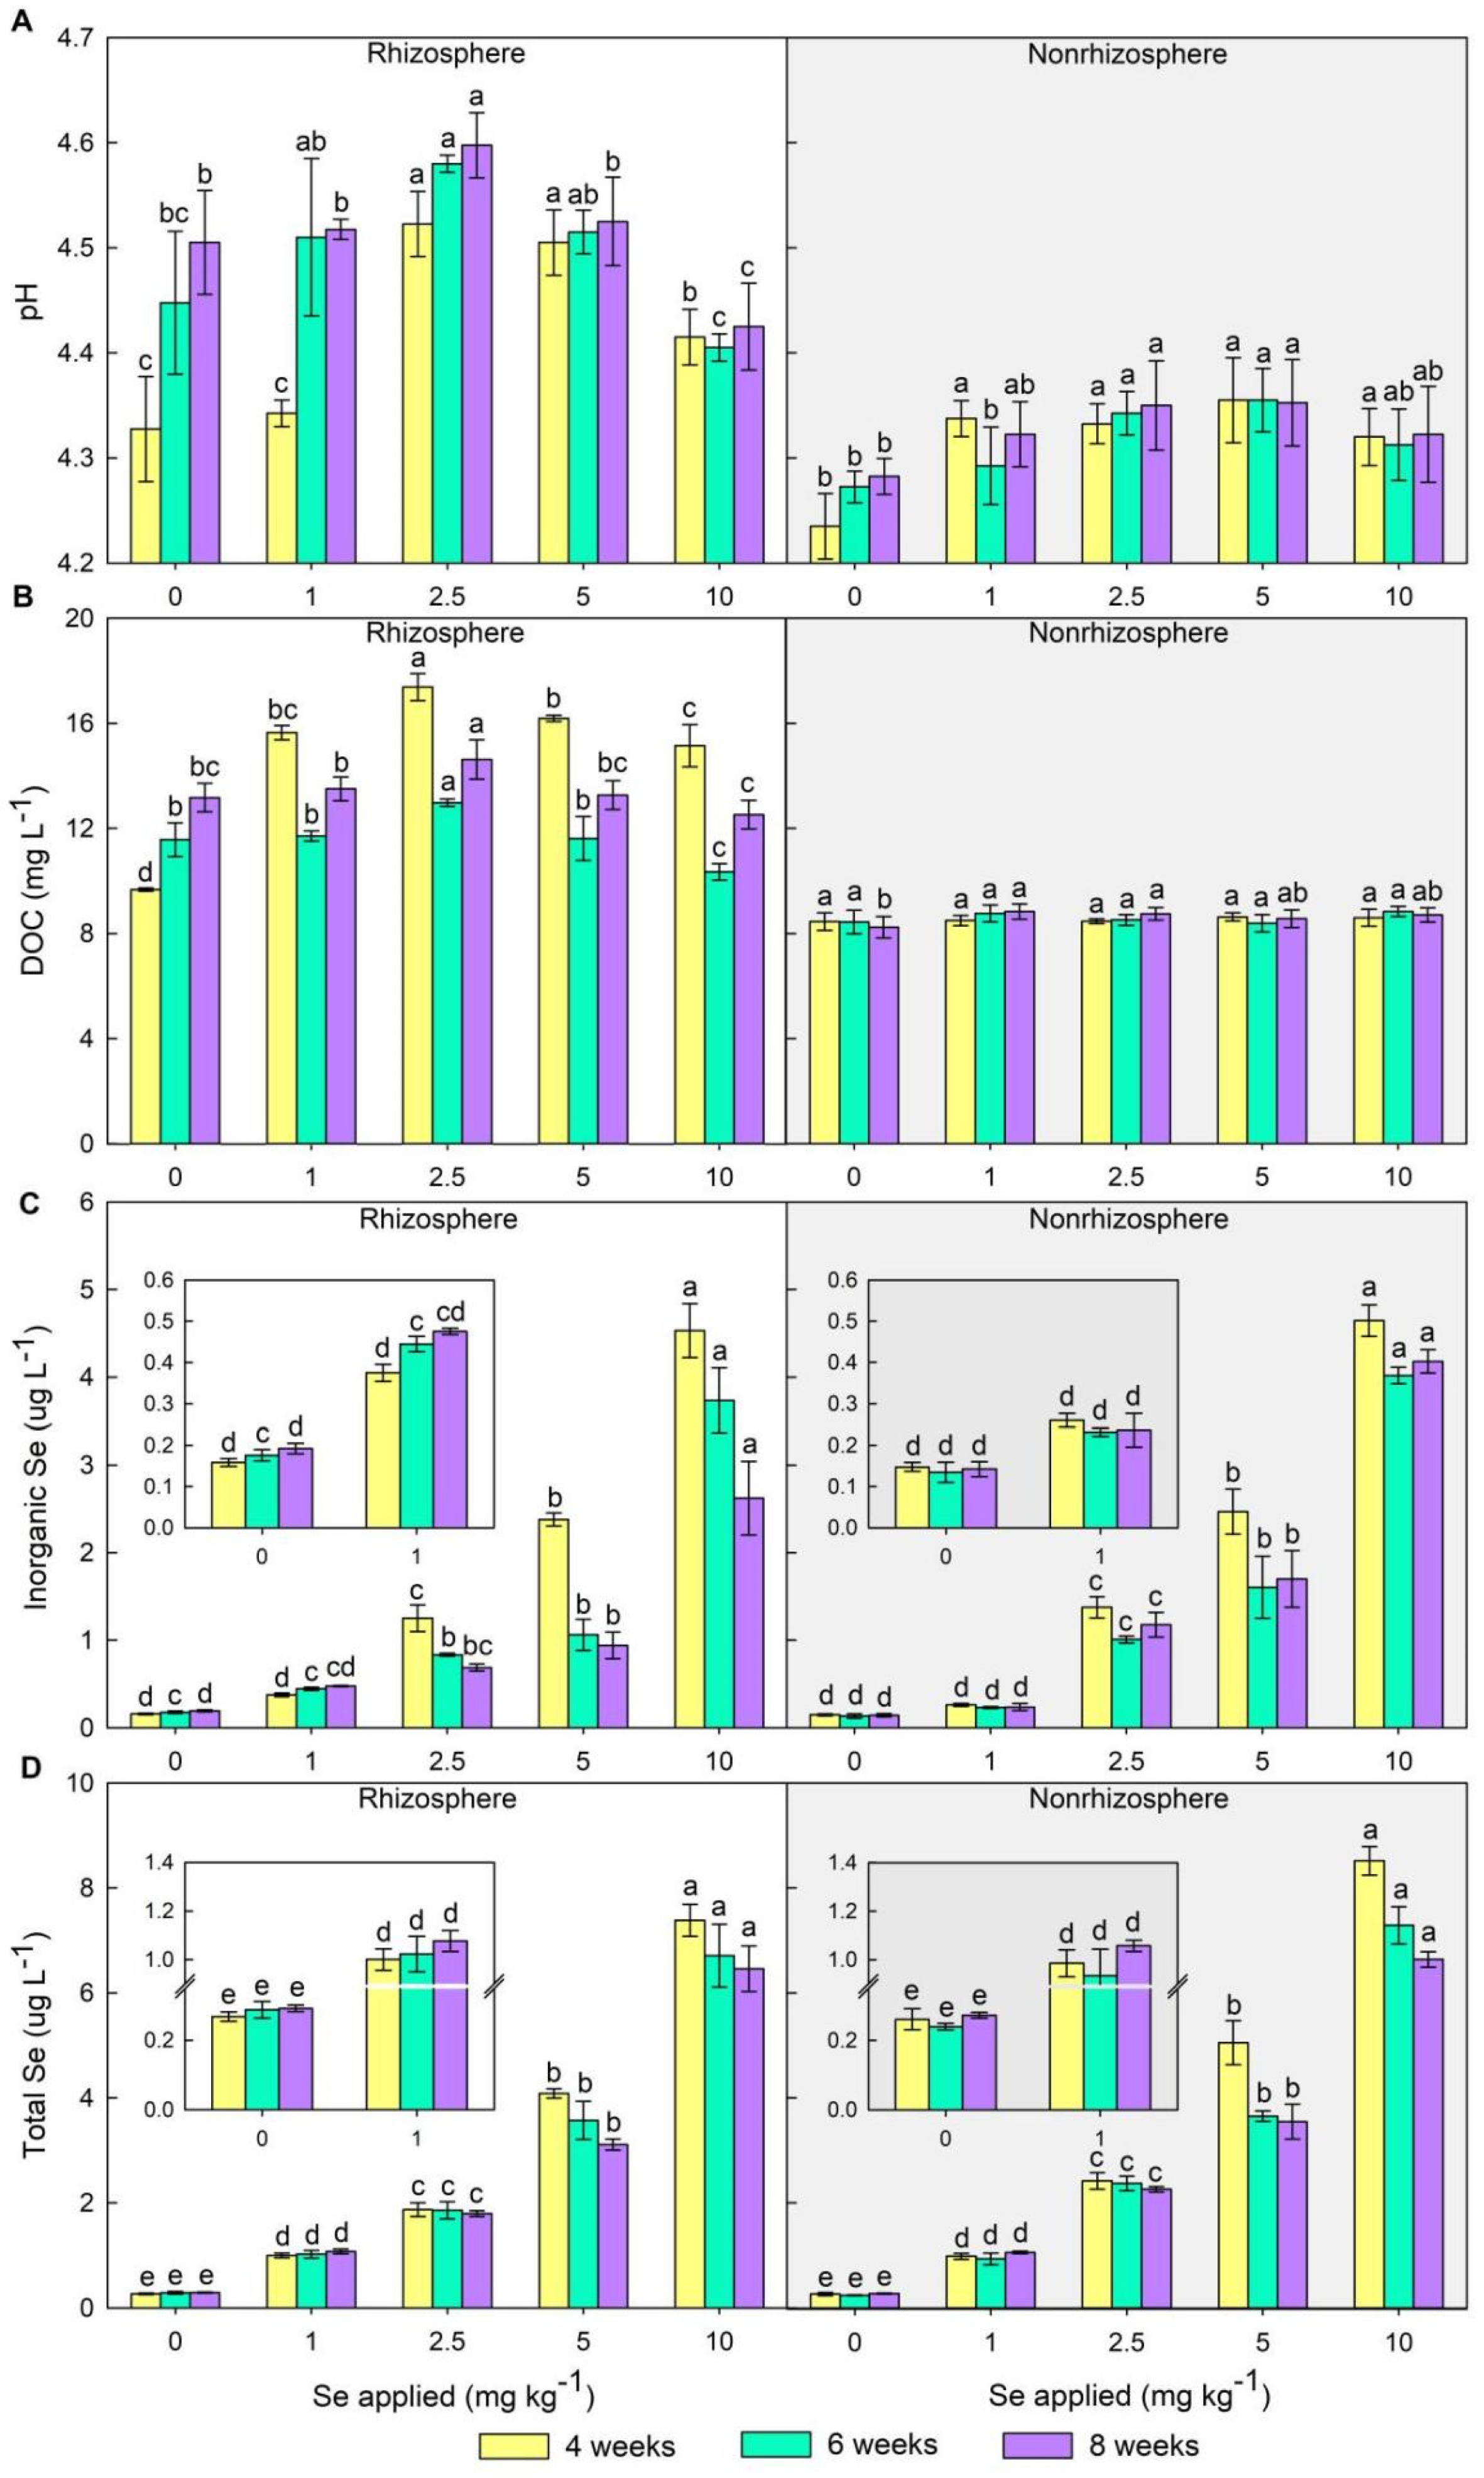
3.1. Changes of Chemical Properties in Soil Solution

3.1.1. pH and DOC

The pH and DOC in soil solution of rhizosphere and non-rhizosphere varied with Se supplement dosages and growth stages (Figure 1A,B). Compared with the control, in non-rhizosphere soil solution, the pH presented fewer variations among different Se treatments and increased 0.02–0.12 units. The pH in rhizosphere soil solution increased at first and then descended with the exogenous Se concentration increasing and achieved the highest value at a level of 2.5 mg Se kg−1, which significantly increased 0.09–0.20 pH units (F(4, 19) = 2.338, p < 0.05) compared to the control. The pH in rhizosphere soil solution (4.26–4.64) gradually increased during the wheat growth period except for the 10 mg Se kg−1 treatment and was significantly higher than that in non-rhizosphere soil solution (4.19–4.41) (p < 0.05).
The DOC concentrations in rhizosphere soil solution were significantly higher than those in non-rhizosphere soil solution. The DOC concentrations in non-rhizosphere soil solution did not differ significantly among all treatments in three stages except the control. In the three stages, with the increase of exogenous Se concentration, the DOC concentrations in rhizosphere soil solution increased first and then decreased. It reached a significant maximum at the level of 2.5 mg Se kg−1 and was 179.7%, 112.2%, and 111.0% of that of CK at the WAP4, WAP6, and WAP8 stages, respectively.

3.1.2. Inorganic Se and Total Se

As shown in Figure 1C, when the concentration of exogenous Se supplement was 1 mg kg−1, inorganic Se concentration in rhizosphere soil solution had no significant change compared with the control treatment and increased 2.46 times against that in the control; inorganic Se concentration in rhizosphere soil solution increased with the growth of wheat at three stages and was higher than that of non-rhizosphere soil solution. Selenite supplement significantly improved (F(4, 19) = 70.703, p < 0.05) inorganic Se concentration in rhizosphere soil solution under high Se dose (≥2.5 mg kg−1). When the application amount of exogenous Se was 2.5, 5, and 10 mg kg−1, inorganic Se concentration in rhizosphere soil solution was 5.3, 8.3, and 20.7 times that of the control, respectively; inorganic Se concentration in rhizosphere soil solution decreased with wheat growth and was lower than that of non-rhizosphere soil solution.
Total Se concentrations in rhizosphere and non-rhizosphere soil solution increased (F(4, 19) = 250.979, p < 0.05) significantly with the increase of exogenous Se concentration (Figure 1D). At WAP4, total Se concentrations in rhizosphere soil solution of different treatments were 0.27 ± 0.01 µg L−1 (control), 1.00 ± 0.04 µg L−1 (1 mg Se kg−1), 1.87 ± 0.13 µg L−1 (2.5 mg Se kg−1), 4.08 ± 0.09 µg L−1 (5 mg Se kg−1), and 7.38 ± 0.31 µg L−1 (10 mg Se kg−1). With the growth of wheat, the dynamic change process of total Se concentration in rhizosphere soil solution is consistent with that of inorganic Se concentration in rhizosphere soil solution. When the application amount of exogenous Se was 0 and 1 mg kg−1, total Se concentration in rhizosphere soil solution increased with the growth of wheat, but total Se concentration in non-rhizosphere soil solution decreased first and then increased with the growth. And total Se concentration in rhizosphere soil solution was higher than that in non-rhizosphere soil solution. When the application amount of exogenous Se was 2.5, 5, and 10 mg kg−1, total Se concentration in rhizosphere and non-rhizosphere soil solution decreased with the growth of wheat, and total Se concentration in non-rhizosphere soil solution was higher than that in rhizosphere soil solution.

3.2. Changes of Se Fractions in Soil

Table 1 and Table 2 show the contents and proportions of three Se fractions in rhizosphere and non-rhizosphere soil. The contents of three Se fractions in rhizosphere and non-rhizosphere soil significantly increase with the increase of exogenous Se concentration (F(4, 19) = 582.06, p < 0.05). As can be seen, the contents of three Se fractions in rhizosphere and non-rhizosphere soil among all treatments followed the sequence OM-Se > EX-Se > SOL-Se. Exogenous Se concentration (from control to 10 mg Se kg−1) increases the proportion of the sum of three Se fractions to total Se in rhizosphere and non-rhizosphere soil in three periods, with the average range from 20.85% to 56.46% at WAP4, from 19.8% to 54.6% at WAP6, and from 17.9% to 53.0% at WAP8. Water-soluble Se content in rhizosphere and non-rhizosphere soil in the control treatment increases slightly with the growth of wheat, whereas it gradually decreases with the growth of wheat under high Se dose (≥2.5 mg kg−1). The contents of EX-Se and OM-Se in rhizosphere and non-rhizosphere soil among all treatments decreased continuously with the growth of wheat.
The contents of three Se fractions in rhizosphere soil under control treatment were higher than those in non-rhizosphere soil. When the application amount of exogenous Se was 1 mg kg−1, SOL-Se content in rhizosphere soil (7.35–7.56) was lower than that in non-rhizosphere soil (8.14–8.88), while the content of EX-Se (0.08–0.09) and OM-Se (0.14–0.15) in rhizosphere soil was higher than that in non-rhizosphere soil (0.08, 0.13–0.14). Under a high Se dose (≥2.5 mg kg−1), the contents of three Se fractions in non-rhizosphere soil were higher than those in rhizosphere soil.

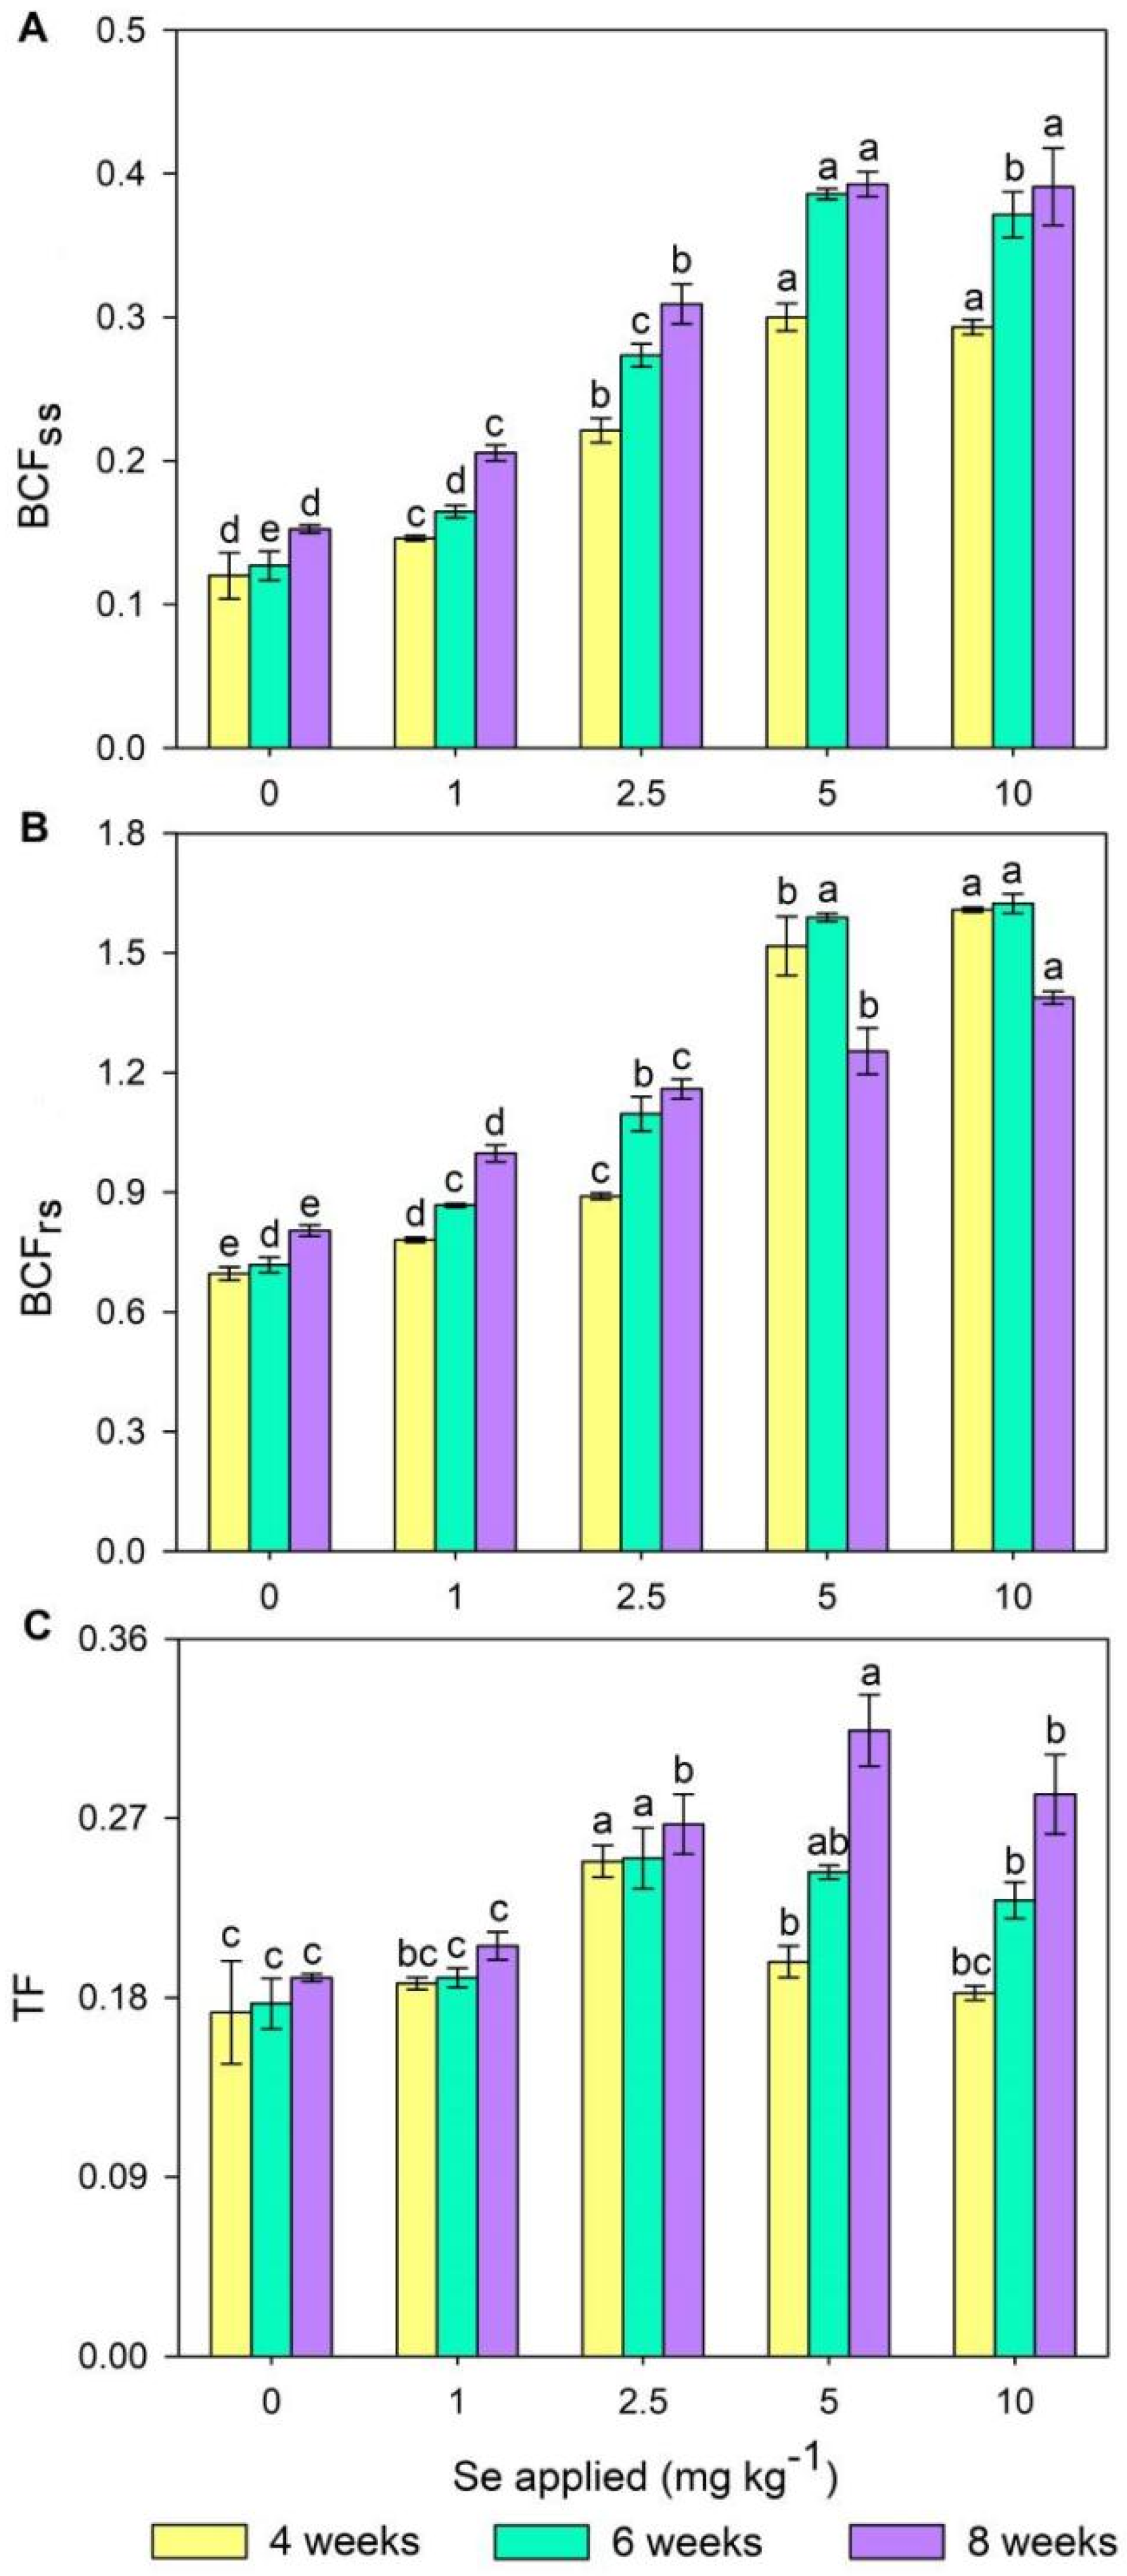
3.3. Biomass, Se Accumulation, and Translocation in Wheat Plants

Results showed that the biomass of wheat shoots and roots increased at first and then descended as the level of applied Se increased from 0 to 10 mg kg−1 soil at WAP4 but was insignificant (Table 3). At WAP6 and WAP8, under low levels of Se (≤5 mg kg−1) treatments, biomass of shoot and root showed a clear increase with increasing Se doses. However, over the same period of time, wheat growth was inhibited at a level of 10 mg Se kg−1, with the plant showing typical symptoms of Se toxicity. Compared with the control, in the 10 mg Se kg−1 treatment, biomass of shoot and root was decreased by 11.6% and 12.8% at WAP8.
Selenite supplement exerted remarkable effects on Se levels in different tissues of wheat at three stages (F(4, 19) = 11.653, p < 0.05). Se content in root was significantly higher than that in shoot. At WAP4, Se content in shoots under 1, 2.5, 5, and 10 mg Se kg−1 treatments was 6, 17, 49, and 104 times higher, respectively, than that under control; 5, 12, 43, and 98 times, respectively, in roots. As shown in Table 3, Se content in shoots gradually increased with the growth of wheat; it in roots also increased under low levels of Se (≤2.5 mg kg−1) treatments, while it decreased from 6 to 8 weeks after planting under high levels of Se (≥5.0 mg Se kg−1) treatments.
The bioaccumulation factor (BCF) and translocation factor (TF) are regarded as two important indexes to assess the translocation potential of elements in soil-plant systems. So the current study analyzed the bioaccumulation factor of shoot (BCFss) and root (BCFrs) and the translocation factor from root to shoot (TF) among all treatments in three periods. The bioaccumulation factor was the ratio of Se concentration in wheat tissues to that in soil, and the translocation factor was the ratio of Se concentration in wheat shoots to that in roots.
The results demonstrated that the bioaccumulation factor for shoot (0.12–0.39) was significantly lower than (F(4, 19) = 582.06, p < 0.05) that for root (0.70–1.62). The bioaccumulation factor for shoots increased first and then decreased with the increase of exogenous Se concentration and constantly increased along with the growth of wheat. It reached the peak at a level of 5 mg Se kg−1 and was the lowest in the control treatment. At WAP4, WAP6, and WAP8, BCFss of 5 mg kg−1 Se application were 2.5, 3.0, and 2.6 times higher than those of BCFss in control treatment, respectively. The bioaccumulation factor for root increased with the increase of exogenous Se concentration. Under low levels of Se (≤2.5 mg kg−1) treatments, BCFrs increased with the growth of wheat. When the Se application rate was 5 mg kg−1 and 10 mg kg−1, BCFrs was greater than 1 and increased first and then decreased with the growth of wheat at WAP8, improving by 1.21 times compared to the control treatment (Figure 2).
The translocation factor for shoots increased first and then decreased with the increase of exogenous Se concentration and was less than 1. At WAP4 and WAP6, TF was the highest under the treatment of 2.5 mg Se kg−1, which was 0.44 and 0.41 times higher than the control treatment, respectively. It was the highest under the treatment of 5 mg Se kg−1. At WAP8, which was 0.65 times higher than the control treatment. The translocation factor for shoot is increasing with the growth of wheat, meaning Se in root is continuously transmitted to shoots.

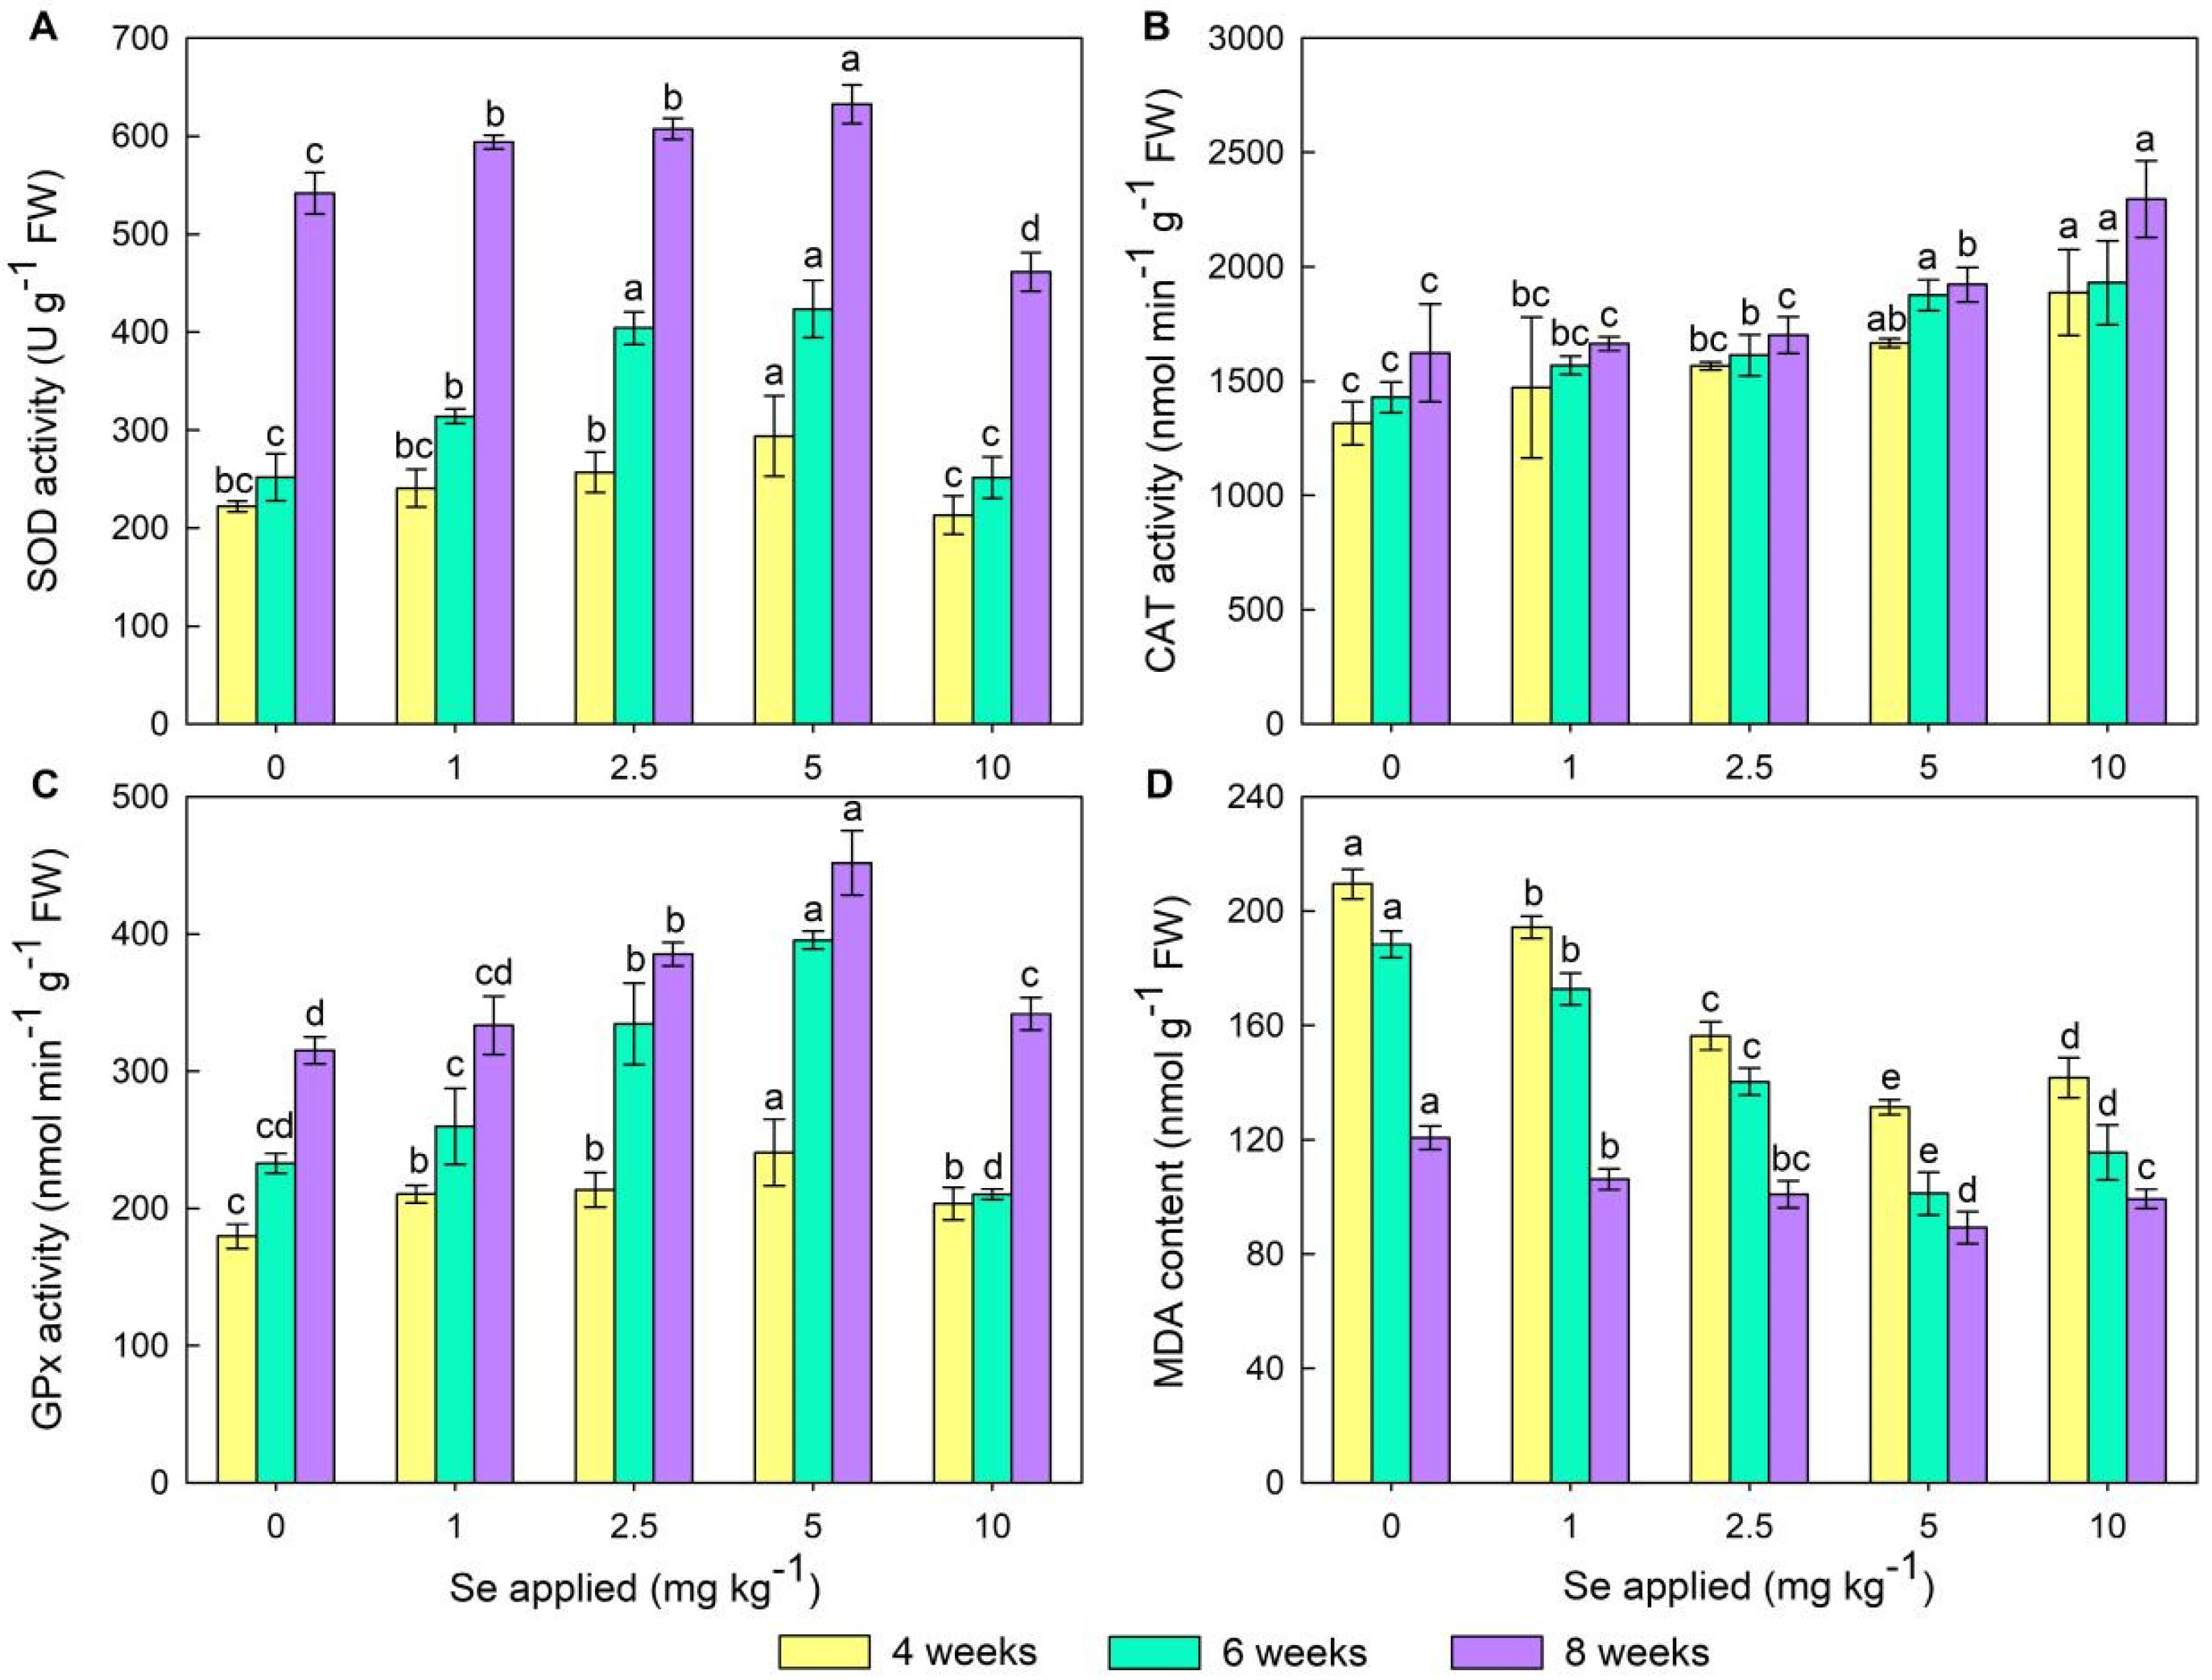
3.4. Physiological Indexes Analysis in Wheat Leaves

The effects of different Se treatments on the antioxidant enzyme activities and lipid peroxidation level in leaves of wheat plants were shown in Figure 3. The activities of SOD (Figure 3A) and GPx (Figure 3C) in wheat leaves exhibited similar changes in response to Se supplement, which increased progressively with increasing Se concentrations (1–5 mg kg−1) and then presented a significant decline at 10 mg kg−1 Se (F(4, 19) = 7.071, p < 0.05). Compared with the control, activities of SOD and GPx reached the highest value under a level of 5 mg Se kg−1, increasing by 32% and 34%, respectively, at WAP4; by 68% and 70%, respectively, at WAP6; and by 17% and 43%, respectively, at WAP8. However, the trend observed for CAT was different from those observed for SOD and GPx. As shown in Figure 3B, CAT activity increased with increasing Se concentrations (0–10 mg kg−1) and reached the maximum at 10 mg kg−1 Se. Under low Se dose (≤2.5 mg kg−1), CAT activity in the leaves of wheat plants increased, but the difference was not pronounced among the treatments. Higher Se concentrations (≥5.0 mg kg−1) resulted in significant enhancement in CAT activity (F(4, 19) = 6.576, p < 0.05), with increases ranging from 27% to 43% at WAP4, from 31% to 35% at WAP6, and from 18% to 41% at WAP8. The MDA content decreased at first and then steadily increased with the Se concentration increasing and reached the minimum at 5 mg kg−1 Se (Figure 3D). Selenite supplementation at concentrations of 1–10 mg Se kg−1 significantly lowered lipid peroxidation levels in terms of MDA content as compared to the control (F(4, 19) = 27.748, p < 0.05), with reductions of 7–37% at WAP4, 8–46% at WAP6, and 12–26% at WAP8.
Simultaneously, it was observed that the activities of SOD and GPx in the leaves of wheat plants significantly increased from the WAP6 stage to the WAP8 stage (F(4, 19) = 7.071, p < 0.05), regardless of the levels of Se supplement; in contrast, MDA content significantly decreased from the WAP6 stage to the WAP8 stage (F(4, 19) = 6.576, p < 0.05). The SOD, CAT, and GPx activities in the leaves of wheat plants at the WAP8 stage in 0, 1, 2.5, 5, and 10 mg Se kg−1 treatments were 2.15, 1.89, 1.50, 1.49, and 1.84 times higher; 1.13, 1.06, 1.05, 1.02, and 1.19 times higher; and 1.35, 1.28, 1.15, 1.14, and 1.63 times higher, respectively, when compared to the WAP6 stage. Conversely, MDA content in the leaves of wheat plants at the WAP8 stage in 0, 1, 2.5, 5, and 10 mg Se kg−1 treatments was 0.64, 0.61, 0.72, 0.88, and 1.84 times lower compared to the WAP6 stage.

4. Discussion

4.1. Effects of Se Treatments on Soil Se Availability

In the present study, the SOL-Se, EX-Se, and OM-Se content in rhizosphere soil tended to increase significantly as the amount of exogenous Se addition increased (Figure 1D). The main form of Se present was OM-Se (Table 2), which is similar to the findings of Li et al. [39]. Meanwhile, the available Se (SOL-Se and EX-Se) accounted for no more than 15% of the total Se content. Chen et al. [47] found that the proportion of effective Se to total Se was less than 20% in rhizosphere soils without the addition of Se and less than 30% in rhizosphere soils with added Se (0.5 mg kg−1). Wang et al. [48] found that the proportion of effective Se to total Se was not more than 10% at different Se levels (0.07–1.23 mg kg−1). Meanwhile, this study found that the levels of the three forms of Se were higher in rhizosphere soil than in the non-rhizosphere soil in the control treatment. This is consistent with the results reported by Chen et al. [47]. Further studies found that both the pH and DOC content of rhizosphere soil solutions were higher than those of non-rhizosphere soil solutions and that increases in both the pH and DOC content influenced the effectiveness of soil Se. Many studies have found that the effectiveness of Se increases significantly in alkaline soils, while in acidic soils the effectiveness of Se is not obvious, or even some valence states of Se are immobilized; thus, increasing the soil pH is an important way to increase the effectiveness of soil Se [49]. An increase in the pH of the soil solution promotes the release of Se from soil particles to form Se(VI), which is favorable for plant uptake [50]. However, the effect of rhizosphere DOC on the effectiveness of Se in the rhizosphere is two-fold: it affects rhizosphere microbial activity to release immobilized Se through chemical reactions to increase soil Se effectiveness [51], and it also increases the formation of soil colloids, which adsorb free Se to anions on the surface of the colloids, thus decreasing the effectiveness of Se [52].
The present study revealed that the pH and DOC content in the rhizosphere soil solution showed a downward parabolic trend as the concentration of added Se increased (Figure 1A,B). Hageman et al. [53] reported that plants increase rhizosphere soil pH when soil is acidic. Huang et al. [54] found that the pH of rhizosphere soil solution increased 0.10–1.50 units compared to non-rhizosphere soil solution when they investigated the effect of iron film on the rhizosphere Se content of rice root surface (pH = 5.09), which is consistent with the results of the present study. Yan et al. [55] obtained the same results in their study of cadmium adsorption by Cd-resistant microorganisms in the rhizosphere soil of rice, which may be related to the charge balance at the soil-root interface [56]. And root secretions and the root litter of plants are important sources of rhizosphere DOC [57]. The decline of DOC under a high Se dose (10 mg kg−1) may be because high concentrations of Se are toxic to the wheat root system, which leads to a reduction in root activity and inhibition of root secretion. Furthermore, this may also be related to soil microbial activity. In high-Se soils, microbial respiration is intensified, which uses a large amount of DOM as an energy source and Se(VI) as an electron terminal receptor, thereby promoting the morphological transformation of Se and accelerating its binding to DOM [58].

4.2. Effects of Se Treatments on Wheat Growth and Se Absorption

In the present study, the dry weights of the shoots and roots of wheat exhibited a downward parabolic trend with increasing concentrations of exogenous Se application, indicating that the shoot and root growth and development of wheat were better at low Se (≤5 mg kg−1) levels, while high Se concentrations (10 mg kg−1) inhibited the growth of wheat. Consistent with the results of existing studies, Nawaz et al. [59] concluded that lower concentrations of applied exogenous Se (0.5 mg L−1) promoted the biochemical activities of plants in both normal and stressful environments. Dai et al. [9] demonstrated through rice potting experiments that lower levels of Se (<5 mg kg−1) significantly increased the growth and yield of rice. Moderate application of Se activates nitrate reductase and glutamine synthetase, which can stimulate nitrogen metabolism [60]. This stimulation favors an increase in nitrogen levels, which in turn favors plant development and growth, as well as the photosynthesis process and sugar metabolism [61]. Selenium competes for adsorption sites with other anions such as phosphate and sulfate, so Se application may increase phosphorus and sulfur levels and thus promote plant growth, a possibility that needs further verification [62,63]. Saeed et al. [64] used exogenous Se applications of 0, 10, and 20 mg kg−1 and found that the dry weights of the shoots and roots of wheat decreased as the exogenous Se concentration increased. Saffaryazdi et al. [65] found that applying a low concentration (1 mg kg−1) of exogenous Se promoted spinach growth, while high concentrations (2–10 mg kg−1) caused toxic effects. Silva et al. [66] found that when Se was applied at concentrations above 50 g ha−1, it caused toxic effects on cowpea, which may be because as the Se concentration increases, it stimulates or inhibits the enzyme activities in the plant, contributing to a stressful environment. In this study, the Se content in the wheat root was greater than that in the shoot under different exogenous Se concentrations. Selenite is mainly taken up by plants through in silico transporter proteins and also possibly through metabolism-dependent active process mechanisms via phosphate transporter proteins, resulting in its accumulation in the root system with minimal translocation to the shoot [67]. Guerrero et al. [68] found that only a small portion (10–20%) of selenium (IV) absorbed by the roots is transferred to the aboveground parts. This is because, compared to Se(VI), Se(IV) has lower mobility in xylem transport and can rapidly incorporate into proteins or be metabolized by thiol-containing enzymes in the plastids into volatile products (DMSe/DMD Se) [69]. Zhang [70] also came to a similar conclusion, i.e., selenite is poorly mobile and usually stays in the roots and converts to other forms.
Additionally, this study analyzed the bioaccumulation factor of aboveground (BCFss) and root (BCFrs) Se in wheat under exogenous Se application conditions, and the experimental results revealed that the shoot had a lower bioaccumulation coefficient than the root. Selenite accumulation in the shoot was lower, revealing Se(IV) is more readily converted to the organic state during plant uptake, hindering its transportation to the shoot [71]. In this study, we analyzed the ability of wheat to transfer Se from below to aboveground (the translocation factor (TF)). Our results showed that the TF exhibited a downward parabolic trend in response to increasing concentrations of exogenous Se application. Li et al. [72] came to the same conclusion when studying the effects of selenate and selenite on Se accumulation and morphology in lettuce. The present study also found that the TF values of sodium-selenite-treated wheat were all less than 1. This is in agreement with the findings of Fu [71], who reported that sodium selenite treatment resulted in higher accumulation capacity in wheat seeds and roots, leading to a TF value less than 1 for sodium selenite treatment.

4.3. Effects of Se Treatments on the Antioxidant System and MDA in Wheat Leaves

In this study, the soil application of Se to the soil significantly influenced the SOD, CAT, and GPx activities, as well as the MDA content (Figure 3). The activities of SOD and GPx essentially exhibited a quadratic parabolic curve, which indicated that the activities of these antioxidant enzymes were increased in wheat leaves at lower Se levels, while an opposite trend was observed at higher levels of soil Se. This trend was not observed for CAT. When the Se treatment concentration was increased from 1 to 10 mg kg−1, CAT activity also increased. Similar results were found for rice antioxidant enzyme activities in rice, including SOD, POD, and CAT [9], and for SOD and POD activities in melon after foliar application of Nano-Se [73]. Faced with a constantly fluctuating environment, higher plants have developed a series of physiological mechanisms to combat environmental stress, which is usually associated with higher reactive oxygen species levels [74]. Se is a catalytic center for GPx and plays an important role in the plant antioxidant defense system [75]. Antioxidant enzymes such as SOD, CAT, and GPx are crucial for organisms to defend against oxidative stress. These enzymes can protect the structure and function of the cell membrane by preventing oxidation and damage through scavenging reactive oxygen species [76] and reduce the production of MDA. For instance, moderate amounts of Se have been shown to attenuate oxidative stress under cadmium contamination environments, as evidenced by reductions in O2, H2O2, and malondialdehyde in rice tissues [77], and to modulate reactive oxygen metabolism [78]. In the present study, the MDA content did indeed show a decreasing trend at lower Se levels. However, earlier studies have also reported that excessive absorption of Se can generate toxic effects in plants [79,80], which represent plant growth [81], trigger oxidative damage [82], and cause photosynthetic dysfunction [83].
In recent decades, with the growing demand for Se, various Se-enriched products have emerged, such as Se-enriched tea, Se-enriched rice, and Se-enriched millet. The application of Se in agriculture has also become increasingly widespread. Although Se is important, its bioavailability in soil is typically low, which limits its effectiveness in enhancing crop yields and nutritional quality [84]. Selenium that remains in the soil after not being absorbed by plants may contaminate soil and water bodies. Zhai et al. [85] studied soil leaching and found that when the exogenous Se concentration was 1, 3, and 6 mg kg−1, the Se content in the soil leachate was 0.06–0.24, 0.25–0.84, and 0.60–1.65 mg L−1, respectively. Exceeding the standard limit of the Chinese groundwater environmental quality standards (<0.01 mg L−1) (GB/T 14848-2017), indicating that the leaching risk of Se in Se-amended soils is relatively high and poses certain environmental risks.
The data presented herein were derived from pot experiments; however, numerous conditions could not be compared with those in field conditions, such as light, temperature, and humidity. Secondly, the soil type and nutrient status in the field environment cannot be fully reflected, and the root growth of the plants may be limited. Therefore, it is possible for the data to differ from the field data. However, the study did not include measurements of the changes in microorganisms in the soil after Se treatment. Consequently, the effects of Se treatment on soil microorganisms cannot be interpreted at the microbial level. Consequently, a field experiment will be conducted to augment the study of soil microorganisms in a subsequent study.

5. Conclusions

This study analyzed the effects of sodium selenite on the rhizosphere microenvironment, growth, and antioxidant responses of wheat. The results showed that the rhizosphere pH and dissolved organic carbon were higher in the soil solution than in the non-rhizosphere soil solution and that the total and inorganic Se in the soil solution increased as the Se application concentration increased. The SOL-Se, EX-Se, and OM-Se contents in the soil also increased with increasing Se application concentration. The Se content of both the shoots and roots of wheat increased with increasing Se application concentrations. BCFss and TF showed a downward parabolic trend, whereas BCFrs increased with increasing Se application concentration. Low concentrations of Se (1–5 mg kg−1) promoted wheat growth and increased wheat dry weight, while high concentrations of Se (10 mg kg−1) inhibited growth. Low concentrations (1–5 mg kg−1) of exogenous Se also elevated the activities of SOD, CAT, and GPx in wheat leaves, which increased with increasing Se concentration, and decreased the MDA content, suggesting that moderate exogenous Se enhances the antioxidant capacity of wheat. Therefore, a moderate amount of exogenous Se (5 mg kg−1) could enhance the effectiveness of soil Se and promote the growth and antioxidant capacity of wheat.

Author Contributions

Conceptualization, F.Q. and Y.X.; methodology, F.Q. and Y.X.; software, X.Z.; validation, Y.X.; formal analysis, F.Z.; investigation, Y.X.; resources, Y.X.; data curation, H.Z. and H.L.; writing—original draft preparation, F.Q.; writing—review and editing, Y.X.; visualization, Y.X.; supervision, F.Q.; project administration, F.Q.; funding acquisition, Y.X. All authors have read and agreed to the published version of the manuscript.

Funding

This work was supported by the National Natural Science Foundation of China (Grant No. 41671499) and the Shanxi Province Science Foundation for Youths (Grant No. 20210302124245) and the Science and Technology Innovation Fund of Shanxi Agricultural University (No. 2020BQ65).

Data Availability Statement

The data presented in this study are available on request from the corresponding authors.

Acknowledgments

We give special thanks to Pang Xiaoming from the College of Biological Sciences and Technology, Beijing Forestry University, for his assistance in the experiment.

Conflicts of Interest

The authors declare no conflicts of interest.

References

  1. Benstoem, C.; Goetzenich, A.; Kraemer, S.; Borosch, S.; Manzanares, W.; Hardy, G.; Stoppe, C. Selenium and Its Supplementation in Cardiovascular Disease—What Do We Know? Nutrients 2015, 7, 3094–3118. [Google Scholar] [CrossRef] [PubMed]
  2. Rayman, M.P. The argument for increasing selenium intake. Proc. Nutr. Soc. 2002, 61, 203–215. [Google Scholar] [CrossRef] [PubMed]
  3. Whanger, P.D. Selenium and its relationship to cancer: An update. Br. J. Nutr. 2004, 91, 11–28. [Google Scholar] [CrossRef] [PubMed]
  4. Reis, A.R.; El-Ramady, H.; Santos, E.F.; Gratão, P.L.; Schomburg, L. Overview of Selenium Deficiency and Toxicity Worldwide: Affected Areas, Selenium-Related Health Issues, and Case Studies. In Selenium in Plants; Springer: Berlin/Heidelberg, Germany, 2017; pp. 209–230. [Google Scholar]
  5. Tan, C.; Nancharaiah, Y.V.; Hullebusch, E.V.; Lens, P.N.L. Selenium: Environmental Significance, Pollution, and Biological Treatment Technologies. In Anaerobic Treatment of Mine Wastewater for the Removal of Selenate and its Co-Contaminants; CRC Press: London, UK, 2016; pp. 886–907. [Google Scholar]
  6. White, R.R.; Hardaway, C.J.; Richert, J.C.; Sneddon, J. Selenium–Lead Interactions in Crawfish (Procambrus clarkii) in a Controlled Laboratory Environment. Microchem. J. 2012, 102, 91–114. [Google Scholar] [CrossRef]
  7. Wang, J.; Li, H.; Li, Y.; Yu, J.; Yang, L.; Feng, F.; Chen, Z. Speciation, Distribution, and Bioavailability of Soil Selenium in the Tibetan Plateau Kashin–Beck Disease Area—A Case Study in Songpan County, Sichuan Province, China. Biol. Trace Elem. Res. 2013, 156, 367–375. [Google Scholar] [CrossRef]
  8. Liu, N.; Wang, M.; Zhou, F.; Zhai, H.; Qi, M.; Liu, Y.; Liang, D. Selenium Bioavailability in Soil-Wheat System and Its Dominant Influential Factors: A Field Study in Shaanxi Province, China. Sci. Total Environ. 2021, 770, 144664. [Google Scholar] [CrossRef]
  9. Dai, Z.; Imtiaz, M.; Rizwan, M.; Yuan, Y.; Huang, H.; Tu, S. Dynamics of Selenium Uptake, Speciation, and Antioxidant Response in Rice at Different Panicle Initiation Stages. Sci. Total Environ. 2019, 691, 827–834. [Google Scholar] [CrossRef]
  10. Li, Y.; Ju, S.; Huang, J.; Wu, H.; Lin, Z.; Wang, Y.; Zhang, B. Novel Multifunctional Natural Selenium Supplement Development, In Vitro and In Vivo Analysis, and Risk-Benefit Assessment: Selenium-Enriched Chicory as a Case Study. J. Clean. Prod. 2023, 382, 135273. [Google Scholar] [CrossRef]
  11. Ding, M.; Kong, Y.; Liu, J.; Li, H.; Li, S.; Yang, Y.; Zhang, C.; Xiao, C.; Rehman, M.; Maqbool, Z.; et al. Evaluation of the Ameliorative Role of Soil Amendments and Selenium on Morphophysiological Traits, Oxidative Stress, and Quality Attributes of Wheat (Triticum aestivum L.) under Varying Drought Stress Conditions. J. Hazard. Mater. Adv. 2025, 18, 100693. [Google Scholar] [CrossRef]
  12. Yan, G.; Wu, L.; Hou, M.; Jia, S.; Jiang, L.; Zhang, D. Effects of Selenium Application on Wheat Yield and Grain Selenium Content: A Global Meta-Analysis. Field Crops Res. 2024, 307, 109266. [Google Scholar] [CrossRef]
  13. Peng, Z.; Sun, H.; Guo, Y.; Chen, Y.; Yin, X. Combining Depth and Rate of Selenium Fertilizer Basal Application to Improve Selenium Content and Yield in Sweet Maize. Agronomy 2025, 15, 775. [Google Scholar] [CrossRef]
  14. Geng, W.; Zhao, Y.; Mao, Z.; Wang, X.; Wu, N.; Xu, X. The Effects of Combined Use of Black Soldier Fly Larvae Frass Fertilizer with Exogenous Selenium on Rice Growth and Accumulation of Heavy Metals. J. Soil. Sci. Plant Nutr. 2022, 22, 5133–5143. [Google Scholar] [CrossRef]
  15. Cheng, C.; Li, Q.; Yi, Y.; Yang, H.; Coldea, T.E.; Zhao, H. Selenium Biofortification during Barley (Hordeum vulgare L.) Germination: Comparative Analysis of Selenate, Selenite, and Selenomethionine on Se-Protein Accumulation and Phenolic Acid Profile. Food Chem. 2025, 485, 144548. [Google Scholar] [CrossRef]
  16. Sadak, M.S.; Bakhoum, G.S. Selenium-Induced Modulations in Growth, Productivity, and Physiochemical Responses to Water Deficiency in Quinoa (Chenopodium quinoa) Grown in Sandy Soil. Biocatal. Agric. Biotechnol. 2022, 44, 102449. [Google Scholar] [CrossRef]
  17. Gorni, P.H.; Rodrigues, C.; Spera, K.D.; Correia, R.F.C.C.; Mendes, N.A.C.; Reis, A.R. Selenium Fertilization Enhances Carotenoid and Antioxidant Metabolism to Scavenge ROS and Increase Yield of Maize Plants Under Drought Stress. Plant Physiol. Biochem. 2025, 221, 109675. [Google Scholar] [CrossRef]
  18. Araujo, M.A.; Melo, A.A.R.; Silva, V.M.; Reis, A.R. Selenium Enhances ROS Scavenging Systems and Sugar Metabolism Increasing Growth of Sugarcane Plants. Plant Physiol. Biochem. 2023, 201, 107798. [Google Scholar] [CrossRef]
  19. Kamali-Andani, N.; Fallah, S.; Peralta-Videa, J.R.; Golkar, P.A. Comprehensive Study of Selenium and Cerium Oxide Nanoparticles on Mung Bean: Individual and Synergistic Effect on Photosynthesis Pigments, Antioxidants, and Dry Matter Accumulation. Sci. Total Environ. 2022, 830, 154837. [Google Scholar] [CrossRef]
  20. Consortium, T.I.W.G.S. A Chromosome-Based Draft Sequence of the Hexaploid Bread Wheat (Triticum aestivum) Genome. Science 2014, 345, 1251788. [Google Scholar]
  21. Liu, H.; Yang, Y.E.; Wang, Z.H.; Li, F.C.; Li, K.Y.; Yang, N.; Wang, S.; Wang, H.; He, G.; Dai, J. Selenium Content in Wheat Grains from Different Wheat Regions of China and Its Regulation. Chin. Agric. Sci. 2016, 49, 14. [Google Scholar]
  22. Nawaz, F.; Ashraf, M.Y.; Ahmad, R.; Waraich, E.A.; Shabbir, R.N.; Bukhari, M.A. Supplemental Selenium Improves Wheat Grain Yield and Quality Through Alterations in Biochemical Processes Under Normal and Water Deficit Conditions. Food Chem. 2015, 175, 350–357. [Google Scholar] [CrossRef]
  23. Di, X.; Qin, X.; Zhao, L.; Liang, X.; Xu, Y.; Sun, Y.; Huang, Q. Selenium Distribution, Translocation and Speciation in Wheat (Triticum aestivum L.) After Foliar Spraying Selenite and Selenate. Food Chem. 2023, 400, 134077. [Google Scholar] [CrossRef] [PubMed]
  24. Jiang, D.; Yu, F.; Huang, X.; Qin, H.; Zhu, Z. Effects of Microorganisms on Soil Selenium and Its Uptake by Pak Choi in Selenium-Enriched Lateritic Red Soil. Ecotoxicol. Environ. Saf. 2023, 257, 114927. [Google Scholar] [CrossRef] [PubMed]
  25. Li, J.; Liu, R.; Wu, B.; Zhang, C.; Wang, J.; Lyu, L.; Wu, F. Influence of Arbuscular Mycorrhizal Fungi on Selenium Uptake by Winter Wheat Depends on the Level of Selenate Spiked in Soil. Chemosphere 2022, 291, 132813. [Google Scholar] [CrossRef]
  26. Hinsinger, P.; Plassard, C.; Tang, C.; Jaillard, B. Origins of Root-Mediated pH Changes in the Rhizosphere and Their Responses to Environmental Constraints: A Review. Plant Soil. 2003, 248, 43–59. [Google Scholar] [CrossRef]
  27. Liu, R.; Zhao, L.; Li, J.; Zhang, C.; Lyu, L.; Man, Y.B.; Wu, F. Influence of Exogenous Selenomethionine and Selenocystine on Uptake and Accumulation of Se in Winter Wheat (Triticum aestivum L. cv. Xinong 979). Environ. Sci. Pollut. Res. 2023, 30, 23887–23897. [Google Scholar] [CrossRef]
  28. Zhou, X.; Yang, J.; Kronzucker, H.J.; Shi, W. Selenium Biofortification and Interaction with Other Elements in Plants: A Review. Front. Plant Sci. 2020, 11, 586421. [Google Scholar] [CrossRef]
  29. Kikkert, J.; Hale, B.; Berkelaar, E. Selenium Accumulation in Durum Wheat and Spring Canola as a Function of Amending Soils with Selenite, Selenate and/or Sulphate. Plant Soil. 2013, 372, 629–641. [Google Scholar] [CrossRef]
  30. Huang, Y.X.; Zhao, L.J.; Keller, A.A. Interactions, Transformations, and Bioavailability of Nano-Copper Exposed to Root Exudates. Environ. Sci. Technol. 2017, 51, 9774–9783. [Google Scholar] [CrossRef]
  31. Yang, X.; Römheld, V.; Marschner, H. Effect of Bicarbonate and Root Zone Temperature on Uptake of Zn, Fe, Mn, and Cu by Different Rice Cultivars (Oryza sativa L.) Grown in Calcareous Soil. Plant Soil. 1993, 155, 441–444. [Google Scholar] [CrossRef]
  32. Fitz, W.J.; Wenzel, W.W.; Zhang, H.; Nurmi, J.; Štipek, K.; Fischerova, Z.; Stingeder, G. Rhizosphere Characteristics of the Arsenic Hyperaccumulator Pteris vittata L. and Monitoring of Phytoremoval Efficiency. Environ. Sci. Technol. 2003, 37, 5008–5014. [Google Scholar] [CrossRef]
  33. Weiss, J.V.; Emerson, D.; Megonigal, J.P. Rhizosphere Iron (III) Deposition and Reduction in a Juncus effusus L.-Dominated Wetland. Soil. Sci. Soc. Am. J. 2005, 69, 1861–1870. [Google Scholar] [CrossRef]
  34. Li, Y.; Sun, H.; Li, H.; Yang, L.; Ye, B.; Wang, W. Dynamic Changes of Rhizosphere Properties and Antioxidant Enzyme Responses of Wheat Plants (Triticum aestivum L.) Grown in Mercury-Contaminated Soils. Chemosphere 2013, 93, 972–977. [Google Scholar] [CrossRef]
  35. Carvalho, G.S.; Oliveira, J.R.; Curi, N.; Schulze, D.G.; Marques, J.J. Selenium and Mercury in Brazilian Cerrado Soils and Their Relationships with Physical and Chemical Soil Characteristics. Chemosphere 2019, 218, 412–415. [Google Scholar] [CrossRef] [PubMed]
  36. Li, J.; Awasthi, M.K.; Xing, W.; Liu, R.; Bao, H.; Wang, X.; Wu, F. Arbuscular Mycorrhizal Fungi Increase the Bioavailability and Wheat (Triticum aestivum L.) Uptake of Selenium in Soil. Ind. Crops Prod. 2020, 150, 112383. [Google Scholar] [CrossRef]
  37. Matos, R.P.; Lima, V.M.P.; Windmöller, C.C.; Nascentes, C.C. Correlation Between the Natural Levels of Selenium and Soil Physicochemical Characteristics from the Jequitinhonha Valley (MG), Brazil. J. Geochem. Explor. 2017, 172, 195–202. [Google Scholar] [CrossRef]
  38. Wang, D.; Xue, M.Y.; Wang, Y.K.; Zhou, D.Z.; Tang, L.; Cao, S.Y.; Wei, Y.H.; Yang, C.; Liang, D.L. Effects of Straw Amendment on Selenium Aging in Soils: Mechanism and Influential Factors. Sci. Total Environ. 2019, 657, 871–881. [Google Scholar] [CrossRef]
  39. Li, Y.; Wang, L.; Yang, L.; Li, H. Dynamics of Rhizosphere Properties and Antioxidative Responses in Wheat (Triticum aestivum L.) Under Cadmium Stress. Ecotoxicol. Environ. Saf. 2014, 102, 55–61. [Google Scholar] [CrossRef]
  40. Zeng, X.; Yang, Y.; Zhang, Q.; Zeng, C.; Deng, X.; Yuan, H.; Zeng, Q. Field-Scale Differences in Rhizosphere Micro-Characteristics of Cichorium intybus, Ixeris polycephala, Sunflower, and Sedum alfredii in the Phytoremediation of Cd-Contaminated Soil. Ecotoxicol. Environ. Saf. 2023, 262, 115137. [Google Scholar] [CrossRef]
  41. Li, J.; Peng, Q.; Liang, D.; Liang, S.; Chen, J.; Sun, H.; Lei, P. Effects of Aging on the Fraction Distribution and Bioavailability of Selenium in Three Different Soils. Chemosphere 2016, 144, 2351–2359. [Google Scholar] [CrossRef]
  42. Zeng, T.; Khaliq, M.A.; Li, H.; Jayasuriya, P.; Guo, J.; Li, Y.; Wang, G. Assessment of Cd Availability in Rice Cultivation (Oryza sativa): Effects of Amendments and the Spatiotemporal Chemical Changes in the Rhizosphere and Bulk Soil. Ecotoxicol. Environ. Saf. 2020, 196, 110490. [Google Scholar] [CrossRef]
  43. Houba, V.J.G.; Temminghoff, E.J.M.; Gaikhorst, G.A.; Van Vark, W. Soil Analysis Procedures Using 0.01 M Calcium Chloride as Extraction Reagent. Commun. Soil. Sci. Plant Anal. 2000, 31, 1299–1396. [Google Scholar] [CrossRef]
  44. Weng, L.; Vega, F.A.; Supriatin, S.; Bussink, W.; Riemsdijk, W.H.V. Speciation of Se and DOC in Soil Solution and Their Relation to Se Bioavailability. Environ. Sci. Technol. 2011, 45, 262–267. [Google Scholar] [CrossRef] [PubMed]
  45. Kulp, T.R.; Pratt, L.M. Speciation and Weathering of Selenium in Upper Cretaceous Chalk and Shale from South Dakota and Wyoming, USA. Geochim. Cosmochim. Acta. 2004, 68, 3687–3701. [Google Scholar] [CrossRef]
  46. GB5009.93-2017; National Standard for Food Safety-Determination of Selenium in Food. National Health and Family Planning Commission of the People’s Republic of China State Food and Drug Administration: Beijing, Chian, 2017.
  47. Chen, Q.; Shi, W.; Wang, X. Selenium Speciation and Distribution Characteristics in the Rhizosphere Soil of Rice (Oryza sativa L.) Seedlings. Commun. Soil. Sci. Plant Anal. 2010, 41, 1411–1425. [Google Scholar] [CrossRef]
  48. Wang, H.Y.; Yang, L.F.; Chen, T.; Liu, Y.; Shi, X.Y.; Li, L.; Li, T.L. Occurrence Forms of Selenium and Zinc in Typical Wheat-Growing Areas of Shanxi Province. Chin. J. Ecol. 2025, 44, 912–919. [Google Scholar]
  49. Sun, X.; Yi, Q.; Tang, S.H.; Li, P.; Fu, H.T.; Wu, Y.P.; Zhang, M. Research Progress on Selenium Nutrition in Rice. Chin. J. Soil. Sci. 2023, 54, 223–231. (In Chinese) [Google Scholar]
  50. Gustafsson, J.P.; Persson, I.; Oromieh, A.G.; van Schaik, J.W.; Sjostedt, C.; Kleja, D.B. Chromium (III) Complexation to Natural Organic Matter: Mechanisms and Modeling. Environ. Sci. Technol. 2014, 48, 1753–1761. [Google Scholar] [CrossRef]
  51. Shen, Y.C.; Zhou, J. The Occurrence and Migration Transformation of Selenium in Soil. Anhui Geol. 2011, 21, 186–191. (In Chinese) [Google Scholar]
  52. Ma, Y.Z. Differences in Selenium Content, Distribution, and Bioavailability Between Paddy and Dryland Soils in Typical Selenium Rich Areas of Ziyang and Their Causal Analysis. Master’s Thesis, Northwest A&F University, Xianyang, China, 2022. (In Chinese). [Google Scholar]
  53. Hageman, S.P.; van der Weijden, R.D.; Weijma, J.; Buisman, C.J. Microbiological Selenate to Selenite Conversion for Selenium Removal. Water Res. 2013, 47, 2118–2128. [Google Scholar] [CrossRef]
  54. Huang, Q.Q.; Wang, Q.; Luo, Z.; Yu, Y.; Jiang, R.F. Effects of Root Iron Plaque on Selenite and Selenate Dynamics in Rhizosphere and Uptake by Rice (Oryza sativa). Plant Soil. 2015, 388, 255–266. [Google Scholar] [CrossRef]
  55. Yan, Z.X.; Li, Y.; Peng, S.Y.; Wei, L.; Zhang, B.; Deng, X.Y.; Zhong, M.; Cheng, X. Cadmium Biosorption and Mechanism Investigation Using Two Cadmium-Tolerant Microorganisms Isolated from Rhizosphere Soil of Rice. J. Hazard. Mater. 2024, 470, 134134. [Google Scholar] [CrossRef] [PubMed]
  56. Bertin, C.; Yang, X.; Weston, L.A. The Role of Root Exudates and Allelochemicals in the Rhizosphere. Plant Soil. 2003, 256, 67–83. [Google Scholar] [CrossRef]
  57. Bravin, M.N.; Martí, A.L.; Clairotte, M.; Hinsinger, P. Rhizosphere Alkalisation—A Major Driver of Copper Bioavailability Over a Broad pH Range in an Acidic, Copper-Contaminated Soil. Plant Soil. 2009, 318, 257–268. [Google Scholar] [CrossRef]
  58. Wang, J.L.; Liu, X.M.; Li, W.J.; Tu, Y.L.; Deng, H.; Du, J.W. Deciphering Heavy Metal Adsorption Capacity of Soil Based on Its Physicochemical Properties and Adsorption Reaction Time Using Machine Learning. J. Environ. Chem. Eng. 2025, 13, 116913. [Google Scholar] [CrossRef]
  59. Nawaz, F.; Ashraf, M.Y.; Ahmad, R.; Waraich, E.A.; Shabbir, R.N. Selenium (Se) Regulates Seedling Growth in Wheat Under Drought Stress. Adv. Chem. 2014, 2014, 670–675. [Google Scholar] [CrossRef]
  60. Shahid, M.A.; Balal, R.M.; Khan, N.; Zotarelli, L.; Garcia-Sanchez, F. Selenium Impedes Cadmium and Arsenic Toxicity in Potato by Modulating Carbohydrate and Nitrogen Metabolism. Ecotoxicol. Environ. Saf. 2019, 180, 588–599. [Google Scholar] [CrossRef]
  61. Cipriano, P.E.; Júnior, M.S.; Souza, R.R.D.; Silva, D.F.D.; Silva, R.F.D.; Silva, M.L.D.S.; Faquin, V.; Guilherme, L.R.G. Selenium Inorganic Sources Applied to Soil: Effects on Gas Exchange and Anatomical Changes of Radishes. S. Afr. J. Bot. 2024, 170, 17. [Google Scholar] [CrossRef]
  62. Mendes Araujo, A.; Lima Lessa, J.H.D.; Chanavat Gustavo, L.; Curi, N.; Lopes, G. How Sulfate Content and Soil Depth Affect the Adsorption/Desorption of Selenate and Selenite in Tropical Soils? Rev. Bras. Cienc. Solo. 2020, 44, e0200084. [Google Scholar]
  63. Vila, P.A.; Faquin, V.; Vila, F.W.; Kachinski, W.D.; Carvalho, G.S.; Guilherme, L.R.G. Phosphorus and Sulfur in a Tropical Soil and Their Effects on Growth and Selenium Accumulation in Leucaena leucocephala (Lam.) de Wit. Environ. Sci. Pollut. Res. 2020, 27, 44060–44072. [Google Scholar] [CrossRef]
  64. Saeed, K.; Hussain, M.A.; Abdalla, M.A.; Mühling, K.H. Selenium Increases the Capacity of Antioxidative Defense and Their Accompanying Metal Cofactors in Maize Under Sulfate Salinity. Plant Stress. 2025, 16, 100816. [Google Scholar] [CrossRef]
  65. Saffaryazdi, A.; Lahouti, M.; Ganjeali, A.; Bayat, H. Impact of Selenium Supplementation on Growth and Selenium Accumulation on Spinach (Spinacia oleracea L.) Plants. Not. Sci. Biol. 2012, 4, 95–100. [Google Scholar] [CrossRef]
  66. Silva, V.M.; Boleta, E.H.M.; Lanza, M.G.D.B.; Lavres, J.; Martins, J.T.; Santos, E.F.; Reis, A.R. Physiological, Biochemical, and Ultrastructural Characterization of Selenium Toxicity in Cowpea Plants. Environ. Exp. Bot. 2018, 150, 172–182. [Google Scholar] [CrossRef]
  67. Wang, K.; Wang, Y.; Li, K.; Wan, Y.; Wang, Q.; Zhuang, Z.; Li, H. Uptake, Translocation and Biotransformation of Selenium Nanoparticles in Rice Seedlings (Oryza sativa L.). J. Nanobiotechnol. 2020, 18, 103. [Google Scholar] [CrossRef]
  68. Guerrero, B.; Llugany, M.; Palacios, O.; Valiente, M. Dual Effects of Different Selenium Species on Wheat. Plant Physiol. Biochem. 2014, 83, 300–307. [Google Scholar] [CrossRef]
  69. Li, H.F.; McGrath, S.P.; Zhao, F.J. Selenium Uptake, Translocation and Speciation in Wheat Supplied with Selenate or Selenite. New Phytol. 2008, 178, 92–102. [Google Scholar] [CrossRef]
  70. Zhang, N. Effects of Exogenous Selenium with Different Valence States on Selenium Uptake and Translocation in Wheat. Master’s Thesis, Shihezi University, Shihezi, China, 2016. (In Chinese). [Google Scholar]
  71. Fu, D.D. Effects of Different Exogenous Selenium on Selenium Absorption, Distribution, and Translocation in Winter Wheat. Ph.D. Thesis, Northwest A&F University, Xianyang, China, 2011. (In Chinese). [Google Scholar]
  72. Li, Y.; Xiao, Y.; Hao, J.; Fan, S.; Dong, R.; Zeng, H.; Han, Y. Effects of Selenate and Selenite on Selenium Accumulation and Speciation in Lettuce. Plant Physiol. Biochem. 2022, 192, 162–171. [Google Scholar] [CrossRef]
  73. Kang, Y.; Qin, H.; Wang, G.; Lei, B.; Yang, X.; Zhong, M. Selenium Nanoparticles Mitigate Cadmium Stress in Tomato Through Enhanced Accumulation and Transport of Sulfate/Selenite and Polyamines. J. Agric. Food Chem. 2024, 72, 1473–1486. [Google Scholar] [CrossRef]
  74. Mei, Y.; Sun, H.; Du, G.; Wang, X.; Lyu, D. Exogenous Chlorogenic Acid Alleviates Oxidative Stress in Apple Leaves by Enhancing Antioxidant Capacity. Sci. Hortic. 2020, 274, 109676. [Google Scholar] [CrossRef]
  75. Brown, K.; Arthur, J.R. Selenium, Selenoproteins and Human Health: A Review. Public. Health Nutr. 2001, 4, 593–599. [Google Scholar] [CrossRef]
  76. Shao, H.B.; Chu, S.H.B.; Chu, L.Y.; Lu, Z.H.; Kang, C.M. Primary Antioxidant Free Radical Scavenging and Redox Signaling Pathways in Higher Plant Cells. Int. J. Biol. Sci. 2007, 4, 8. [Google Scholar] [CrossRef]
  77. Qu, L.; Xu, J.; Dai, Z.; Elyamine, A.M.; Huang, W.; Han, D.; Jia, W. Selenium in Soil-Plant System: Transport, Detoxification and Bioremediation. J. Hazard. Mater. 2023, 452, 131272. [Google Scholar] [CrossRef]
  78. Huang, G.X.; Ding, C.F.; Li, Y.S.; Zhang, T.L.; Wang, X.X. Selenium Enhances Iron Plaque Formation by Elevating the Radial Oxygen Loss of Roots to Reduce Cadmium Accumulation in Rice (Oryza sativa L.). J. Hazard. Mater. 2020, 398, 122860. [Google Scholar] [CrossRef]
  79. Somagattu, P.; Chinnannan, K.; Yammanuru, H.; Reddy, U.K.; Nimmakayala, P. Selenium Dynamics in Plants: Uptake, Transport, Toxicity, and Sustainable Management Strategies. Sci. Total Environ. 2024, 949, 175033. [Google Scholar] [CrossRef]
  80. Huang, Q.Q.; Xu, Y.M.; Liu, Y.Y.; Qin, X.; Rong, H.; Liang, X.F. Selenium Application Alters Soil Cadmium Bioavailability and Reduces Its Accumulation in Rice Grown in Cd-Contaminated Soil. Environ. Sci. Pollut. Res. 2018, 25, 31175–31182. [Google Scholar] [CrossRef]
  81. Molnár, Á.; Kolbert, Z.; Kéri, K.; Feigl, G.; Ördög, A.; Szőllősi, R.; Erdei, L. Selenite-Induced Nitro-Oxidative Stress Processes in Arabidopsis thaliana and Brassica juncea. Ecotoxicol. Environ. Saf. 2018, 148, 664–674. [Google Scholar] [CrossRef]
  82. Shahid, M.; Pourrut, B.; Dumat, C.; Nadeem, M.; Aslam, M.; Pinelli, E. Heavy-Metal-Induced Reactive Oxygen Species: Phytotoxicity and Physicochemical Changes in Plants. Rev. Environ. Contam. Toxicol. 2014, 232, 1–44. [Google Scholar]
  83. Gupta, M.; Gupta, S. An overview of selenium uptake, metabolism, and toxicity in plants. Front. Plant Sci. 2017, 7, 20–74. [Google Scholar] [CrossRef]
  84. Alshaal, T.; Szabolcsy, É.D.; Fári, M.; Veres, S.; Kaszás, L.; Kovács, Z.; Eissa, F.; Elhawat, N. Agricultural Sustainability and the Challenges of Selenium Nanoparticles (SeNPs): Their Role in Supporting the Environmental Economy. Plant Stress. 2025, 16, 100846. [Google Scholar] [CrossRef]
  85. Zhai, H.; Xue, M.; Du, Z.; Wang, D.; Zhou, F.; Feng, P.; Liang, D.L. Leaching Behaviors and Chemical Fraction Distribution of Exogenous Selenium in Three Agricultural Soils Through Simulated Rainfall. Ecotoxicol. Environ. Saf. 2019, 173, 393–400. [Google Scholar] [CrossRef]
Figure 1. The pH (A), DOC (B), inorganic Se (C), and total Se (D) in soil solution of wheat rhizosphere and non-rhizosphere at the stage of 4 weeks after planting (WAP4), 6 weeks after planting (WAP6), and 8 weeks after planting (WAP8). Different lowercase letters represent significant differences between exogenous Se treatments (p < 0.05).
Agronomy 15 01427 g001
Figure 2. Effects of BCFss (A), BCFrs (B), and TF (C) in wheat at 4 weeks (WAP4), 6 weeks (WAP6), and 8 weeks (WAP8) after sowing. Different lowercase letters represent significant differences between exogenous Se treatments (p < 0.05).
Agronomy 15 01427 g002
Figure 3. Effects of Se supplement on the activity of SOD (A), CAT (B), GPx (C), and MDA content (D) in leaves of wheat plants at the stage of 4 weeks after planting (WAP4), 6 weeks after planting (WAP6), and 8 weeks after planting (WAP8). Different lowercase letters represent significant differences between exogenous Se treatments (p < 0.05).
Agronomy 15 01427 g003
Table 1. Effects of applied selenite on Se speciation in rhizosphere soil.
TimeSe Added
(mg Se kg−1)
SOL-SeEX-SeOM-Se
Content
(µg kg−1)
Ratio
(%)
Content
(mg kg−1)
Ratio
(%)
Content
(mg kg−1)
Ratio
(%)
4 weeks01.81 ± 0.04 e0.830.02 ± 0.00 e7.150.03 ± 0.00 e14.67
17.56 ± 0.13 d0.860.09 ± 0.01 d9.870.15 ± 0.00 d16.88
2.520.80 ± 0.97 c1.010.23 ± 0.01 c11.080.61 ± 0.01 c29.46
544.87 ± 3.48 b1.070.49 ± 0.03 b11.771.38 ± 0.05 b32.83
1094.65 ± 2.84 a1.091.14 ± 0.04 a13.203.65 ± 0.09 a42.17
6 weeks01.82 ± 0.03 e0.860.01 ± 0.00 e7.050.03 ± 0.00 e13.90
17.35 ± 0.16 d0.860.08 ± 0.00 d9.440.14 ± 0.01 d16.64
2.520.03 ± 0.29 c0.980.20 ± 0.01 c10.000.57 ± 0.01 c27.83
544.50 ± 3.18 b1.070.48 ± 0.03 b11.551.36 ± 0.04 b32.76
1092.63 ± 6.08 a1.081.08 ± 0.07 a12.583.51 ± 0.03 a40.96
8 weeks01.83 ± 0.03 e0.890.01 ± 0.00 e6.650.03 ± 0.00 e13.94
17.30 ± 0.29 d0.860.08 ± 0.00 d9.340.14 ± 0.01 d16.10
2.519.62 ± 0.25 c0.990.20 ± 0.01 c10.340.53 ± 0.02 c26.83
541.65 ± 0.90 b1.030.46 ± 0.02 b11.431.31 ± 0.07 b32.22
1091.82 ± 2.27 a1.081.02 ± 0.05 a11.983.32 ± 0.09 a38.86
Different lowercase letters represent significant differences between exogenous Se treatments (p < 0.05).
Table 2. Effects of applied selenite on Se speciation in non-rhizosphere soil.
TimeSe Added
(mg Se kg−1)
SOL-SeEX-SeOM-Se
Content
(µg kg−1)
Ratio
(%)
Content
(mg kg−1)
Ratio
(%)
Content
(mg kg−1)
Ratio
(%)
4 weeks01.59 ± 0.08 e0.710.01 ± 0.00 e6.570.03 ± 0.00 e14.28
18.51 ± 0.20 d0.950.08 ± 0.01 d9.430.15 ± 0.00 d16.44
2.524.02 ± 1.53 c1.160.23 ± 0.02 c11.200.62 ± 0.01 c29.86
551.08 ± 2.39 b1.160.52 ± 0.01 b11.761.49 ± 0.01 b33.81
10106.66 ± 1.58 a1.211.15 ± 0.03 a13.023.72 ± 0.04 a42.18
6 weeks01.59 ± 0.08 e0.730.01 ± 0.00 e6.390.03 ± 0.00 e13.39
18.14 ± 0.37 d0.950.08 ± 0.00 d9.440.14 ± 0.00 d16.19
2.522.02 ± 1.16 c1.070.22 ± 0.00 c10.690.60 ± 0.01 c29.28
548.43 ± 3.80 b1.130.50 ± 0.02 b11.541.41 ± 0.06 b32.74
1098.29 ± 5.03 a1.131.12 ± 0.04 a12.863.64 ± 0.08 a41.74
8 weeks01.62 ± 0.02 e0.770.01 ± 0.00 e6.370.02 ± 0.00 e11.53
18.88 ± 0.26 d1.050.08 ± 0.00 d9.200.13 ± 0.01 d15.84
2.519.65 ± 0.89 c0.960.21 ± 0.01 c10.480.57 ± 0.01 c28.22
546.37 ± 2.12 b1.080.47 ± 0.02 b10.891.39 ± 0.05 b32.37
1097.60 ± 3.76 a1.121.09 ± 0.01 a12.513.52 ± 0.06 a40.52
Different lowercase letters represent significant differences between exogenous Se treatments (p < 0.05).
Table 3. Effects of Se supplement on dry weight (g pot−1) and Se concentration (mg kg−1 dry matter) of the shoot and root of wheat plants at different growth stages.
ParametersSe Added
(mg Se kg−1)
WAP4WAP6WAP8
ShootRootShootRootShootRoot
Dry weight 01.10 ± 0.10 a0.50 ± 0.06 a1.34 ± 0.11 c0.50 ± 0.04 bc1.40 ± 0.09 b0.54 ± 0.04 b
11.17 ± 0.18 a0.54 ± 0.03 a1.40 ± 0.04 bc0.55 ± 0.04 ab1.40 ± 0.12 b0.56 ± 0.04 b
2.51.28 ± 0.03 a0.55 ± 0.03 a1.50 ± 0.07 ab0.59 ± 0.01 a1.43 ± 0.07 b0.58 ± 0.05 b
51.15 ± 0.10 a0.57 ± 0.05 a1.57 ± 0.08 a0.61 ± 0.06 a1.80 ± 0.12 a0.71 ± 0.09 a
101.15 ± 0.09 a0.51 ± 0.07 a1.31 ± 0.08 c0.46 ± 0.08 c1.24 ± 0.06 c0.47 ± 0.08 b
Se content00.03 ± 0.01 e0.16 ± 0.01 e0.03 ± 0.01 e0.16 ± 0.01 e0.03 ± 0.01 e0.18 ± 0.01 e
10.15 ± 0.01 d0.81 ± 0.01 d0.17 ± 0.01 d0.90 ± 0.01 d0.21 ± 0.01 d1.04 ± 0.02 d
2.50.47 ± 0.02 c1.89 ± 0.02 c0.58 ± 0.02 c2.33 ± 0.09 c0.66 ± 0.03 c2.47 ± 0.05 c
51.34 ± 0.04 b6.76 ± 0.33 b1.72 ± 0.02 b7.08 ± 0.05 b1.75 ± 0.04 b5.58 ± 0.26 b
102.81 ± 0.05 a15.43 ± 0.06 a3.57 ± 0.15 a15.59 ± 0.23 a3.75 ± 0.26 a13.33 ± 0.16 a
Different lowercase letters represent significant differences between exogenous Se treatments (p < 0.05).
Disclaimer/Publisher’s Note: The statements, opinions and data contained in all publications are solely those of the individual author(s) and contributor(s) and not of MDPI and/or the editor(s). MDPI and/or the editor(s) disclaim responsibility for any injury to people or property resulting from any ideas, methods, instructions or products referred to in the content.

