Article

Phosphorus Utilization Efficiency Among Corn Era Hybrids Released over Seventy-Five Years

by
Kwame Ampong
1,
Chad J. Penn
2,*,
James Camberato
1,
Daniel Quinn
1 and
Mark Williams
2
1
Department of Agronomy, Purdue University, West Lafayette, IN 47907, USA
2
National Soil Erosion Research Laboratory, USDA Agricultural Research Service, West Lafayette, IN 47907, USA
*
Author to whom correspondence should be addressed.
Agronomy 2025, 15(6), 1407; https://doi.org/10.3390/agronomy15061407
Submission received: 1 May 2025 / Revised: 28 May 2025 / Accepted: 31 May 2025 / Published: 7 June 2025
(This article belongs to the Special Issue Safe and Efficient Utilization of Water and Fertilizer in Crops)

Abstract

:
The high demands of corn (Zea mays L.) grain production coupled with water quality goals and phosphorus (P) conservation pose a great challenge to farmers and society and necessitate improved P utilization efficiency (PUtE: grain yield per mass total P (TP) content). The objective of this study was to evaluate PUtE among six Pioneer corn hybrids released over a span of 75 years. Corn was grown in a sand culture hydroponics system that eliminated confounding plant–soil interactions and root architecture and allowed for precise control of nutrient availability. Four P concentration levels (4, 7, 10, and 12 mg P L−1) were applied to hybrids released in 1936, 1942, 1946, 1952, 2008, and 2011. Nutrients other than P were applied at sufficient levels. Shoots and roots were harvested at maturity (R6) and biomass and P concentration determined. Results showed that total biomass did not differ among hybrids, but partitioning of biomass varied with hybrid. Grain yield varied between hybrids, but there was no trend with the year of release. Grain P content was negatively correlated with stem P content (R2 = 0.89). PUtE differed between the most recently released hybrids (2008 and 2011) whereas older hybrids had intermediate and similar PUtE. Grain yield was not solely determined by TP in the plant, but was strongly influenced by biomass and P partitioning, which was manifested as relative differences in PUtE between hybrids. While the PUtE did not necessarily change as a function of the breeding period, there were differences between hybrids. The findings highlight the critical role of the source–sink relationship in determining PUtE and grain yield.

1. Introduction

Phosphorus (P) is required by plants, fulfilling important roles in photosynthesis, synthesis of photosynthetic by-products, and utilization of carbohydrates within plants [1,2]. All of these processes are necessary for creating biomass and grain. Increased intensification of agriculture has resulted in a greater use of non-renewable inorganic phosphate fertilizers for plant production [3]. In addition, the high fixation of P in the soil due to sorption and precipitation reduces its bioavailability [4,5], which requires that soils possess an appreciable P pool beyond the mass balance for a growing season. While crops require a relatively high P concentration in the soil solution for achieving maximum crop growth, small losses to surface water can trigger eutrophication and water quality degradation [6,7]. One option for simultaneously reducing fertilizer P consumption and non-point P losses to surface waters is breeding crops for greater P acquisition and internal P utilization efficiency [2,8].
Corn hybrids exhibit genotypic differences in nutrient uptake and utilization, largely due to inherent variations in root affinity and transport systems [9,10,11]. Some hybrids expend high amounts of energy to acquire nutrients, which can impose metabolic stress and limit their ability to efficiently utilize acquired nutrients for grain production [12]. Corn breeding for the past decades has focused mostly on agronomic and physiological traits, nitrogen use efficiency (NUE), and environmental stress adaptations [13,14]. Several research studies have reported on how advances in corn traits have improved NUE [15,16,17,18,19]. Research on historical data has shown that corn yield has been increasing due to improved breeding as well as better management practices [15,20,21]. Yield improvement with breeding is a result of increased kernel number and weight, and the ability to withstand high plant density [22]. The grain is the primary sink for nitrogen (N) [23], directly linking grain yield to NUE. Although yield has increased with breeding, total N uptake in corn has remained unchanged [17]. Thus, breeding has improved N utilization efficiency [14,15,20,24]. Essentially, the source–sink relationship plays a crucial role in efficient nutrient remobilization, which partly controls nutrient use efficiency [18,19]. For example, Olmedo Pico and Vyn [25] found that greater ear N accumulation after silking enhanced sink establishment through increased endosperm cell number. Ampong et al. [26] also found that greater ear P concentration in corn at silking was associated with increased grain yield. These findings suggest that both nutrients and biomass partitioning play crucial roles in determining final grain yield, which is essential for optimizing P utilization efficiency (PUtE).
Despite the synergism between N and P and the importance of P uptake and utilization on grain yield [27], less attention has been given to P in corn breeding programs. Phosphorus uptake efficiency is the ability of the corn plant to acquire P from the soil [28], and PUtE is the amount of grain yield produced per unit mass of total P uptake [26]. Improved uptake efficiency will not reduce the amount of P ultimately required, as it simply allows the plant to “mine” the soil more efficiently. Thus, lower levels of soluble P could be maintained, which would additionally reduce the risk of runoff dissolved P loss. On the other hand, increased corn PUtE will directly reduce corn P requirements since less is taken up to produce the same amount of grain. Corn P uptake and utilization differ between hybrids [29,30]. Since grain is the primary sink for P during grain filling, greater grain yield directly increases PUtE [26,30,31]. However, high grain P concentration could also decrease PUtE despite greater grain yield [30]. Despite the differences in grain yield between the two hybrids, the hybrids with lower yield had higher grain P content, which decreases PUtE [30]. Ray et al. [29] found that greater PUtE was a result of greater grain yield. Woli et al. [32] conducted a study on Pioneer corn hybrids released from 1960 to 2000, finding that relative P accumulation rate had not changed between them; however, greater yield resulted in increased nutrient removal. These findings suggest that harvest index and grain P concentration play an important role in PUtE in corn hybrids.
The effect of breeding on P utilization in corn era hybrids has not been elucidated, even though yield has increased over time [23,33]. Notably, PUtE requires strategic biomass partitioning and P concentration in the grain [23]. However, no research has been conducted to evaluate PUtE in such hybrids over that period. The objective of this study was to determine if PUtE has changed with breeding among Pioneer hybrids released over a span of 75 years.

2. Materials and Methods

2.1. Plant Selection, Experimental Conditions, and Phosphorus Treatments

The Pioneer corn hybrids examined in this experiment were commercially available between 1936 and 2011 and will be mostly referred to by their year of availability. The 307HYB (1936), 339HYB (1942), 352HYB (1946), and 301B (1952) hybrids were among the earliest successful corn hybrids developed by Pioneer Hi-Bred International, now Corteva Agriscience, for their increased yield, disease resistance, and adaptability to varied growing conditions. The more recent hybrids, 33W84 (2008) and P1151HR (2011), were genetically modified hybrids with traits that confer resistance to insects and herbicides. The 33W84 hybrid has the HXX trait, while the P1151HR has the HX1 trait; both traits are herbicide resistance. Both hybrids have LL and RR2 (herbicide resistance) traits. In addition, the 2008 hybrid carries genes that confer high total fermentable ethanol, while the 2011 hybrid carries a gene that confers drought tolerance.
The experimental design was a split block with the hybrid as the main block and P supply level randomized within each block. The plants (one per pot) were grown to physiological maturity (growth stage R6) in 28 L plastic pots containing 30 kg silica sand in the semi-automated grow room described in detail by Wiethorn et al. [34]. All nutrients were supplied via fertigation by automated injectors (Dosatron D14MZ520; Dosatron International Inc., Clearwater, FL, USA) and drip tubing. This sand culture hydroponics system is necessary in nutrient uptake studies to eliminate the confounding interaction between roots and soils, i.e., P uptake in this system is not influenced by differences in root length, distribution, and architecture, since the P supply is not limited by diffusion as it is in soil [35]. Because the silica sand is not capable of retaining or desorbing P, the P supply becomes a function of mass flow, effectively eliminating differences in root architecture among hybrids as a factor influencing P uptake. Since there is no soil buffering capacity in this medium, it becomes necessary to utilize much higher P concentrations to meet plant P uptake needs, compared to a natural soil that would only need to provide around 0.2 mg P L−1. The photoperiod was varied to reflect the day length for Central Indiana from May to September. Light-emitting diode lamps were positioned ~80 cm directly above the plant row and adjusted to 65% capacity to maintain photosynthetic active radiation (PAR) between 700 and 900 µmoles m−2 s−1. The temperature and humidity in the grow room were approximately 22 °C and 35 °C during the night and day, with corresponding humidity levels of 40% and 65%, respectively. The air in the room was constantly mixed using two oscillating pedestal fans.
There were 4 replications of each treatment. The phosphorus concentrations in the nutrient solutions ranged from low to sufficient (4, 7, 10, and 12 mg L−1), as determined by previous experiments [31,34]. All P was dissolved in solution, and therefore the form (species) was controlled by the pH; since pH was near neutral, P was mostly in the form of HPO42- with some H2PO4. All nutrients other than P were supplied at sufficient levels from emergence to R6 [34]. The targeted solution concentrations of N, K, S, Ca, Mg, Fe, Zn, Mn, B, Cu, and Mo were 180, 120, 74, 80, 35, 2, 0.05, 0.25, 0.25, 0.02, and 0.01 mg L−1, respectively, and kept separated from the P solutions.

2.2. Parameter Measurements, Harvesting, Sample Preparation, and Analysis

Plants were harvested at physiological maturity and separated into stem, leaves, CHI (cob, husk, and immature ears), grain, and roots. Kernel rows per ear were determined by counting the number of kernel rows around the cob. Kernel weight was measured by weighing a representative sample of 100 kernels selected from the total kernel count. The total kernel number per plant was estimated by dividing the 100-kernel weight by the total grain yield and then multiplying the result by 100. The samples were dried for 3–5 days at 50 °C before determining dry weight. Dried samples were ground to pass a 0.50 mm screen using a Thomas Wiley Mill model ED-5 (Arthur H. Thomas Co., Philadelphia, PA, USA). Ground plant tissue (1 g) was digested with 20 mL of concentrated nitric acid on a BD40HT graphite heating block (Lachat Instruments, Milwaukee, WI, USA) by heating to 120 °C for about 60 min, followed by the addition of 2 mL hydrogen peroxide, then continued heating to 160 °C for about 3 h. Phosphorus concentration was analyzed with inductively coupled plasma optical emission spectroscopy (iCAP PRO, Thermo Fisher Scientific Inc., Waltham, MA, USA). Phosphorus concentrations in all corn plant parts are presented on a dry weight basis. Grain yield is presented at 15.5% moisture. The total P (TP) was calculated as the product of biomass and P concentration. The PUtE was determined by fitting a linear regression model between total P uptake mass and yield, where the former was treated as the independent variable and the latter as the dependent variable. The intercept of the regression was set to zero to ensure that the slope accurately represented the relationship between plant TP uptake and grain yield. This approach was necessary as the slope itself was the primary parameter of interest in the analysis. The slope of the model for each hybrid was determined as the PUtE. The determinations of PUtE and grain P utilization efficiency (gPUtE) are summarized in Table 1.

2.3. Statistical Analysis

All data were subjected to the Shapiro–Wilk test for normality [36] before an analysis of variance (ANOVA) using the “stats” package in R [37]. Since the data were normally distributed, no transformations were applied. If a significant treatment effect was detected with the ANOVA (α = 0.05), the differences between means were determined by Tukey’s Honest Significant Difference test (HSD; α = 0.05). Simple linear correlations were conducted using the “stats” package in R (α = 0.05).

3. Results

All hybrids significantly responded to P treatment. However, there was no interaction between the P supply level and hybrid among all measured parameters; therefore, the results presented were averaged over the four P supply levels.

3.1. Corn Biomass Production

The total biomass among hybrids did not differ at maturity (Table 2). However, biomass partitioning into the various plant parts differed among hybrids (Figure 1a). All hybrids partitioned more biomass into the grain and stem and less into the leaf, root, and CHI. Among hybrids, the 2011, 1936, 1946, and 1952 hybrids partitioned the highest biomass percentage into the stem, while the 1942 and 2008 hybrids allocated more biomass into the grain than the stem. The 2011 hybrid partitioned greater biomass into the CHI and root compared to the other hybrids. The number of kernels per row and the number of kernels per plant did not differ among hybrids (Table 2). The kernel weight of the 2008 hybrid was greater than that of the 1936 and 2011 hybrids (Table 2). The kernel weight of the 2011 hybrid was lower than the older or early hybrids (Table 2). However, the kernel weight did not differ among the four early hybrids. Grain yield differed among hybrids, especially between the two recent hybrids (Table 2). Grain yield of the 2008 hybrid was twofold greater than the 2011 hybrid, which was the lowest yield of all the hybrids. The yield of the 2008 hybrid was greater than only one of the early hybrids (1952). However, yield did not differ among the four early hybrids. The root/shoot ratio of the 2011 hybrid was greater than that of all the other hybrids except the 1952 hybrid (Table 2).

3.2. Phosphorus Concentration and Content in Corn Plant Parts

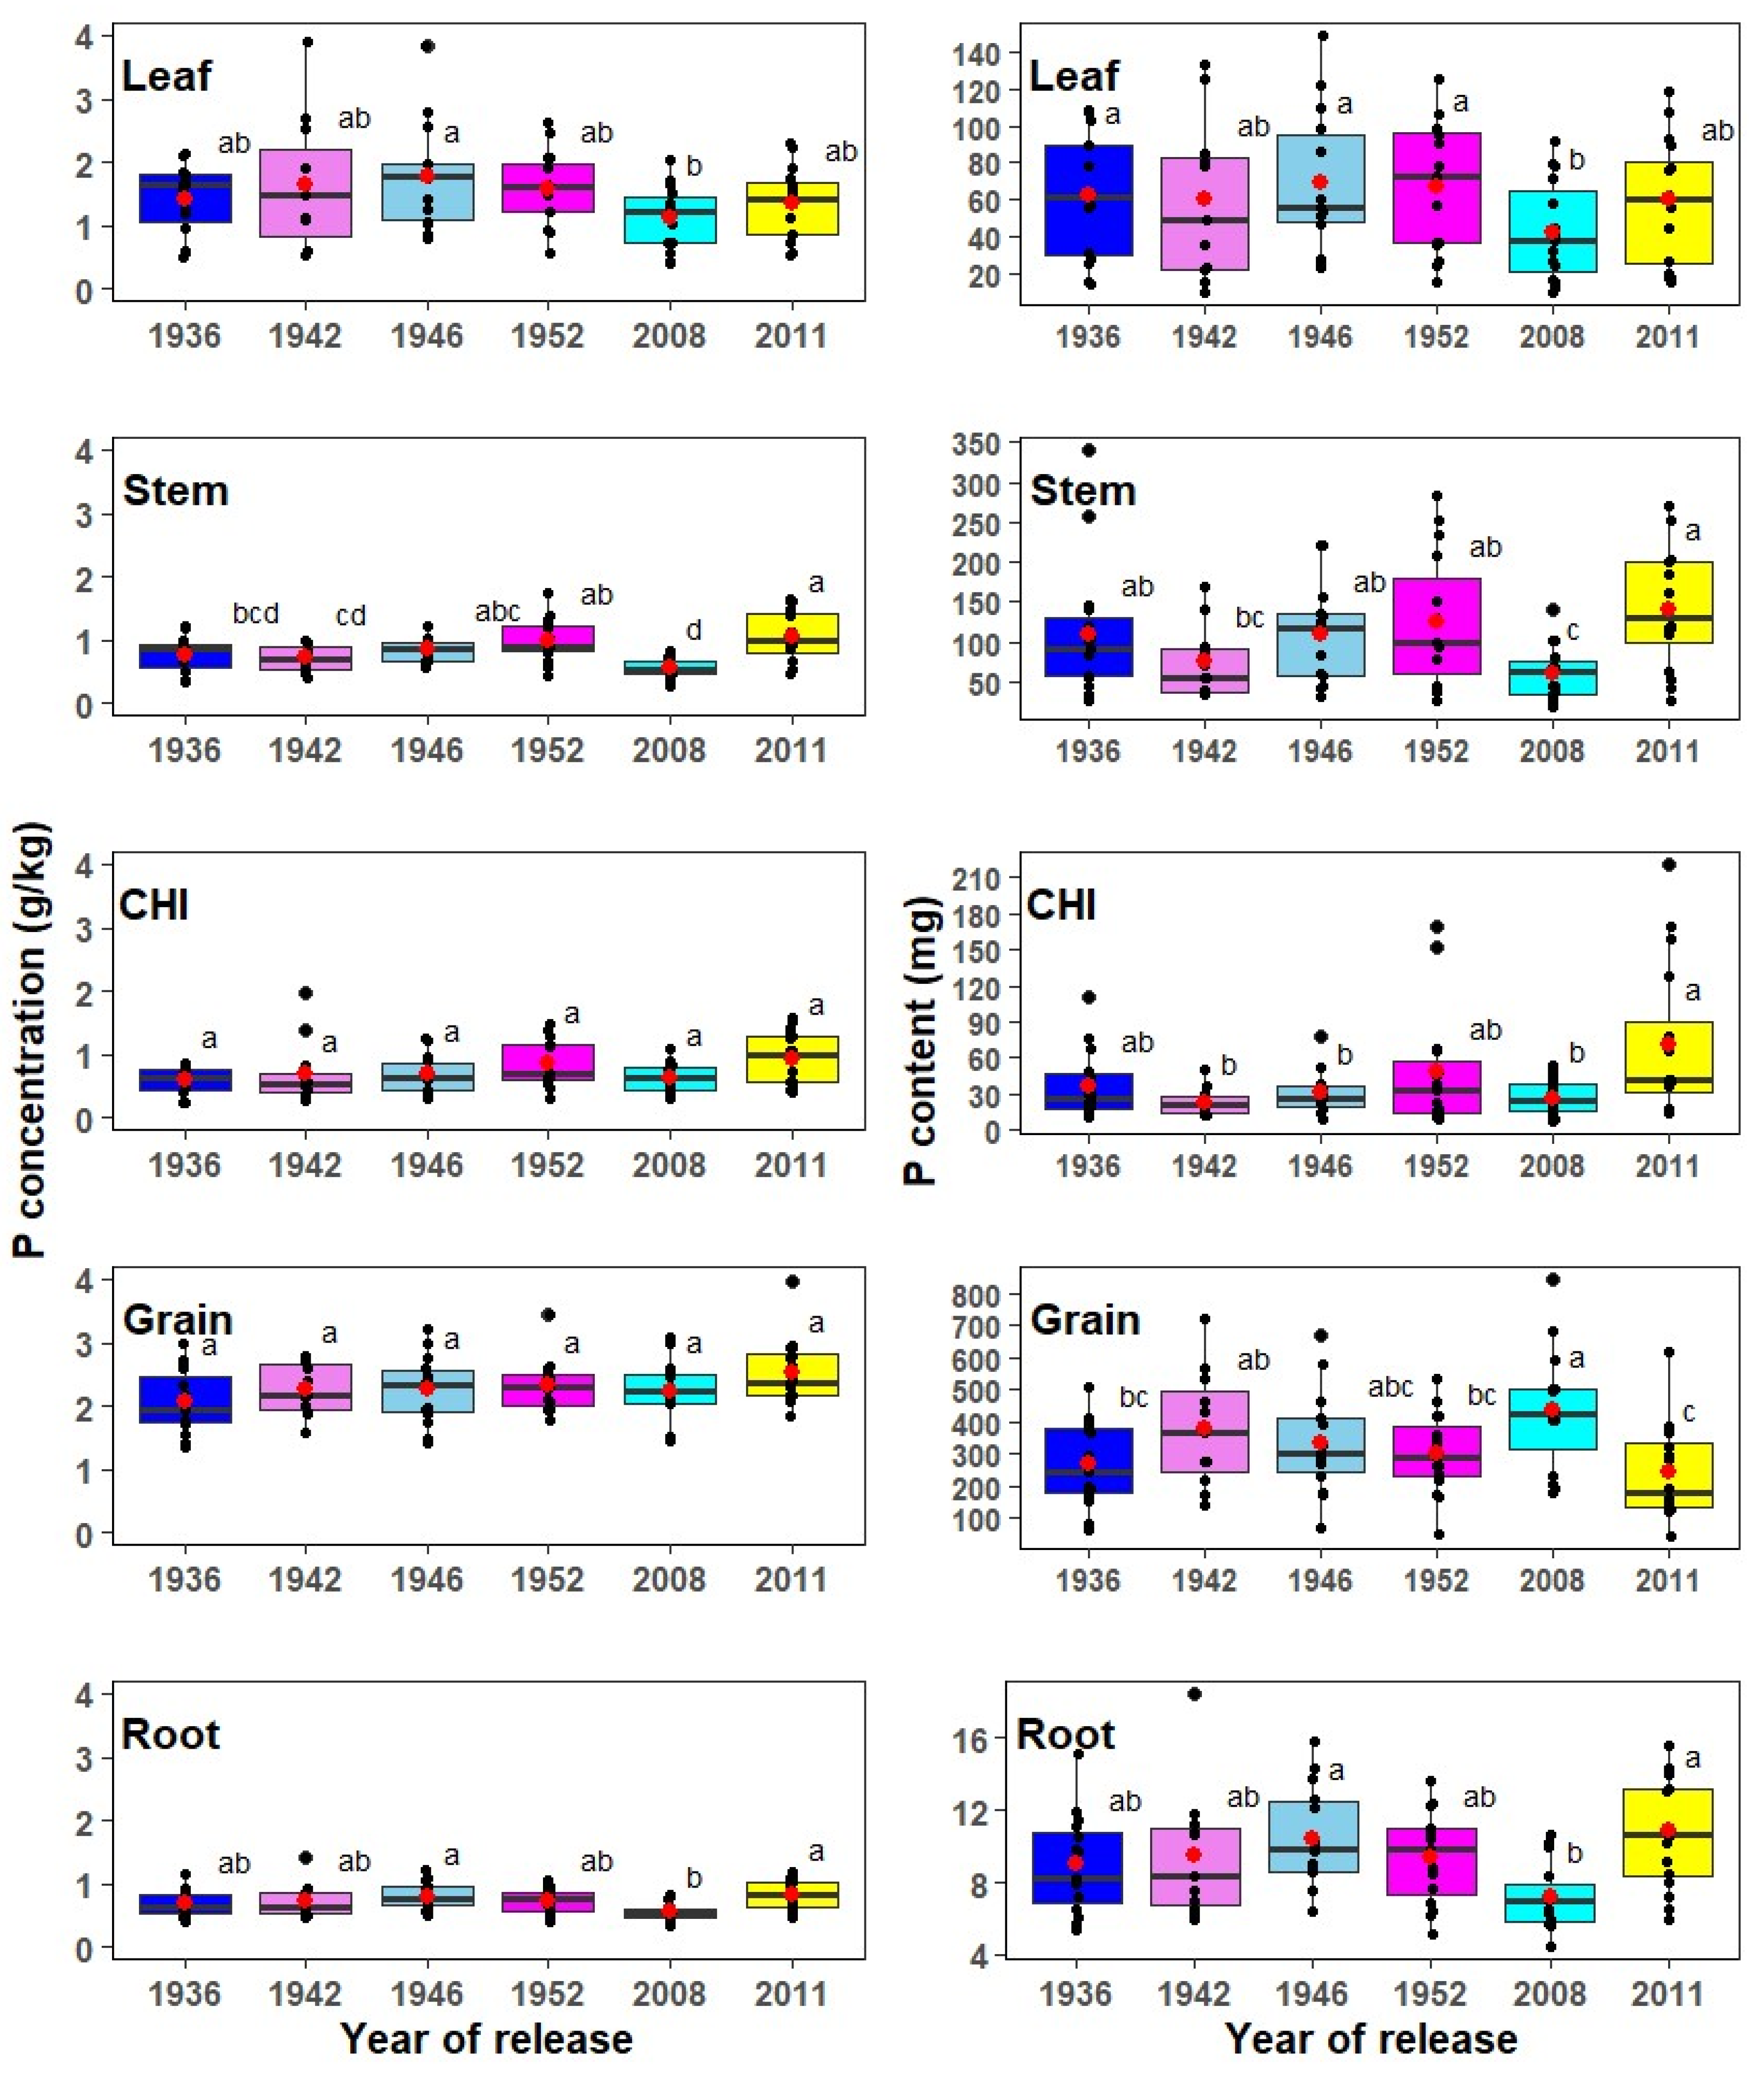
The P concentration was generally low in the roots, stem, and CHI, but high in the leaf and grain (Figure 2). Differences in P concentration in corn plant parts were observed between the two most recent hybrids, but not between the four early hybrids. The P concentration in the roots and stems of the 2011 hybrid was greater than that of the 2008 hybrid. The P concentration in the grain and CHI did not differ among hybrids.
The TP content of the hybrids was similar, except the TP content of the 2008 hybrid was 15% greater than that of the 1936 hybrid (Table 2). Within all hybrids, the percentage of P deposited in the grain was greater than in the stem, leaf, CHI, and roots, except for the 2011 hybrid, which had similar P content in the grain and stem (Figure 2). Between hybrids, the 2008 hybrid had a greater grain P harvest index (gPUtE); however, it was not different from the 1942 and 1946 hybrids (Figure 1b). The 2011 hybrid had a lower gPUtE but did not differ from three of the early hybrids. The 2011 hybrid deposited greater P into CHI but was not different from the 1952 hybrid. The 2011 hybrid partitioned greater P into the stem compared to the 2008 hybrid. Across the early hybrids, there was no significant difference in the partitioning of P between the leaf, stem, CHI, grain, and root tissues.
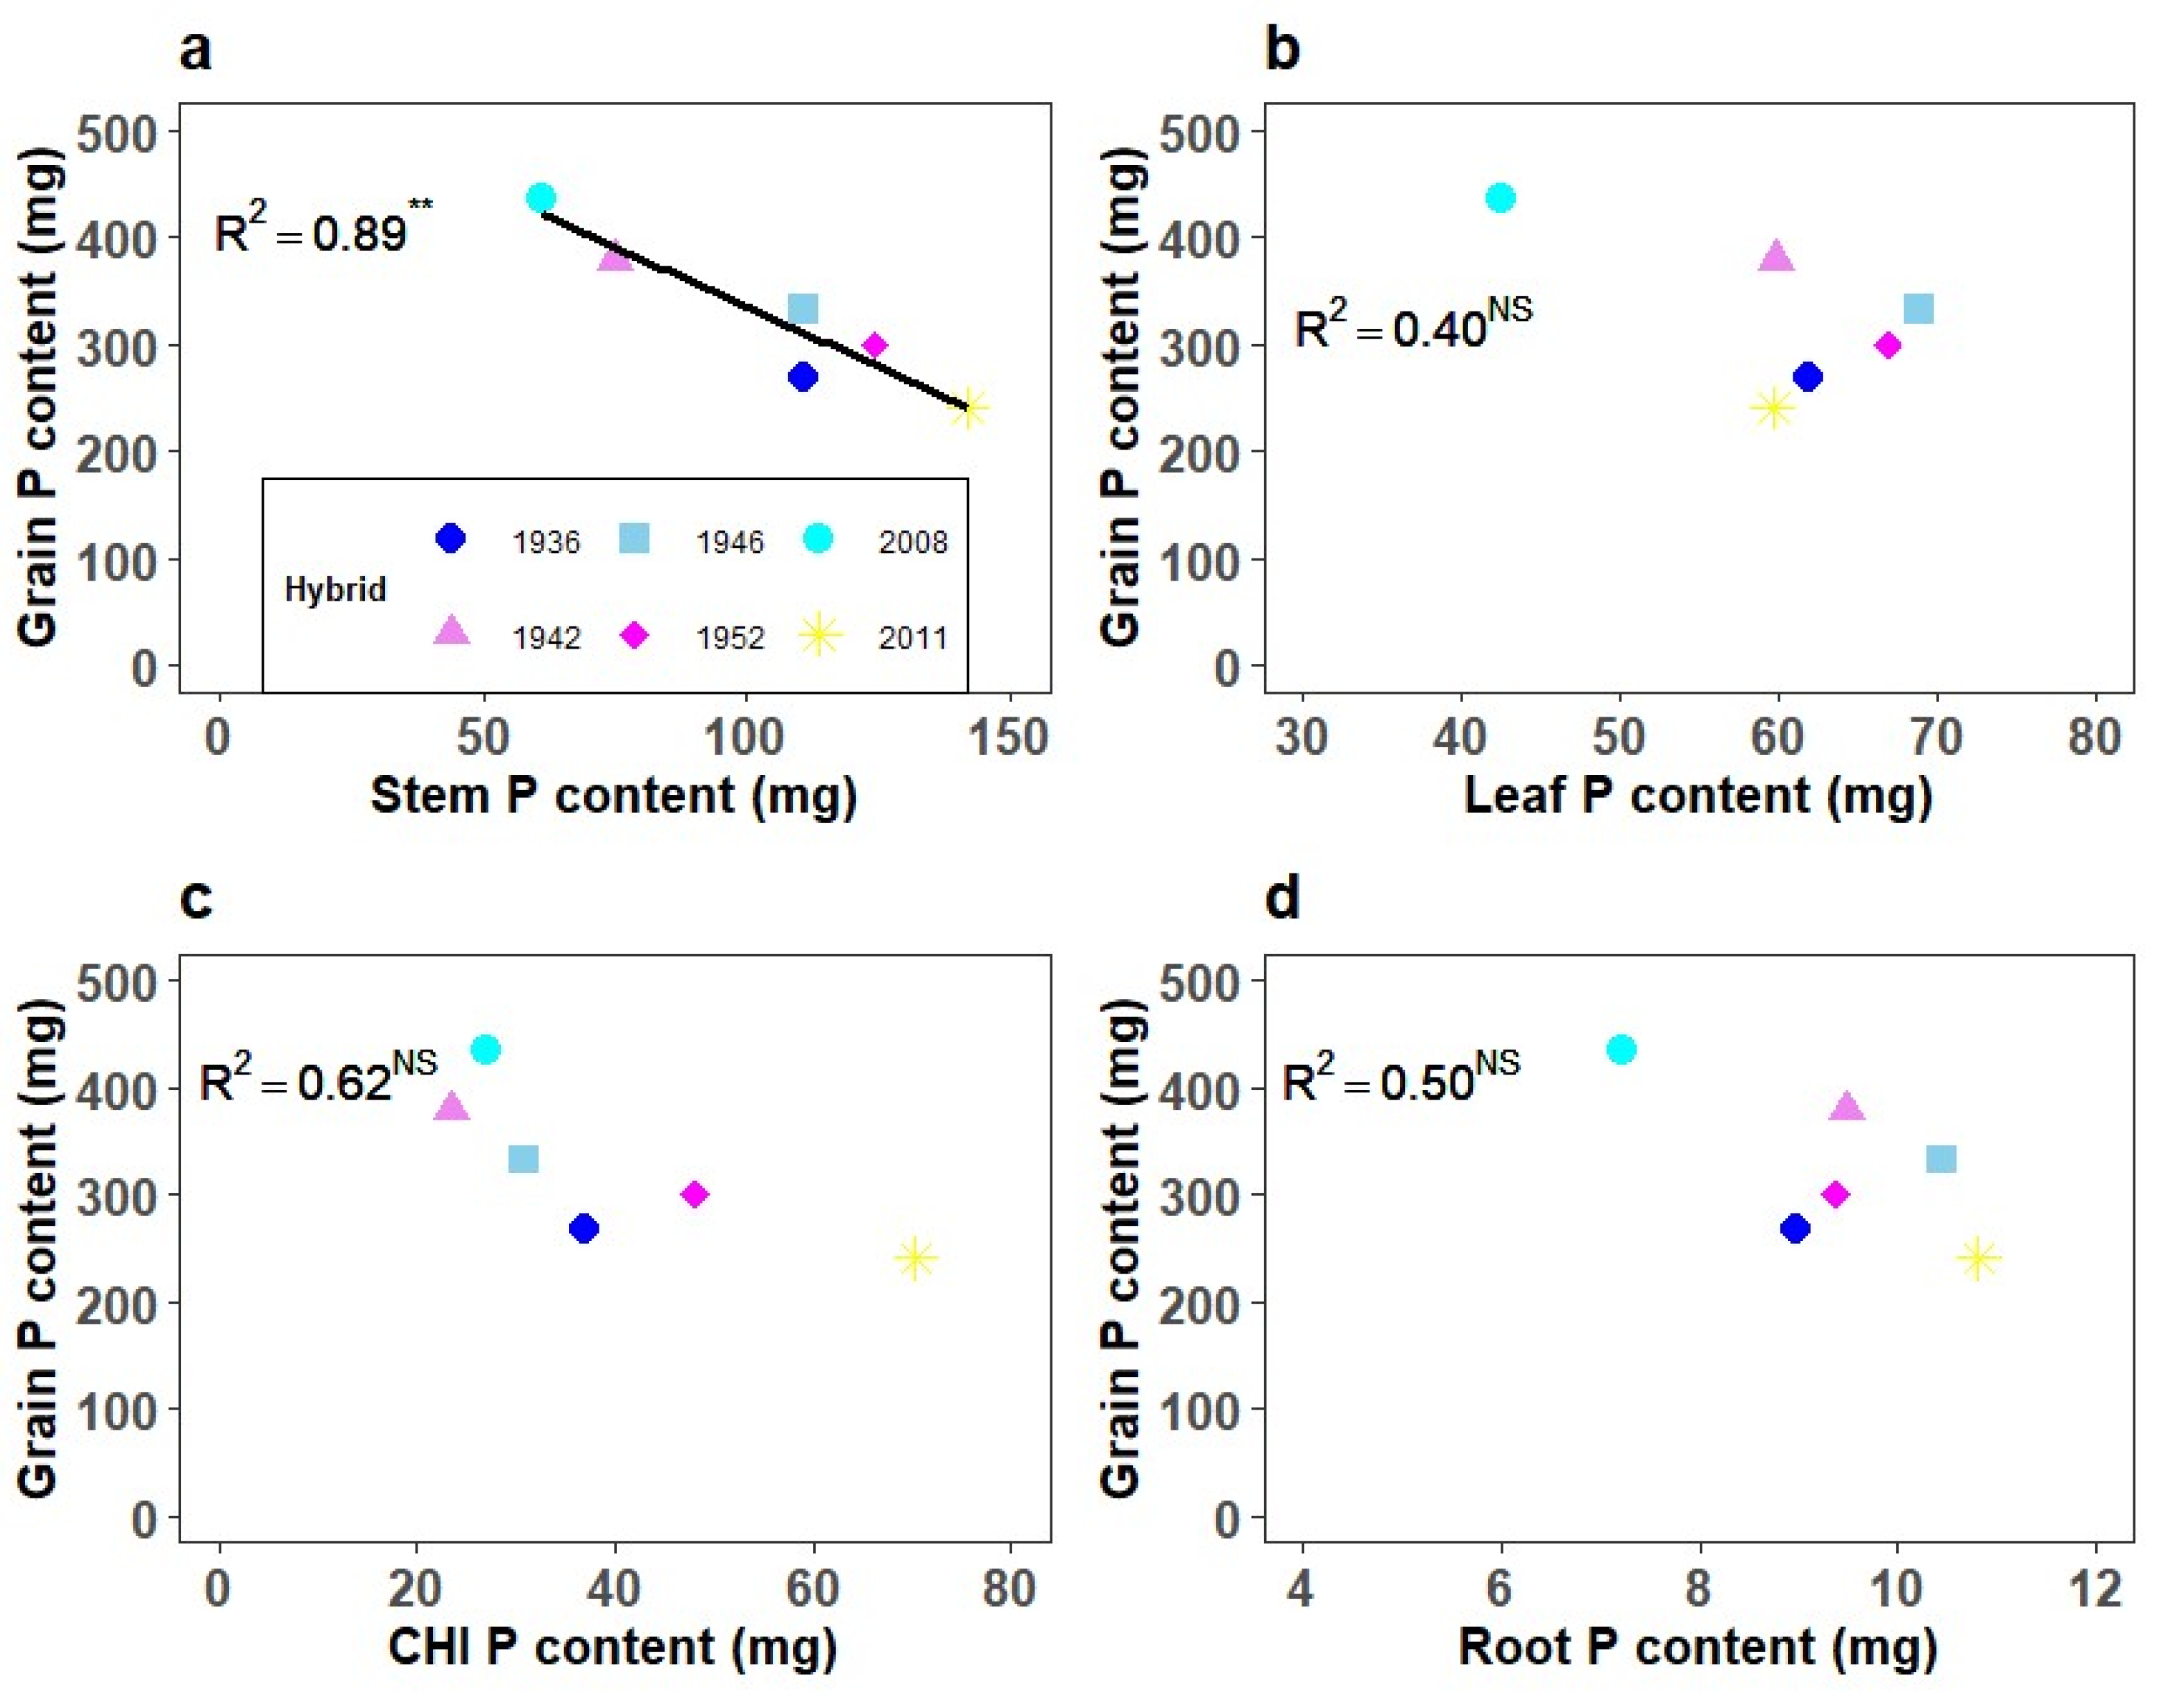
To investigate the impact of TP content and grain yield, as well as P partitioning in the vegetative tissues on grain P content, a regression analysis was performed. There was no relationship between leaf, CHI, and root P content with grain P (Figure 3b,c). However, stem P was strongly negatively correlated with grain P (R2 = 0.89; Figure 3a).

3.3. Phosphorus Utilization Efficiency

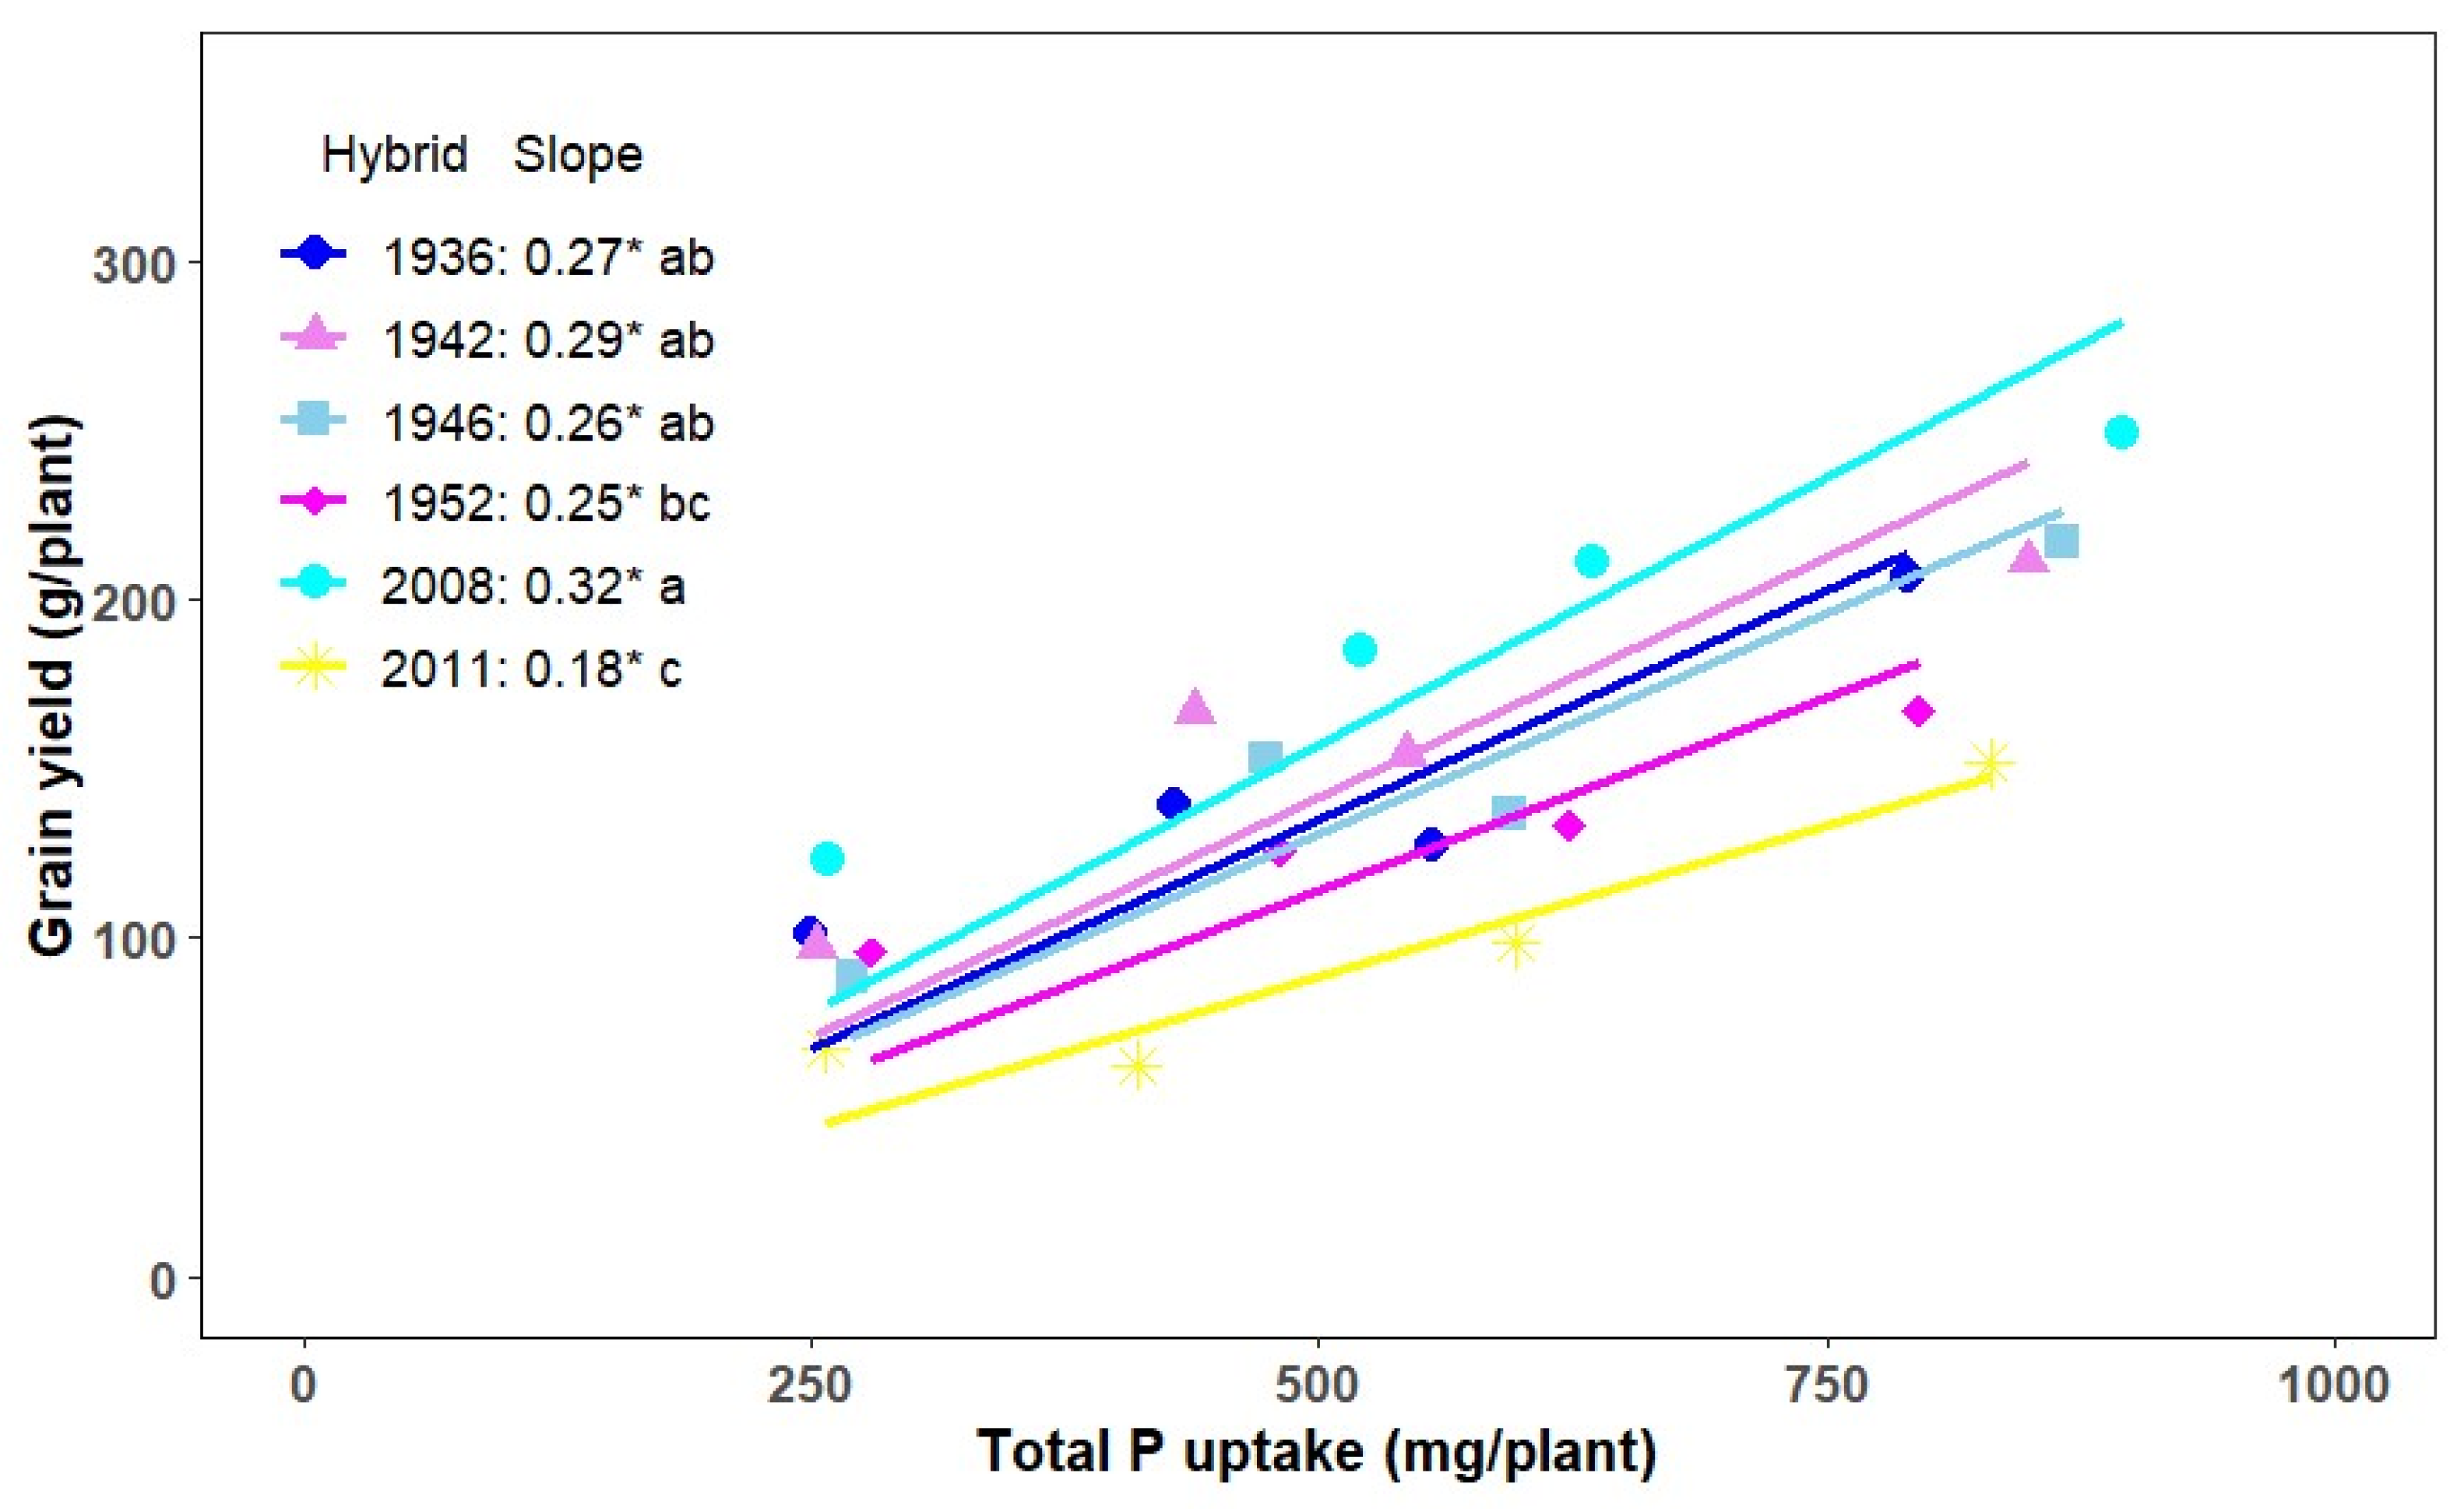
Grain yield responded to the level of P concentration applied, which was demonstrated by the linear relationship between the TP content and yield for each hybrid (Figure 4). The slope of the linear relationship is the P utilization efficiency (PUtE), which decreased in order: 0.32 > 0.29 > 0.27 > 0.26 > 0.25 > 0.18 for the 2008, 1942, 1936, 1946, 1952,and 2011 hybrids, respectively. The PUtE was greatest for the 2008 hybrid, but did not differ among the 1936, 1942, and 1946 hybrids (Figure 4). The values did not differ among the early hybrids, but all the early hybrids had a greater PUtE than the 2011 hybrid, except for the 1952 hybrid (Figure 4). The PUtE of the 2011 hybrid was twofold lower than the 2008 hybrid.

4. Discussion

4.1. Hybrid Biomass and Partitioning

Phosphorus contributes to biomass production by promoting early crop growth and increasing the synthesis of sucrose, thereby maximizing the transport of assimilates from source to sink [2,26,38]. A low P supply to plants increases starch synthesis in the chloroplasts of leaves, which reduces the production of new assimilates and results in sluggish growth of plants [39]. The response of corn to increasing solution P levels on biomass production was demonstrated by Penn et al. [31] and Ampong et al. [26]. However, increased biomass at maturity does not guarantee greater corn grain yield. Grain production is also dependent on the efficient remobilization of assimilates from the source (vegetative tissues) to the sink (grain) [26,40]. Chen et al. [40] evaluated biomass partitioning at maturity of two older (1967 and 1975) and two more recent (2005) Dekalb (Bayer Crop Science, St. Louis, MO, USA) corn hybrids in two different years in a field experiment. Total biomass did not differ among hybrids in year 1, but significantly more biomass was partitioned into the grain of the recent hybrids than in the older hybrids in year 2. In year 2, the recent hybrids produced more biomass and partitioned more of the biomass into grain compared to the old hybrids. In a field experiment with three corn hybrids, Ray et al. [29] also found greater corn biomass production associated with greater partitioning of biomass into grain. On the other hand, Sun et al. [30] and Chen et al. [40] found that the total corn biomass at maturity decreased when corn plants allocated less biomass into grain, despite similar total biomass at silking among several hybrids.
In our study, total biomass production did not differ among hybrids (Table 2), but differences in grain yield did occur (Table 2). Grain yield among the older or early hybrids did not differ and was similar to the newer hybrids. Interestingly, there was a clear difference in grain yield between the two most recent hybrids (2008 and 2011). The number of kernel rows per ear and kernel number per plant were similar between the 2008 and 2011 hybrids, but kernel weight was greater in the former than the latter hybrid (Table 2). This suggests that sink establishment did not differ between hybrids. However, the differences in yield between the hybrids were a result of differences in sink filling. It is important to note that the 2008 hybrid carries genes that confer high total fermentable ethanol, which may indicate enhanced carbon metabolism and contribute to increased grain yield. Corn breeding over the past 80 years has consistently resulted in increased grain yield when grown in the field [20,33,41,42]. In fact, Chen et al. [33] and Chen et al. [43] found that the increasing grain yield in Dekalb corn hybrids released between 1967 and 2005 was a result of greater improvement in both kernel number and weight. Mueller et al. [41] also found that kernel weight and number in Pioneer era hybrids were driving yield increases in corn hybrids released between 1946 and 2015. However, this was not the case for the most recent hybrid tested (2011) in our study, as grain yield was the lowest, even when compared to the older hybrids. Numerically, the kernel number in the 2008 hybrid was 27% higher than in the 2011 hybrid, while kernel weight was similarly greater by 29% in the 2008 hybrid compared to the 2011 hybrid. The kernel weight and number are manifestations of the sink “size” and “strength”. It was expected that the hybrid with a lower kernel number would at least have the same kernel weight, or perhaps greater kernel weight. However, the results showed a contrary tradeoff between kernel number and weight in the 2008 and 2011 hybrids. It is important to note that the kernel number per plant was estimated from total grain and kernel weight, which could have introduced an error in the determination of kernel number. However, findings from the studies of Chen et al. [33], Chen et al. [43], and Mueller et al. [41] showed no relationship between kernel number and kernel weight.
It is important to keep in mind that the conditions of this experiment permit evaluating the true genetic potential between hybrids through ideal conditions and the elimination of confounding plant–soil interactions. Unlike in the field, where extreme heat, moisture deficit, pollination, high planting density, nutrient deficiencies, diseases, and pests could affect grain yield, the grow room system maintained a conducive environment for each plant to achieve a high grain yield. Emmett et al. [20] evaluated the trends in grain yield of 12 corn hybrids that were released between 1936 and 2011 in a field experiment; grain yield did not differ much in the hybrids that were released before 1970, which is consistent with our findings that the older or early hybrids produced similar grain yields when grown under the same management conditions including planting density. In the same study by Emmett et al. [20], grain yield sharply increased in corn plants that were released after 1980 and then decreased in the 2011 hybrid to a level similar to that of early hybrids released before 1970, which is similar to our observations.
The harvest index (HI) of corn is typically above 35% [23,29]. However, a HI below 30% has been reported by Sun et al. [30]. Essentially, the very low HI in the 2011 hybrid (around 25%; see Figure 1a, percent biomass as grain) was due to the appreciable retention of assimilates in the vegetative tissues at the expense of assimilate remobilization to the grain. It is not clear what might have contributed to the inefficiencies in assimilate remobilization during grain filling in the 2011 hybrid, but this might again be due to inefficient sink filling, resulting in low kernel weight. By “sink size”, we mean kernel number and weight, which are initially fixed genetically, followed by potential decreases due to conditions of the growth environment [25,33,44]. Reduced sink strength due to lower kernel number, potential kernel weight, or an inefficient sink filling process (i.e., low sink activity) imposes a feedback regulation mechanism that limits nutrient re-translocation to grain, inefficiencies in sucrose transport, and a high starch-to-sucrose ratio in the source tissues (stem and leaves) [2,38,45]. The effect of a high starch-to-sucrose ratio, small sink size, and low sink activity on corn grain yield reduction has been reported by Wang and Ning [39] and Olmedo Pico et al. [46]. Further research would be needed to elucidate the source–sink relationship in the 2011 hybrid and the mechanisms leading to low remobilization of assimilates to the grain (sink) during grain filling. It must be noted that most of the field studies evaluating biomass partitioning among corn era hybrids did not account for root biomass [20,33,40,41]. However, a smaller sink size (kernel number and weight) and activity (inefficient kernel filling process) could shift assimilate allocation toward the roots, thereby increasing root biomass [47,48]. It is, therefore, not surprising that the 2011 hybrid allocated more biomass to the roots, given that total plant biomass remained unchanged (Table 2). Thus, the high root/shoot ratio in the 2011 hybrid was likely a result of the smaller sink size, which redirected some of the assimilates to the roots. Further, the greater allocation of biomass to roots for the 2011 hybrid may be a manifestation of its genetic purpose in hybrid development, i.e., increased drought tolerance. Although it is not possible to assess P uptake efficiency from our grow room experiment, which prevented root architecture from influencing P uptake, perhaps the 2011 hybrid possesses appreciable P uptake efficiency under less-optimal field conditions, particularly under drought stress.

4.2. Plant Phosphorus Concentration, Uptake, and Partitioning

Physiologically, the total uptake of nutrients by corn is crucial, but the efficiency in converting these nutrients into grain yield is equally significant [8,26,49]. The majority of nutrient studies with corn era hybrids have focused on N use efficiency. Woli et al. [24] conducted an experiment with two Pioneer corn era hybrids that were released in 1960 and 2000 and grown under low (39,000 plants ha−1) and high (84,000 plants ha−1) plant densities, respectively. They found that while N and P concentrations decreased in the 2000 hybrid compared to the 1960 hybrid, the total N and P content, expressed per unit area, increased due to higher grain yield and plant density. However, total P content per plant decreased from about 630 to 390 mg plant−1 from the 1960 to 1990 era hybrids, followed by an increase to around 475 mg plant−1 for the 2000 era hybrid (values do not include roots [32]). Mueller et al. [41] conducted a field experiment with Pioneer corn era hybrids released between 1946 and 2015, grown at high plant densities, to evaluate N use efficiency. They found that although grain N concentration had decreased with newer hybrids, both total plant N and grain N content increased due to increased kernel number and grain yield. DeBruin et al. [50] found similar results with Pioneer corn hybrids released between 1934 and 2013, showing that grain N content (per unit area and per plant) increased with new hybrids despite a decline in N concentration, driven by higher kernel number and weight. Although the Woli et al. [32] study showed appreciable changes in total P content per plant with hybrid era, the results of this study found few differences between hybrids of different eras (Table 2). It is important to note that this study was conducted in a grow room using a sand culture hydroponics system, eliminating the diffusive movement of P to the root surface and other confounding factors present in field conditions. Essentially, this setup ensured that all hybrids had an equal opportunity to fully express their P uptake and utilization potential. Purposely, our experiment conditions eliminated any influence that differences in root growth or architecture would have on nutrient uptake, which may explain why we observed few differences in P uptake per plant compared to Woli et al. [32]. However, P partitioning was different among the hybrids (Figure 1b). The most conspicuous difference in P partitioning was found between the most recent hybrids (i.e., 2008 and 2011). About 77% of the TP was deposited into the grain of the 2008 hybrid at maturity, but the 2011 hybrid deposited only 47% of TP in the grain (Figure 1b). Consequently, the 2008 hybrid had lower P content in the vegetative tissues (root, stem, and leaf) versus that of the 2011 hybrid (Figure 2). The grain P concentration did not differ between hybrids, but the greater grain yield of the 2008 hybrid resulted in a higher grain P content compared to the 2011 hybrid (Figure 2). The results demonstrate that P partitioning into plant parts is also a function of biomass partitioning and not dictated by P concentration in the plant parts alone. The influence of biomass partitioning on P accumulation was also demonstrated in Ampong et al. [26]. The similar grain P concentration yet varying P contents among all hybrids in the current study also demonstrate that a feedback regulation mechanism is involved in signaling the source to restrict the unloading of P into the grain when the sink (kernel number and weight) has limited capacity to receive P from the source [45]. This suggests that sink size and activity additionally regulate P movement into grain, rather than source activity alone.
During grain filling, new assimilates are remobilized from the leaves into the stem, which serves as a transient storage for assimilates and other nutrients, including P [41]. The phloem transport of assimilates also moves nutrients into the grain, which has been explained by Munch’s pressure–flow hypothesis of phloem translocation [51,52]. This explains our observation that the percentage of P deposited in the stem and grain was more than that in the leaf, root, and CHI (Figure 1b), which also manifested in the weak negative relationship between root and leaf P vs. grain P content (Figure 3). Sun et al. [30] and Ray et al. [29] reported that the majority of N, P, Fe, and other nutrients in corn at harvest are deposited in the grain and stem, and therefore, poor translocation of assimilates from the stem to the grain results in higher nutrient retention in the stem. Indeed, the P and Fe concentrations in the stem were highly negatively correlated with grain yield (Figures S2 and S3). Since stem P concentration was highly negatively correlated with grain yield, it was expected that N and other macronutrients would behave similarly, if assimilate remobilization indeed controlled nutrient partitioning between the stem and grain. While there was a negative trend for N and other macronutrient concentrations in the stem vs. grain yield, the relationships were not statistically significant (Figure S2). The N concentration was high in the leaf and CHI of the hybrid with the lowest grain yield, the 2011 hybrid (Table S1). This suggests that the smaller sink size and activity (kernel number and weight) in the 2011 hybrid triggered an early feedback regulation mechanism, which limited N movement from leaf to stem, resulting in a higher concentration of N in the leaf. Furthermore, stem Fe concentration was positively correlated with stem P concentration (Figure S4), demonstrating that the limited P movement was related to Fe in the stem. Iron-P precipitation within the plant has been demonstrated by Adriano [53]. It is not clear if co-precipitation of P and Fe limited P transport within the corn plant. Further research needs to be conducted on Fe–P cross-talk and its effect on assimilate utilization and partitioning within corn plants.

4.3. Phosphorus Utilization Efficiency

The accumulation of biomass, leading to a corresponding increase in total nutrient uptake, does not always ensure greater corn yield and efficient nutrient use [29,40]. Instead, efficient partitioning of biomass and nutrients has a tremendous effect on nutrient use efficiency [18,22,29,54]. Essentially, the improved yield achieved through breeding, driven by reduced corn barrenness and enhanced yield components, is a key factor contributing to higher nutrient use efficiency [22,25,33,43]. Agronomic utilization of P is the ability of corn plants to mobilize and utilize internal P to produce grain yield. In corn, grain P content largely depends on grain yield [24]. However, factors such as P uptake timing [26], grain P concentration [30], and differences in PUtE due to genetics can result in exceptions. Clearly, greater PUtE and gPUtE are beneficial for both agronomic and environmental reasons.
In this study, PUtE (overall P utilization efficiency, Figure 4) and gPUtE (grain P utilization efficiency, i.e., grain P harvest index, Figure 1b, % TP in grain) differed especially between the recent hybrids (2008 and 2011), and these differences were strongly related to grain yield (R2 = 0.94 **, figure not shown). Meanwhile, grain P content was not related to P concentration (Figure 2). The TP in the plant did not totally dictate grain yield, as demonstrated by the non-significant relationship between TP and yield (Figure S1), suggesting that yield differences were partly a result of inherent genetic differences in biomass partitioning (Figure 1a). Essentially, in hybrids that have similar TP content, greater biomass allocation to the grain would have a consequential effect on PUtE and gPUtE. Sun et al. [30] found that among three corn hybrids tested, yield in two hybrids was independent of TP and instead depended on the partitioning of biomass between the stem and grain, which influenced variations in the PUtE. Woli et al. [24] evaluated P uptake between two corn era hybrids that were released in 1960 and 2000. Although the more recent hybrid produced greater yield and TP than the 1960 hybrid, back-calculation of PUtE revealed values of approximately 0.3 g mg−1 for both the 1960 and 2000 hybrids, which is similar to our measurements that included roots (Figure 4). The two recent hybrids used in our study (i.e., 2008 and 2011) had similar TP and grain P concentrations but were significantly different in PUtE and gPUtE. The significant difference in PUtE (and therefore grain yield) between these two hybrids may be explained by differences in biomass partitioning. In this example, the 2008 hybrid remobilized >70% of the TP into the grain, while the 2011 hybrid remobilized <50% into the grain, with >50% retained in the vegetative tissues (Figure 1b). Similarly, stem P content was significantly and negatively correlated with grain P content (Figure 3).
If P concentration is not a key determinant of PUtE and gPUtE, then P accumulation is less critical than ensuring its availability during the critical window required for maximizing yield components. Ampong et al. [26] demonstrated in their study that the timing of P application within the critical window of corn growth could also significantly enhance PUtE and gPUtE. In their study, they supplied sufficient P (S) to corn between V6 (vegetative growth stage 6) and R1 (reproductive growth stage 1), and low P (L) before V6 and after R1 (termed as LSL plants). This means that low P was applied initially until V6, in which the supply was changed to a sufficient concentration, and then changed again to low at R1. Although TP content was significantly lower in the LSL plants due to less vegetative biomass and low P concentration in the plant parts, the yield did not differ from plants that received sufficient P throughout. Further analysis revealed that PUtE was almost twice as high in the LSL plants compared to plants that received sufficient P throughout. These results underscore the need to integrate P application timing together with breeding that targets increasing yield with less P in improving PUtE and gPUtE.

5. Conclusions

This research investigated potential PUtE differences among corn era hybrids over a 75-year span. The results of this study indicated that total biomass and total P uptake (per plant) had not changed significantly with hybrid improvement over time, when grown under ideal conditions and with the omission of root architecture. There were differences in grain yield between hybrids, but it was not correlated with the year of hybrid release. Grain yield was twofold greater in the 2008 hybrid compared to the 2011 hybrid. The greatest difference in the partitioning of biomass was between the two most recent hybrids (2008 and 2011). Biomass partitioning influenced P accumulation in the various plant parts. Plants with a higher yield exhibited a correspondingly greater grain P content despite similar grain P concentrations (R2 = 0.89). The stem P content was strongly negatively correlated with grain P content (R2 = 0.89), indicating a trade-off between biomass and P partitioning in different plant parts. Grain yield was influenced by P partitioning, which impacted dry matter partitioning, as manifested in differences in PUE. There was no clear trend in PUtE and gPUtE with year of release, although there was a strong and significant correlation between PUtE and gPUtE vs. grain yield. The gPUtE in 2008 was greater than that of the 1936, 1952, and 2011 hybrids. The older hybrids, except 1952, had greater PUtE than the 2011 hybrid. The PUtE and gPUtE did not differ among the older hybrids. Although there was no clear trend in the breeding time period on PUtE, it appears that breeding for certain traits indirectly affected PUtE, for example, drought tolerance in the 2011 hybrid. The results suggest that developing corn genetics with greater PUtE is beneficial to grain production and efficiency.

Supplementary Materials

The following supporting information can be downloaded at: https://www.mdpi.com/article/10.3390/agronomy15061407/s1, Table S1. Macronutrient concentration (g/kg) in root, stem, leaf, CHI (cob, husk, immature ear), and grain from harvested corn plants grown synthetically in indoor grow room. Values are averages across four phosphorus concentration treatments and four replications for each hybrid. Table S2. Micronutrient concentration (mg/kg) in root, stem, leaf, CHI (cob, husk, immature ear), and grain from harvested corn plants grown synthetically in indoor grow room. Values are averages across four phosphorus concentration treatments and four replications for each hybrid. Figure S1. Grain yield shown as a function of total phosphorus (TP) content. Each data point represents the mean of 16 values, derived from four replications for each phosphorus concentration treatment (4, 7, 10, and 12 mg P L−1). NS = non-significant, p > 0.05. Figure S2. Grain yield (g) shown as a function of phosphorus, P (a), nitrogen, N (b), potassium, K (c), sulfur, S (d), magnesium, Mg (e), and calcium, Ca (f) concentration (g/kg). Each data point represents the mean of 16 values, derived from four replications for each phosphorus concentration treatment (4, 7, 10, and 12 mg P L−1). NS p ≥ 0.05, ** p ≤ 0.01. Figure S3. Grain yield (g) shown as a function of iron, Fe (a), and zinc, Zn (b) concentration (mg/kg). Each data point represents the mean of 16 values, derived from four replications for each phosphorus concentration treatment (4, 7, 10, and 12 mg P L−1). NS p ≥ 0.05, * p ≤ 0.05. Figure S4. Stem P concentration (g/kg) shown as a function of iron, Fe (a), and zinc, Zn (b) concentration (mg/kg). Each data point represents the mean of 16 values, derived from four replications for each phosphorus concentration treatment (4, 7, 10, and 12 mg P L−1). NS p ≥ 0.05, ** p ≤ 0.01.

Author Contributions

Conceptualization, methodology, supervision, project administration, writing—reviewing and editing, C.J.P.; formal analysis, investigation, writing—original draft preparation, K.A.; supervision, writing—reviewing and editing, J.C.; writing—reviewing and editing, D.Q. and M.W. All authors have read and agreed to the published version of the manuscript.

Funding

This research was funded by the USDA National Institute of Food and Agriculture (NIFA) and the USDA-ARS Conservation Effects Assessment Project (CEAP).

Data Availability Statement

All data in the figures is listed in the tables or Supplementary File.

Conflicts of Interest

The authors declare no conflicts of interest.

References

  1. Pieters, A.J.; Paul, M.J.; Lawlor, D.W. Low sink demand limits photosynthesis under Pi deficiency. J. Exp. Bot 2001, 52, 1083–1091. [Google Scholar] [CrossRef] [PubMed]
  2. Rychter, A.M.; Rao, I.M.; Rao, I.M. Role of Phosphorus in Photosynthetic Carbon Metabolism; Taylor & Francis Group: Abingdon, UK, 2005. [Google Scholar]
  3. Cordell, D.; Drangert, J.O.; White, S. The Story of phosphorus: Global food security and food for thought. Glob. Environ. Change 2009, 19, 292–305. [Google Scholar] [CrossRef]
  4. Hinsinger, P. Bioavailability of soil inorganic p in the rhizosphere as affected by root-induced chemical changes: A review. Plant Soil 2001, 237, 173–195. [Google Scholar] [CrossRef]
  5. Penn, C.J.; Camberato, J.J. A Critical Review on Soil Chemical Processes That Control How Soil Ph Affects Phosphorus Availability to Plants. Agriculture 2019, 9, 120. [Google Scholar] [CrossRef]
  6. Schoumans, O.F.; Chardon, W.J.; Bechmann, M.E.; Gascuel-Odoux, C.; Hofman, G.; Kronvang, B.; Rubæk, G.H.; Ulén, B.; Dorioz, J.M. Mitigation options to reduce phosphorus losses from the agricultural sector and improve surface water quality: A review. Sci. Total Environ. 2014, 468–469, 1255–1266. [Google Scholar] [CrossRef] [PubMed]
  7. Zhu, X.; Liu, W.; Chen, J.; Bruijnzeel, L.A.; Mao, Z.; Yang, X.; Cardinael, R.; Meng, F.R.; Sidle, R.C.; Seitz, S.; et al. Reductions in water, soil and nutrient losses and pesticide pollution in agroforestry practices: A review of evidence and processes. Plant Soil 2020, 453, 45–86. [Google Scholar] [CrossRef]
  8. Vandamme, E.; Rose, T.; Saito, K.; Jeong, K.; Wissuwa, M. Integration of P acquisition efficiency, P utilization efficiency and low grain P concentrations into P-efficient rice genotypes for specific target environments. Nutr. Cycl. Agroecosyst. 2016, 104, 413–427. [Google Scholar] [CrossRef]
  9. Itoh, S.; Barber, S.A. Phosphorus uptake by six plant species as related to root hairs. Agron. J. 1983, 75, 457–461. [Google Scholar] [CrossRef]
  10. Smith, J.S.C. Genetic variability within U.S. hybrid maize: Multivariate analysis of isozyme data. Crop Sci. 1984, 24, 1041–1046. [Google Scholar] [CrossRef]
  11. Wu, Q.P.; Chen, F.J.; Chen, Y.L.; Yuan, L.X.; Zhang, F.S.; Mi, G.H. Root growth in response to nitrogen supply in Chinese maize hybrids released between 1973 and 2009. Sci. China Life Sci. 2011, 54, 642–650. [Google Scholar] [CrossRef]
  12. Rose, T.J.; Rose, M.T.; Pariasca-Tanaka, J.; Heuer, S.; Wissuwa, M. The frustration with utilization: Why have improvements in internal phosphorus utilization efficiency in crops remained so elusive? Front. Plant Sci. 2011, 2, 73. [Google Scholar] [CrossRef] [PubMed]
  13. Chen, F.; Liu, J.; Liu, Z.; Chen, Z.; Ren, W.; Gong, X.; Wang, L.; Cai, H.; Pan, Q.; Yuan, L.; et al. Breeding for high-yield and nitrogen use efficiency in maize: Lessons from comparison between Chinese and US cultivars. In Advances in Agronomy; Academic Press Inc.: Cambridge, MA, USA, 2021; Volume 166, pp. 251–275. ISBN 9780128245873. [Google Scholar]
  14. Ciampitti, I.A.; Lemaire, G. From use efficiency to effective use of nitrogen: A dilemma for maize breeding improvement. Sci. Total Environ. 2022, 826, 154125. [Google Scholar] [CrossRef] [PubMed]
  15. Woli, K.P.; Boyer, M.J.; Elmore, R.W.; Sawyer, J.E.; Abendroth, L.J.; Barker, D.W. Corn era hybrid response to nitrogen fertilization. Agron. J. 2016, 108, 473–486. [Google Scholar] [CrossRef]
  16. Haase, C.; Wentzel, S.; Schmidt, R.; Joergensen, R.G. Changes in P fractions after long-term application of biogas slurry to soils under organic farming. Org. Agric. 2016, 6, 297–306. [Google Scholar] [CrossRef]
  17. Ciampitti, I.A.; Vyn, T.J. Physiological perspectives of changes over time in maize yield dependency on nitrogen uptake and associated nitrogen efficiencies: A review. Field Crops Res. 2012, 133, 48–67. [Google Scholar] [CrossRef]
  18. Ciampitti, I.A.; Vyn, T.J. Grain nitrogen source changes over time in maize: A review. Crop Sci. 2013, 53, 366–377. [Google Scholar] [CrossRef]
  19. Echarte, L.; Rothstein, S.; Tollenaar, M. The Response of leaf photosynthesis and dry matter accumulation to nitrogen supply in an older and a newer maize hybrid. Crop Sci. 2008, 48, 656–665. [Google Scholar] [CrossRef]
  20. Emmett, B.D.; Buckley, D.H.; Smith, M.E.; Drinkwater, L.E. Eighty years of maize breeding alters plant nitrogen acquisition but not rhizosphere bacterial community composition. Plant Soil 2018, 431, 53–69. [Google Scholar] [CrossRef]
  21. Bayuelo-Jiménez, J.S.; Ochoa-Cadavid, I. Phosphorus acquisition and internal utilization efficiency among maize landraces from the Central Mexican Highlands. Field Crops Res. 2014, 156, 123–134. [Google Scholar] [CrossRef]
  22. Haegele, J.W.; Cook, K.A.; Nichols, D.M.; Below, F.E. Changes in nitrogen use traits associated with genetic improvement for grain yield of maize hybrids released in different decades. Crop Sci. 2013, 53, 1256–1268. [Google Scholar] [CrossRef]
  23. Bender, R.R.; Haegele, J.W.; Ruffo, M.L.; Below, F.R. Modern corn hybrids’ nutrient uptake patterns. Better Crop. 2013, 97, 7–10. [Google Scholar]
  24. Woli, K.P.; Sawyer, J.E.; Boyer, M.J.; Abendroth, L.J.; Elmore, R.W. Corn era hybrid macronutrient and dry matter accumulation in plant components. Agron. J. 2018, 110, 1648–1658. [Google Scholar] [CrossRef]
  25. Olmedo Pico, L.B.; Zhang, C.; Vyn, T.J. The central role of ear nitrogen uptake in maize endosperm cell and kernel weight determination during the lag period. Field Crops Res. 2021, 273, 108285. [Google Scholar] [CrossRef]
  26. Ampong, K.; Penn, C.J.; Camberato, J.J. The timing of phosphorus availability to corn: What growth stages are most critical for maximizing yield ? Agronomy 2024, 14, 2731. [Google Scholar] [CrossRef]
  27. Schleuss, P.M.; Widdig, M.; Heintz-Buschart, A.; Kirkman, K.; Spohn, M. Interactions of nitrogen and phosphorus cycling promote p acquisition and explain synergistic plant-growth responses. Ecology 2020, 101, e03003. [Google Scholar] [CrossRef]
  28. Fageria, N.K.; Baligar, V.C.; Li, Y.C. The role of nutrient efficient plants in improving crop yields in the twenty first century. J. Plant Nutr. 2008, 31, 1121–1157. [Google Scholar] [CrossRef]
  29. Ray, K.; Banerjee, H.; Dutta, S.; Sarkar, S.; Murrell, T.S.; Singh, V.K.; Majumdar, K. Macronutrient management effects on nutrient accumulation, partitioning, remobilization, and yield of hybrid maize cultivars. Front. Plant Sci. 2020, 11, 1307. [Google Scholar] [CrossRef]
  30. Sun, Y.; Han, Y.; Xu, Z.; Zhang, J.; Shen, J.; Cheng, L. Phosphorus partitioning contribute to phosphorus use efficiency during grain filling in Zea mays. Front. Plant Sci. 2023, 14, 1223532. [Google Scholar] [CrossRef]
  31. Penn, C.J.; Camberato, J.J.; Wiethorn, M.A. How much phosphorus uptake is required for achieving maximum maize grain yield? Part 1: Luxury consumption and implications for yield. Agronomy 2023, 13, 95. [Google Scholar] [CrossRef]
  32. Woli, K.P.; Sawyer, J.E.; Boyer, M.J.; Abendroth, L.J.; Elmore, R.W. Corn era hybrid dry matter and macronutrient accumulation across development stages. Agron. J. 2017, 109, 751–761. [Google Scholar] [CrossRef]
  33. Chen, K.; Camberato, J.J.; Tuinstra, M.R.; Kumudini, S.V.; Tollenaar, M.; Vyn, T.J. Genetic Improvement in density and nitrogen stress tolerance traits over 38 years of commercial maize hybrid release. Field Crops Res. 2016, 196, 438–451. [Google Scholar] [CrossRef]
  34. Wiethorn, M.; Penn, C.; Camberato, J. A research method for semi-automated large-scale cultivation of maize to full maturity in an artificial environment. Agronomy 2021, 11, 1898. [Google Scholar] [CrossRef]
  35. McKay Fletcher, D.M.; Ruiz, S.; Dias, T.; Petroselli, C.; Roose, T. Linking root structure to functionality: The impact of root system architecture on citrate-enhanced phosphate uptake. New Phytol. 2020, 227, 376–391. [Google Scholar] [CrossRef]
  36. Shapiro, S.S.; Wilk, M.B. An analysis of variance test for normality (complete samples). Biometrika 1965, 52, 591–611. [Google Scholar] [CrossRef]
  37. R Core Team. R: A Language and Environment for Statistical Computing; R Core Team: Vienna, Austria, 2022. [Google Scholar]
  38. Braun, D.M. Phloem Loading and Unloading of Sucrose: What a long, strange trip from source to sink. Annu. Rev. Plant Biol. 2022, 73, 553–584. [Google Scholar] [CrossRef]
  39. Wang, C.; Ning, P. Post-silking phosphorus recycling and carbon partitioning in maize under low to high phosphorus inputs and their effects on grain yield. Front. Plant Sci. 2019, 10, 784. [Google Scholar] [CrossRef]
  40. Chen, K.; Kumudini, S.V.; Tollenaar, M.; Vyn, T.J. Plant biomass and nitrogen partitioning changes between silking and maturity in newer versus older maize hybrids. Field Crops Res. 2015, 183, 315–328. [Google Scholar] [CrossRef]
  41. Mueller, S.M.; Messina, C.D.; Vyn, T.J. Simultaneous gains in grain yield and nitrogen efficiency over 70 years of maize genetic improvement. Sci. Rep. 2019, 9, 9095. [Google Scholar] [CrossRef]
  42. Duvick, D.N. The contribution of breeding to yield advances in maize (Zea mays L.). Adv. Agron. 2005, 86, 83–145. [Google Scholar] [CrossRef]
  43. Chen, K.; Camberato, J.J.; Vyn, T.J. Maize grain yield and kernel component relationships to morphophysiological traits in commercial hybrids separated by four decades. Crop Sci. 2017, 57, 1641–1657. [Google Scholar] [CrossRef]
  44. White, A.C.; Rogers, A.; Rees, M.; Osborne, C.P. How can we make plants grow faster? a source-sink perspective on growth rate. J. Exp. Bot. 2016, 67, 31–45. [Google Scholar] [CrossRef] [PubMed]
  45. Smith, M.R.; Rao, I.M.; Merchant, A. Source-sink relationships in crop plants and their influence on yield development and nutritional quality. Front. Plant Sci. 2018, 9, 1889. [Google Scholar] [CrossRef] [PubMed]
  46. Olmedo Pico, L.B.; Vyn, T.J. Dry matter gains in maize kernels are dependent on their nitrogen accumulation rates and duration during grain filling. Plants 2021, 10, 1222. [Google Scholar] [CrossRef] [PubMed]
  47. Gavrichkova, O.; Kuzyakov, Y. Respiration costs associated with nitrate reduction as estimated by 14co2 pulse labeling of corn at various growth stages. Plant Soil 2010, 329, 433–445. [Google Scholar] [CrossRef]
  48. Farrar, J.F.; Jones, D.L. The control of carbon acquisition by roots. New Phytol. 2000, 147, 43–53. [Google Scholar] [CrossRef]
  49. Wang, F.; Rose, T.; Jeong, K.; Kretzschmar, T.; Wissuwa, M. The knowns and unknowns of phosphorus loading into grains, and implications for phosphorus efficiency in cropping systems. J. Exp. Bot. 2016, 67, 1221–1229. [Google Scholar] [CrossRef]
  50. DeBruin, J.L.; Schussler, J.R.; Mo, H.; Cooper, M. Grain yield and nitrogen accumulation in maize hybrids released during 1934 to 2013 in the US Midwest. Crop Sci. 2017, 57, 1431–1446. [Google Scholar] [CrossRef]
  51. Marschner, P. Marschner’s Mineral Nutrition of Higher Plants, 3rd ed.; Academic Press: Cambridge, MA, USA, 2012; ISBN 9780123849052. [Google Scholar]
  52. Christy, A.L.; Ferrier, J.M. A mathematical treatment of munch’s pressure-flow hypothesis of phloem translocation. Plant Physiol. 1973, 52, 531–538. [Google Scholar] [CrossRef]
  53. Adriano, D.C. Phosphorus-micronutrient interaction effects on crop production. J. Plant Nutr. 1981, 3, 593–613. [Google Scholar] [CrossRef]
  54. Yan, S.; Wu, Y.; Fan, J.; Zhang, F.; Guo, J.; Zheng, J.; Wu, L.; Lu, J. Quantifying nutrient stoichiometry and radiation use efficiency of two maize cultivars under various water and fertilizer management practices in Northwest China. Agric. Water Manag. 2022, 271, 107772. [Google Scholar] [CrossRef]
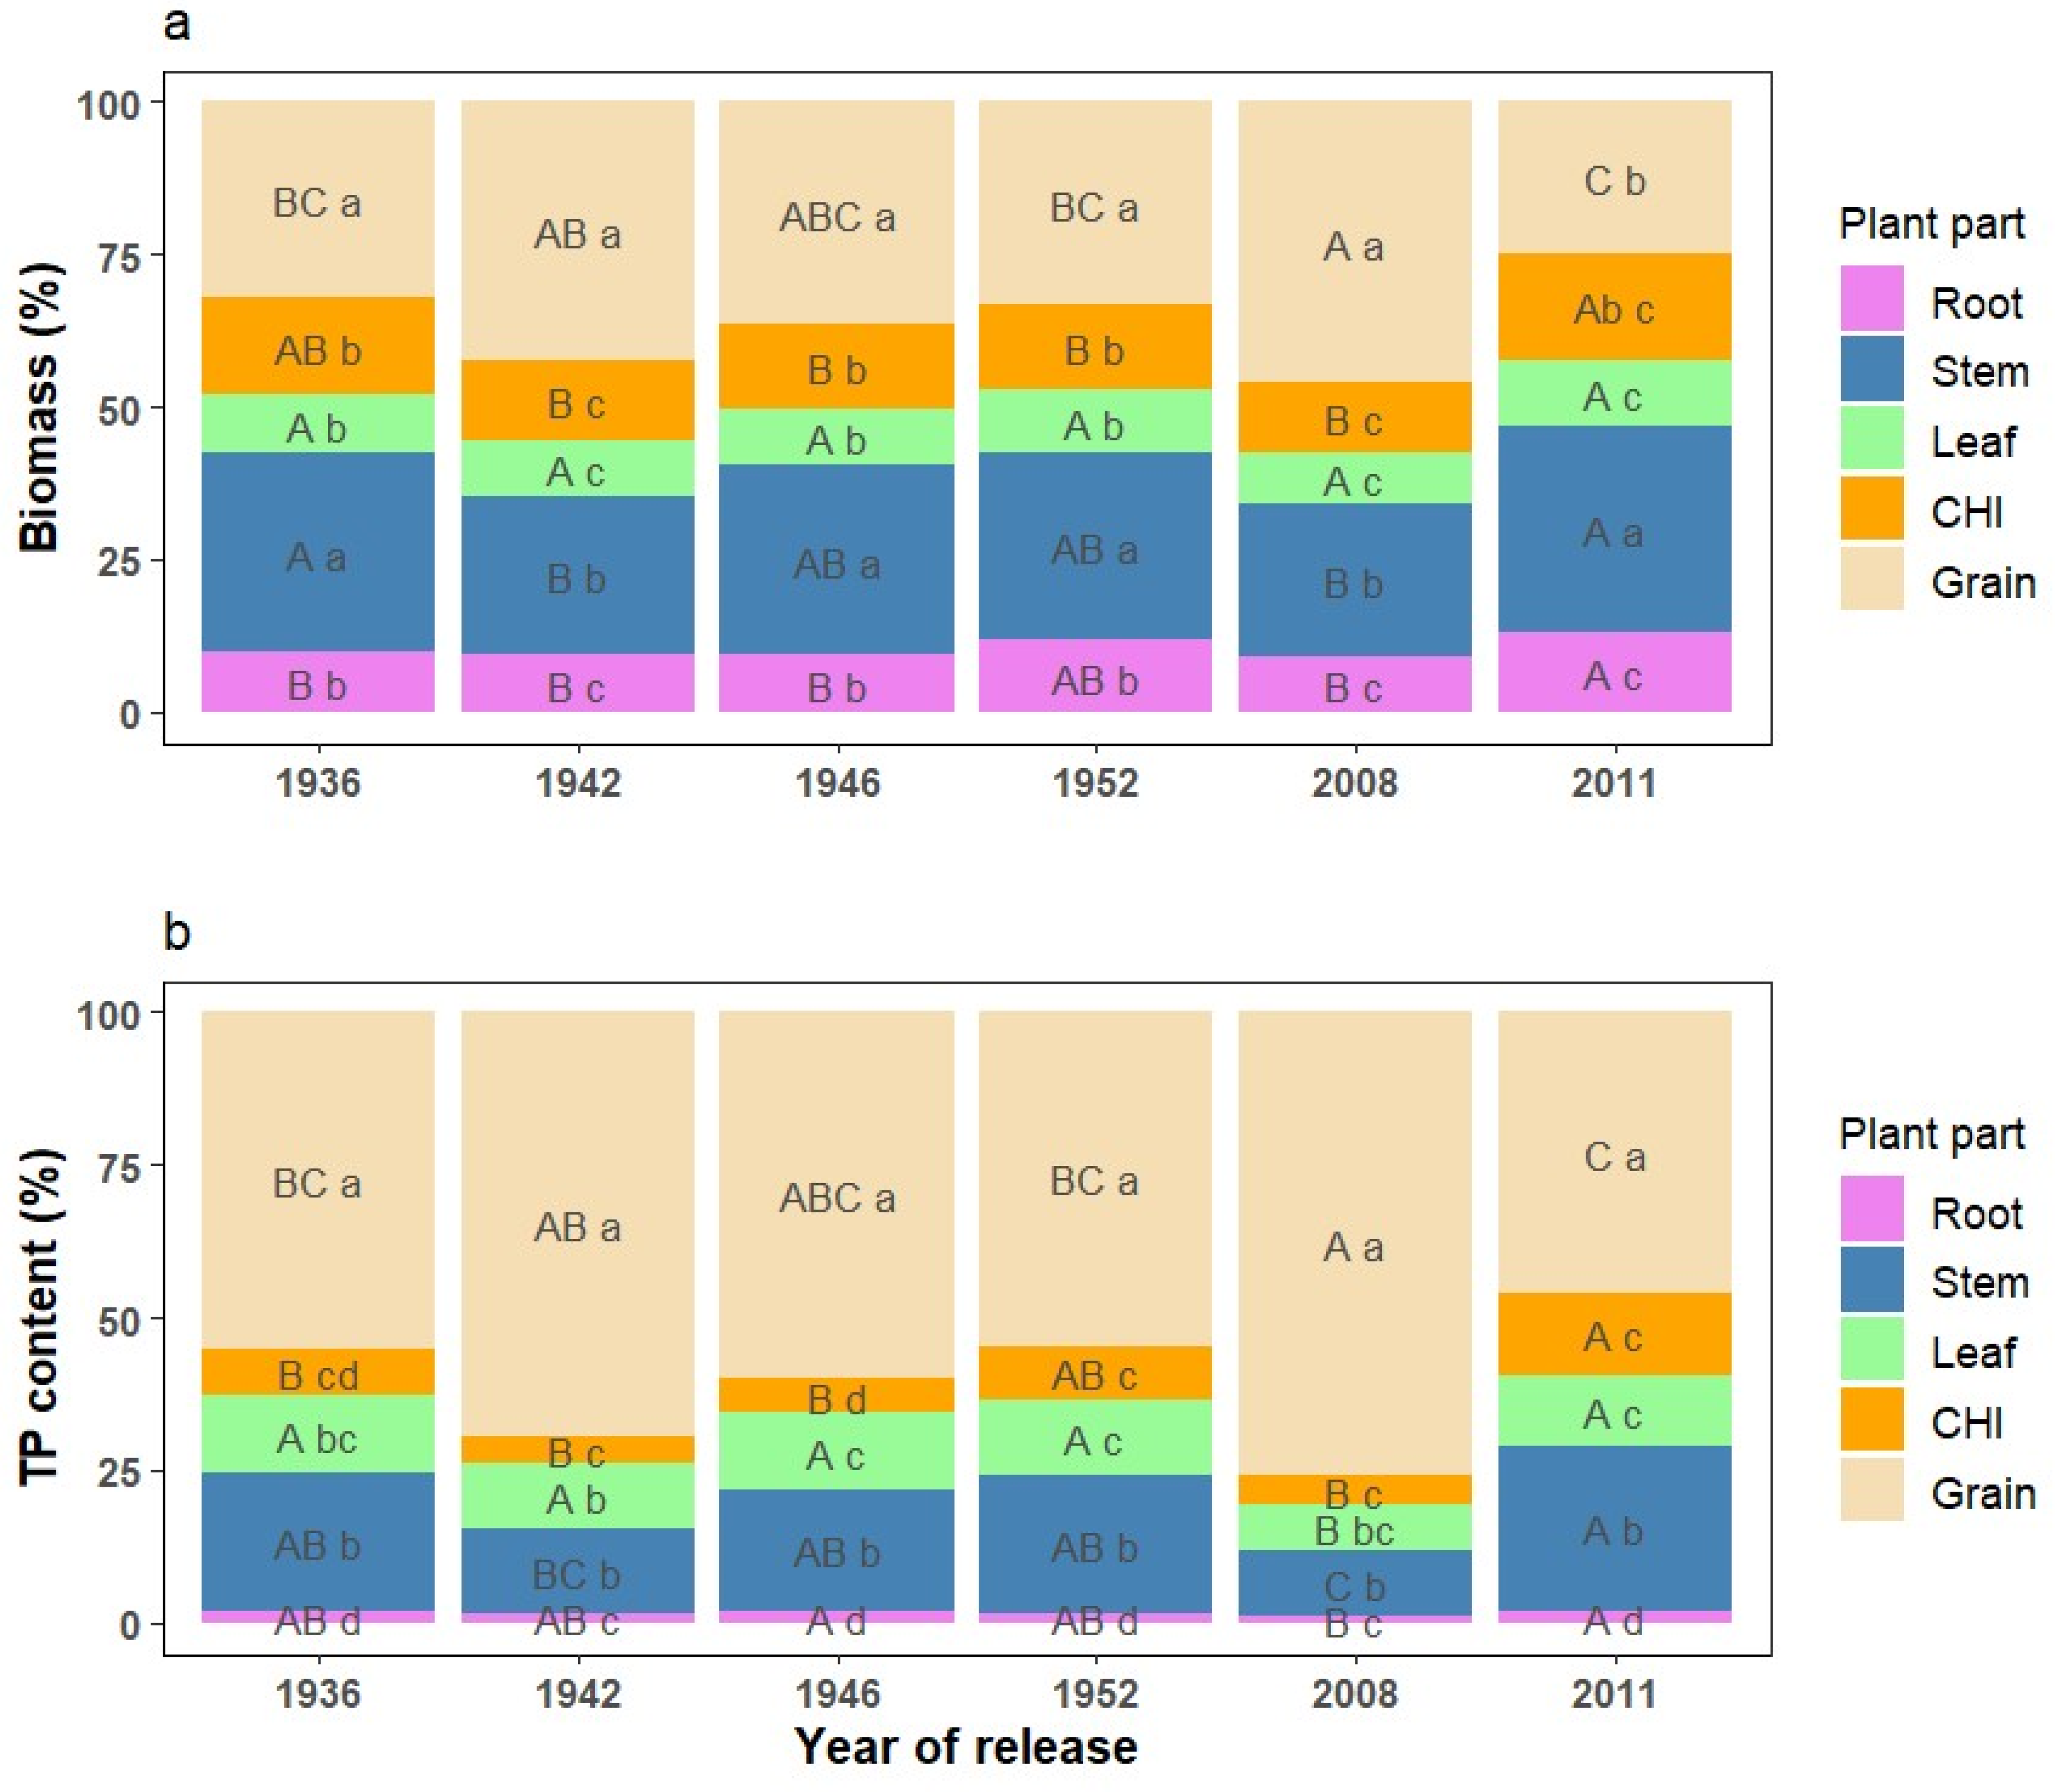
Figure 1. Plant parts as a percentage of total corn biomass (a) and total phosphorus content (b). CHI includes cob, husk, and immature ear. Uppercase letters denote differences in biomass and phosphorus partitioning for each plant part among hybrids, while lowercase letters denote differences in biomass and phosphorus partitioning among plant parts within each hybrid. Differences assessed by Tukey’s Honest Significant Difference Test (p > 0.05).
Agronomy 15 01407 g001
Figure 2. Phosphorus (P) concentration (left; g/kg) and content (right; mg) in corn plant parts for each hybrid averaged across four P input concentration treatments and four replications. CHI includes cob, husk, and immature ear. Boxes indicate the interquartile spread (1st and 3rd quartiles), while the horizontal line in the boxplot indicates the median values of each P treatment. The bold red circle in the boxplots indicates the mean value of 16 data points—four replicates for each P concentration treatment (4, 7, 10, and 12 mg P L−1). The same letter on the boxplots indicates no significant difference between treatments as assessed by Tukey’s Honest Significant Difference Test (p > 0.05).
Agronomy 15 01407 g002
Figure 3. Grain phosphorus (P) content as a function of stem (a), leaf (b), cob, husk, and immature ear (CHI) (c), and root (d) P content. Each data point represents the mean of 16 values, derived from four replications for each phosphorus concentration treatment (4, 7, 10, and 12 mg PL−1). ** indicates significance at p ≤ 0.01, and NS = non-significant, p > 0.05.
Agronomy 15 01407 g003
Figure 4. Regression of total phosphorus (P) uptake (mg/plant) against grain yield (g/plant), by hybrid, among six Pioneer corn hybrids. The regression slope listed in the graph indicates the P utilization efficiency (PUtE in units of g grain mg−1 P uptake). The data points are the average of four replications per P treatment for each hybrid. The asterisk next to each regression coefficient indicates statistical significance: * p ≤ 0.05. The same letter next to the asterisk indicates no significant difference between treatments as assessed by Tukey’s Honest Significant Difference Test (p > 0.05).
Agronomy 15 01407 g004
Table 1. Definition and calculation of phosphorus utilization efficiency (PUtE) and grain P utilization efficiency (gPUtE).
AbbreviationDefinitionCalculationUnit
PUtEChange in grain yield (y) over change in total plant P uptake (x) based on linear regression∆y/∆xg/mg
gPUtEPercentage of TP in grain, P harvest index G r a i n   P P l a n t   T P mg/mg
Table 2. Total plant biomass, kernel rows per ear, 100 kernel weight, grain yield, root/shoot ratio, and total phosphorus (TP) content. Values shown are the means of 16 data points: four replicates for each P concentration treatment (4, 7, 10, and 12 mg P L−1) followed by standard error. The same lower-case letter among hybrids indicates no difference between treatments as assessed by Tukey’s Honest Significant Difference Test (p > 0.05).
Corn Hybrid
Parameter193619421946195220082011
Total biomass (g plant−1)432 ± 39 a383 ± 36 a410 ± 40 a392 ±38 a414 ± 30 a380 ± 29 a
Kernel rows per ear13.9 ± 0.5 a14.0 ± 0.5 a13.6 ± 0.6 a15.2 ± 0.4 a14.4 ± 0.4 a14.4 ± 0.2 a
100 kernel weight (g)27.7 ± 1.0 b30.3 ± 1.4 ab28.4 ± 1.0 ab29.6 ±1.3 ab32.3 ± 1.0 a20.9 ± 1.0 c
Kernel number per plant506 ± 68 a536 ± 50 a543 ± 64 a436 ± 40 a604 ± 49 a446 ± 58 a
Grain yield (g plant−1)160 ± 22 abc187 ± 21 ab172 ± 19 abc150 ± 16 bc219 ± 16 a109 ± 17 c
Root/shoot ratio0.11 ± 0.01 b0.10 ± 0.01 b0.11 ± 0.01 b0.13 ± 0.01 ab0.10 ± 0.01 b0.16 ± 0.01 a
TP content (mg plant−1)487 ± 53 b547 ± 80 ab553 ± 65 ab549 ± 53 ab573 ± 66 a524 ± 58 ab
Disclaimer/Publisher’s Note: The statements, opinions and data contained in all publications are solely those of the individual author(s) and contributor(s) and not of MDPI and/or the editor(s). MDPI and/or the editor(s) disclaim responsibility for any injury to people or property resulting from any ideas, methods, instructions or products referred to in the content.