Article

Integrating the Water Footprint and DPSIR Model to Evaluate Agricultural Water Sustainability in Arid Regions: A Case Study of the Turpan–Hami Basin

1
State Key Laboratory of Ecological Safety and Sustainable Development in Arid Lands, Xinjiang Institute of Ecology and Geography, Chinese Academy of Sciences, Urumqi 830011, China
2
University of Chinese Academy of Sciences, Beijing 100049, China
3
Cele National Station of Observation and Research for Desert-Grassland Ecosystems, Hotan 848300, China
4
Polish-Chinese Centre for Environmental Research, Institute of Earth Sciences, University of Silesia in Katowice, 40-007 Katowice, Poland
5
School of Environment and Material Engineering, Yantai University, Yantai 264005, China
*
Author to whom correspondence should be addressed.
Agronomy 2025, 15(6), 1393; https://doi.org/10.3390/agronomy15061393
Submission received: 6 May 2025 / Revised: 2 June 2025 / Accepted: 3 June 2025 / Published: 5 June 2025

Abstract

:
Water resources are a key constraint on sustainable development in arid regions, especially for agricultural production where water use is intensive. To assess the sustainability of agricultural water use in such environments, this study utilizes 2010–2020 agricultural data from the Turpan–Hami Basin and is among the first to integrate the water footprint (WF) theory with the DPSIR (driver–pressure–state–impact–response) model into a comprehensive framework for evaluating water resource sustainability in arid agricultural systems. The agricultural blue, green, and grey WF in the Turpan–Hami Basin were quantified for 2010–2020, followed by a sustainability assessment under the DPSIR framework using a comprehensive weighting method. The results showed a continuous increase in the WF, dominated by the blue WF (>60%), largely due to crops like cotton and grapes, intensifying regional water stress. Turpan experienced prolonged resource overload, while Hami exhibited slightly higher sustainability. DPSIR analysis revealed stronger policy responses in Turpan and significant ecological investments in Hami. Key influencing factors included the crop yield, WF modulus, per capita WF, and water quality shortage index. Overall, sustainability in the basin fluctuated between “Basically Sustainable (Level III)” and “Insufficiently Sustainable (Level IV)”, with slight improvement in 2020. The findings highlight the need for region-specific agricultural optimization, strengthened ecological governance, and improved water-saving strategies to enhance water use efficiency and sustainability in arid regions.

1. Introduction

Amid escalating global climate and environmental changes, water is becoming an increasingly scarce yet indispensable resource. Agriculture accounts for approximately 85% of global freshwater consumption, making it the primary driver of water demand [1,2]. However, climate change has significantly affected agricultural water use, leading to reduced crop yields and threatening global food security [3]. Consequently, the accurate assessment of agricultural water use is especially critical in arid and semi-arid regions, where irrigation constitutes the predominant form of water utilization [4,5]. The enforcement of China’s most stringent water management policy—the “Three Red Lines”, along with regional strategies such as the Western Development Initiative, highlight the urgent need to improve the efficiency of agricultural water use in response to water overexploitation, waste, and pollution. Sustainable water resource management in these regions has long been a central focus of global research and policy efforts [6].
The concept of the water footprint (WF) provides a robust framework for quantifying water use driven by human activities. It captures the total volume of freshwater consumed during the production and consumption of goods and services over a defined period and region, thereby elucidating the spatial and temporal patterns of water flows within socio-economic systems [7]. The WF is typically divided into three components: green water (rainwater stored in the soil and used by crops), blue water (irrigation water drawn from surface and groundwater), and grey water (the volume required to dilute pollutants to meet acceptable water quality standards) [8]. Research on agricultural WF in arid regions has grown substantially in the context of sustainable development goals. Existing studies have examined specific crops such as coffee, tea, and cotton [9,10], or focused on individual components of the WF. For instance, Chen et al. [11] evaluated the impacts of human activities on freshwater ecosystems via the grey WF and found that agriculture alone contributes approximately 30–40% of the total. This method, which integrates hydrological processes with water quality data, provides a more nuanced assessment of pollution levels. Furthermore, studies have investigated the global trade of the WF and its role in redistributing water resources through virtual water flows (VWFs) [12]. In China, such flows have alleviated agricultural water stress and informed regional crop planning strategies. Key recommendations include improving food self-sufficiency and promoting agricultural exports from water-rich regions [13]. Moreover, several studies have projected crop yields and agricultural water demands to support adaptive policy formulation. For example, research in Thailand suggests that substituting double rice cropping with maize, soybeans, or mung beans could help mitigate climate change impacts [14]. Tuninetti et al. [15] developed a high-resolution model to estimate the virtual water content of four major staple crops, enhancing our understanding of water use efficiency at the crop level. Hu et al. [16] quantified the WF in Central Asia and found that agriculture was the primary driver of its growth, with Europe being the largest export destination of Central Asia’s WF.
However, under increasingly complex and variable climate conditions, analyses limited to single crops or individual WF components are insufficient to meet the practical needs of agricultural water resource management. To transition from theoretical accounting to real-world application, the WF assessment framework has been continuously refined. At the same time, growing concerns over ecological security and environmental carrying capacity—especially in arid regions—have attracted increasing attention [17]. In recent years, integrated assessment approaches have emerged to enhance the scientific rigor and practical relevance of WF research. For example, Gao et al. [18] combined the Soil and Water Assessment Tool (SWAT) with meteorological data to evaluate the crop WF across multiple time scales, offering guidance for non-drainage irrigation areas. Jin et al. [19] applied an extended STIRPAT (Stochastic Impacts by Regression on Population, Affluence, and Technology) model to reveal significant effects of the Engel coefficient and urbanization on the agricultural WF. Feng et al. [20] integrated system dynamics with Markov chains to project WF changes and assess the associated pressures on freshwater ecosystems. Similarly, Zhang et al. [21] developed a Bayesian network incorporating agricultural inputs to conduct scenario analysis, exploring system responses and sustainable strategies.
From a methodological perspective, while Bayesian networks represent causal relationships in probabilistic terms, the driver–pressure–state–impact–response (DPSIR) model constructs a logical sequence that emphasizes system dynamics and complexity, making it particularly well-suited for integrated socio-ecological assessments [22,23]. In this model, socio-economic development (D) exerts pressure (P) on the environment, altering its state (S), impacting ecosystems and human well-being (I), and prompting responses (R), thereby forming a feedback loop. Initially applied in strategic environmental assessments [24,25], the DPSIR model has since been widely adopted in environmental policy-making, wetland conservation, and marine ecosystem management due to its transparent structure and systemic perspective [26,27,28]. For instance, Wen et al. [29] developed a DPSIR-based evaluation index tailored to China’s emerging economy. Its use in water resource management is also expanding. Lu et al. [30] evaluated urban river ecosystems and identified key influencing factors; Borja et al. [22] assessed risks under the EU Water Framework Directive; and Maxim et al. [31] integrated environmental, social, economic, and political dimensions into the DPSIR model for more holistic assessments. As water scarcity worsens—particularly in regions where water quality is a limiting factor—conventional approaches such as expanding supply or relying on end-point treatment have become inadequate. Achieving sustainability instead demands system-oriented methods that can investigate the drivers of the WF and the interactions among key factors within arid-region water systems. These studies collectively highlight the strengths of the DPSIR framework in capturing ecological dynamics and informing environmental decision-making.
Currently, the integration of WF theory with the DPSIR framework for sustainability assessment remains in its infancy. Existing studies have primarily focused on physical water resources [32,33,34] or individual components of product-specific WFs, with limited efforts to incorporate a comprehensive WF concept—including both water quantity and quality—into an integrated socio-ecological framework such as DPSIR, particularly in arid regions. We hypothesize that crop-specific WFs, shaped by both natural and anthropogenic factors, are driving factors of unsustainable agricultural water use in these areas. To address this research gap, this study adopts a DPSIR-based analytical framework that integrates both the water quantity and quality dimensions of the WF, offering a system-level perspective on the sustainability of agricultural water use in arid regions. The objective is to provide theoretical support and practical guidance for the sustainable utilization and optimized allocation of agricultural water resources.

2. Materials and Methods

2.1. Study Area

The Turpan–Hami Basin, located in eastern Xinjiang, China (87°16′–96°23′ E, 40°52′–45°05′ N), encompasses the administrative regions of Turpan and Hami (Figure 1), covering approximately 12.6% of Xinjiang’s total land area. This intermontane fault-depression basin features relatively flat terrain surrounded by mountains, with the lowest elevation reaching –155 m below sea level [35]. Characterized by a continental arid climate, the region receives over 3200 h of sunshine annually, with pronounced diurnal temperature variations and intense solar radiation. However, it suffers from minimal precipitation, high evaporation, frequent extreme weather events, and severe ecological fragility. Water resources are extremely limited, heavily reliant on snowmelt and overexploited groundwater [36]. Despite these constraints, the basin supports rich agricultural activity, primarily favoring drought-tolerant crops. Turpan is renowned for its grape production, while Hami is famous for melons and other fruits. Cotton and maize are also cultivated, mostly along riverbanks and oasis fringes where human activity is concentrated [37]. In addition, the basin is a significant hub for oil, coal, and mineral extraction in Xinjiang, with emerging agro-processing industries such as winemaking and an increasing integration of agriculture with tourism.

2.2. Data Sources

Meteorological data, including precipitation (mm) and sunshine duration (hours), were obtained from the China Meteorological Data Service Center, https://data.cma.cn/ (accessed on 17 October 2023) for the period 2010–2020. Key socio-economic indicators—such as agricultural output, crop planting areas, and gross domestic product (GDP)—were primarily derived from the Xinjiang Statistical Yearbook [38], Turpan Statistical Bulletin on National Economic and Social Development [39], and Hami Statistical Bulletin on National Economic and Social Development [40]. Water usage statistics were mainly sourced from the Xinjiang Water Resources Bulletin [41]. Pollutant discharge standards referenced the China’s Environmental Quality Standards for Surface Water (GB3838-2002) [42]. The spatial resolution of the selected data is uniformly at the prefecture level as reported in the statistical yearbooks, without inclusion of county-level or sub-basin data under Turpan and Hami jurisdictions. Therefore, comparisons between Turpan and Hami are based on aggregated prefecture-level data.

2.3. Water Footprint Accounting

The WF of crop production varies depending on the crop type, growth period, and other agronomic factors [2,43]. The method used in this study for calculating the agricultural water footprint (AWF) is as follows:
A W F = A W F g r e e n + A W F b l u e + A W F g r e y = i = 1 n T Y i × C W R i + A W F g r e y
The AWF consists of three components: the green WF ( A W F g r e e n ), blue WF ( A W F b l u e ), and grey WF ( A W F g r e y ). Here, T Y i denotes the yield of crop i (ton/year), and C W R i is the crop water requirement per unit yield (m3/ton), including both green and blue water. This study focuses on nine major crops (wheat, maize, cotton, vegetables, melons, alfalfa, and tree fruits including grapes, apricots, and jujubes), selected based on the criterion that their sowing area exceeds 1% of the total.
C W R i = C W R g r e e n P Y + C W R b l u e P Y = 10 × d = 1 l g p E T g r e e n P Y + 10 × d = 1 l g p E T b l u e P Y
E T g r e e n = m i n ( E T c ,   P e )
E T b l u e = m a x ( 0 ,   E T c P e )
where C W R g r e e n and C W R b l u e are the green and blue water requirements per hectare (m3/ha), P Y is the yield per unit area (ton/ha), E T g r e e n and E T b l u e represent the daily green and blue evapotranspiration (mm), and l g p is the length of the growing period (days). E T c is the crop’s cumulative evapotranspiration, and P e is the effective precipitation (mm/day). This study uses CROPWAT 8.0, a software tool developed by the FAO, to calculate E T c and P e based on local climatic, soil, and crop data parameters for the Turpan–Hami Basin [14,44,45].
Agricultural water pollution is mainly non-point source in nature. Nitrogen was selected as the indicator pollutant for evaluating the A W F g r e y [46]:
A W F g r e y = α × A p p l C m a x C n a t
where α is the leaching–runoff fraction of nitrogen fertilizer, representing the proportion of applied nitrogen that reaches water bodies; A p p l is the annual amount of nitrogen fertilizer applied to agricultural land (kg/year); C m a x is the maximum acceptable concentration of nitrogen in the receiving water body (kg/m3) [42]; and C n a t is the natural background concentration of nitrogen in the receiving water body (kg/m3), which is assumed to be zero due to limited data availability.

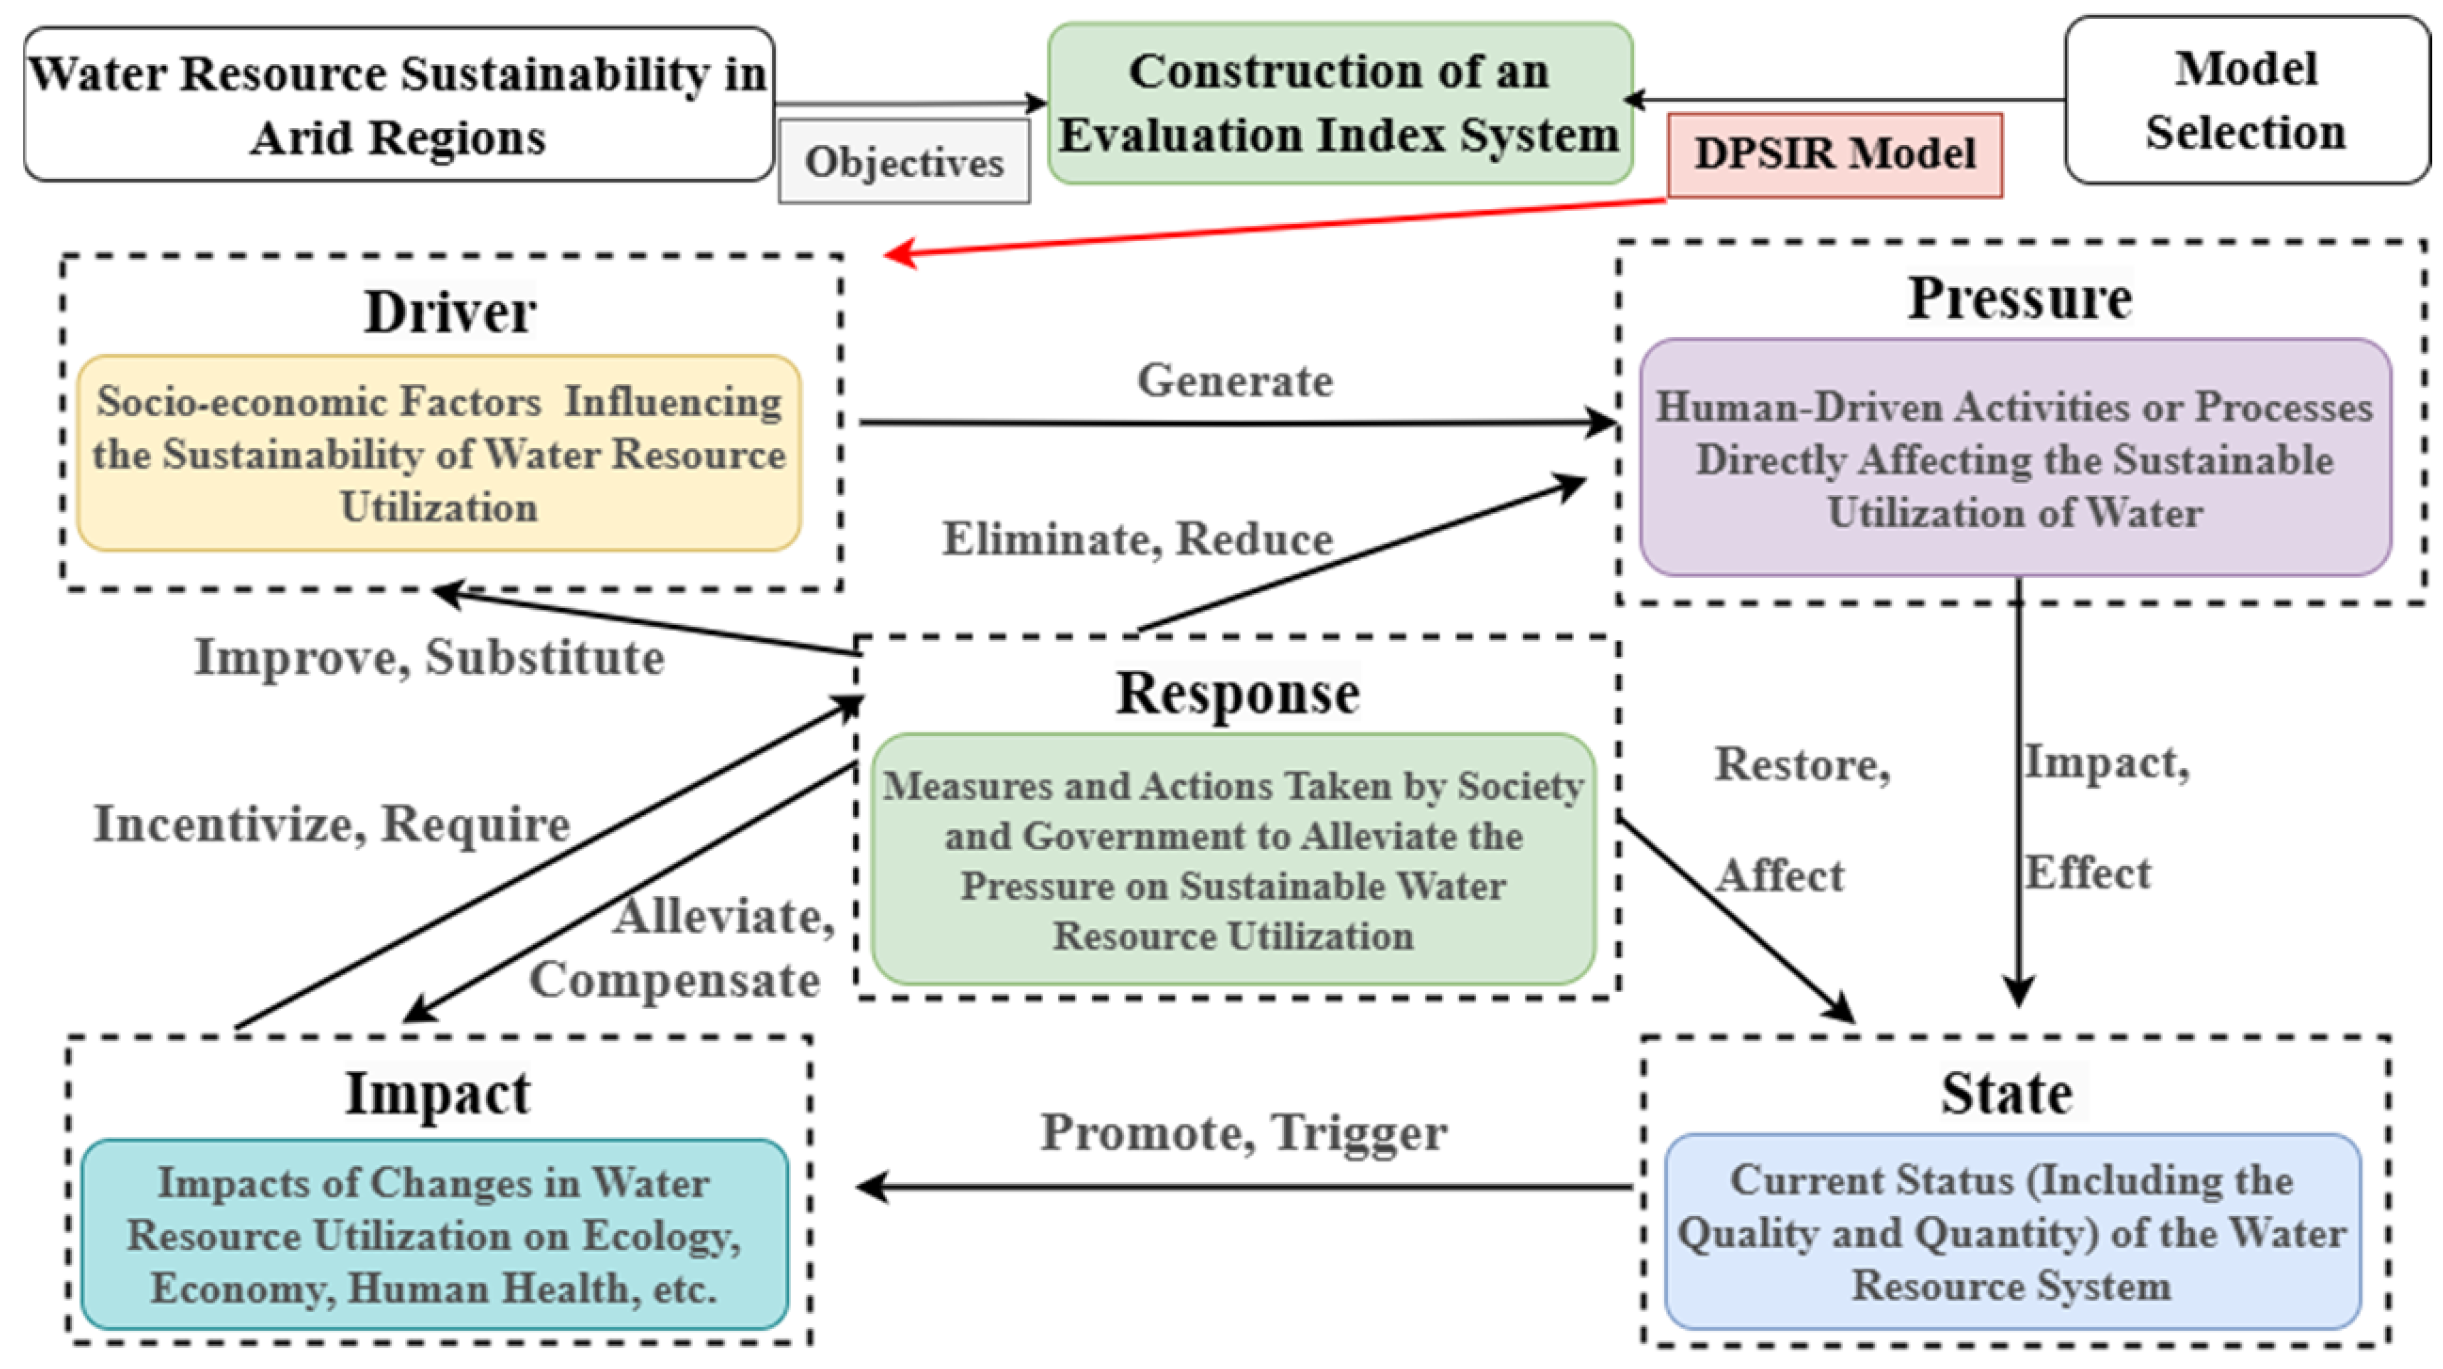
2.4. DPSIR Model Framework

In response to the growing pressure exerted by socio-economic development on water resources in arid regions, this study constructs a DPSIR model to evaluate their sustainability (Figure 2). The DPSIR framework consists of five subsystems: Driver (D)—indicators reflecting socio-economic factors that drive changes in water resources; Pressure (P)—indicators describing the demand for and stress on water resources resulting from economic activities; State (S)—indicators representing the current condition of water resources, including their quantity and quality; Impact (I)—indicators illustrating the effects of water resource conditions on the socio-economic system and ecological environment; and Response (R)—indicators describing societal and ecosystem feedback and adaptation in response to human activities.
The core of applying the DPSIR framework to evaluate water resource sustainability lies in the scientific and rational selection of indicators, which critically influences the final assessment results. However, research integrating the DPSIR framework with WF analysis remains scarce and primarily focuses on conventional water resource evaluations [30,47]. Hence, this study introduces a sustainability evaluation system for water resources in arid regions by integrating the DPSIR model with both traditional water resource research and the WF approach. The selected indicators are described as follows:
(1) Driver (D) subsystem: In arid regions, the driving forces behind agricultural water use primarily stem from socio-economic development, population growth, improved living standards, and urbanization. These factors collectively increase agricultural water demand. Specific indicators include the following: the population density (D1)—reflecting the demographic basis of water use pressure in the region; per capita GDP (D2)—capturing the influence of the economic development level on resource consumption; planting area (D3) and crop yield (D4)—respectively representing the scale and intensity of agricultural production; and the proportion of agricultural output value (D5)—indicating agriculture’s role in the regional economy, thereby reflecting its dependence on water resources.
(2) Pressure (P) subsystem: Intensive agricultural development leads to significant water use pressure and environmental concerns. This includes the water utilization rate (P1) and WF modulus (P2)—reflecting the extent of human exploitation of water resources; nitrogen amount (P3)—indicating potential risks of agricultural non-point source pollution; and the proportion of blue, green, and grey WF (P4, P5, and P6)—assessing different types of pressure on the water system caused by irrigation water, rainwater utilization, and pollutant dilution, respectively.
(3) State (S) subsystem: Driven by pressures, the water resource system exhibits features such as insufficient quantity, low efficiency, and uneven spatial-temporal distribution. Per capita water resources (S1) and per capita WF (S2)—indicate the balance between available water and actual human consumption. Water scarcity index (S3)—measures the proportion of agricultural water use relative to total water resources, revealing competition among sectors. Precipitation (S4)—reflects the natural water supply conditions. Total Power of Agricultural Machinery (S5)—represents the level of agricultural modernization, which also influences water use efficiency.
(4) Impact (I) subsystem: Changes in the state of water resources directly affect the regional ecological environment and socio-economic development. Economic benefit of WF (I1)—measures the economic output per unit of water use, reflecting water use efficiency. Per capita water use (I2)—shows the pattern of resource allocation. Water quality shortage index (I3)—evaluates the reduction in usable water caused by pollution. Per capita urban green space (I4)—from an urban ecological perspective, reflects the impact of water resource utilization on residents’ quality of life.
(5) Response (R) subsystem: To ensure sustainable use of water resources, effective measures must be taken in terms of policy, technology, and ecological restoration. Proportion of environmental water use (R1)—indicates the level of ecological water allocation. Soil erosion control area (R2) and afforestation area (R3)—demonstrate efforts in ecosystem restoration. Water-saving irrigation area (R4)—reflects the adoption of water-saving technologies in agriculture. Investment in environmental pollution control (R5)—indicates financial input for pollution management and ecological protection.
To enhance the scientific validity and representativeness of the evaluation, this study selects 25 representative indicators, forming a hierarchical structure comprising criterion-level and indicator-level components (Table 1). Depending on their nature, these indicators are categorized as either positive (where higher values indicate better sustainability) or negative (where higher values imply worse sustainability).

2.5. Evaluation Method

A single weighting method is often inadequate to fully reflect the complex relationships and interactions among these indicators. To address this, the present study employs a hybrid weighting strategy that integrates the entropy weight method with the CRITIC method (Criteria Importance Through Intercriteria Correlation). This combined approach aims to reduce the subjectivity associated with manual weighting while overcoming the limitations of single-method frameworks, thereby enhancing the scientific rigor and objectivity of the evaluation outcomes. The entropy weight method determines the weight of each indicator based on the degree of data dispersion, offering an objective measure of the amount of information carried by each indicator and reducing dependence on subjective judgment [48]. Meanwhile, the CRITIC method incorporates both the contrast intensity and the degree of conflict among indicators, strengthening the stability and robustness of the results. By integrating these two methods, the evaluation framework effectively accounts for both indicator variability and interdependence, thereby minimizing the influence of data fluctuations and improving the overall reliability and rationality of the evaluation process.
The normalization for positive indicators is calculated as follows:
X i j = x i j m i n ( x j ) max x j m i n ( x j )
The normalization for negative indicators is calculated as follows:
X i j = max x j x i j max   x j m i n ( x j )
The determination of indicator weights using the entropy weight method involves the following steps [32]. To eliminate the influence of zero values after normalization—which can cause issues in logarithmic calculations—a coordinate translation is applied:
X i j , = X i j + Z
where X i j , is the translated normalized value, and Z is a small constant, positive constant. In this study, Z is set to 0.00001 to ensure all values are strictly positive, thereby avoiding undefined logarithms during entropy calculation while minimally affecting the original data distribution.
P i j denotes the relative proportion of X i j , :
P i j = X i j , / i = 1 m X i j ,
where m is the number of observations for a single indicator.
The entropy value e j for the j-th indicator is then calculated:
e j = 1 ln m i = 1 m P i j · l n P i j
where ln m serves as a normalization coefficient to ensure that the entropy value lies within the range [0,1].
Calculating the difference coefficient g j for the j-th criterion,
g j = 1 e j
A higher g j indicates greater variability of the indicator and thus higher importance in the evaluation.
The weight of the j-th indicator is given as follows:
ω 1 j = g j / j = 1 n g j
where n is the total number of indicators.
The CRITIC method determines weights based on the correlation and variability among indicators. First, indicators are standardized using Formulas (6) and (7) [49]. The standard deviation σ j , representing the variability for indicator j, is calculated as follows:
σ j = i = 1 m ( X i j X j ¯ ) 2 m 1
where X j ¯ is the mean of indicator j.
The conflict coefficient R j , the amount of information C j , and the objective weight ω j are calculated as follows:
R j = j = 1 m ( 1 r i j )
C j = σ j R j
ω 2 j = C j / j = 1 n C j
where r i j is the correlation coefficient between indicators. The final combined weight ω j of the j-th indicator is as follows:
ω j = ω 1 j ω 2 j J = 1 n ω 1 j ω 2 j
The evaluation value for each criterion layer is calculated based on the weighted values of its indicators. Taking the Driver criterion as an example,
f ( D i t ) = j = 1 n ω d j · x d i j
where f ( D i t ) represents the evaluation value of the i-th indicator within the driving forces dimension in year t. The same method applies to the other four criterion layers. The final comprehensive evaluation score f ( O t ) for year t is given as follows:
f ( O t ) = f ( D t ) · ω D + f ( P t ) · ω P + f ( S t ) · ω S + f ( I t ) · ω I + f ( R t ) · ω R
where ω D , ω P , ω S , ω I , and ω R are the total weights of the D, P, S, I, and R layers, respectively. These are obtained by summing the weights of their corresponding indicator-level components.
Based on the final evaluation score, sustainable water resource utilization is classified into six levels, as shown in Table 2.

3. Results

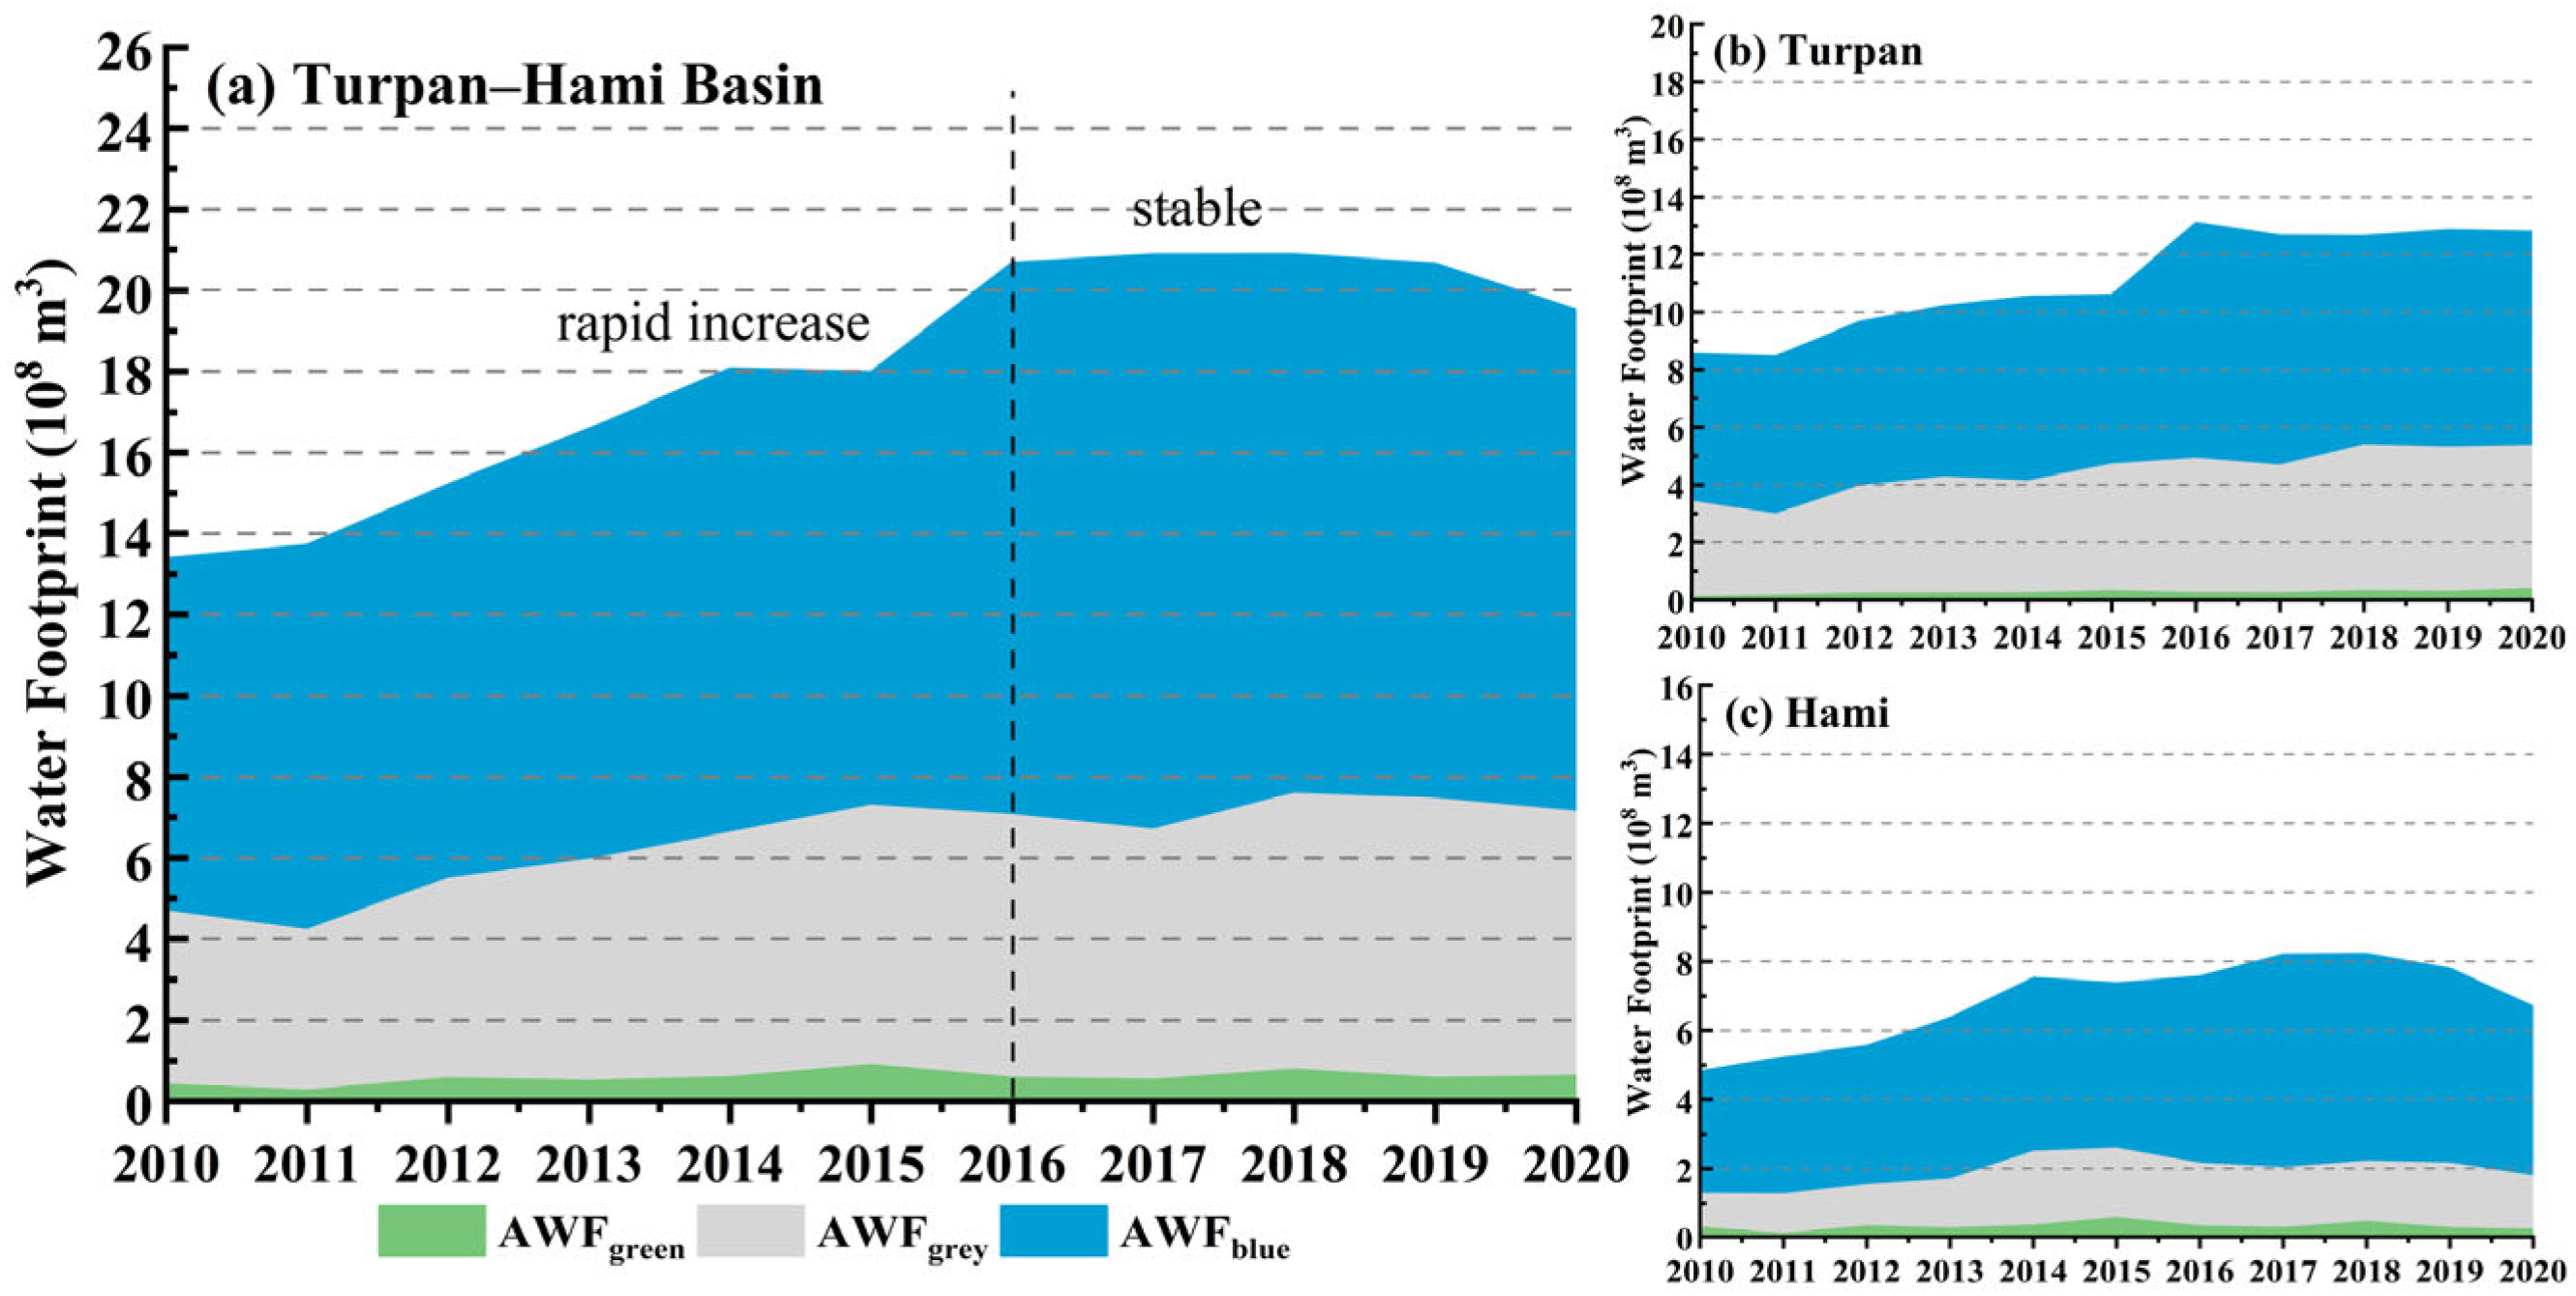
3.1. Agricultural Water Footprint in the Turpan–Hami Basin

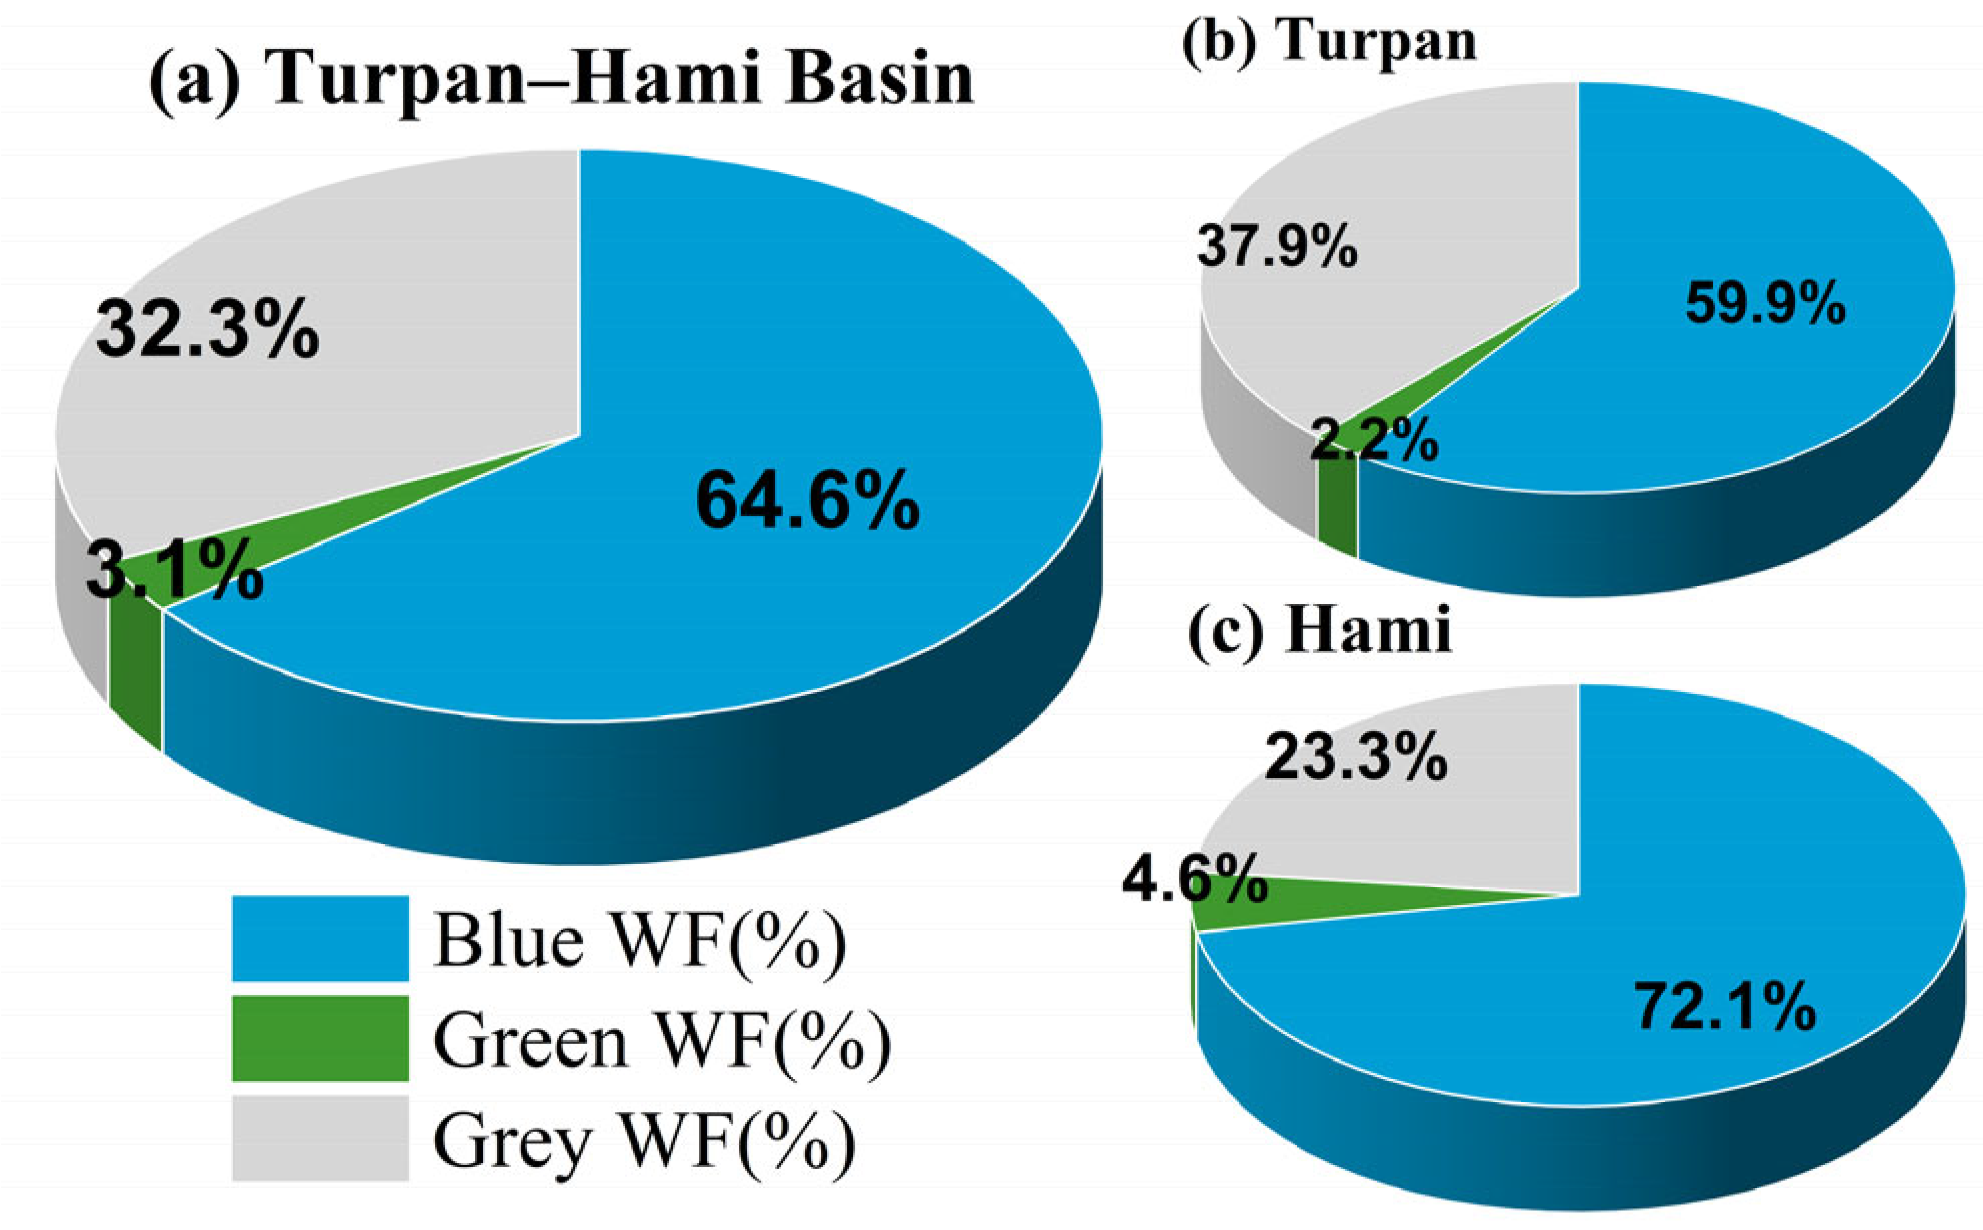
3.1.1. Agricultural Water Footprint by Color and Crop Type

Figure 3a illustrates that the AWF in the Turpan–Hami Basin showed a generally increasing trend, with fluctuations from 2010 to 2020, rising from 1.34 billion m3 in 2010 to a peak of 2.09 billion m3 in 2018, followed by a slight decrease to 1.95 billion m3 in 2020. The cultivated area of crops and the amount of nitrogen fertilizer applied in the study area have decreased, resulting in a slight reduction in the total WF. Among the components, the blue WF consistently accounted for more than 60% of the total (Figure 4), underscoring the region’s heavy reliance on irrigation. The proportion of blue water in Hami (72.1%) is higher than that in Turpan (59.9%). The grey WF also exhibited an upward trend, growing from 4.28 × 10⁸ m3 in 2010 to 6.88 × 10⁸ m3 in 2019, comprising roughly 32% of the total, which indicates considerable pressure from non-point source agricultural pollution on regional water resources. In contrast, the green WF remained consistently low, contributing less than 5% annually and fluctuating between 0.25 × 10⁸ m3 and 0.88 × 10⁸ m3. This reflects the limited role of natural precipitation and highlights the dependence on irrigated agriculture in the region.
Temporally, the AWF in the Turpan–Hami Basin increased rapidly from 2010 to 2016, after which the growth rate gradually slowed, with a slight decline observed in 2020. Among the subregions, Turpan had a significantly higher AWF than Hami. In Turpan, the AWF rose from 8.56 × 10⁸ m3 in 2010 to 13.11 × 10⁸ m3 in 2016 and then stabilized. The blue WF consistently exceeded 60%, reflecting a strong reliance on both surface and groundwater for agricultural production. Especially after 2016, water use intensity continued to increase, with the blue WF reaching 8.21 × 10⁸ m3. The grey WF surpassed 5 × 10⁸ m3 beginning in 2018, indicating persistent environmental pressure from agricultural activities. Although the volume of green WF remained low, it showed a gradual upward trend, suggesting enhanced use of precipitation in certain areas or for specific crops.
In contrast, the total AWF in Hami was relatively lower, increasing from 4.82 × 10⁸ m3 in 2010 to a peak of 8.22 × 10⁸ m3 in 2018, before declining to 6.71 × 10⁸ m3 in 2020. Overall, the change was more stable. While the blue WF remained the dominant component, its proportion was slightly lower than in Turpan. In some years (e.g., 2015 and 2018), the share of the green WF increased. The grey WF in Hami averaged approximately 1.6 × 10⁸ m3 annually, suggesting relatively low pollution levels; however, non-point source pollution from agriculture still requires attention.
Overall, the AWF in the Turpan–Hami Basin is primarily composed of blue WF, with a continuously rising grey WF and limited utilization of green WF. Turpan, characterized by high irrigation intensity and substantial total water use, is the key area placing pressure on regional water resources. Although Hami demonstrates a more balanced WF structure, efforts are still required to enhance the efficiency of blue water use and reduce pollutant emissions. To achieve sustainable agricultural water resource utilization in the region, it is essential to improve irrigation efficiency and strengthen the environmental carrying capacity of water resources.
Significant differences in the blue and green WFs across crop types reflect the multidimensional impacts of crop selection, planting area, and irrigation intensity on agricultural water use. In terms of total consumption, cotton and grapes dominate water usage in the Turpan–Hami Basin, accounting for a major share of the AWF (Figure 5). Cotton ranks first in combined blue and green WFs, averaging approximately 3.80 × 10⁸ m3 annually, peaking at 5.20 × 10⁸ m3 in 2014 before declining to 2.29 × 10⁸ m3 in 2020. This “rise-then-fall” trend mirrors the effects of national policy shifts and industrial restructuring, which have reduced cotton planting areas and irrigation demand.
In contrast, grape water consumption has shown a steady upward trajectory, increasing from 2.60 × 10⁸ m3 in 2010 to 4.43 × 10⁸ m3 in 2020, with an average annual growth rate exceeding 5%. Notably, growth accelerated after 2016—from 4.23 × 10⁸ m3 in 2016 to 4.58 × 10⁸ m3 in 2019—driven by the rapid expansion of the grape industry in both Turpan and Hami. This highlights the increasing dependence of specialty fruit industries on regional water resources.
Wheat, the primary grain crop, maintained relatively stable water use, fluctuating between 1.01 and 1.48 × 10⁸ m3, peaking in 2018. This stability reflects the rigid irrigation demands characteristic of staple crops. Corn and vegetables consumed relatively less water, with corn showing minimal fluctuation. Although vegetable water use varied between years, total usage remained within the range of 0.42 to 0.59 × 10⁸ m3, indicating limited change in planting area and irrigation scale. Alfalfa, a key forage crop, experienced substantial variation—rising from 0.43 × 10⁸ m3 in 2010 to 1.09 × 10⁸ m3 in 2017 before slightly declining—due to fluctuations in livestock development and irrigation conditions.
The jujube WF exhibited a fluctuating upward trend, increasing from 0.18 × 10⁸ m3 in 2010 to 0.82 × 10⁸ m3 in 2013, then falling to 0.39 × 10⁸ m3 in 2020. These fluctuations may stem from variations in local water availability and industry restructuring. Primarily grown in the arid fringes of Hami, jujube cultivation is highly dependent on irrigation. Since 2016, WF for melons and apricots has increased significantly: blue WF for melons surpassed 2 × 10⁸ m3, while apricots rose from 0.17 × 10⁸ m3 in 2010 to 0.94 × 10⁸ m3 in 2020. These changes are strongly linked to policy support and market expansion for specialty orchards in Turpan, particularly the integrated development of the “grape–apricot–melon” industrial chain, which has driven irrigation demand.
The composition of the blue and green WFs in the Turpan–Hami Basin reveals a shifting crop structure, marked by declining water use for grain crops, increasing consumption by economic crops, and fluctuating use by forage crops. Traditional grain crops like wheat and cotton are showing stable or decreasing water demands, while economic crops—grapes, jujubes, and apricots—are steadily increasing their reliance on blue water. The expansion of fruit-based industries is significantly reshaping the region’s water use pattern and has become a major driver of change in the water resource landscape. Moving forward, optimizing crop selection and irrigation practices will be vital for enhancing agricultural water use efficiency and achieving sustainable and equitable water resource management.

3.1.2. Water Resource Stress and Economic Benefit

In this study, the water scarcity index is defined as the ratio of the agricultural WF to available local water resources. An index above 100% indicates agricultural water demand exceeds renewable supply, signaling unsustainable use. This often leads to over-extraction of surface and groundwater and reallocation of ecological flows to agriculture, potentially causing long-term resource depletion and ecological damage. The WF of economic crops in the Turpan–Hami Basin has risen markedly, becoming the main contributor to the increasing AWF. However, this increase in water use has not been matched by improvements in water availability. Instead, water scarcity across the basin has intensified (Figure 6a), underscoring the escalating conflict between agricultural water demand and the region’s water resource carrying capacity. This issue is especially acute in Turpan, where the agricultural water scarcity index jumped from 102.3% in 2010 to 184.5% in 2020, reflecting a prolonged period of overexploitation. This implies that agricultural water use in Turpan heavily depends on groundwater overdraft or the reallocation of ecological water flows. In contrast, Hami has experienced a comparatively lower yet steadily rising level of water scarcity, with the index increasing from 28.9% in 2010 to 81.9% in 2020. For the basin as a whole, the index rose from 53.4% to 128.95% over the same period, signaling a growing threat of unsustainable agricultural water use throughout the region.
At the same time, the economic benefit of the AWF in the Turpan–Hami Basin has steadily improved, rising from 3.51 CNY/m3 in 2010 to 5.85 CNY/m3 in 2020, with an average annual growth rate of approximately 5.3%. This reflects a consistent increase in water productivity per unit of agricultural water use. Spatially, Turpan has consistently outperformed Hami in terms of WF economic benefit, largely due to the expansion of its high-value fruit production sector. By 2020, Turpan’s economic benefit had reached 6.46 CNY/m3, substantially exceeding Hami’s 4.70 CNY/m3, representing a relative advantage of nearly 38%. Although Hami’s WF economic benefit remains comparatively lower, it has exhibited steady improvement—especially between 2016 and 2020—rising from 3.99 CNY/m3 to 4.70 CNY/m3, an increase of about 18%. These trends suggest preliminary success in optimizing the agricultural structure and enhancing water use efficiency.
However, it is important to recognize that improvements in economic benefit have not corresponded to a reduction in water resource pressure. Agricultural water use in the basin displays a compound trend of “expanded WF—increased economic benefit—intensified water stress”, suggesting that the region’s agricultural development is still operating under a trade-off between economic gains and water sustainability. Consequently, the pursuit of high economic returns alone is inadequate to mitigate ecological water stress. Moving forward, it is essential to further optimize crop planting structures and promote water-saving and high-efficiency agricultural practices, aiming to simultaneously improve water use efficiency and strengthen regional ecological sustainability.

3.2. Evaluation of Water Resource Sustainability

3.2.1. Weighting of DPSIR Model Indicators and Criterion Layers

This study develops a water resource sustainability evaluation system based on the DPSIR model. By combining the entropy weight method with the CRITIC method, the objectivity and discriminatory power of the indicator weighting process are improved. A quantitative analysis and comparative assessment of the water resource systems in Turpan, Hami, and the entire Turpan–Hami Basin were carried out (Table 3). At the subsystem level, the “Response” subsystem carries the highest weight in Turpan (0.2468), reflecting substantial investment in policy regulation and the promotion of water-saving technologies, which serve as key measures to enhance water sustainability. In contrast, the highest-weighted subsystem in Hami is “Pressure” (0.2279), indicating the significant ecological and socio-economic impacts caused by water-related challenges and the urgent need for enhanced regulation and management. Across the entire Turpan–Hami Basin, both the “Pressure” (0.2493) and “Response” (0.2246) subsystems are prominent, illustrating the dual scenario of severe water stress coupled with active policy and management responses.
At the indicator level, key factors influencing water sustainability in the basin include the crop yield (D4, weight = 0.2306), WF modulus (P2, 0.2458), per capita WF (S2, 0.2978), water quality shortage index (I3, 0.2744), and soil erosion control area (R2, 0.2574). These results indicate that the primary challenges in the basin stem from the high-intensity water consumption associated with agricultural production and the consequent degradation of water quality. Meanwhile, the region demonstrates a strong capacity for response through investments in soil conservation and water-saving initiatives. The high weight of per capita WF further highlights the significant pressure agricultural water use places on the regional water system, emphasizing the need to balance agricultural productivity with ecological water-saving strategies and improvements in water quality.
In Turpan, key indicators influencing water sustainability include the crop yield (D4, 0.2588), WF modulus (P2, 0.2352), per capita WF (S2, 0.2676), water quality shortage index (I3, 0.2888), and the proportion of environmental water use (R1, 0.2373). The highest weight assigned to I3 reflects the severe water quality issues in the region, underscoring the urgency of improving water quality and restoring degraded aquatic ecosystems. The significant role of environmental water use in the response subsystem indicates that Turpan has established a strong foundation in ecological water supplementation and maintaining environmental flows. The agricultural system’s strong dependence on water resources, highlighted by D4 and P2, suggests that while agricultural productivity is improving, there is still an urgent need to align agricultural development with water carrying capacity through the promotion of water-saving technologies and optimization of crop structures.
In Hami, the most critical indicators are the planting area (D3, 0.2697), WF modulus (P2, 0.2187), per capita WF (S2, 0.2855), per capita urban green space (I4, 0.3099), and soil erosion control area (R2, 0.2701). The highest weight for I4 among all indicators reflects the city’s strong emphasis on the development of urban ecological spaces. However, from the perspective of water resource management, the potential water consumption associated with urban green spaces warrants further attention. The high weight of R2 suggests that Hami has made notable progress in ecological restoration and land conservation. It is therefore recommended to further enhance integrated governance and policy coordination to strengthen the overall resilience of the regional water resource system.
A comparative analysis reveals that all three regions identify S2 and P2 as core indicators of pressure and state, illustrating the combined impacts of population and agricultural demands under conditions of water scarcity. Figure 7 shows that the per capita water resources in the Turpan–Hami Basin exhibit considerable fluctuations, with a significant downward trend since peaking in 2016. In contrast, the S2 has been steadily increasing, while the variation in per capita water use remains relatively limited. The I3 has been continuously rising, highlighting that improving water quality remains a major challenge for achieving sustainable water resources management. Meanwhile, the significance of indicators such as I4 and R2 reflects the growing regional emphasis on ecological security and strengthened governance capacity.

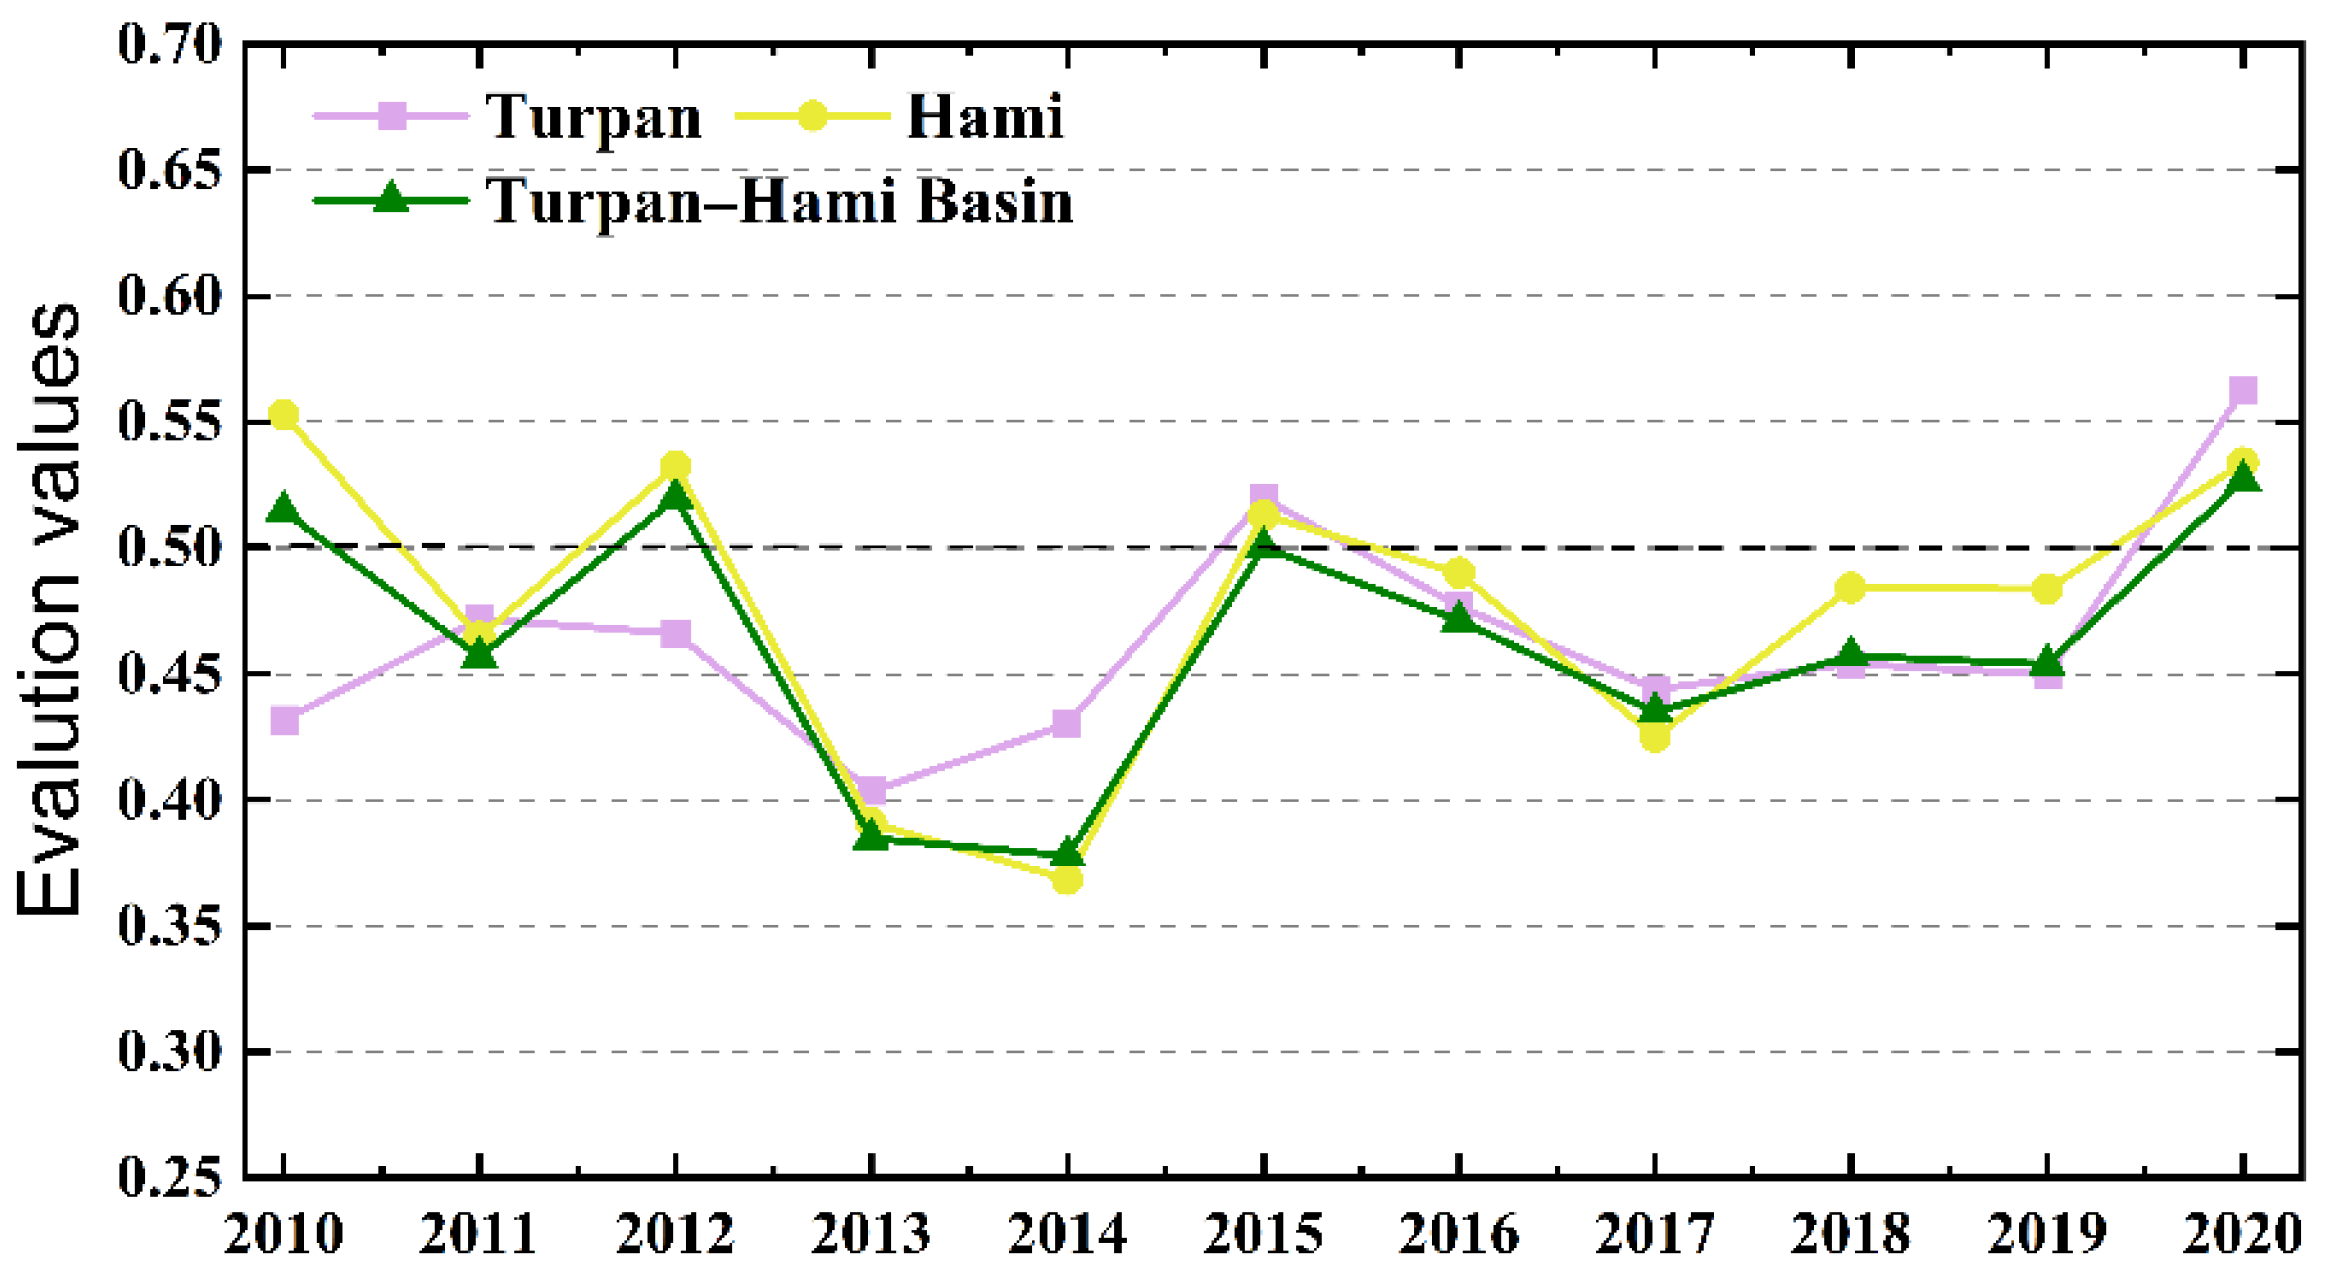
3.2.2. Sustainability Status of Water Resources

According to the DPSIR model evaluation results (Figure 8), the overall water resource sustainability score for the Turpan–Hami Basin ranged between 0.38 and 0.52 in most years, corresponding to Grade III (“Basically Sustainable”) to Grade IV (“Insufficiently Sustainable”). This indicates that the region’s water system has long been under substantial stress, characterized by frequent fluctuations and generally low sustainability. Although the score peaked at 0.5268 in 2020—the highest during the monitoring period—indicating partial recovery and improvement, challenges such as persistent water scarcity and ecological fragility remain.
From 2010 to 2012, the basin’s overall score remained within Grade III, representing a relatively favorable period marked by smaller agricultural scale and lower water demand. However, during 2013–2014, the score declined sharply to Grade IV, primarily due to increases in the per capita WF, deterioration in water quality-related shortages, and a reduction in the soil erosion control area, which collectively intensified stress on the system. Since 2015, most years have remained in Grade IV. Although the score temporarily returned to Grade III in 2020, the foundation for sustainable improvement remains fragile, and considerable uncertainty persists.
From a regional perspective, Turpan’s sustainability scores predominantly ranged from 0.40 to 0.47, consistently falling within Grade IV. It only briefly attained Grade III in 2015 and 2020, indicating chronic water stress, high system vulnerability, and limited, unstable progress. In contrast, Hami generally achieved slightly higher scores than Turpan, reaching Grade III in 2010, 2012, 2015, and 2020, while fluctuating within Grade IV during other years. This pattern reflects alternating phases of improvement and decline, indicative of moderate regulatory capacity and potential for system recovery. Turpan’s water resource system exhibited persistently low scores with minimal variation, consistently struggling to exceed Grade IV. This reflects the compounded pressures of agricultural production and ecological degradation, along with the limited capacity for ecological restoration, which collectively hinder sustainable development. In contrast, while Hami also experienced some periods of decline, its comparatively higher scores and ongoing ecological restoration efforts suggest greater system resilience and improved prospects for phased recovery.
These findings underscore the significant regional and structural disparities in water resource sustainability across the Turpan–Hami Basin. Future governance strategies should be tailored to the specific characteristics of each subregion’s water system to effectively enhance the overall level of sustainable development.

4. Discussion

This study focuses on agricultural water use in the Turpan–Hami Basin, a representative arid region in China. It systematically examines the characteristics and temporal evolution of the regional AWF, integrating the DPSIR framework to comprehensively assess water resource sustainability and its primary driving factors. The findings reveal that the water resource system in the Turpan–Hami Basin faces multiple pressures, including a heavy AWF burden, limited ecological response capacity, and pronounced spatial heterogeneity. These insights underscore the urgent need for refined, region-specific water resource management strategies.

4.1. Water Footprint in the Arid Regions

The AWF in the Turpan–Hami Basin has shown phased fluctuations with an overall upward trend. Blue water constitutes the majority of the WF, while the contribution of green water remains relatively low, reflecting typical water use characteristics of arid regions [50]. Among agricultural crops, water-intensive species such as cotton and grapes are the main contributors to the WF. Cotton, as a key economic crop in the region, requires substantial water inputs throughout its various growth stages. Shen et al. [51] also noted that cotton’s irrigation demands vary significantly across different growth periods, further increasing the region’s reliance on water resources. Therefore, optimizing the crop structure according to local conditions—by promoting water-efficient and high-value crops—is essential for improving agricultural water sustainability [14].
Compared with other typical arid basins, the Turpan–Hami Basin exhibits significant differences in agricultural WF characteristics, with crops mainly consisting of summer varieties and cotton showing a particularly high WF. In the Nile Valley and Delta, crops are cultivated in rotation across different seasons, with cotton and sunflower having high blue WF. The average net economic return of summer crops is 5.23 LE/m3, indicating the substantial influence of the cropping season and crop type on both the WF and economic benefits [52]. In the Peshawar Basin of Pakistan, maize has the highest blue and green WFs, while sugarcane has the lowest. However, water-intensive crops occupy nearly half of the cultivated area, with annual blue water consumption reaching 1.9 billion m3, accounting for 31% of the available surface water. Nonetheless, blue water wastage is widespread [53]. In the Segura River Basin of Spain, the average annual WF of irrigated agriculture reaches 44.03 × 10⁸ m3, with blue water accounting for more than twice the volume of green water. Due to increased irrigation, the grey WF has also risen significantly [44].
At the regional scale, significant differences in AWF performance are observed between Turpan and Hami. Turpan consistently bears a heavy agricultural water load, primarily due to intensive irrigation practices and a reliance on monoculture cropping systems [54]. In contrast, Hami demonstrates a more diversified agricultural structure, stronger water management capacity, and more stable WF patterns, indicating greater system resilience. Additionally, the grey WF in the basin has shown a continuous annual increase, signaling escalating water pollution driven by agricultural activities. This trend aligns with Zhao et al.’s findings in arid regions of western China, emphasizing the urgent need to enhance pollution control measures and advance sustainable, eco-friendly agricultural practices [55].
In rapidly developing arid regions such as the Turpan–Hami Basin, although the total agricultural output and economic benefit per unit of WF have steadily improved, water use has exceeded the ecological carrying capacity, and water scarcity remains a critical challenge. High economic benefit is often driven by the expansion of irrigated land and the cultivation of water-intensive crops, further exacerbating pressure on water resources. Therefore, future strategies should focus on “maintaining economic benefits while optimizing agricultural structure and enhancing water productivity per unit use”, particularly by reducing the proportion of high water-consuming crops to control total water consumption. Studies have shown an inverted U-shaped relationship between economic growth and water use efficiency, and there is no conclusive evidence that increased water inputs lead to significantly diminishing marginal returns or income declines [56]. Economic and population growth are key drivers of increased water consumption, though significant regional differences exist [57]. In water-scarce areas, without total water use constraints, even optimized allocation through multi-objective models may intensify water crises due to industrial expansion [58]. For example, in extremely arid countries like Iraq, the misalignment of the water–energy–food nexus has become a major barrier to regional development [59]. Moreover, water shortages in rural areas directly impact agricultural productivity, farmer incomes, and food security, thus becoming a key constraint to poverty alleviation and rural revitalization [60].

4.2. Sustainability Assessment of Water Resources Using the DPSIR Model

The DPSIR-based indicator system highlights the complexity and multi-dimensional nature of the regional water resource system. The indicator weight analysis reveals that socio-economic factors—particularly crop yield (D4) and the WF modulus (P2)—play dominant roles in determining system performance, indicating that agricultural water intensity and production inputs are key drivers of water sustainability [18,61]. These findings are consistent with those of Zhang et al., who reported similar dynamics in AWF in Xinjiang [62]. Moreover, indicators associated with ecological restoration and soil–water conservation exhibit high weights within the “Response” component, underscoring the ecological vulnerability and limited regulatory capacity typical of arid ecosystems.
In the DPSIR model, the “Response” component in Turpan holds a relatively high weight. From a data perspective, this is partly due to the selected indicators related to investment and ecological restoration, which showed notable variation and contributed significantly to the system’s information entropy, thus increasing their weight. However, the underlying reason lies more in policy implementation. Turpan has actively promoted sustainable water use through a series of measures, including water pricing reform, the expansion of water-saving agriculture, water network planning, infrastructure development, and improved wastewater treatment technologies. Between 2010 and 2020, the share of ecological water use increased while the proportion of agricultural water use declined [41]. During this period, the areas of water-saving irrigation, soil erosion control, and afforestation also expanded steadily. In regions like Turpan, where water stress is severe, response measures have a greater impact on sustainability and thus are more prominent in the comprehensive evaluation model. Strengthening ecological protection and promoting rational water use practices are critical to improving system resilience and sustainability [63].
It is important to note that WF indicators not only reflect the status of agricultural water use but also serve as a foundation for integrated assessments when combined with complementary metrics such as the Blue Water Scarcity Index and water-related economic productivity. This multi-indicator approach facilitates a more comprehensive understanding of the trade-offs among competing policy objectives and enhances the scientific basis for water resource management decision-making [64].
The multi-indicator evaluation of agricultural water resource sustainability reveals that the Turpan–Hami Basin frequently hovers on the boundary between sustainable and unsustainable states, reflecting considerable system vulnerability. Although the sustainability score showed improvement in 2020—indicating some progress in water conditions—the foundation for this improvement remains fragile, and substantial challenges persist. Compared with the national-level DPSIR assessment conducted by Zhang et al., the overall sustainability of water systems in northwestern China remains relatively low, despite gradual signs of improvement. The complex nonlinear interactions they identified are consistent with the sustainability patterns observed in this study [65].
By integrating WF theory and ecological response mechanisms into the DPSIR model, this study provides a more dynamic and holistic representation of water system evolution in arid regions compared to traditional single-factor or static evaluation methods. The resulting model demonstrates enhanced adaptability and explanatory capacity, particularly under complex and variable water management conditions.

4.3. Improvements and Limitations

Global trends in arid regions indicate that improving water use efficiency is a critical strategy for addressing climate change and ensuring food security [66]. Based on relevant studies, this paper proposes the following sustainable agricultural water use strategies for arid regions:
(1) Optimize agronomic practices and cropping patterns: High water-use efficiency crop varieties should be promoted, planting dates and crop types reasonably arranged, and intercropping and crop rotation (e.g., intercropping grapes with alfalfa) encouraged to enhance water productivity per unit. The soil structure should be improved and evaporation losses reduced by applying organic and combined nitrogen–phosphorus fertilizers, using cover crops and mulching, and thereby maximizing the utilization of natural precipitation (green water).
(2) Improve irrigation technology and management: Studies show that switching from furrow irrigation to micro-irrigation can reduce blue water consumption by 4.7%, with drip irrigation being the most effective method [67,68]. Drip irrigation can be applied to major crops in the Turpan–Hami Basin. Deficit irrigation can be implemented, irrigation timing and volume regulated, and automated and smart irrigation systems (e.g., remote sensing and sensor controls) introduced to enhance irrigation efficiency and reduce water waste. Advanced digital technologies can enable intelligent agriculture by developing digital models of actual irrigation networks for scientific water allocation [69,70].
(3) Strengthen water reuse and system recycling: The Sustainable Development Goals (SDGs) emphasize the importance of water recycling. Promoting the reuse of agricultural water can reduce dependence on surface and groundwater. Using reclaimed water and treated wastewater for irrigation not only alleviates water scarcity but also helps improve water quality and reduce environmental pollution.
This study has several limitations due to data constraints. The primary data source is statistical yearbooks, which provide coarse spatial resolution and may overlook local heterogeneity. Moreover, the grey WF estimation relies on a single method, introducing potential uncertainties and loss of detailed information. Future research should focus on improving data acquisition techniques and processing methods, such as employing higher-resolution remote sensing or field-measured data and integrating multi-source information, in order to enhance the accuracy and reliability of assessments. The current study focuses solely on historical agricultural water management data, emphasizing the integration of the WF and the DPSIR framework, without addressing future scenario changes. Zhang et al. [21] applied Bayesian networks to assess sustainable water management under different future water use scenarios, while Xu et al. [71] projected China’s future WF under Shared Socio-economic Pathways (SSPs). Building on these approaches, future work could incorporate dynamic modeling by integrating Bayesian networks with climate scenario data such as CMIP6 to improve the model’s adaptability and foresight. Additionally, we plan to conduct stakeholder interviews in follow-up research to strengthen the link between the model and policy practices, thereby enhancing the practical relevance of our findings.

5. Conclusions

This study examined the evolution of agricultural WF in the Turpan–Hami Basin from 2010 to 2020 and established a comprehensive water sustainability assessment framework based on the DPSIR model. The key findings are as follows:
WF characteristics: The total agricultural WF in the basin showed a generally increasing trend, with blue water consistently accounting for over 60%, indicating heavy reliance on irrigation. The grey WF also rose steadily, reflecting increasing non-point source pollution, while green water remained underutilized. Turpan exhibited the highest total WF and water use intensity, facing the greatest resource pressure, whereas Hami maintained a more stable but still suboptimal WF structure. High water-consuming crops—cotton, grapes, and melons—drove the rise in the blue WF, while staple crops showed stable or declining water use. Although economic performance improved, water scarcity and ecological strain intensified, underscoring the urgent need to optimize cropping patterns and irrigation practices.
Sustainability assessment: Turpan scored high in the “Response” subsystem, reflecting active policy implementation, while Hami scored higher in “Pressure”, indicating more severe supply–demand imbalances. Influencing factors included the crop yield, WF modulus, per capita WF, water quality-induced scarcity, and conservation efforts. From 2010 to 2020, the basin’s sustainability fluctuated between “Basically Sustainable (Level III)” and “Insufficiently Sustainable (Level IV)”, with a modest improvement in 2020. Turpan remained largely at Level IV, while Hami showed occasional improvements.
To improve agricultural water sustainability in arid regions, this study recommends the following: (1) promoting water-efficient crops, optimizing planting schedules, and adopting intercropping or rotation to enhance water productivity; (2) upgrading irrigation by adopting drip systems, applying deficit irrigation, and using smart technologies (e.g., remote sensing and sensors) to reduce water waste and improve efficiency; and (3) expanding water reuse by utilizing reclaimed and treated wastewater to ease water stress, improve quality, and support a circular water system.
This study highlights the dual challenge of increasing economic returns and escalating ecological pressure in arid agriculture. The proposed framework and findings offer valuable guidance for sustainable water management and coordinated ecological development in arid regions.

Author Contributions

Conceptualization, L.Z.; methodology, L.Z.; data curation, L.Z.; formal analysis, L.Z.; writing—original draft preparation, L.Z. writing—review and editing, Y.Y., Z.G., X.D., L.S., J.H., C.L. and R.Y.; supervision, Y.Y. and R.Y.; funding acquisition, Y.Y. All authors have read and agreed to the published version of the manuscript.

Funding

This research was funded by the National Key Research and Development Program of China (2023YFF0805603), the Strategic Priority Research Program of the Chinese Academy of Sciences (XDB0720203), the Key Research and Development Program of Xinjiang (2022B01032-4), and the Third Xinjiang Comprehensive Scientific Research Project on Comprehensive Evaluation and Sustainable Utilization of Land Resources in the Turpan-Hami Basin (2022xjkk1102).

Data Availability Statement

The data presented in this study will be made available upon request from the corresponding author.

Conflicts of Interest

The authors declare no conflicts of interest.

References

  1. Konar, M.; Dalin, C.; Suweis, S.; Hanasaki, N.; Rinaldo, A.; Rodriguez-Iturbe, I. Water for food: The global virtual water trade network. Water Resour. Res. 2011, 47, W05520. [Google Scholar] [CrossRef]
  2. Elbeltagi, A.; Deng, J.; Wang, K.; Hong, Y. Crop Water footprint estimation and modeling using an artificial neural network approach in the Nile Delta, Egypt. Agric. Water Manag. 2020, 235, 106080. [Google Scholar] [CrossRef]
  3. Olesen, J.E.; Bindi, M. Consequences of climate change for European agricultural productivity, land use and policy. Eur. J. Agron. 2002, 16, 239–262. [Google Scholar] [CrossRef]
  4. Fader, M.; Gerten, D.; Thammer, M.; Heinke, J.; Lotze-Campen, H.; Lucht, W.; Cramer, W. Internal and external green-blue agricultural water footprints of nations, and related water and land savings through trade. Hydrol. Earth Syst. Sci. 2011, 15, 1641–1660. [Google Scholar] [CrossRef]
  5. Marston, L.; Konar, M. Drought impacts to water footprints and virtual water transfers of the Central Valley of California. Water Resour. Res. 2017, 53, 5756–5773. [Google Scholar] [CrossRef]
  6. Yu, Y.; Pi, Y.; Yu, X.; Ta, Z.; Sun, L.; Disse, M.; Zeng, F.; Li, Y.; Chen, X.; Yu, R. Climate change, water resources and sustainable development in the arid and semi-arid lands of Central Asia in the past 30 years. J. Arid Land 2018, 11, 1–14. [Google Scholar] [CrossRef]
  7. Hoekstra, A.Y. Human appropriation of natural capital: A comparison of ecological footprint and water footprint analysis. Ecol. Econ. 2009, 68, 1963–1974. [Google Scholar] [CrossRef]
  8. Mekonnen, M.M.; Hoekstra, A.Y. The green, blue and grey water footprint of crops and derived crop products. Hydrol. Earth Syst. Sci. 2011, 15, 1577–1600. [Google Scholar] [CrossRef]
  9. Chapagain, A.K.; Hoekstra, A.Y. The water footprint of coffee and tea consumption in the Netherlands. Ecol. Econ. 2007, 64, 109–118. [Google Scholar] [CrossRef]
  10. Chapagain, A.K.; Hoekstra, A.Y.; Savenije, H.H.G.; Gautam, R. The water footprint of cotton consumption: An assessment of the impact of worldwide consumption of cotton products on the water resources in the cotton producing countries. Ecol. Econ. 2006, 60, 186–203. [Google Scholar] [CrossRef]
  11. Chen, J.; Gao, Y.; Qian, H.; Jia, H.; Zhang, Q. Insights into water sustainability from a grey water footprint perspective in an irrigated region of the Yellow River Basin. J. Clean. Prod. 2021, 316, 128329. [Google Scholar] [CrossRef]
  12. Arrien, M.M.; Aldaya, M.M.; Rodriguez, C.I. Water Footprint and Virtual Water Trade of Maize in the Province of Buenos Aires, Argentina. Water 2021, 13, 1769. [Google Scholar] [CrossRef]
  13. Cao, X.; Bao, Y.; Li, Y.; Li, J.; Wu, M. Unravelling the effects of crop blue, green and grey virtual water flows on regional agricultural water footprint and scarcity. Agric. Water Manag. 2023, 278, 108165. [Google Scholar] [CrossRef]
  14. Arunrat, N.; Sereenonchai, S.; Chaowiwat, W.; Wang, C. Climate change impact on major crop yield and water footprint under CMIP6 climate projections in repeated drought and flood areas in Thailand. Sci. Total Environ. 2022, 807, 150741. [Google Scholar] [CrossRef]
  15. Tuninetti, M.; Tamea, S.; D’Odorico, P.; Laio, F.; Ridolfi, L. Global sensitivity of high-resolution estimates of crop water footprint. Water Resour. Res. 2015, 51, 8257–8272. [Google Scholar] [CrossRef]
  16. Hu, Y.; Duan, W.; Chen, Y.; Zou, S.; Kayumba, P.M.; Qin, J. Exploring the changes and driving forces of water footprint in Central Asia: A global trade assessment. J. Clean. Prod. 2022, 375, 134062. [Google Scholar] [CrossRef]
  17. Liu, J.; Chen, J.; Xu, J.; Yuan, Z.; Wang, Y.; Lin, Y. Water resource security evaluation of the Yangtze River Economic Belt. Water Supply 2020, 20, 1554–1566. [Google Scholar] [CrossRef]
  18. Gao, J.; Xie, P.; Zhuo, L.; Shang, K.; Ji, X.; Wu, P. Water footprints of irrigated crop production and meteorological driving factors at multiple temporal scales. Agric. Water Manag. 2021, 255, 107014. [Google Scholar] [CrossRef]
  19. Jin, C.; Huang, K.; Yu, Y.; Zhang, Y. Analysis of Influencing Factors of Water Footprint Based on the STIRPAT Model: Evidence from the Beijing Agricultural Sector. Water 2016, 8, 513. [Google Scholar] [CrossRef]
  20. Feng, L.; Chen, B.; Hayat, T.; Alsaedi, A.; Ahmad, B. Dynamic forecasting of agricultural water footprint based on Markov Chain-a case study of the Heihe River Basin. Ecol. Model. 2017, 353, 150–157. [Google Scholar] [CrossRef]
  21. Zhang, L.; Yu, Y.; Guo, Z.; Ding, X.; Zhang, J.; Yu, R. Investigating agricultural water sustainability in arid regions with Bayesian network and water footprint theories. Sci. Total Environ. 2024, 951, 175544. [Google Scholar] [CrossRef] [PubMed]
  22. Borja, Á.; Galparsoro, I.; Solaun, O.; Muxika, I.; Tello, E.M.; Uriarte, A.; Valencia, V. The European Water Framework Directive and the DPSIR, a methodological approach to assess the risk of failing to achieve good ecological status. Estuar. Coast. Shelf Sci. 2006, 66, 84–96. [Google Scholar] [CrossRef]
  23. Zhang, F.; Zhang, J.; Wu, R.; Ma, Q.; Yang, J. Ecosystem health assessment based on DPSIRM framework and health distance model in Nansi Lake, China. Stoch. Environ. Res. Risk Assess. 2015, 30, 1235–1247. [Google Scholar] [CrossRef]
  24. Huang, H.; Kuo, J.; Lo, S. Review of PSR framework and development of a DPSIR model to assess greenhouse effect in Taiwan. Environ. Monit. Assess. 2010, 177, 623–635. [Google Scholar] [CrossRef]
  25. Malekmohammadi, B.; Jahanishakib, F. Vulnerability assessment of wetland landscape ecosystem services using driver-pressure-state-impact-response (DPSIR) model. Ecol. Indic. 2017, 82, 293–303. [Google Scholar] [CrossRef]
  26. Atkins, J.P.; Burdon, D.; Elliott, M.; Gregory, A.J. Management of the marine environment: Integrating ecosystem services and societal benefits with the DPSIR framework in a systems approach. Mar. Pollut. Bull. 2011, 62, 215–226. [Google Scholar] [CrossRef]
  27. Sekovski, I.; Newton, A.; Dennison, W.C. Megacities in the coastal zone: Using a driver-pressure-state-impact-response framework to address complex environmental problems. Estuar. Coast. Shelf Sci. 2012, 96, 48–59. [Google Scholar] [CrossRef]
  28. Namaalwa, S.; Van Dam, A.A.; Funk, A.; Ajie, G.S.; Kaggwa, R.C. A characterization of the drivers, pressures, ecosystem functions and services of Namatala wetland, Uganda. Environ. Sci. Policy 2013, 34, 44–57. [Google Scholar] [CrossRef]
  29. Wen, T.; Qi, S.; Qian, Y. Index measurement and analysis on spatial-temporal evolution of China’s new economy based on the DPSIR model. Int. Rev. Econ. Financ. 2024, 90, 252–264. [Google Scholar] [CrossRef]
  30. Lu, W.; Xu, C.; Wu, J.; Cheng, S. Ecological effect assessment based on the DPSIR model of a polluted urban river during restoration: A case study of the Nanfei River, China. Ecol. Indic. 2019, 96, 146–152. [Google Scholar] [CrossRef]
  31. Maxim, L.; Spangenberg, J.H.; O’Connor, M. An analysis of risks for biodiversity under the DPSIR framework. Ecol. Econ. 2009, 69, 12–23. [Google Scholar] [CrossRef]
  32. Jia, Y.; Wang, H. Study on Water Resource Carrying Capacity of Zhengzhou City Based on DPSIR Model. Int. J. Environ. Res. Public Health 2023, 20, 1394. [Google Scholar] [CrossRef] [PubMed]
  33. Bai, Y.; Qin, J.; Liu, W.; Li, L.; Wu, Y.; Zhang, P. The DPSIR Model-Based Sustainability Assessment of Urban Water Resources: A Comparative Study of Zhuhai and Macao. Water 2024, 16, 1413. [Google Scholar] [CrossRef]
  34. Shi, S.; Tao, X.; Chen, X.; Chen, H.; Fitri, A.; Yang, X. Evaluation of urban water security based on DPSIR model. IOP Conf. Ser. Earth Environ. Sci. 2021, 880, 012023. [Google Scholar] [CrossRef]
  35. Li, Y.; Liu, Y.; Qin, Y.; Zhang, K.; Enwer, R.; Wang, W.; Yuan, S. Evolution and Predictive Analysis of Spatiotemporal Patterns of Habitat Quality in the Turpan–Hami Basin. Land 2024, 13, 2186. [Google Scholar] [CrossRef]
  36. Zhang, Q.; Yan, M.; Zhang, L.; Shao, W.; Chen, Y.; Dong, Y. Three Decades of Oasis Transition and Its Driving Factors in Turpan–Hami Basin in Xinjiang, China: A Complex Network Approach. Remote Sens. 2024, 16, 465. [Google Scholar] [CrossRef]
  37. Shao, W.; Li, L.; Yan, M.; Meng, Z.; Zhang, L.; Zhang, Q.; Chen, Y. Thirty years’ spatio-temporal evolution of desertification degrees and driving factors in Turpan–Hami Basin, Xinjiang, China. Ecol. Indic. 2024, 166, 112484. [Google Scholar] [CrossRef]
  38. Xinjiang Statistical Yearbook. Available online: https://tjj.xinjiang.gov.cn/tjj/zhhvgh/list_nj1.shtml (accessed on 1 May 2022).
  39. Statistical Bulletin on the National Economic and Social Development of Turpan. Available online: https://www.tlf.gov.cn/tlfs/index.shtml (accessed on 1 March 2024).
  40. Statistical Bulletin on the National Economic and Social Development of Hami. Available online: https://www.hami.gov.cn/hami/index.shtml (accessed on 1 March 2024).
  41. Xinjiang Water Resources Bulletin. Available online: https://slt.xinjiang.gov.cn/xjslt/c114491/zfxxgk_list.shtml (accessed on 22 March 2022).
  42. Environmental Quality Standards for Surface Water. Available online: https://www.mee.gov.cn/ (accessed on 1 May 2023).
  43. Dang, Y.; Qin, L.; Huang, L.; Wang, J.; Li, B.; He, H. Water footprint of rain-fed maize in different growth stages and associated climatic driving forces in Northeast China. Agric. Water Manag. 2022, 263, 107463. [Google Scholar] [CrossRef]
  44. Martinez-Paz, J.M.; Gomariz-Castillo, F.; Pellicer-Martinez, F. Appraisal of the water footprint of irrigated agriculture in a semi-arid area: The Segura River Basin. PLoS ONE 2018, 13, e0206852. [Google Scholar] [CrossRef]
  45. Novoa, V.; Ahumada-Rudolph, R.; Rojas, O.; Saez, K.; de la Barrera, F.; Arumi, J.L. Understanding agricultural water footprint variability to improve water management in Chile. Sci. Total Environ. 2019, 670, 188–199. [Google Scholar] [CrossRef]
  46. Cui, S.; Dong, H.; Wilson, J. Grey water footprint evaluation and driving force analysis of eight economic regions in China. Environ. Sci. Pollut. Res. Int. 2020, 27, 20380–20391. [Google Scholar] [CrossRef] [PubMed]
  47. Yu, H.; Yang, Z.; Li, B. Sustainability Assessment of Water Resources in Beijing. Water 2020, 12, 1999. [Google Scholar] [CrossRef]
  48. Alizadeh, Z.; Yazdi, J.; Moridi, A. Development of an Entropy Method for Groundwater Quality Monitoring Network Design. Environ. Process. 2018, 5, 769–788. [Google Scholar] [CrossRef]
  49. Krishnan, A.R.; Kasim, M.M.; Hamid, R.; Ghazali, M.F. A Modified CRITIC Method to Estimate the Objective Weights of Decision Criteria. Symmetry 2021, 13, 973. [Google Scholar] [CrossRef]
  50. Zhang, L.; Yu, Y.; Malik, I.; Wistuba, M.; Sun, L.; Yang, M.; Wang, Q.; Yu, R. Water Resources Evaluation in Arid Areas Based on Agricultural Water Footprint—A Case Study on the Edge of the Taklimakan Desert. Atmosphere 2023, 14, 67. [Google Scholar] [CrossRef]
  51. Shen, Y.; Li, S.; Chen, Y.; Qi, Y.; Zhang, S. Estimation of regional irrigation water requirement and water supply risk in the arid region of Northwestern China 1989–2010. Agric. Water Manag. 2013, 128, 55–64. [Google Scholar] [CrossRef]
  52. El-Marsafawy, S.M.; Mohamed, A.I. Water footprint of Egyptian crops and its economics. Alex. Eng. J. 2021, 60, 4711–4721. [Google Scholar] [CrossRef]
  53. Khan, T.; Nouri, H.; Booij, M.; Hoekstra, A.; Khan, H.; Ullah, I. Water Footprint, Blue Water Scarcity, and Economic Water Productivity of Irrigated Crops in Peshawar Basin, Pakistan. Water 2021, 13, 1249. [Google Scholar] [CrossRef]
  54. Huang, S.; Krysanova, V.; Zhai, J.; Su, B. Impact of Intensive Irrigation Activities on River Discharge Under Agricultural Scenarios in the Semi-Arid Aksu River Basin, Northwest China. Water Resour. Manag. 2014, 29, 945–959. [Google Scholar] [CrossRef]
  55. Zhao, D.; Liu, W.; Gao, R.; Zhang, P.; Li, M.; Wu, P.; Zhuo, L. Spatiotemporal evolution of crop grey water footprint and associated water pollution levels in arid regions of western China. Agric. Water Manag. 2023, 280, 108224. [Google Scholar] [CrossRef]
  56. Barbier, E.B. Water and Economic Growth. Econ. Rec. 2004, 80, 1–16. [Google Scholar] [CrossRef]
  57. Duarte, R.; Pinilla, V.; Serrano, A. Looking backward to look forward: Water use and economic growth from a long-term perspective. Appl. Econ. 2013, 46, 212–224. [Google Scholar] [CrossRef]
  58. Davijani, M.H.; Banihabib, M.E.; Anvar, A.N.; Hashemi, S.R. Multi-Objective Optimization Model for the Allocation of Water Resources in Arid Regions Based on the Maximization of Socioeconomic Efficiency. Water Resour. Manag. 2016, 30, 927–946. [Google Scholar] [CrossRef]
  59. Al-Muqdadi, S.W.H.; Khalaifawi, A.; Abdulrahman, B.; Kittana, F.A.; Alwadi, K.Z.; Abdulkhaleq, M.H.; Al Saffar, S.S.; Al Taie, S.M.; Merza, S.; Al Dahmani, R. Exploring the challenges and opportunities in the Water, Energy, Food nexus for Arid Region. J. Sustain. Dev. Energy Water Environ. Syst. 2021, 9, 1–30. [Google Scholar] [CrossRef]
  60. Wang, Y.; Cui, X.; Zhang, X.; Wen, Q. Exploring the Sustainable Use Strategy of Scarce Water Resources for Rural Revitalization in Yanchi County from Arid Region of Northwest China. Int. J. Environ. Res. Public Health 2022, 19, 16347. [Google Scholar] [CrossRef]
  61. Mao, Y.; Liu, Y.; Zhuo, L.; Wang, W.; Li, M.; Feng, B.; Wu, P. Quantitative evaluation of spatial scale effects on regional water footprint in crop production. Resour. Conserv. Recycl. 2021, 173, 105709. [Google Scholar] [CrossRef]
  62. Zhang, X.; Wang, Z.; Liu, J.; Li, W.; Lin, H.; Javed, T.; Gao, X.; Qin, G.; Liu, H.; Wang, H.; et al. Spatial–Temporal Dynamics and Drivers of Crop Water Footprint in Xinjiang, China. Agronomy 2025, 15, 296. [Google Scholar] [CrossRef]
  63. Pei, H.; Fang, S.; Lin, L.; Qin, Z.; Wang, X. Methods and applications for ecological vulnerability evaluation in a hyper-arid oasis: A case study of the Turpan Oasis, China. Environ. Earth Sci. 2015, 74, 1449–1461. [Google Scholar] [CrossRef]
  64. Zoumides, C.; Bruggeman, A.; Hadjikakou, M.; Zachariadis, T. Policy-relevant indicators for semi-arid nations: The water footprint of crop production and supply utilization of Cyprus. Ecol. Indic. 2014, 43, 205–214. [Google Scholar] [CrossRef]
  65. Zhang, Y.; Wei, Y.; Mao, Y. Sustainability Assessment of Regional Water Resources in China Based on DPSIR Model. Sustainability 2023, 15, 8015. [Google Scholar] [CrossRef]
  66. Alharbi, S.; Felemban, A.; Abdelrahim, A.; Al-Dakhil, M. Agricultural and Technology-Based Strategies to Improve Water-Use Efficiency in Arid and Semiarid Areas. Water 2024, 16, 1842. [Google Scholar] [CrossRef]
  67. Chukalla, A.D.; Krol, M.S.; Hoekstra, A.Y. Green and blue water footprint reduction in irrigated agriculture: Effect of irrigation techniques, irrigation strategies and mulching. Hydrol. Earth Syst. Sci. 2015, 19, 4877–4891. [Google Scholar] [CrossRef]
  68. Wang, W.; Zhuo, L.; Li, M.; Liu, Y.; Wu, P. The effect of development in water-saving irrigation techniques on spatial-temporal variations in crop water footprint and benchmarking. J. Hydrol. 2019, 577, 123916. [Google Scholar] [CrossRef]
  69. Galaverni, M.; Oddi, G.; Preite, L.; Belli, L.; Davoli, L.; Marchioni, I.; Rodolfi, M.; Solari, F.; Beghè, D.; Ganino, T.; et al. An IoT-based data analysis system: A case study on tomato cultivation under different irrigation regimes. Comput. Electron. Agric. 2025, 229, 109660. [Google Scholar] [CrossRef]
  70. Preite, L.; Solari, F.; Vignali, G. Water Management Optimization in Agriculture: A Digital Model Development. Water Resour. Manag. 2025, 39, 1261–1279. [Google Scholar] [CrossRef]
  71. Xu, X.; Zhang, Y.; Chen, Y. Projecting China’s future water footprint under the shared socio-economic pathways. J. Environ. Manag. 2020, 260, 110102. [Google Scholar] [CrossRef]
Figure 1. Location of the Turpan–Hami Basin (map approval number: GS (2022) 4309).
Agronomy 15 01393 g001
Figure 2. Interaction network of the water resource system under the DPSIR model framework.
Agronomy 15 01393 g002
Figure 3. Agricultural water footprint in the Turpan–Hami Basin (blue, green, and grey water).
Agronomy 15 01393 g003
Figure 4. Proportions of different colored water footprints in the Turpan–Hami Basin.
Agronomy 15 01393 g004
Figure 5. (a) Trends in the water footprint and (b) crop water footprint in the Turpan–Hami Basin.
Agronomy 15 01393 g005
Figure 6. (a) Water scarcity index (%) and (b) economic benefit of the WF (CNY/m3) in the Turpan–Hami Basin.
Agronomy 15 01393 g006
Figure 7. Per capita water resources, water footprint, water consumption (m3/people), and water quality shortage index in the Turpan–Hami Basin.
Agronomy 15 01393 g007
Figure 8. Comprehensive evaluation value of the Turpan-Hami Basin.
Agronomy 15 01393 g008
Table 1. Water resource sustainability evaluation indicators under the DPSIR Framework.
TypeIndicatorsUnitCalculation MethodCodeAttribute
Driver (D)Population Densityperson/km2Population/AreaD1negative
Per Capita GDPCNY/personGDP/PopulationD2positive
Planting Areaha-D3negative
Crop Yieldton-D4positive
Proportion of Agricultural Output%Agricultural Output/GDPD5positive
Pressure (P)Water Utilization Rate%Water use/Water resources × 100%P1negative
Water Footprint Modulusm3/km2AWF/AreaP2negative
Nitrogen Amountton-P3negative
Proportion of Blue WF%AWFblue/AWF × 100%P4negative
Proportion of Green WF%AWFgreen/AWF × 100%P5positive
Proportion of Grey WF%AWFgrey/AWF × 100%P6negative
State (S)Per Capita Water Resourcesm3/personWater resources/PopulationS1positive
Per Capita WFm3/personAWF/PopulationS2negative
Water Scarcity Index%AWF/Water resources × 100%S3negative
Precipitationmm-S4positive
Total Power of Agricultural MachinerykW-S5positive
Impact (I)Economic Benefit of WFCNY/m3GDP/AWFI1positive
Per Capita Water Usem3/personWater use/PopulationI2negative
Water Quality Shortage Index-AWFgrey/Water resourcesI3negative
Per Capita Urban Green Spacem2/personPark Green Space/PopulationI4positive
Response (R)Proportion of Environmental Water Use%Environmental Water Use/Water useR1positive
Soil Erosion Control Areaha-R2positive
Afforested Areaha-R3positive
Water-Saving Irrigation Areaha-R4positive
Investment in Environmental Pollution Control104 CNY-R5positive
Table 2. Evaluation criteria for sustainable water resource utilization.
Evaluation Score0.00–0.170.17–0.330.33–0.500.50–0.670.68–0.830.83–1.00
Evaluation LevelVIVIVIIIIII
Evaluation CriteriaUnsustainableModerately UnsustainableInsufficiently SustainableBasically SustainableSustainableHighly Sustainable
Table 3. Combined weights of evaluation indicators and DPSIR subsystems.
IndicatorsTurpanHamiTurpan–Hami Basin
CodeSubsystem WeightCombination WeightSubsystem WeightCombination WeightSubsystem WeightCombination Weight
D10.17650.14830.19400.13810.18570.1416
D20.22190.21710.2103
D30.17210.26970.2125
D40.25880.23450.2306
D50.19880.14060.2049
P10.24310.14690.22790.15220.24930.1765
P20.23520.21870.2458
P30.17930.14570.1832
P40.13930.21270.1283
P50.12900.13360.1277
P60.17040.13710.1384
S10.19730.23570.19080.13440.20560.1413
S20.26760.28550.2978
S30.14470.12010.1241
S40.17840.25030.2101
S50.17360.20970.2267
I10.13630.20550.16180.22200.13480.2152
I20.26270.22080.2544
I30.28880.24730.2744
I40.24310.30990.2560
R10.24680.23730.22560.23150.22460.2495
R20.23110.27010.2574
R30.14890.17760.1674
R40.16100.16300.1249
R50.22170.15780.2008
Disclaimer/Publisher’s Note: The statements, opinions and data contained in all publications are solely those of the individual author(s) and contributor(s) and not of MDPI and/or the editor(s). MDPI and/or the editor(s) disclaim responsibility for any injury to people or property resulting from any ideas, methods, instructions or products referred to in the content.

