Article

Estimation of Maize Yield in Plastic Film Mulched Field Using UAV Multispectral Imagery

1
College of Ecology, Lanzhou University, Lanzhou 730000, China
2
Yuncheng Yellow River Basin Ecological Protection and High-Quality Development Promotion Center, Yuncheng 040000, China
3
Sanya Institute, Nanjing Agricultural University, Nanjing 210095, China
4
Animal Husbandry, Pasture and Green Agriculture Institute, Gansu Academy of Agricultural Sciences, Lanzhou 730000, China
5
Jiangsu Key Laboratory of Crop Genetics and Physiology/Jiangsu Key Laboratory of Crop Cultivation and Physiology, Agricultural College, Yangzhou University, Yangzhou 225009, China
6
Jiangsu Co-Innovation Center for Modern Production Technology of Grain Crops, Yangzhou University, Yangzhou 225009, China
7
Research Institute of Rice Industrial Engineering Technology, Yangzhou University, Yangzhou 225009, China
*
Author to whom correspondence should be addressed.
Agronomy 2025, 15(6), 1269; https://doi.org/10.3390/agronomy15061269
Submission received: 1 April 2025 / Revised: 7 May 2025 / Accepted: 15 May 2025 / Published: 22 May 2025
(This article belongs to the Section Precision and Digital Agriculture)

Abstract

:
In precision agriculture research, it is important to monitor maize growth conditions in real time for effective field diagnosis, management, and accurate yield prediction. This study aimed to develop an inverse model of vegetation index and maize yield using Unmanned Aerial Vehicle (UAV) multispectral imagery. The objective was to investigate how the vegetation index, maize growth stages, and growth parameters respond to plastic film mulching on the Loess Plateau. Annual field trials (2019–2020) employed a factorial design to evaluate mulch and nitrogen regimes. The results show that vegetation index long-time series curves, combined with maize phenological growth stages, can be used to monitor maize growth and yield estimation (R2 > 0.9). The 13 vegetation indices (VIs) obtained by UAVs had a good regression relationship with the leaf area index, with the enhanced vegetation index 2 (EVI2) performing the best. The VIs obtained by UAVs at different stages of growth and development predicted yields, finding that EVI2 performed best with an R2 of 0.92 and an RMSE of 0.52 t ha-1 when maize entered the heading stage in 2019. The regression effect of VIs and yield based on maize without plastic film mulching management entering the heading stage was the best in 2020, with an R2 of 0.94 and an RMSE of 0.44 t ha−1. When maize enters the heading stage, the best simulation results can be obtained by using the VIs to establish a yield prediction model. Spectral signatures during reproductive transition (VT-R1) proved most indicative of the final yield. Convergence of UAV-based spectral phenotyping with crop developmental physiology enables high-resolution growth diagnostics, providing empirical support for precision farming adaptations.

1. Introduction

Ridge–furrow cultivation with full plastic film mulching is common in the food-critical, semi-arid Loess Plateau (6.7% of China’s land) [1,2]. However, climate change, including extreme rainfall, necessitates accurate pre-harvest crop monitoring and yield prediction to inform agricultural practices, research, and field management in this region [3,4].
The biophysical parameters reflecting crop growth in the field include the leaf area index [5], vegetation coverage, vegetation index, and above-ground biomass. These parameters play an irreplaceable role in the evaluation of climate models, the simulation of primary productivity, agricultural yield prediction, and other diversity studies. On-the-spot surveys to measure important crop parameters require considerable manpower and material resources, damage crops, introduce subjectivity, and limit the range of practical applications [6].
There are a number of methods to predict crop yield at different time and space levels in previous research that have achieved remarkable results. Statistical models, remote sensing, and crop growth models are the main yield prediction methods [7]. Statistical models, using crop growth, soil, and weather data, are simple but prone to human error and limited scope [8]. Remote sensing excels in wide coverage, frequent updates, and low cost [9], but satellite image resolution constraints can be a drawback for specific or large-scale applications. The crop growth model can not only successfully simulate the process of maize growth and development on a single-point scale but can also be extended to the regional scale. At present, there are a variety of crop models to choose from, such as the agricultural production system simulator (APSIM) and the DeNitrification-DeComposition (DNDC) model [1,10]. The process-based crop simulation model can predict crop yields in different years and locations, but its disadvantage is that it is difficult to parameterize and calibrate. Remote sensing provides spatial information for crop models to improve yield prediction, making the combination of these models and remote sensing data an important research direction in yield prediction [5,11].
Recent years have witnessed a significant expansion in UAV applications for agricultural remote sensing, with notable advancements in crop monitoring techniques. Studies have demonstrated the context-dependent efficacy of various approaches: Yao et al. (2017) accurately estimated the wheat leaf area index (RRMSE = 24%) using narrowband multispectral imagery under controlled nitrogen conditions (50–200 kg N/ha) [12]; however, performance declined by 18–25% in fields with complex soil backgrounds. Similarly, Wan et al. (2020) reported 89% accuracy for rice yield prediction in smallholder farms (<2 ha) through multi-temporal RGB and multispectral data fusion with the WOFOST model [13], yet highlighted scalability challenges requiring parameter recalibration for larger fields (>10 ha). However, significant limitations persist in semi-arid plasticulture systems, where three key challenges emerge: (1) soil-mulch spectral interference reduces vegetation index sensitivity [14]; (2) plastic mulch alters microclimatic conditions, affecting phenological development [15]; and (3) most existing models show limited accuracy under low rainfall conditions (<400 mm/year) [16]. These findings collectively emphasize the critical need for developing adaptive monitoring protocols that incorporate multi-sensor fusion, physics-based information, and region-specific vegetation index calibration to overcome the unique challenges of dryland agroecosystems.
UAVs are revolutionizing agricultural monitoring, especially in complex, semi-arid landscapes. Although studies show their effectiveness in vegetation index analysis and thermal drought detection [17], adapting to region-specific stressors remains challenging [14]. In the Loess Plateau’s degraded farmlands, where ecosystem fragility intersects with intensive cultivation, current yield prediction models exhibit 10–20% inaccuracies due to unoptimized spectral calibration [18]. This study advances UAV-based precision agriculture through three innovations: (1) multi-temporal canopy feature extraction across maize’s 120-day growth cycle; (2) the integration of multispectral data with phenological growth models; and (3) the development of adaptive calibration protocols for heterogeneous field environments. This approach provides insights for addressing food security challenges in northwest China, while also offering adaptable frameworks as references for crop monitoring in global dryland farming systems, contributing to sustainable intensification goals under UN SDG 2.

2. Materials and Methods
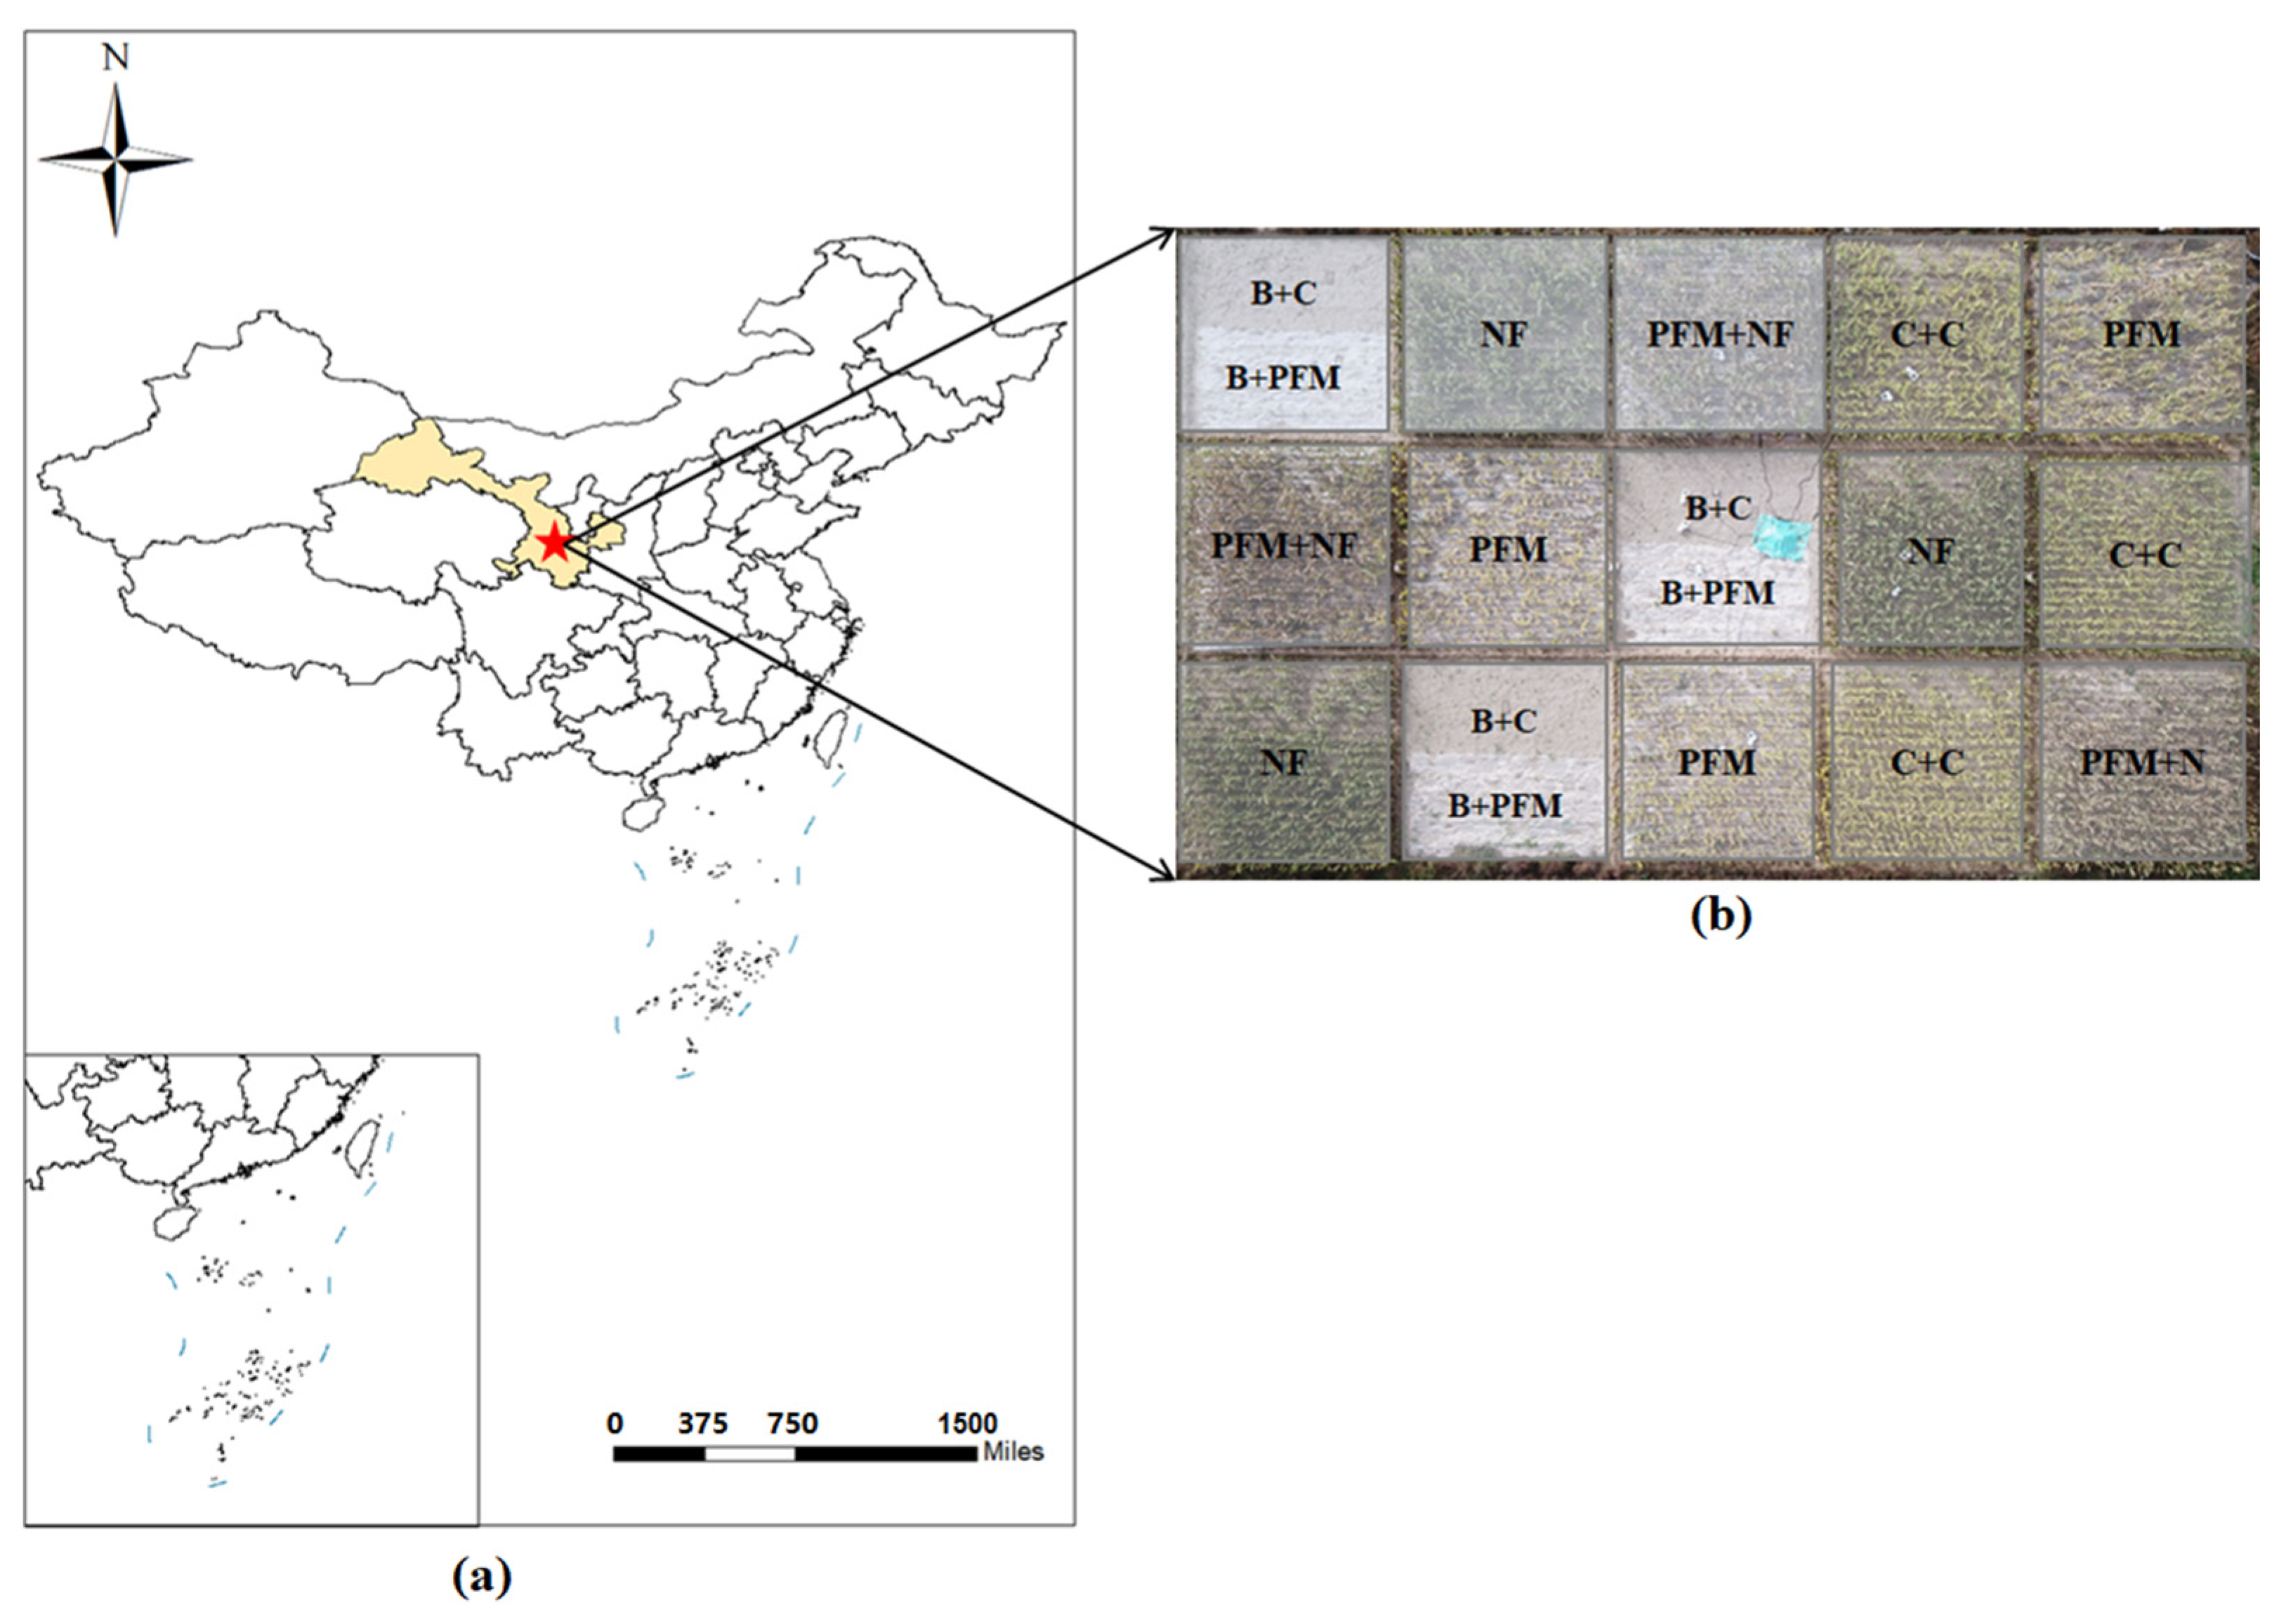
2.1. Study Area

Annual field trials (2019–2020) were implemented at the Loess Plateau Semi-Arid Agroecosystem Observatory (36°03′ N, 104°25′ E), a representative dryland research facility in Zhonglianchuan, Gansu Province (Figure 1). This region exhibits characteristic water-limited conditions, with a mean annual precipitation of 400 mm, contrasting sharply with a potential evapotranspiration of 1500 mm [1]. The experimental plots contained sandy loam soils (USDA texture classification) exhibiting limited organic carbon reserves (≤1.2% SOC) [19].

2.2. Experimental Design

A factorial arrangement within a randomized complete block design was implemented to analyze maize performance under plastic film mulching regimes and nitrogen fertilization strategies (150 kg N ha−1) in semi-arid agroecosystems during the 2019–2020 growing cycles. Four treatments were implemented: C+C (no mulching or nitrogen supplementation); PFM (Plastic film mulch only); NF (Nitrogen fertilization only); and PFM+NF (combined), triplicated in 10 × 10 m plots separated by 0.5 m isolation belts (Figure 1).
Initial soil preparation involved deep tillage (30 cm depth) each April. Raised-bed systems (55 × 15 cm) with furrow networks were established following regional dryland practices. Mulch plots received continuous LDPE film coverage (0.008 × 1200 mm) incorporating microperforations (2 mm in diameter, 15 cm apart) for hydroregulation (Figure 2).
Manual sowing at 40 cm spacing (47,500 plants ha−1 density) commenced 7 days after mulching. Growing cycles extended from late April to mid-October, relying exclusively on precipitation (2019: 28 April–14 October; 2020: 24 April–17 October). Post-harvest management included residue export with mulch preservation for multi-season functionality.

2.3. Ground Sampling

A standardized system was used to identify corn growth stages [14] (Table S1): VE (emergence), V6 (sixth leaf), V8 (eighth leaf), VT (tasseling), R1 (silking), R2 (blister), and harvest. Every two weeks after emergence, three random plants per plot were measured for leaf area and height, then separated into root, stem, leaf, and grain. Samples were oven-dried at 70 °C to a constant weight.
Field-acquired leaf dimension data were utilized for leaf area index (LAI) computation following standardized agrometeorological formulae (Equation (1)).
LAI = A leaf A ground
where Aleaf is the sum of the leaf area of a plant, and Aground represents the ground area occupied by each plant of maize.
The N content of plant leaves was measured by a German element analyzer: Elementary. The central area (21 m2) of each plot was harvested to measure the maize yield. Maize yield is the grain weight dried at 70 °C.

2.4. Using UAV to Acquire Remote Sensing Data

The UAS consists of a drone and a multispectral camera. The UAV model is the DJI M600Pro, and the camera on board is the TETRCAMMCAW-6T multispectral camera (DJI, Shenzhen, China) (Table S2). The UAV platform integrated a six-channel multispectral sensor array (1280 × 1080 px) co-mounted with a thermal imager (7.5–13 μm spectral range), both featuring 9.6 mm lenses. Flight operations at 25 m AGL altitude employed DJI GS Pro-controlled autonomous navigation with 75% frontal/lateral overlap, maintaining 4.8 m/s velocity and 1 s image capture intervals. Multispectral acquisitions targeted critical maize phenological stages under optimal atmospheric conditions (clear skies, wind speed < 2 m/s) during 10:00–14:00 local time (Table S2).

2.5. Data Processing

Multispectral imagery from 12 key growth stages during the 2019–2020 maize growing seasons was processed using Agisoft Metashape Professional 1.7.2 to generate orthomosaics, with geometric correction achieving < 3 cm RMSE accuracy via 15 ground control points (GCPs). Radiometric calibration was performed using a TETRACAM reference panel (2–50% reflectance) captured during each flight. In ENVI 5.6, treatment-specific regions of interest (ROIs) were delineated for each plot (C+C, PFM, NP, PFM+NP), excluding a 2-m buffer zone to minimize edge effects. Thirteen vegetation indices (Table S3) were calculated as arithmetic means of valid pixels per treatment using the formula:
V I ¯ = 1 n i = 1 n V I i
where n represents qualified pixels after filtering.
In 2019, LAI and leaf biomass of maize were measured 6 times. In 2020, the study measured the LAI 7 times and the leaf biomass (Table S2) 5 times. A total of 13 vegetation indices (VIs) for the grasslands were obtained and calculated from UAV-based multispectral images collected 12 times in 2019 and 2020 (Tables S2 and S3). Statistical analyses were performed using R 4.1.0 with the agricolae package. Treatment effects were analyzed through univariate ANOVA with the least significant difference (LSD) testing (α = 0.05). UAV-derived vegetation indices were regressed against agronomic parameters (LAI, biomass, yield) using linear models. Model robustness was assessed using determination coefficient (R2; Equation (3)) and root mean square error (RMSE; Equation (4)) metrics.
R 2 = 1 - i = 1 n ( P i O i ) 2 i = 1 n ( P i A i ) 2
RMSE = 1 n i = 1 n ( P i O i ) 2 1 / 2
where n is the number of observations, Pi is the modeled value, Ai is the average of the observed value, and Oi is the observed value.

3. Results

3.1. Growing Season Climatic Patterns

Interannual comparisons revealed comparable growing season totals for temperature and precipitation (2019–2020), albeit with distinct temporal rainfall patterns (Figure S1). The 2020 season exhibited elevated May–August precipitation, corresponding to critical vegetative (VE) to blister kernel (R2) phases in non-mulched systems. Conversely, 2019 rainfall peaked during July’s mid-growth period (V8–R2) under plastic mulch cultivation (Table S2).

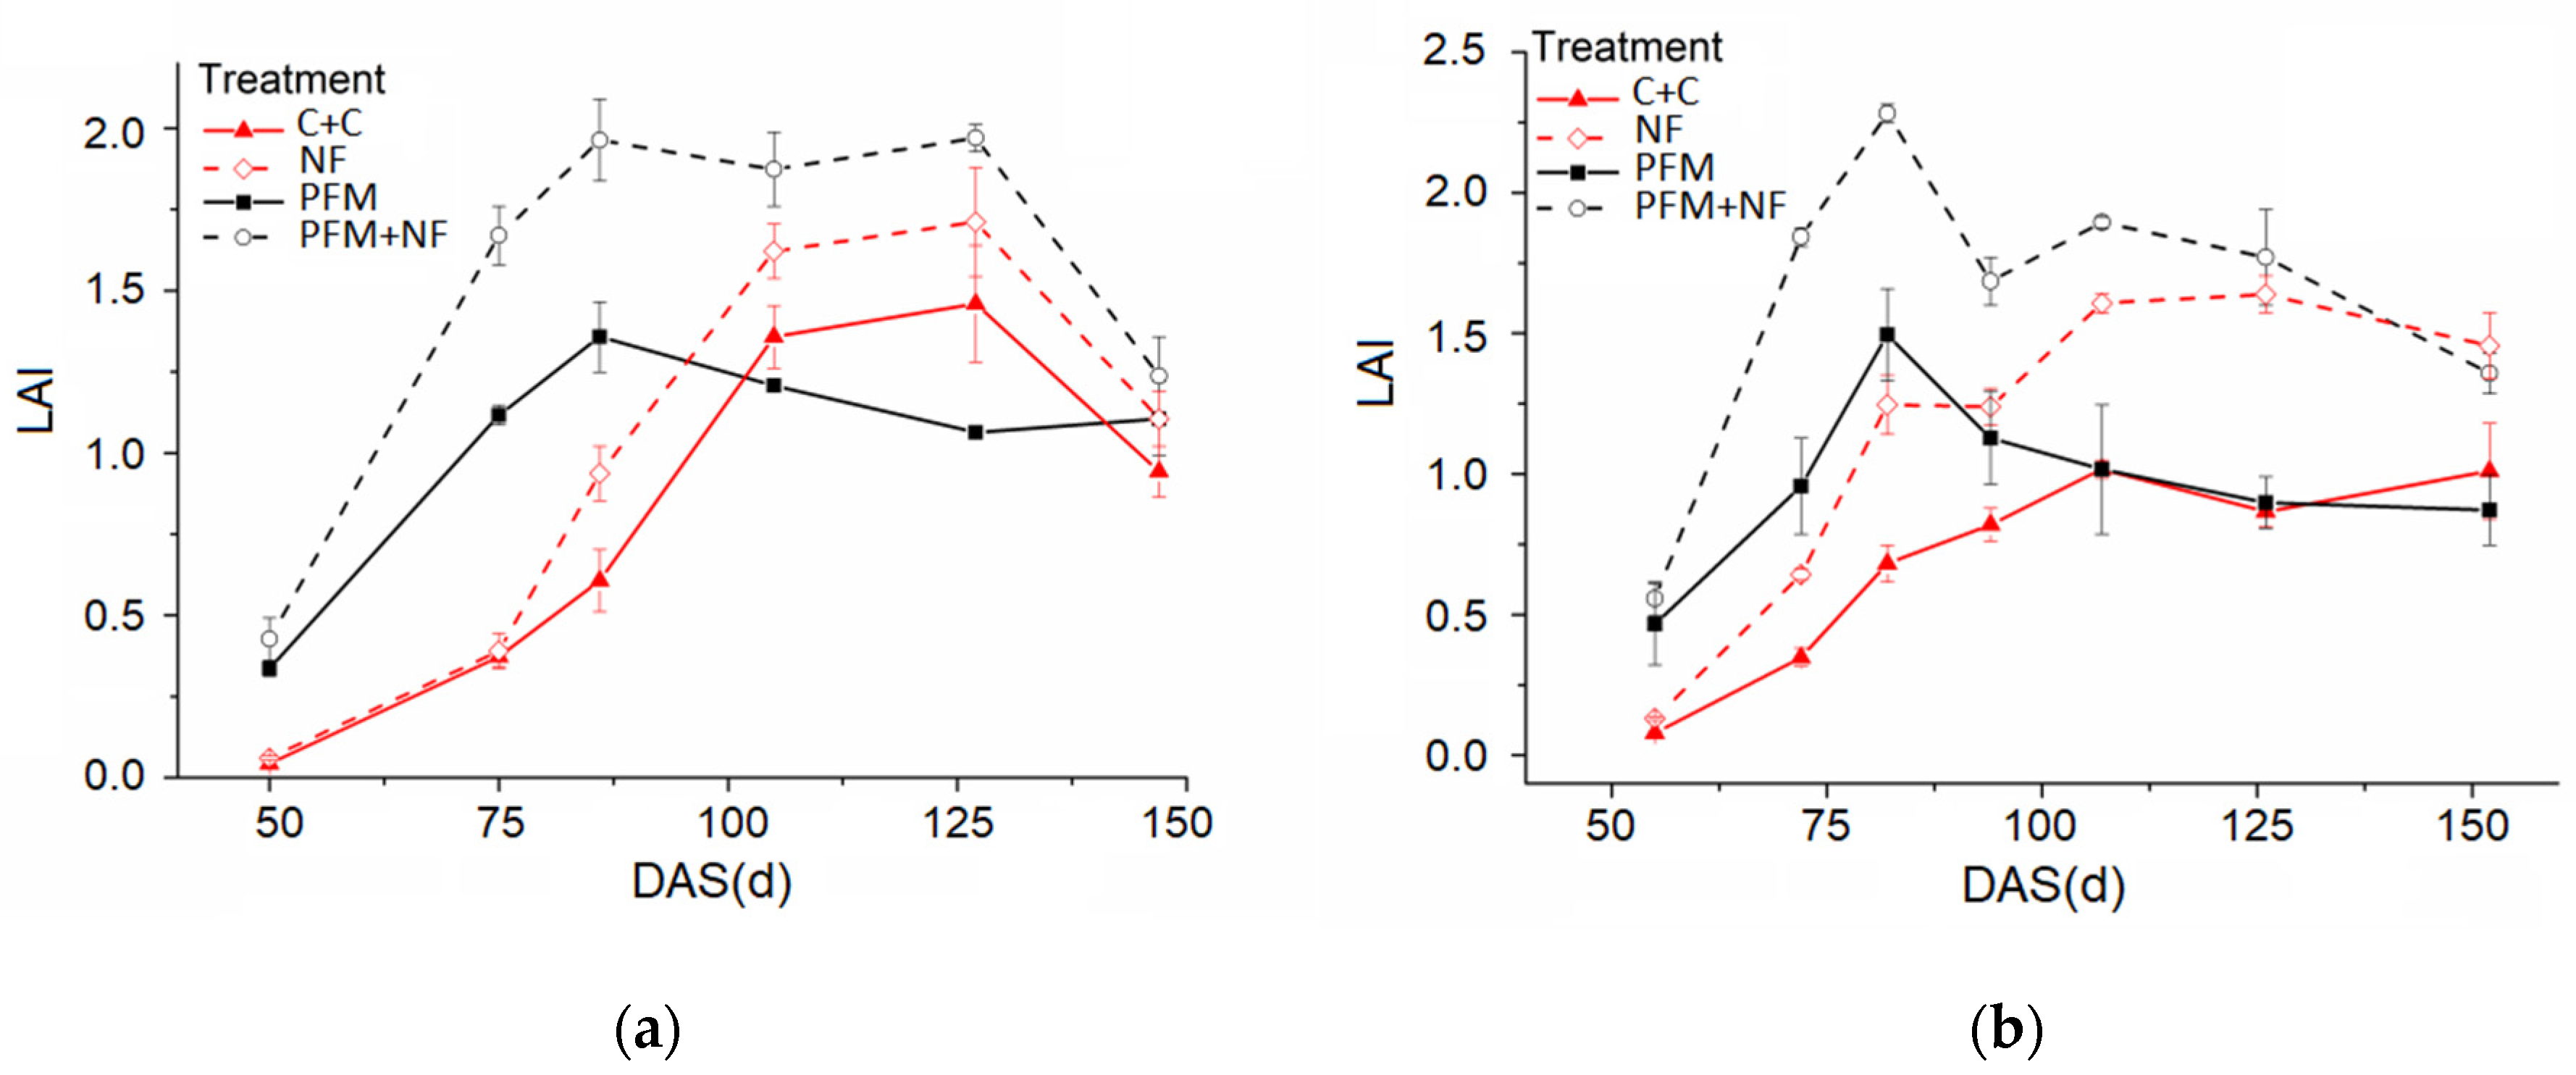
3.2. Growth Period Changes of LAI

The general trend of LAI throughout the growth stage was a rapid increase in the peak and then a slow decline (Figure 3). Early-stage LAI under mulching regimes (PFM/PFM+NF) exhibited superiority over non-mulched controls (C+C/NF) (p < 0.01). Post-V8 phase, PFM’s LAI progressively diminished relative to controls, reaching parity at R5. Notably, PFM+NF induced a 20-day delay in peak LAI attainment for non-mulched cohorts compared to mulched systems.
Under the mulching treatment (PFM and PFM+NF), the LAI gradually reached the peak after about 85 days of planting (VT-R1); the LAI of maize was highest when maize entered the reproductive stage. During canopy senescence, plasticulture systems exhibited gradual LAI diminution, demonstrating persistent benefits of mulch despite physiological aging. Statistical parity (p > 0.05) in LAI between PFM+NF and PFM during vegetative establishment (V1–V6) revealed negligible synergistic interactions between nitrogen supplementation and mulch-mediated leaf expansion. After the V6 stage, the difference in LAI between PFM+NF and PFM became gradually significant, and the LAI of PFM+NF was significantly higher than PFM; both LAIs decreased slowly after reaching the highest point (Tables S1 and S3).
The maize without mulching treatment (C+C and NF) entered the reproductive growth period about 100 days after planting, and the LAI slowly reached the highest point. Before the V6 stage, there was no significant difference in the LAI of NF and C+C treatment. After about 75 days (V6-VT), the LAI of NF was higher than that of C+C. After the milk maturity stage (R3), the LAI without mulching treatment (C+C and NF) decreased slowly and stabilized.

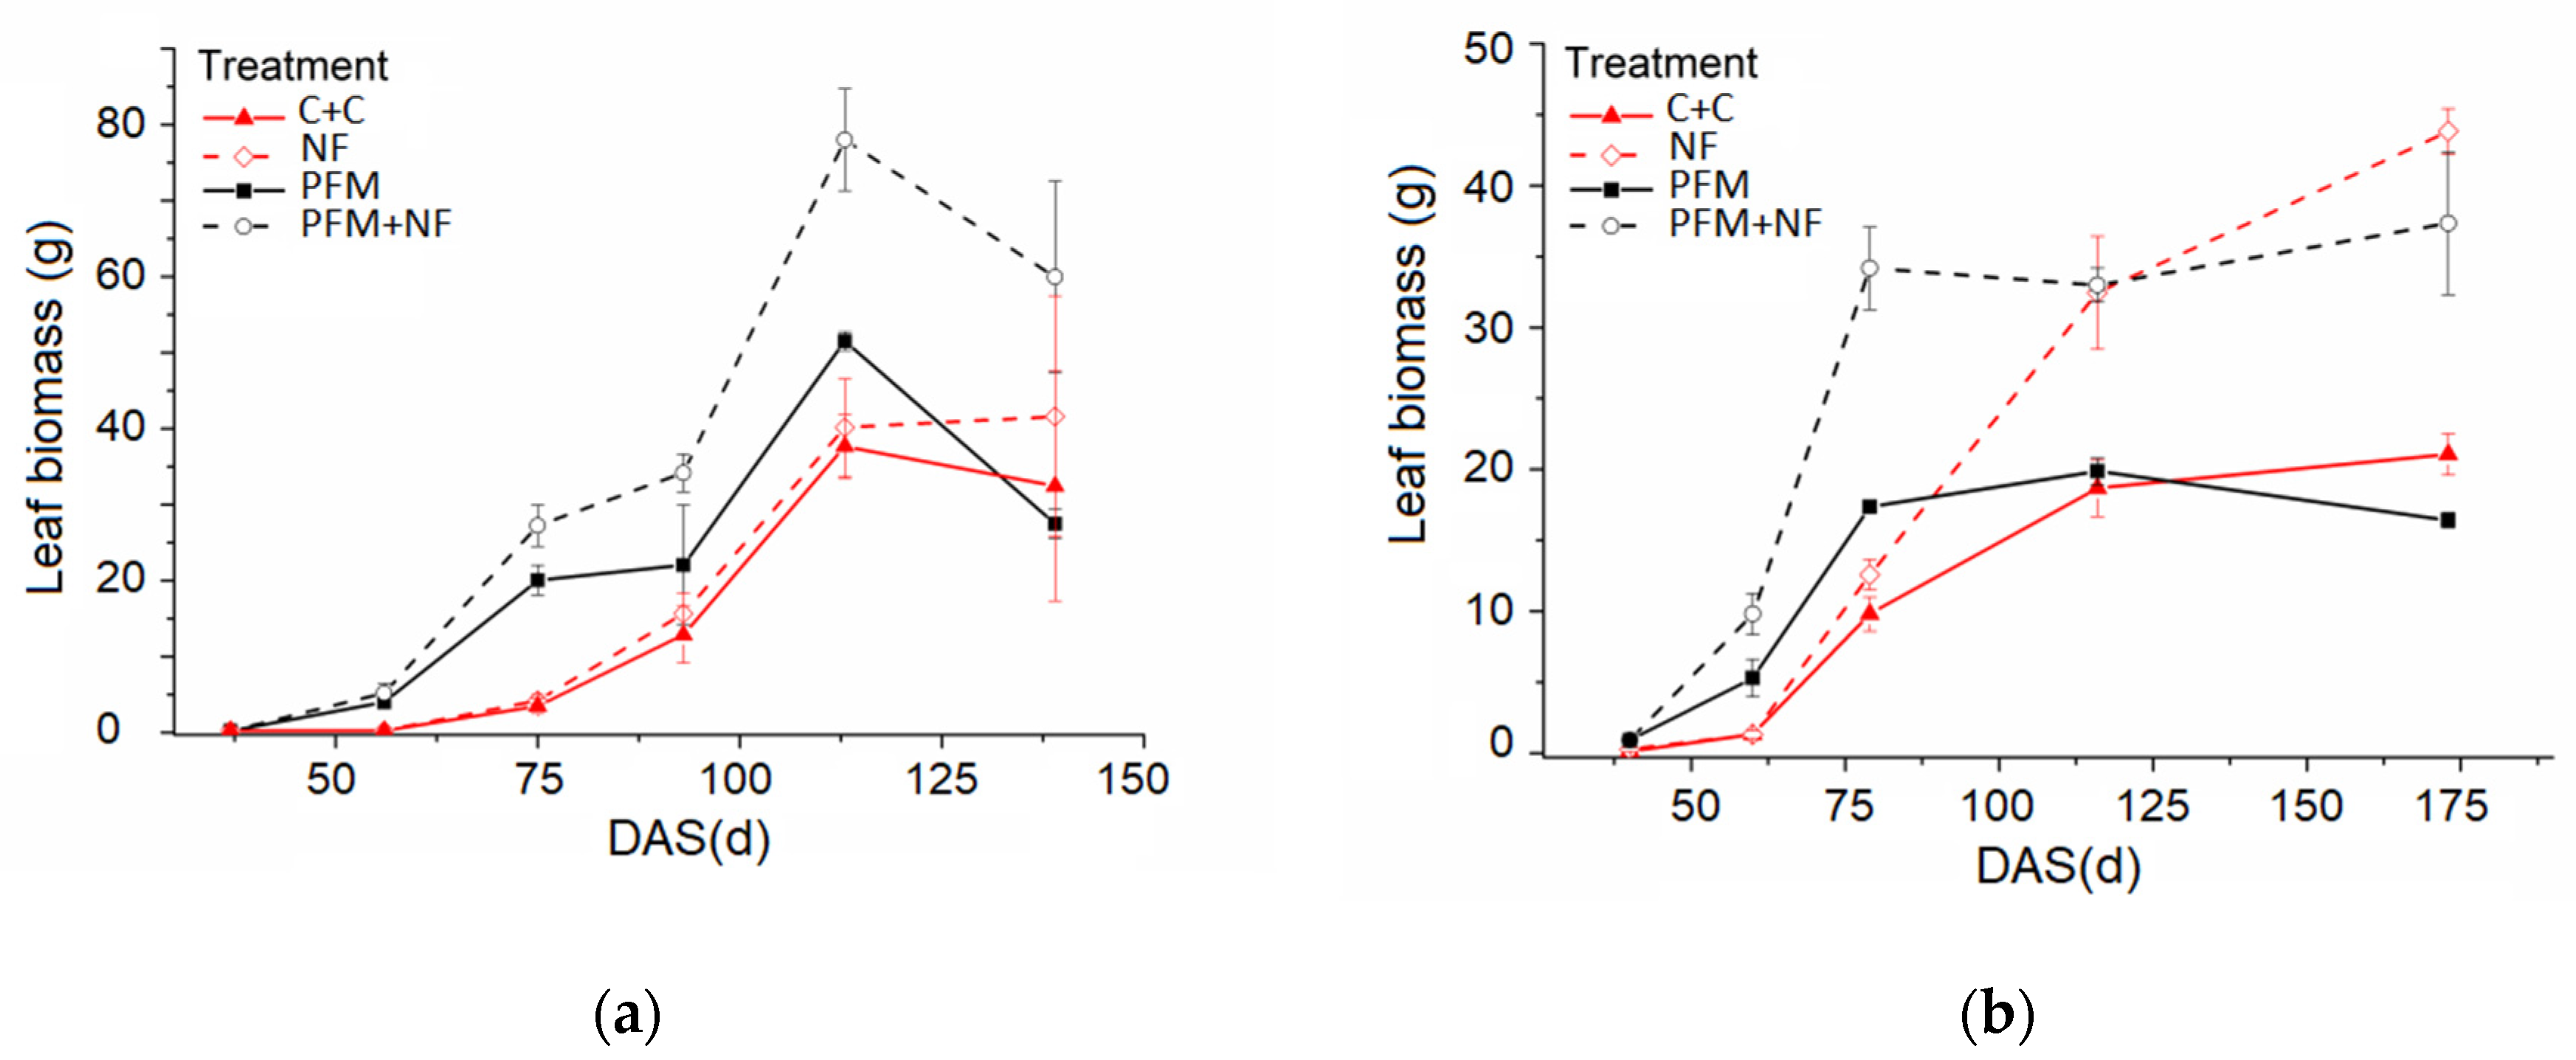
3.3. Growth Period Changes of LB

Leaf biomass (LB) exhibited unimodal dynamics during ontogeny, peaking at the R3 phase (Figure 4). Pre-anthesis plasticulture systems (PFM/PFM+NF) maintained greater LB than non-mulched controls (C+C/NF). Non-mulched cohorts displayed accelerated LB accumulation post-V6, achieving parity with mulched systems by R1. Nitrogen supplementation only enhanced LB in mulched systems (p < 0.05). After entering the reproductive stage, the LB of the PFM was gradually lower than that of the two treatments without film mulching (C+C and NF).

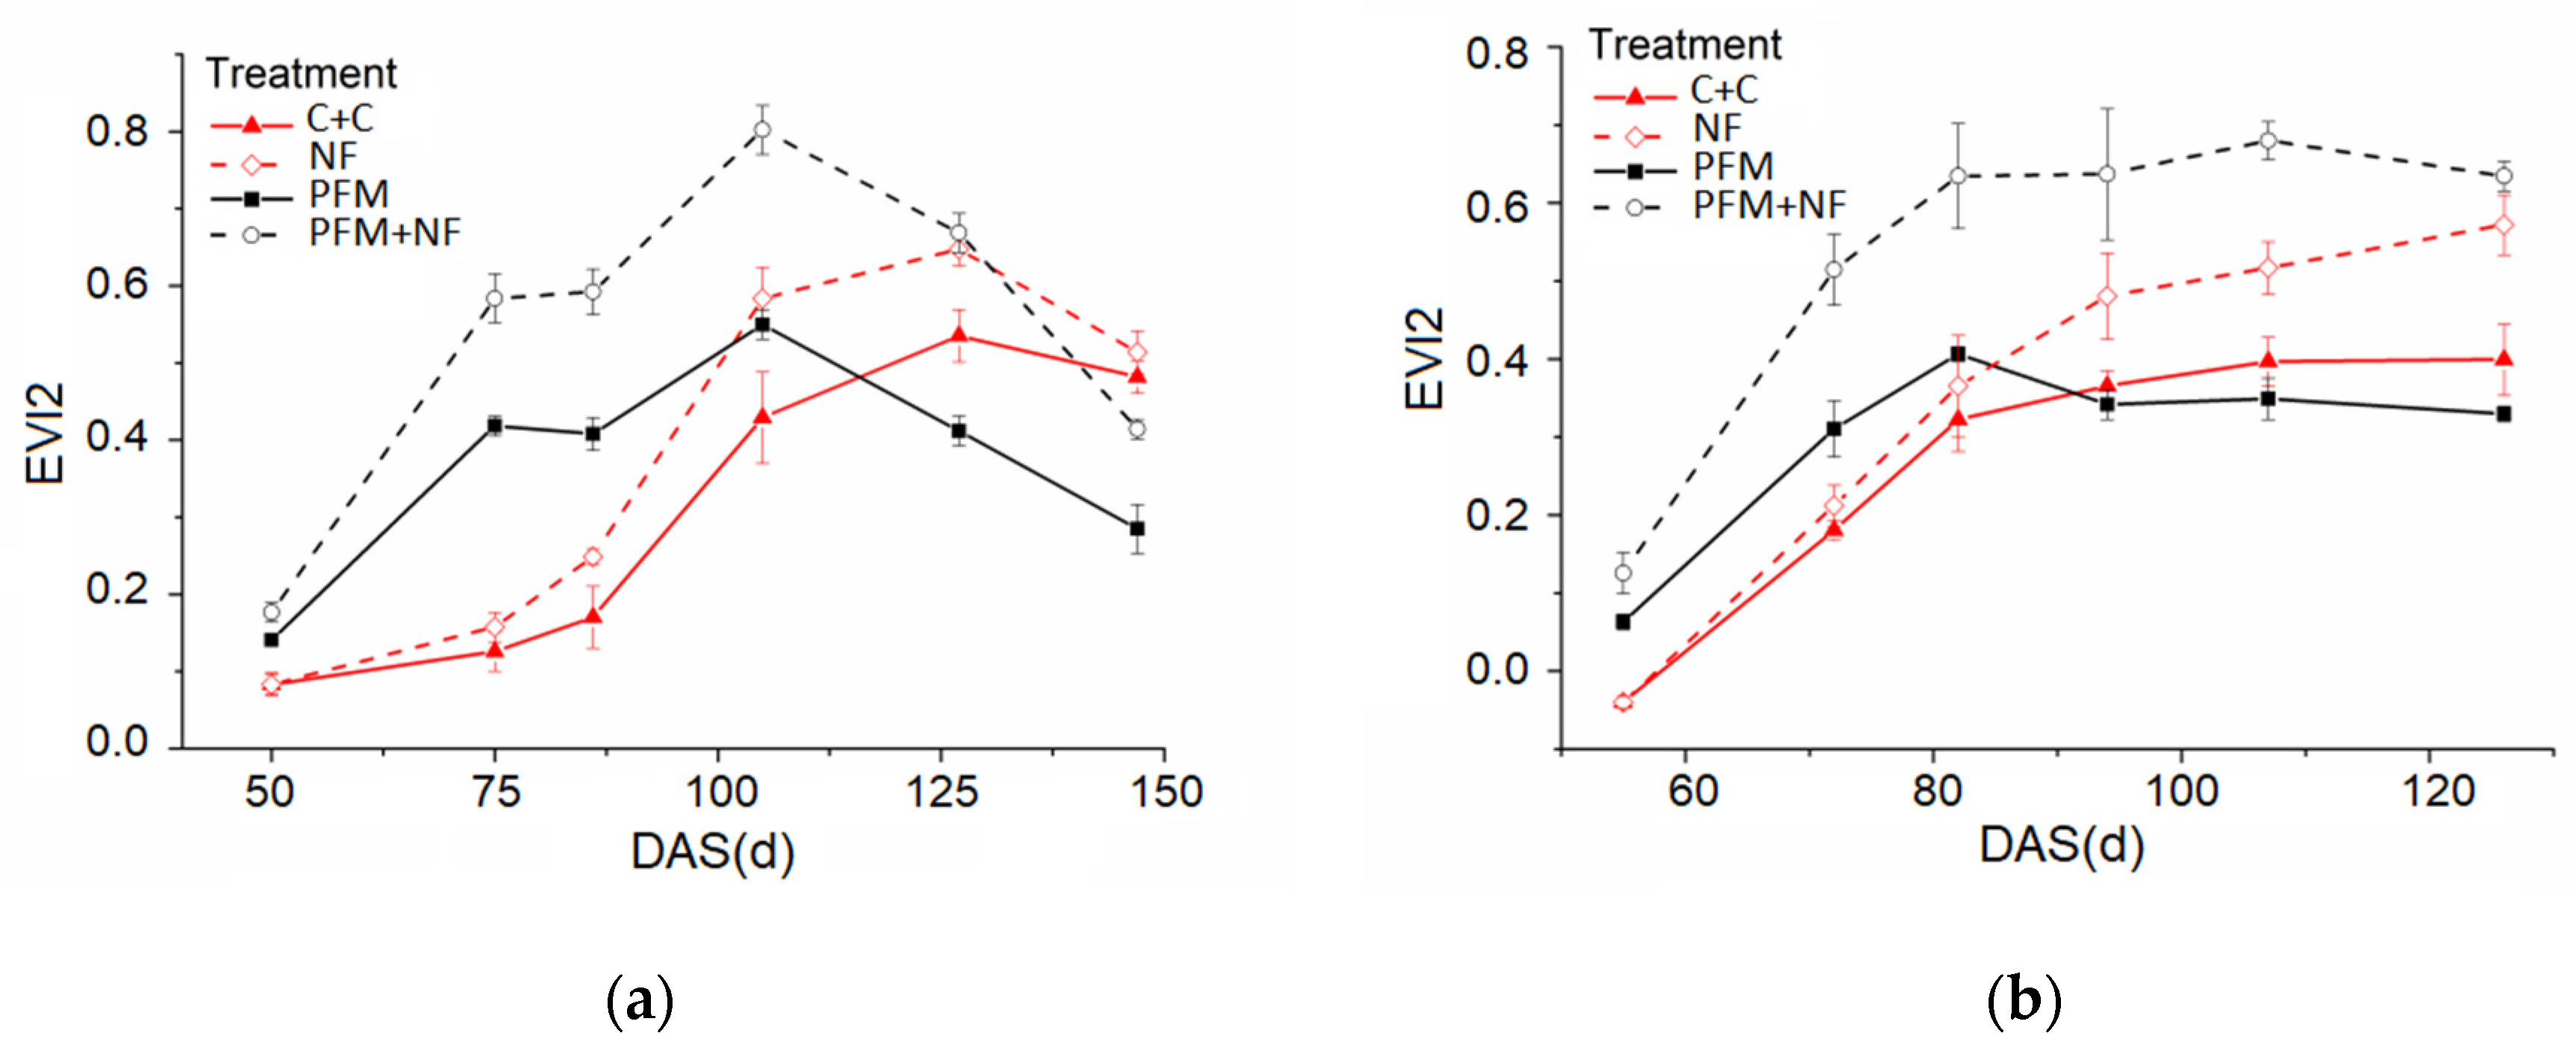
3.4. Time Series Variation of Vegetation Indices (VIs) Obtained by UAV

The vegetation index of the canopy changes correspondingly with the different key growth stages of maize; EVI2 generally shows a trend of rapid rise at first and then a slow decline (Figure 5). The vegetation index of the canopy increases continuously and reaches the highest value before entering the respective reproductive growth period of maize. Mulched systems (PFM/PFM+NF) demonstrated statistically superior phytometric parameters compared to non-mulched controls (C+C/NF) (p < 0.01). Following the V1–V6 vegetative transition (~25 DAP), foliar nitrogen supplementation induced an enhancement in the canopy spectral indices across all treatments, independent of the mulching regimes. After the maize entered the reproductive growth period, the vegetation index decreased at different rates. When PFM entered the reproductive stage, the vegetation index of the canopy showed an obvious faster rate, and was gradually slower compared to the two treatments without film mulching (C+C and NF). The changes in vegetation index in the whole growth stage were consistent with the changes in LAI and LB.

3.5. Vegetation Indices as Indicators of Crop Growth Performance

The analysis revealed notable variations in predictive accuracy among vegetation indices for crop growth parameters. While the Excess Green (EXG) index exhibited weaker correlations with LAI measurements, alternative vegetation indices demonstrated enhanced explanatory power. Specifically, NDVI, green normalized difference vegetation index (GNDVI), and enhanced vegetation index 2 (EVI2) showed particularly strong associations. Furthermore, soil-adjusted indices, including the soil-adjusted vegetation index (SAVI) and modified soil-adjusted vegetation index (MSAVI), displayed superior model performance compared to conventional spectral indices (Table 1). Notably, EVI2 emerged as the most robust predictor across both study years, showing consistent results in the linear regression models with LAI: R2 = 0.85 and RMSE = 0.25 in 2019; R2 = 0.84 and RMSE = 0.23 in 2020; and R2 = 0.85 and RMSE = 0.24 for the combined 2019–2020 dataset (Figure S3), demonstrating its stability and reliability for LAI estimation under varying conditions.
In 2019, by dividing maize biomass into three parts, LB, above-ground biomass (AGB), and total biomass (TB), regressions were established with the vegetation index extracted from multispectral remote sensing images, respectively. The regression model established by the vegetation index and the biomass of each part of maize with better performance was screened (Table 2). Vegetation indices showed stronger correlations with leaf biomass than with TB or AGB. Among the tested indices, GNDVI, the Green ratio vegetation index (GRVI), and EVI2 demonstrated particularly strong relationships with LB, with EVI2 exhibiting the best predictive performance. The regression models between EVI2 and LB yielded the following results: in 2019 R2 = 0.82 and RMSE = 8.84 g; in 2020 R2 = 0.88 and RMSE = 4.34 g; and for the combined 2019–2020 dataset, R2 = 0.78 and RMSE = 8.83 g (Figure 6). These results demonstrate EVI2’s consistent effectiveness in LB estimation across different growing seasons, with particularly outstanding performance in 2020.

3.6. Correlation Analysis of Vegetation Indices (VIs) and Yield

Both mulching and nitrogen (N) fertilization significantly enhanced maize yield in both 2019 and 2020, with a notable interactive effect between the two practices (Figure 7). The 2019 yield analyses revealed that plasticulture systems (PFM/PFM+NF) enhanced maize productivity by 1.37–3.82 compared to bare soil cultivation (C+C/NF) across nitrogen regimes (5.58 vs. 1.16 t/ha with N; 3.36 vs. 1.09 t/ha without N). However, in 2020, the yield advantage shifted: N-fertilized plots (both mulched and non-mulched) outperformed unfertilized plots by 1.42–4.8 (p < 0.05). Additionally, interannual variations were observed: yields under non-fertilized (NF) conditions increased by 2.15 in 2020 compared to 2019, whereas partial-film mulching (PFM) yields decreased by 2.359 during the same period, potentially due to drought stress in 2020 (Figure S1).
The VIs obtained when maize was just entering the reproductive growth period tended to be a better fit for maize yield (Table 3). The vegetation index obtained in the middle growth stage (V8-R2) of the UAV mission has good prediction accuracy for output. Among them, the regression models based on 13 VIs and yields in 2019 performed better than those of 2020 on the whole. Consequently, the vegetation index obtained on 12 July 2019 has the best forecasting effect overall. The year 2020, around 9 August, has the best overall forecast.
The better-performing vegetation index EVI2 combined with yield built a regression model with a higher R2 (0.92) and lower RMSE (0.52 t ha−1) in 2019, and the corresponding R2 and RMSE were 0.94 and 0.44 t ha−1, respectively, in 2020 (Figure 6). Spatial distribution models of maize yield potential, developed through monovariate regression analysis of aerial multispectral data captured during the critical VT-R1 phenological window, demonstrated significant concordance with empirical yield measurements (Figure S4).

4. Discussion

4.1. Vegetation Indices (VIs)

The comparative analysis of 13 vegetation indices identified EVI2, NDVI, and SAVI as optimal predictors for maize growth parameters, demonstrating strong correlations with LAI measurements (R2 = 0.79–0.85, p < 0.01; Table 1). While NDVI remains prevalent in remote sensing applications due to its computational simplicity and diagnostic efficacy [20], its susceptibility to soil reflectance variations and atmospheric interference limits accuracy [21]. In contrast, SAVI incorporates soil adjustment factors specifically designed for arid environments with low vegetation cover (<15%) [22], aligning with the edaphic conditions of our Loess Plateau study area. The superior performance of EVI2 stems from its dual compensation mechanism, addressing both soil background noise and atmospheric distortions, coupled with enhanced sensitivity to canopy density variations. This atmospheric-resistant index outperforms conventional indices in capturing phenological dynamics and high-biomass responses [23], consistent with our experimental findings.

4.2. Remote Sensing-Guided Phenotyping

UAV-acquired vegetation indices demonstrated strong temporal alignment with ground-truth biophysical parameters across phenological stages (2019–2020). Plastic mulch accelerated crop development, advancing reproductive transition by 7–10 days compared to non-mulched systems—consistent with established mulch-induced phenological modifications [24]. Spectral responses showed nonsignificant variation (p > 0.05) between fertilized and non-fertilized plots from the V6 to VT stages, indicating delayed nitrogen response until the reproductive phases.
The tasseling-silking transition (VT-R1) emerged as the critical yield-determination window, marked by intensified nitrogen demand (Figure 5). PFM systems induced progressive chlorophyll degradation, decreasing key vegetation indices (EVI2) by 43–57% at silking (R1) versus PFM+NF (p < 0.01).
Multivariate regression identified VT-R1 spectral features as optimal yield predictors (RMSE: 0.44–0.52 t/ha), enabling sub-10% error yield forecasts 6–8 weeks pre-harvest (Figure 6). Canopy developmental patterns followed characteristic trajectories: LAI/VIs peaked at VT before declining through R2, with mulch-treated canopies exhibiting 22% faster senescence rates (Figure 3 and Figure 5). These patterns confirm that LAI and VIs effectively monitor canopy physiological and structural dynamics [25,26], yet their sensitivity to dry matter accumulation during reproductive growth remains limited, aligning with reported results in soybeans [27,28] and wheat [29]. This study found that the multispectral vegetation index obtained by UAV can reflect the difference between vegetation and soil, with strong correlations to field-measured LAI (2019: R2 = 0.85; 2020: R2 = 0.84) (Table 1). These findings validate Molette et al.’s (2021) framework linking VIs to crop biochemical traits [30].

4.3. Limitations and Future Studies

Although many studies have developed a variety of models to predict crop yield, these empirical models have poor adaptability due to differences in crop varieties and planting areas [31]. It is necessary to accumulate model data for many years for verification to understand the production potential of different crops in different planting areas in different years. This two-year study demonstrated that UAV-based multispectral imagery, when combined with vegetation indices and field measurements, effectively monitored crop growth parameters and predicted yields for dry-fed mulched maize (Figure 7 and Figure S2 and S3). Accumulating more data will enhance the accuracy of vegetation index-based predictions for maize growth and yield, providing a robust dataset for yield forecasting and the development of more complex models. Continuously adding training data to these models will improve prediction stability and expand the application of UAV remote sensing. Long-term experiments are therefore essential to monitor the interplay between mulching, fertilization, and meteorological conditions on maize growth and yield using UAV-derived vegetation indices.
Remote sensing-based methods remain the dominant approach for yield prediction, supplemented by agrometeorological data and process-based models [31]. While our study demonstrates the potential of these methods, several limitations should be noted. The current analysis primarily relies on precipitation data without accounting for other critical climatic factors like humidity and evapotranspiration, which may limit the mechanistic understanding of crop-environment interactions. Recent advances combining UAV-derived vegetation indices with crop models (e.g., the DNDC model [19,32,33]) show promise for improving prediction accuracy. Future research should integrate multi-parameter climate monitoring (including humidity and evapotranspiration measurements) with remote sensing data and process-based modeling to develop a more comprehensive yield prediction framework for maize crops in the Loess Plateau region.

5. Conclusion

This study demonstrates that combining partial-film mulching (PFM) with nitrogen fertilization synergistically enhances maize yield (3.16–4.14 increase), while UAV-derived vegetation indices, particularly EVI2, offer robust tools for growth monitoring and yield prediction. Key findings reveal that EVI2 outperformed traditional indices (NDVI, SAVI) in estimating leaf area index (LAI; R2 = 0.84–0.85) and leaf biomass (LB; R2 = 0.82–0.88) across variable climatic conditions, achieving high yield prediction accuracy (R2 = 0.92–0.94, RMSE < 0.52 t/ha) when measured during the early reproductive stage (V8–R2), a critical window for precision management. While mulching boosted early-season growth, it accelerated senescence under drought, highlighting the need for adaptive mulch management in water-limited regions. Farmers can leverage these insights by (1) adopting PFM with nitrogen fertilization to buffer yield variability, (2) deploying UAV-based EVI2 monitoring between July and August to guide irrigation or fertilization, and (3) utilizing EVI2-driven yield maps for targeted field interventions. These strategies bridge agronomic practices with remote sensing technologies, offering scalable solutions for optimizing maize productivity under climate uncertainty.

Supplementary Materials

The following supporting information can be downloaded at: https://www.mdpi.com/article/10.3390/agronomy15061269/s1, Figure S1: The distribution of meteorological variables during the maize growing season in 2019 and 2020; Figure S2: The correlation between EVI2 and LAI; Figure S3: The correlation between EVI2 and LB; Figure S4: Diagnostic prediction yield maps by EVI2 at the initial reproductive stage in 2019 (a) and 2020 (b) and the actual yield maps in 2019 (c) and 2020 (d). Note: EVI2: enhanced vegetation index 2; Table S1: Growth and development stages in maize; Table S2: UAV-based multispectral image information for the 2019 and 2020 maize growing season; Table S3: Calculation of various vegetation indices. Refs. [22,23,34,35,36,37,38,39,40,41,42,43,44] have been cited in Supplementary Materials.

Author Contributions

Resources, Writing—original draft, Y.W.; Formal analysis, Methodology, M.H.; Writing—original draft, Validation, Z.Z.; Investigation, Writing—original draft, K.Z.; Writing-original draft, Formal analysis, J.H.; Software, Writing—original draft, L.Z.; Project administration, Writing—review & editing, Supervision, F.Z. All authors have read and agreed to the published version of the manuscript.

Funding

This study was supported by the National Natural Science Foundation of China (32071550), Gansu Provincial Key Research and Development Program (22YF7WA012), the Priority Academic Program Development of Jiangsu Higher Education Institutions (PAPD), the ‘111’ Programme (BP0719040).

Data Availability Statement

All the data used in this manuscript are available upon reasonable request.

Acknowledgments

This study was supported by the National Natural Science Foundation of China (32071550), Gansu Provincial Key Research and Development Program (22YF7WA012), the Priority Academic Program Development of Jiangsu Higher Education Institutions (PAPD), the ‘111’ Programme (BP0719040). The authors would like to thank the High Performance Computing Center (HPCC) of Lanzhou University for performing the numerical calculations in this paper on its blade cluster system.

Conflicts of Interest

The authors declare no conflicts of interest.

References

  1. Zhang, F.; Zhang, W.; Qi, J.; Li, F.-M. A regional evaluation of plastic film mulching for improving crop yields on the Loess Plateau of China. Agric. For. Meteorol. 2018, 248, 458–468. [Google Scholar] [CrossRef]
  2. Zhang, K.; Li, Z.; Li, Y.; Wan, P.; Chai, N.; Li, M.; Wei, H.; Kuzyakov, Y.; Filimonenko, E.; Alharbi, S.A.; et al. Contrasting impacts of plastic film mulching and nitrogen fertilization on soil organic matter turnover. Geoderma 2023, 440, 116714. [Google Scholar] [CrossRef]
  3. Piao, S.L.; Ciais, P.; Huang, Y.; Shen, Z.H.; Peng, S.S.; Li, J.S.; Zhou, L.P.; Liu, H.Y.; Ma, Y.C.; Ding, Y.H.; et al. The impacts of climate change on water resources and agriculture in China. Nature 2010, 467, 43–51. [Google Scholar] [CrossRef]
  4. Schirrmann, M.; Giebel, A.; Gleiniger, F.; Pflanz, M.; Lentschke, J.; Dammer, K.-H. Monitoring Agronomic Parameters of Winter Wheat Crops with Low-Cost UAV Imagery. Remote. Sens. 2016, 8, 706. [Google Scholar] [CrossRef]
  5. Raza, A.; Shahid, M.A.; Zaman, M.; Miao, Y.; Huang, Y.; Safdar, M.; Maqbool, S.; Muhammad, N.E. Improving Wheat Yield Prediction with Multi-Source Remote Sensing Data and Machine Learning in Arid Regions. Remote. Sens. 2025, 17, 774. [Google Scholar] [CrossRef]
  6. Baret, F.; Guyot, G. Potentials and Limits of Vegetation Indexes for Lai and Apar Assessment. Remote. Sens. Environ. 1991, 35, 161–173. [Google Scholar] [CrossRef]
  7. Basso, B.; Liu, L. Seasonal crop yield forecast: Methods, applications, and accuracies. Adv. Agron. 2018, 154, 201–255. [Google Scholar]
  8. Ansarifar, J.; Wang, L.; Archontoulis, S.V. An interaction regression model for crop yield prediction. Sci. Rep. 2021, 11, 17754. [Google Scholar] [CrossRef] [PubMed]
  9. Wulder, M.A.; Loveland, T.R.; Roy, D.P.; Crawford, C.J.; Masek, J.G.; Woodcock, C.E.; Allen, R.G.; Anderson, M.C.; Belward, A.S.; Cohen, W.B.; et al. Current status of Landsat program, science, and applications. Remote Sens. Environ. 2019, 225, 127–147. [Google Scholar] [CrossRef]
  10. Jin, Z.; Prasad, R.; Shriver, J.; Zhuang, Q. Crop model- and satellite imagery-based recommendation tool for variable rate N fertilizer application for the US Corn system. Precis. Agric. 2017, 18, 779–800. [Google Scholar] [CrossRef]
  11. Cheng, E.; Zhang, B.; Peng, D.; Zhong, L.; Yu, L.; Liu, Y.; Xiao, C.; Li, C.; Li, X.; Chen, Y.; et al. Wheat yield estimation using remote sensing data based on machine learning approaches. Front. Plant Sci. 2022, 13, 1090970. [Google Scholar] [CrossRef]
  12. Yao, X.; Wang, N.; Liu, Y.; Cheng, T.; Tian, Y.; Chen, Q.; Zhu, Y. Estimation of Wheat LAI at Middle to High Levels Using Unmanned Aerial Vehicle Narrowband Multispectral Imagery. Remote. Sens. 2017, 9, 1304. [Google Scholar] [CrossRef]
  13. Wan, L.; Cen, H.; Zhu, J.; Zhang, J.; Zhu, Y.; Sun, D.; Du, X.; Zhai, L.; Weng, H.; Li, Y.; et al. Grain yield prediction of rice using multi-temporal UAV-based RGB and multispectral images and model transfer—A case study of small farmlands in the South of China. Agric. For. Meteorol. 2020, 291, 108096. [Google Scholar] [CrossRef]
  14. Cheng, Z.; Gu, X.; Du, Y.; Zhou, Z.; Li, W.; Zheng, X.; Cai, W.; Chang, T. Spectral purification improves monitoring accuracy of the comprehensive growth evaluation index for film-mulched winter wheat. J. Integr. Agric. 2023, 23, 1523–1540. [Google Scholar] [CrossRef]
  15. Snyder, K.; Grant, A.; Murray, C.; Wolff, B. The Effects of Plastic Mulch Systems on Soil Temperature and Moisture in Central Ontario. HortTechnology 2015, 25, 162–170. [Google Scholar] [CrossRef]
  16. Al-Shammari, D.; Bishop, T.F.; Wang, C.; Whelan, B.M.; Bramley, R.G. A comparison between machine learning and simple mechanistic-type models for yield prediction in site-specific crop yield predictions. In Proceedings of the 20th Agronomy Australia Conference, Toowoomba, QLD, Australia, 18–22 September 2022. [Google Scholar]
  17. Tsouros, D.C.; Bibi, S.; Sarigiannidis, P.G. A Review on UAV-Based Applications for Precision Agriculture. Information 2019, 10, 349. [Google Scholar] [CrossRef]
  18. Sun, X.-L. Errors induced by spectral measurement positions and instrument noise in soil organic carbon prediction using vis-NIR on intact soil. Geoderma 2021, 382, 114731. [Google Scholar] [CrossRef]
  19. Zhang, F.; Zhang, W.; Li, M.; Yang, Y.; Li, F.M. Does long-term plastic film mulching really decrease sequestration of organic carbon in soil in the Loess Plateau? Eur. J. Agron. 2017, 89, 53–60. [Google Scholar] [CrossRef]
  20. Islam, M.R.; Garcia, S.C.; Henry, D. Use of normalised difference vegetation index, nitrogen concentration, and total nitrogen content of whole maize plant and plant fractions to estimate yield and nutritive value of hybrid forage maize. Crop. Pasture Sci. 2011, 62, 374–382. [Google Scholar] [CrossRef]
  21. Ben-Ze’Ev, E.; Karnieli, A.; Agam, N.; Kaufman, Y.; Holben, B. Assessing vegetation condition in the presence of biomass burning smoke by applying the Aerosol-free Vegetation Index (AFRI) on MODIS images. Int. J. Remote. Sens. 2006, 27, 3203–3221. [Google Scholar] [CrossRef]
  22. Huete, A.R. A Soil-Adjusted Vegetation Index (Savi). Remote Sens. Environ. 1988, 25, 295–309. [Google Scholar] [CrossRef]
  23. Jiang, Z.; Huete, A.R.; Didan, K.; Miura, T. Development of a two-band enhanced vegetation index without a blue band. Remote Sens. Environ. 2008, 112, 3833–3845. [Google Scholar] [CrossRef]
  24. Kong, M.; Jia, Y.; Gu, Y.-J.; Han, C.-L.; Song, X.; Shi, X.-Y.; Siddique, K.H.; Zdruli, P.; Zhang, F.; Li, F.-M. How Film Mulch Increases the Corn Yield by Improving the Soil Moisture and Temperature in the Early Growing Period in a Cool, Semi-Arid Area. Agronomy 2020, 10, 1195. [Google Scholar] [CrossRef]
  25. Gitelson, A.A.; Viña, A.; Ciganda, V.; Rundquist, D.C.; Arkebauer, T.J. Remote estimation of canopy chlorophyll in crops. Geophys. Res. Lett. 2005, 32, L08403. [Google Scholar] [CrossRef]
  26. Shanahan, J.F.; Holland, K.H.; Schepers, J.S.; Francis, D.D.; Schlemmer, M.R.; Caldwell, R.; VanToai, T.; Major, D.; McDonald, M.; Tarpley, L. Use of a Crop Canopy Reflectance Sensor to Assess Corn Leaf Chlorophyll Content. Digit. Imaging Spectr. Tech. Appl. Precis. Agric. Crop Physiol. 2003, 66, 135–150. [Google Scholar]
  27. Da Silva, E.E.; Baio, F.H.R.; Teodoro, L.P.R.; da Silva Junior, C.A.; Borges, R.S.; Teodoro, P.E. UAV-multispectral and vegetation indices in soybean grain yield prediction based on in situ observation. Remote Sens. Appl. Soc. Environ. 2020, 18, 100318. [Google Scholar] [CrossRef]
  28. Maimaitijiang, M.; Sagan, V.; Sidike, P.; Hartling, S.; Esposito, F.; Fritschi, F.B. Soybean yield prediction from UAV using multimodal data fusion and deep learning. Remote. Sens. Environ. 2020, 237, 111599. [Google Scholar] [CrossRef]
  29. Song, X.; Xu, D.; Huang, C.; Zhang, K.; Huang, S.; Guo, D.; Zhang, S.; Yue, K.; Guo, T.; Wang, S.; et al. Monitoring of nitrogen accumulation in wheat plants based on hyperspectral data. Remote. Sens. Appl. Soc. Environ. 2021, 23, 100598. [Google Scholar] [CrossRef]
  30. Molette, C.; Berzaghi, P.; Zotte, A.D.; Remignon, H.; Babile, R. The Use of Near-Infrared Reflectance Spectroscopy in the Prediction of the Chemical Composition of Goose Fatty Liver. Poult. Sci. 2001, 80, 1625–1629. [Google Scholar] [CrossRef]
  31. Joshi, A.; Pradhan, B.; Gite, S.; Chakraborty, S. Remote-Sensing Data and Deep-Learning Techniques in Crop Mapping and Yield Prediction: A Systematic Review. Remote. Sens. 2023, 15, 2014. [Google Scholar] [CrossRef]
  32. Zhang, F.; Zhang, W.; Li, M.; Zhang, Y.; Li, F.; Li, C. Is crop biomass and soil carbon storage sustainable with long-term application of full plastic film mulching under future climate change? Agric. Syst. 2017, 150, 67–77. [Google Scholar] [CrossRef]
  33. Zhang, F.; Eldoma, I.M.; Li, M.; Kong, M.; Siddique, K.H.; Li, F.-M. Integrated model and field experiment to determine the optimum planting density in plastic film mulched rainfed agriculture. Agric. For. Meteorol. 2019, 268, 331–340. [Google Scholar] [CrossRef]
  34. Carlson, T.N.; Ripley, D.A. On the relation between NDVI, fractional vegetation cover, and leaf area index. Remote Sens. Environ. 1997, 62, 241–252. [Google Scholar] [CrossRef]
  35. Li, G.; Zhang, H.; Wu, X.; Shi, C.; Huang, X.; Qin, P. Canopy reflectance in two castor bean varieties (Ricinus communis L.) for growth assessment and yield prediction on coastal saline land of Yancheng District, China. Ind. Crop. Prod. 2011, 33, 395–402. [Google Scholar] [CrossRef]
  36. Priebe, S.; Huxley, P.; Knight, S.; Evans, S. Application and results of the Manchester Short Assessment of Quality of Life (MANSA). Int. J. Soc. Psychiatry 1999, 45, 7–12. [Google Scholar] [CrossRef]
  37. Chen, L.; Huang, J.F.; Wang, X.Z. Estimation accuracy and sensitivity of rice leaf area index by simulated vegetation index of different sensors. J. Remote Sens. 2008, 12, 143–151. [Google Scholar]
  38. Woebbecke, D.M.; Meyer, G.E.; Von Bargen, K.; Mortensen, D.A. Color Indexes for Weed Identification under Various Soil, Residue, and Lighting Conditions. Trans. Asae 1995, 38, 259–269. [Google Scholar] [CrossRef]
  39. Qi, J.; Chehbouni, A.; Huete, A.R.; Kerr, Y.H.; Sorooshian, S. A Modified Soil Adjusted Vegetation Index. Remote Sens. Environ. 1994, 48, 119–126. [Google Scholar] [CrossRef]
  40. Bolton, D.K.; Friedl, M.A. Forecasting crop yield using remotely sensed vegetation indices and crop phenology metrics. Agric. For. Meteorol. 2013, 173, 74–84. [Google Scholar] [CrossRef]
  41. Demetriadesshah, T.H.; Steven, M.D.; Clark, J.A. High-Resolution Derivative Spectra in Remote-Sensing. Remote Sens. Environ. 1990, 33, 55–64. [Google Scholar] [CrossRef]
  42. Wu, W.C. The Generalized Difference Vegetation Index (GDVI) for Dryland Characterization. Remote Sens. 2014, 6, 1211–1233. [Google Scholar] [CrossRef]
  43. Karcher, D.E.; Richardson, M.D. Quantifying turfgrass color using digital image analysis. Crop Sci. 2003, 43, 943–951. [Google Scholar] [CrossRef]
  44. Chen, P.F.; Wang, J.L.; Liao, X.Y.; Yin, F.; Chen, B.R.; Liu, R. Research on aboveground biomass inversion of Hulunbuir grassland based on environmental disaster reduction satellite remote sensing data. J. Nat. Resour. 2010, 25, 1122–1131. [Google Scholar]
Figure 1. Study area location and experimental design. (a) Experimental area location. (b) Experimental design. Note: B+C: Bare-Control, bare ground without mulching; B+PFM: bare ground with mulching; C+C: Crop-Control, no plastic film mulching without nitrogen fertilization; PFM: plastic film mulching without nitrogen fertilization; NP: no plastic film mulching with nitrogen fertilization; PFM+NP: plastic film mulching with nitrogen fertilization.
Agronomy 15 01269 g001
Figure 2. Structural diagram of ridge–furrow systems with and without full plastic film mulching for rainwater harvesting and soil moisture conservation in semi-arid maize fields, illustrating ridge dimensions (height: 15 cm, width: 55 cm) and biodegradable film coverage.
Agronomy 15 01269 g002
Figure 3. Seasonal variations of maize LAI in 2019 (a) and 2020 (b). Note: DAS: days after sowing; LAI: leaf area index; C+C: Crop-Control, no plastic film mulching without nitrogen fertilization; PFM: plastic film mulching without nitrogen fertilization; NP: no plastic film mulching with nitrogen fertilization; PFM+NP: plastic film mulching with nitrogen fertilization.
Agronomy 15 01269 g003
Figure 4. Seasonal variations of maize LB in 2019 (a) and 2020 (b). Note: DAS: days after sowing; LB: leaf biomass; C+C: Crop-Control, no plastic film mulching without nitrogen fertilization; PFM: plastic film mulching without nitrogen fertilization; NP: no plastic film mulching with nitrogen fertilization; PFM+NP: plastic film mulching with nitrogen fertilization.
Agronomy 15 01269 g004
Figure 5. Seasonal variations of EVI2 in 2019 (a) and 2020 (b). Note: DAS: days after sowing; EVI2: enhanced vegetation index 2; C+C: Crop-Control, no plastic film mulching without nitrogen fertilization; PFM: plastic film mulching without nitrogen fertilization; NP: no plastic film mulching with nitrogen fertilization; PFM+NP: plastic film mulching with nitrogen fertilization.
Agronomy 15 01269 g005
Figure 6. Comparison between observed and simulated yields across 2019 and 2020 growing seasons.
Agronomy 15 01269 g006
Figure 7. The yield under four treatments in 2019 (a) and 2020 (b). Note: C+C: Crop-Control, no plastic film mulching without nitrogen fertilization; PFM: plastic film mulching without nitrogen fertilization; NP: no plastic film mulching with nitrogen fertilization; PFM+NP: plastic film mulching with nitrogen fertilization ANOVA was carried out, and different letters indicated significant differences according to LSD0.05.
Agronomy 15 01269 g007
Table 1. Linear regression relationships between leaf area index (LAI) and vegetation indices (VIs) for maize crops in the Loess Plateau region during 2019 and 2020 growing seasons, including regression equations, coefficients of determination (R2), and root mean square error (RMSE).
VIs20192020
EquationR2RMSEEquationR2RMSE
NDVIy = −2.42 + 6.16x0.790.27y = 0.09 + 5.19x0.690.35
GNDVIy = 0.20 + 5.53x0.730.31y = −1.53 + 5.98x0.700.34
EXGy = −0.28 + 11.17x0.530.41y = −0.48 + 2.82x0.180.56
SAVIy = 0.09 + 3.46x0.790.27y = −1.87 + 3.64x0.660.36
MSAVIy = 0.17 + 3.74x0.720.31y = −2.48 + 5.56x0.780.29
RVIy = −1 + 0.52x0.620.36y = −1.02 + 0.38x0.530.43
GRVIy = −0.24 + 1.09x0.710.32y = −0.55 + 0.54x0.520.43
EVIy = 0.28 + 1.29x0.690.33y = 0.18 + 1.44x0.660.36
EVI2y = 0.048 + 2.65x0.850.25y = 0.089 + 2.63x0.840.23
DVIy = −0.72 + 7.72x0.680.33y = −2.53 + 10.04x0.730.32
GDVIy = −8.53 + 13.69x0.740.31y = −3.51 + 12.830.570.41
MTVI2y = 0.17 + 2.6x0.710.32y = 0.1 + 2.92x0.740.31
DGCIy = −0.25 + 15.09x0.730.31y = −0.15 + 14.18x0.580.41
Table 2. Linear regression relationships between biomass and vegetation indices (VIs) for maize crops in the Loess Plateau region during 2019 growing seasons, including regression equations, coefficients of determination (R2), and root mean square error (RMSE).
yxExpressionR2RMSE (g)p-Value
LBEVI2y = −7.43 + 89.6x0.828.84***
AGBEVI2y = −22.67 + 260.93x0.6639.58***
TBEVI2y = −26.17 + 294.23x0.6645.44***
LBNDVIy = −8.74 +189.41x0.7012.02***
AGBNDVIy = −25.28 + 557.7x0.4954.27***
TBNDVIy = −29.56 + 628.32x0.5060.92***
LBGNDVIy = −12.38 + 246.91x0.7211.03***
AGBGNDVIy = −40.44 + 758.39x0.5052.90***
TBGNDVIy = −44.25 + 840.80x0.5160.66***
LBGRVIy = −42.67 + 22.26x0.7810.01***
AGBGRVIy = −131.60 + 67.62x0.6048.42***
TBGRVIy = −145.12 + 75x0.6054.77***
LBSAVIy = −9.10 + 128.02x0.7011.92***
AGBSAVIy = −26.42 + 377.39x0.5053.99***
TBSAVIy = −30.82 + 425.03x0.5160.51***
LBMSAVIy = −11.93 + 158.74x0.6113.61***
AGBMSAVIy = −36.46 + 474.86x0.4456.69***
TBMSAVIy = −42.05 + 529.92x0.4563.91***
LBMTVI2y = −1.37 + 88.98x0.5614.34***
AGBMTVI2y = −3.77 + 262.58x0.4058.86***
TBMTVI2y = −6.37 + 295.25x0.4166.19***
Note: LB: leaf biomass; AGB: above-ground biomass; TB: total biomass; *** p < 0.001.
Table 3. Maize yield estimation accuracy (coefficients of determination, R2) using UAV-derived multispectral vegetation indices (VIs) across key growth stages during the 2019 and 2020 growing seasons.
Year201920192019201920192019202020202020202020202020
Date6/177/127/238/119/29/226/187/57/157/278/98/28
VIs
EVI20.830.920.910.680.0020.060.430.670.690.780.940.71
EVI0.510.300.590.280.410.020.050.320.530.470.410.59
NDVI0.790.860.790.570.290.110.410.660.670.820.920.70
GNDVI0.530.930.860.620.050.080.560.830.710.740.760.66
SAVI0.780.870.870.590.210.090.410.660.670.820.920.70
MSAVI0.760.880.950.630.080.090.370.520.620.780.880.68
MTVI20.790.820.680.440.110.250.280.450.450.480.850.69
RVI0.680.850.340.490.170.100.510.710.220.110.710.54
GRVI0.030.900.410.640.060.070.540.810.830.750.750.69
DVI0.790.880.790.540.370.070.360.570.550.830.740.60
GDVI0.090.930.910.590.410.080.260.270.150.060.480.04
EGI0.750.110.070.020.210.040.410.550.620.660.740.62
DGCI0.800.760.910.660.480.010.250.710.810.950.870.86
Disclaimer/Publisher’s Note: The statements, opinions and data contained in all publications are solely those of the individual author(s) and contributor(s) and not of MDPI and/or the editor(s). MDPI and/or the editor(s) disclaim responsibility for any injury to people or property resulting from any ideas, methods, instructions or products referred to in the content.

