Article

Testing of Saline–Alkali Tolerance in Oat Germplasm Through Integrated Germination and Field Performance Assessments

1
National Agricultural Scientific Research Outstanding Talents and Their Innovation Team, Inner Mongolia Grassland Talents Innovation Team, Coarse Cereals Industry Collaborative Innovation Center, Inner Mongolia Agricultural University, Hohhot 010019, China
2
Inner Mongolia Agricultural University Science and Technology Park Management Office, Hohhot 010018, China
*
Author to whom correspondence should be addressed.
Agronomy 2025, 15(6), 1267; https://doi.org/10.3390/agronomy15061267
Submission received: 12 April 2025 / Revised: 16 May 2025 / Accepted: 20 May 2025 / Published: 22 May 2025
(This article belongs to the Section Crop Breeding and Genetics)

Abstract

:
Oats are an important grain-feeding crop with strong saline–alkali tolerance; however, the genetic mechanism of this tolerance is not clear, which hinders the development of oat varieties adapted to saline soils. In this study, the saline–alkali tolerance of 524 oat germplasm resources was comprehensively evaluated using culture-dish germination and field identification methods. During the germination period, saline–alkali stress significantly inhibited the germination potential, germination rate, and shoot and root lengths of oat germplasm. The indicators decreased by 71.15%, 49.32%, 59.03%, and 63.90%, respectively. The relative value of each trait was used as the evaluation metric. The 524 oat germplasm resources were classified into five groups by cluster analysis, and 174 oat germplasm resources with saline-alkali tolerance at the germination stage were screened. A regression equation for the identification of germinated saline-alkali-tolerant oat germplasm resources under the same conditions was also established. The field experiment showed that the coefficients of variation of oat germplasm resources were 4.03–54.12% and 6.97–38.50% in the two locations, which was rich in genetic variation; the correlation analysis showed that the biological yield was positively correlated with the D-value, and 18 high–quality and high-yielding saline–alkali-tolerant oat germplasm resources were identified by combining the saline–alkali-tolerant and weak germplasm resources of the two locations. Based on the multidimensional evaluation of germination and field performance, the 18 saline–alkali–tolerant germplasms screened in this study provide high–quality germplasm resources and a theoretical basis for saline oat cultivation and saline-tolerant breeding.

1. Introduction

Soil salinization is one of the key factors limiting agricultural development and poses a severe threat to global food security and environmental sustainability [1]. The total area of saline–alkali land worldwide is approximately 955 million hectares, and every year, approximately 1.5 million hectares of land are unsuitable for agricultural production owing to excessive salt content. It is estimated that by 2050, 50% of the global agricultural land will be affected by salinization [2]. The reclamation of saline–alkali land faces challenges such as long cycles and low efficiency [3,4]. Developing and utilizing saline-tolerant crop germplasm resources has become an effective approach to achieve efficient use of saline-alkali land [5,6]. Oat (Avena sativa L.) is classified as a pioneer crop for saline and alkaline land improvement due to its salinity and barrenness tolerance [7]. The selection and identification of high-quality, high-yield, saline–alkali-resistant oat germplasm resources can provide valuable insights for enhancing their resistance, improving yields in alkaline soils, and improving the ecological environment of saline–alkali land. However, owing to the differences in variety and ecological environments, effective screening and comprehensive evaluation of germplasms are prerequisites for the introduction of new varieties [8,9].
Currently, studies evaluating oat saline–alkali tolerance have mostly concentrated on the germination or seedling stages under indoor conditions with salt [10], alkali [11], or saline-alkali stress [12,13], lacking data on the full life span of plants. In addition, the small sample sizes used in previous studies limit the generalizability of results for the identification of saline–alkali tolerance under natural salinization conditions [14]. Furthermore, oat varieties with strong germination ability under salt–alkali stress conditions may not necessarily have a high seed–setting rate. Yield is a key factor in evaluating the strength of a crop’s resistance to saline-alkali conditions [15,16]. Therefore, the correlation between germination rate and yield is unclear and insufficient to guide breeding.
In evaluating the resistance of germplasm resources of barley [17], asparagus [18], and celery [19], evaluation methods such as correlation analysis, principal component analysis, integrated coefficient analysis of salinity tolerance, and cluster analysis have shown advantages. These methods are more suitable for large sample size germplasm identification [20]. However, they are less systematically applied in the field of oat germplasm resource identification. Therefore, based on the existing limitations in this field, this study combined the multidimensional evaluation of germination response and field traits to conduct a comprehensive evaluation of salinity tolerance with 524 oat germplasm resources. The characterized saline–alkali-tolerant oat germplasm resources can provide candidate materials for oat cultivation in saline conditions and the selection of salinity-tolerant oat varieties.

2. Materials and Methods

2.1. Experimental Materials

A total of 524 oat accessions, from both China and abroad (Table S1), were provided by the Baicheng Agricultural Academy of Jilin Province, the Chinese Academy of Agricultural Sciences, and the Agricultural Academy of Zhangjiakou City, Hebei Province.

2.2. Experimental Design

2.2.1. Seed Germination and Saline–Alkali Tolerance Screening

The experiment focused on 524 oat accessions and was conducted at the Hydroponics Laboratory of the Oat Industry Research Center, Inner Mongolia Agricultural University. The experiment was a completely randomized design. Mature, full, and uniform seeds were selected for each germplasm. The seeds were surface-sterilized with 2% NaClO for 10 min and rinsed three times with distilled water. They were then evenly placed in Petri dishes lined with two layers of filter paper, with 50 seeds per dish. One group of dishes received 5 mL of a saline–alkali solution (75 mmol/L, with a molar ratio of NaCl:Na2SO4:NaHCO3:Na2CO3 of 1:9:9:1), while the other group was the control (CK), receiving 5 mL of distilled water. The positions of the Petri dishes were randomly assigned, with the treatment and control groups arranged in a complete crossover. The positions were rotated daily to eliminate marginal effects. The experiment was repeated thrice. The temperature was maintained at 20 ± 5 °C, 12 h light/12 h dark, and 70% relative humidity and water was replenished daily at 18:00. Starting from the first day after sowing, the number of germinated seeds was recorded (germination was considered when the seedling root length reached half the seed length). Germination potential was calculated on the 4th day, germination rate on the 7th day, and shoot and root lengths on the 7th day.

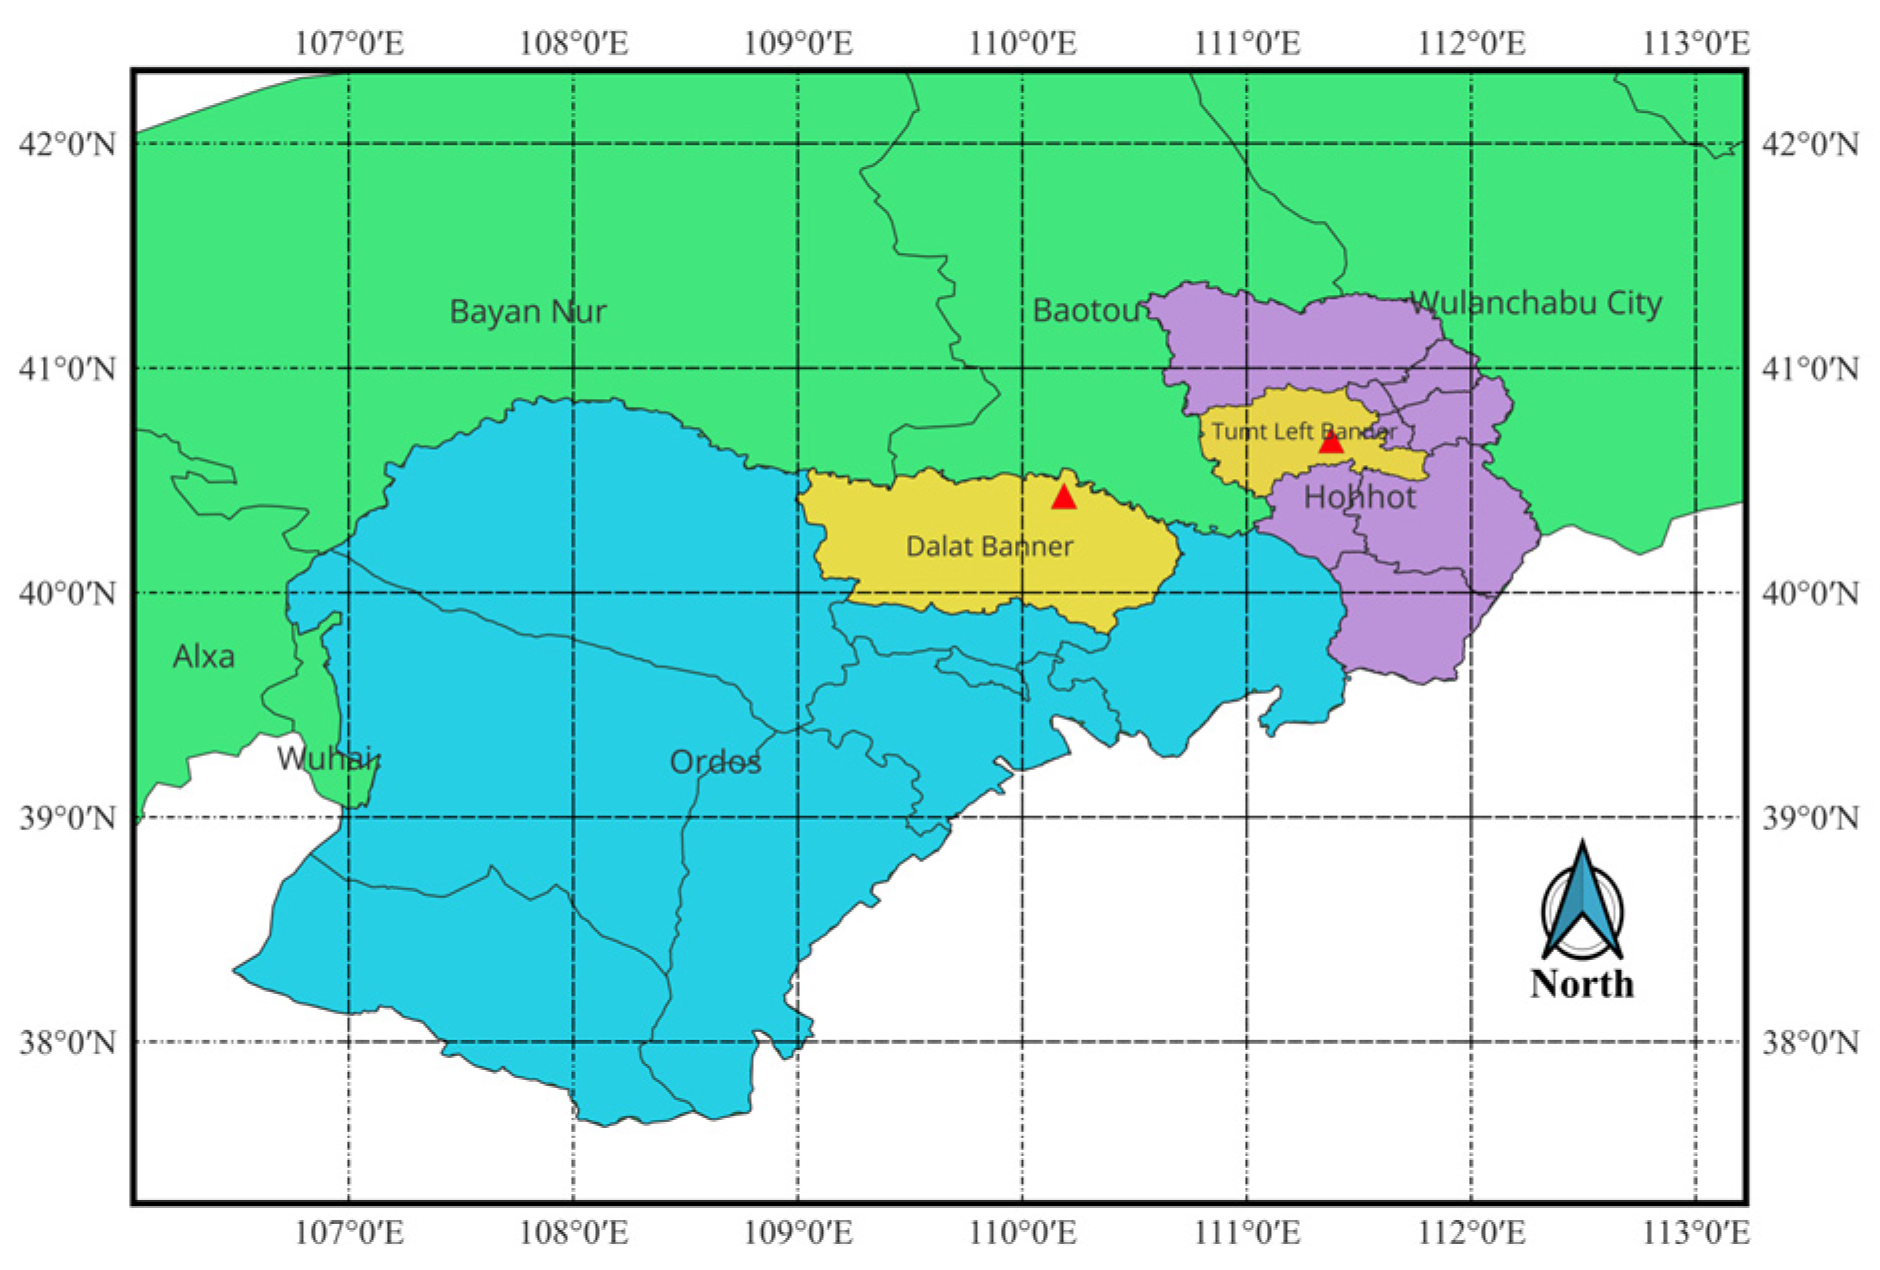
2.2.2. Field Identification

This study was carried out between 2021 and 2022 in saline–alkali soils located in Tumt Left Banner (40°40′47.2″ N, 111°22′37.6″ E) and Dalat Banner (40°25′52.5″ N, 110°11′10.3″ E) in Inner Mongolia (Figure 1). A total of 174 saline–alkali-tolerant oat accessions were selected during the germination stage and used as the experimental materials. The experiment followed a randomized block design with a single factor and a plot area of 2 m2. The row spacing was 25 cm, and the sowing rate was 0.015 kg/m2, with three replications. Artificial trench sowing was used, and other field management measures were consistent with local practices. The number of seedlings was counted during the seedling stage; at maturity, the whole plot was harvested to measure the quality, yield, and yield-related factors. The basic soil characteristics of the experimental sites are presented in Table 1. To minimize environmental interference in the field experiment, the results were analyzed using the average of two years of experimental data. In Dalat Banner, 15 germplasms were excluded from the analysis because of poor seedling emergence and adaptability; therefore, the final analysis was based on 159 accessions from that site.

2.3. Variables Evaluated

2.3.1. Indicators of Germination Period Measurement

(a)
Germination potential (%) = (Number of seeds germinated on day 4/Number of seeds tested for germination) × 100% [13].
(b)
Germination rate (%) = (Number of seeds germinated on day 7/Number of seeds tested for germination) × 100% [21].
(c)
Bud length refers to the distance from the root–bud junction to the top, with the top referring to the top of the main stem [11].
(d)
Root length refers to the distance from the root–bud junction to the bottom, where the bottom refers to the bottom of the main root [11].

2.3.2. Determination of Field Identification Indicators

(a)
When oats reached the standard for emergence, the field emergence count was obtained, and the emergence rate was calculated as follows:
Emergence rate (%) = (Number of emerged seedlings/Number of seeds sown) × 100%
(b)
Measurement of yield, yield components, and quality: After the oats matured, they were harvested and air–dried. Ten plants were selected from each plot for each germplasm resource. The following traits were measured: plant height, panicle length, number of spikelets, number of grains per panicle, and individual grain weight. Manual threshing was used, and seed and biological yields were measured on a per-plot basis. Ten grams of seed samples were weighed from each germplasm, dried, and ground before being passed through a 1 mm sieve. The samples were then sealed in self–sealing bags for storage and used for grain quality determination. Crude protein and crude fat were measured using the Kjeldahl and Soxhlet extraction methods, respectively. β-glucan was measured using a reagent kit from Shanghai Keshun Biotechnology Co., Ltd. (Shanghai, China).

2.4. Data Processing and Analysis

Excel 2019 and SPSS 22.0 software were used for data organization and analysis of differences. Origin 2022 software was used for plotting, correlation analysis, principal component analysis, cluster analysis, and multiple linear regression analysis.
To compare the saline-alkali tolerance of oat accessions, methods such as correlation analysis, principal component analysis, membership function, and cluster analysis were used to comprehensively evaluate and identify the indoor germination traits, field yield, and quality traits of the oat accessions. The final evaluation resulted in the identification of high–quality, high–yield, saline–alkali-tolerant oat accessions. The specific calculation formulae are as follows [10,22]:
Relative index value (saline–alkali tolerance coefficient) = (measured value of the treatment group/measured value of the control group) × 100%.
Membership Function Values:
U(Xj) = (Xj − Xj min)/(Xj max − Xj min)     j = 1, 2, 3……n
where Xj represents the relative value of a specific trait in an accession, Xj min represents the maximum value of this trait within the accession population, and Xj max represents the minimum value of this trait within the accession population.
Weight and comprehensive evaluation of saline–alkali tolerance (D value):
W j = P j j = 1 n P j j = 1 , 2 , 3 n
Wj is the weight of the j-th trait, and Pj is how much the j-th composite trait varies.
D = j ˙ = 1 n U X j × W j j = 1 , 2 , 3 n
A comprehensive evaluation of the D value of various accessions was performed to assess the saline–alkali tolerance of oat accessions.

3. Results

3.1. Analysis of Trait Differences and Relative Values During the Germination Phase of Germplasm Resources

The germination of 524 oat germplasm resources was significantly inhibited by saline–alkali stress treatment (Figure 2). The control group (CK) had average germination potentials and germination rates of 0.52 and 0.65, with coefficients of variation of 0.47 and 0.41, respectively. In the saline–alkali treatment group (Y), the average germination potential and germination rate values were 0.15 and 0.33, with coefficients of variation of 1.04 and 0.63, respectively. The average values of bud length and root length for the CK group were 10.74 cm and 8.34 cm, with coefficients of variation of 0.29 and 0.28, respectively. In the Y group, the average values were 4.40 cm and 3.01 cm, with coefficients of variation of 0.53 and 0.70, respectively. The variation range of traits in the CK group was between 0.28 and 0.47, while it ranged from 0.53 to 1.04 in the Y group (Table S2).
To avoid the impact of inherent differences in materials on the screening results, the relative values of the traits under saline–alkali stress treatment and the control were used for evaluation. The frequency distributions of the relative values of the above traits among the materials are shown in the histogram. The relative germination rate and relative bud length followed a normal distribution, whereas the relative germination potential and relative root length showed skewed distributions. It can be seen that there are significant differences in the relative germination rate and relative bud length among the oat germplasms. The relative germination potential values ranged from 0.0 to 1.91, with 201433-5 having the smallest value and Irish Victor having the largest. The relative germination rate values ranged from 0.04 to 1.39, with Ot2045 having the smallest value and Gemini having the largest. The relative bud length and relative root length values ranged from 0.10 to 1.21 and from 0.06 to 1.21, respectively, with 201235-14-2 having the largest values for both and Gemini and Lamar having the smallest, respectively (Figure 3).

3.2. Principal Component Analysis of Relative Values of Various Traits During the Germination Phase of Germplasm Resources

The principal component loading matrix reflects the degree of influence of each evaluation index on the principal component. The principal component was determined according to the principle that the eigenvalue was greater than 1 or the cumulative variance contribution rate exceeded 80% (Table 2). Relative germination rate, relative root length, and relative bud length were the most important indicators of the first principal component, reflecting the importance of seedling growth; relative germination potential was the most important indicator of the second principal component, reflecting the importance of seedling germination. The cumulative contribution rate of the two principal components was 92.74%. Therefore, the relative value of each character was transformed into two comprehensive indices: the comprehensive index weight was calculated according to the contribution rate of principal component factors, and a comprehensive evaluation of the D value of each germplasm resource was performed.

3.3. Cluster Analysis of Saline–Alkali Tolerance in Germplasm Resources During Germination Phase

Cluster analysis was performed on the membership function values and the D values of the 524 oat germplasm resources (Figure 4; Table S3). Cluster 1 included 253 germplasms (48.28% of the tested materials), with lower membership function values and D values. This cluster is classified as a saline–alkali–sensitive germplasm resource. Cluster 2 included 97 germplasms (18.51%), with the lowest membership function values and D values. This cluster can be identified as an extremely saline–alkali sensitive germplasm resource. Cluster 3 included 63 germplasms (12.02%), with relatively high D values and membership function values. This cluster is classified as a moderately saline–alkali–tolerant germplasm resource. Cluster 4 included 100 germplasms (19.08%), with intermediate membership function values and D values. Therefore, this cluster was identified as a slightly saline–alkali–tolerant germplasm resource. Cluster 5 included 11 germplasms (2.10%), with the highest membership function values and D values. Therefore, this cluster was classified as a highly saline–alkali-tolerant germplasm.

3.4. Regression Model Establishment

A multiple linear regression mathematical model of oat saline–alkali tolerance was established through multivariate linear regression analysis to facilitate the evaluation of saline–alkali tolerance in oat germplasm resources. Using the relative germination potential (X1), relative germination rate (X2), relative shoot length (X3), and relative root length (X4) of 524 oat germplasm resources as independent variables and the comprehensive saline–alkali tolerance evaluation D value as the dependent variable, the equation obtained from the multiple linear regression analysis was as follows: D = −0.05469 + 0.34354X1 + 0.09846X2 + 0.5101X3 + 0.35364X4, with an F value of 4935.28, p < 0.05, and an R2 of 0.97419, indicating that the equation fit well. Under the same saline–alkali stress conditions, by calculating the relative values of germination potential, germination rate, shoot length, and root length, this equation can be used to compute the comprehensive saline–alkali tolerance evaluation value and assess the tolerance of oat germplasm resources during the germination phase.

3.5. Performance of Different Traits in Oat Germplasm Resources from Various Saline–Alkali Soils

After comparing the yield and quality traits of oat germplasm from different saline–alkali soils, it is found that biological yield, grain yield, and crude protein are better in samples collected from Tumt Left Banner than in those from Dalat Banner, while crude fat and β-glucan are better in samples from Dalat Banner than from Tumt Left Banner. The coefficient of variation of all oat germplasm resources traits from the saline–alkali soil conditions in Tumt Left Banner ranged from 4.03% to 54.12%, while it ranged from 6.97% to 38.50% in Dalat Banner. This indicates that the tested oat germplasm resources showed significant trait differences under different saline–alkali soil conditions, with rich genetic variation (Table 3).

3.6. Correlation Analysis of Membership Function Values and D Value of Oat Germplasm Resources

The correlation analysis of the values of the affiliation function and the D value of each trait in different saline–alkali soils is shown in Figure 5. There were highly significant positive correlations between seedling emergence rate, plant height, spike length, number of spikelets, number of grains per spike, and grain weight per plant, and there was also a highly significant positive correlation with the D value. The correlations between biological yield and D value all exceeded 0.80, which indicates that biological yield is most closely related to the salinity tolerance of oats.

3.7. Principal Component Analysis of Traits in Oat Germplasm Resources

Principal component analysis (PCA) was conducted on the different traits of oat germplasm resources from saline–alkali soils using principal component dimensionality reduction (Table 4). Six principal components were extracted for the saline–alkali soil oat germplasm from Tumt Left Banner, with a cumulative contribution rate of 83.45%, based on the criterion that the contribution rate should be greater than 80%. Principal components 1, 2, and 3 reflect the importance of yield composition factors, whereas principal components 4, 5, and 6 reflect the importance of quality traits. Six principal components were extracted for the saline–alkali soil oat germplasm in Dalat Banner, with contribution rates of 25.60%, 22.28%, 10.99%, 9.80%, 8.73%, and 7.21%, respectively, resulting in a cumulative contribution rate of 84.61%. The first principal component mainly reflects the importance of yield composition factors, the second reflects the importance of yield, the third and fifth reflect the importance of quality, and the sixth reflects the importance of plant height.
In different saline–alkali soils, emergence rate, yield, and yield composition factors responded more favorably to saline–alkali conditions than to quality traits, which showed a more direct relationship with saline–alkali tolerance.

3.8. Cluster Analysis and Comprehensive Evaluation of Oat Germplasm Resources from Different Saline–Alkali Soils

Clustering analysis was performed for the saline–alkali tolerance of 174 oat germplasm resources from the saline–alkali soil of Tumt Left Banner (Figure 6a; Table S4). Cluster 1 consisted of 81 germplasms (46.55% of the tested germplasms), which had lower fuzzy membership function values and D values. The saline–alkali tolerance of this cluster was weak, including the varieties 201413-2, Xiaomao Youmai, and Baiyan 9. Cluster 2 consisted of 22 germplasms (12.64%), with the lowest D value, and their saline–alkali tolerance was also weak. This cluster includes varieties, such as 201124-23-1-2, Dingyou 9, and Weidu Yomai. Cluster 3 consisted of 52 germplasms (29.89%) with medium comprehensive evaluation values. The saline–alkali tolerance in this cluster was moderate, including varieties like Diyan 1, Baiyan 10, and 200966-2-4-2-1. Cluster 4 contained 16 germplasms (9.20%) with higher fuzzy membership function values and D values. This cluster has a relatively strong saline–alkali tolerance, including Baiyan 2, 201235-14-2, and Bayou 8. Cluster 5 consisted of three germplasms (1.72%), namely Zhangyou 14, Baiyan 1, and Dingyou 5, which had the highest fuzzy membership function values and D values and are recognized as having strong saline–alkali tolerance.
For the 159 oat germplasm resources from the saline–alkali land in Dalat Banner (Figure 6b; Table S5), the clustering analysis results were as follows: Cluster 1 had 47 germplasms (29.56% of the tested germplasm), with fuzzy membership function values and D values in the middle range. Therefore, this cluster, including Whitestone, Ot-286, and Jinyan 17, is considered to have moderate saline–alkali tolerance. Cluster 2 consisted of 44 germplasms (27.67%) with lower comprehensive evaluation values and was considered to have weak saline–alkali tolerance, including varieties such as Cao-2-207-3, 201242-21-1, and Baiyan 9. Cluster 3 had only one germplasm (0.63%), 201430-33, which had the lowest comprehensive evaluation value and was most affected by stress, making it the most sensitive to saline–alkali stress and exhibiting weak tolerance. Cluster 4 consisted of 55 germplasms (34.59%) with higher comprehensive evaluation values, which are considered to have strong saline–alkali tolerance, including Gemini, Baiyan 2, and Kaufmann. Cluster 5 contained 12 germplasms (7.55%) with the highest fuzzy membership function values and D values, recognized as having strong saline–alkali tolerance, including Bayou 8, Baiyan 1, and Zhangyou 14.
Owing to the complexity of ecological environments, different oat germplasms may exhibit different performances depending on the region. The matching degree between the germplasm and the environment is significant for practical oat production. A comparison of germplasms with high saline–alkali tolerance revealed that 18 germplasms overlapped in the saline–alkali tolerance cluster, exhibiting higher tolerance, yield, and quality across different areas (Figure 7). These include Zhangyou 14, Baiyan 1, Dingyou 5, Baiyan 2, 201235-14-2, Bayou 8, Qingyin 3, Dingyou 11, Baiyan 8, 200233-8-3-31-2-8, H9-123, 201415-1, 200920-12-1, Yan 2015, Baiyan 16, Jinyan 8, 200233-34-2-9-2, and Bai S41.

4. Discussion

4.1. Importance of Screening for Saline–Alkali Tolerance During Germination of Oat Germplasm Resources

Numerous studies have evaluated and identified oat germplasm resources during the germination period [21], but different salt, alkali, and saline–alkali stress treatments have been employed, and the corresponding results may differ [23]. More importantly, salts and alkalis occur simultaneously under natural conditions [11]. Moreover, the relative values of germination and growth indicators play an important role in evaluating salt and alkalinity tolerance. In this study, we comprehensively evaluated the relative germination potential, germination rate, relative shoot length, and root length of 524 oat germplasms under saline–alkali stress treatments. In the evaluation of crop salt and alkalinity tolerance, comprehensive evaluation methods can be used to avoid the overlap and intersection of information between indicators in order to scientifically and systematically reflect differences in the salt and alkali tolerance of germplasm resources [24]. The identification of 174 germplasms with saline–alkali tolerance during the germination period could be used for field identification. Yield is a key factor in assessing the strength of a crop’s salt and alkalinity tolerance. Further field evaluations of salt and alkalinity tolerance throughout the growth period are especially important [25]. In addition, by screening and evaluating different oat genotypes under natural conditions, scientists can identify germplasm resources with excellent salt and alkali tolerance, thereby providing a foundation for future genetic improvements.

4.2. Relationship Between Various Oat Germplasm Resources Traits and Saline–Alkali Tolerance Under Natural Conditions

The emergence rate, a key factor in oat cultivation on saline–alkali land, was found to have a significant positive correlation with biological and grain yields, based on correlation and principal component analysis. Some germplasms exhibited high emergence rates but did not show superior final yield and quality. These findings are also reflected in the evaluation of salt tolerance in barley [26]. Crop yield is the most direct indicator of a crop’s saline–alkali tolerance [27,28]. In a field evaluation of wheat salt tolerance, the number of grains per spike, thousand–grain weight, and plant height were significantly positively correlated with yield, indicating their importance in indirect selection under salt stress [29]. Grain yield is strongly correlated with the salt tolerance, yield, and yield stability indexes, making it more reliable and effective for screening salt–tolerant barley germplasms [30]. Plant height is an important performance evaluation indicator, and suitable height is a key factor affecting oat grass yield [31]. Grain yield and its contributing factors are crucial for saline–alkali tolerance breeding [32]. Forage yield is also an important indicator of oat variety quality, and these traits should be considered in the selection and cultivation of high-yield oats [33]. Oat forage yield is mainly influenced by regional ecological conditions and oat varieties, whereas thousand–grain weight and spike grain number are direct factors limiting the yield of saline–alkali land [34]. The traits related to yield performance used in the present study, such as plant height, grain yield, crude protein, and single plant grain weight, can be used as comprehensive evaluation indicators to identify important oat germplasms in saline–alkali land. In production practices, a comprehensive analysis should be conducted to assess oat varieties. The use of single indicators such as yield, crude protein, and β-glucan as judgment standards has certain limitations, and a comprehensive evaluation using multiple indicators is more objective and scientific.

4.3. Significance of Field Evaluation in Breeding Saline–Alkali Tolerant Oat Varieties

The present study revealed that the emergence stage and the late reproductive stage of salinity tolerance in oats were not perfectly matched, which was consistent with the findings of research scholars in oats [35], in alfalfa [36], and in barley [26], suggesting that there is an obvious stage–specificity in the salinity tolerance of crops. This property may stem from the differential regulatory mechanisms activated at different growth stages: the germination stage mainly relies on the rapid accumulation of osmoregulatory substances (e.g., proline) [1], whereas physiological functions are maintained more through ion compartmentalization in the later stages of fertility [4]. Field validation further showed that salinity tolerance performance was significantly influenced by genotype–environment interactions [37]. The results of the present study provide a feasible solution for this purpose, and its accuracy is more reliable than the traditional seedling screening method. By comprehensively considering various environmental factors, such as water heat, altitude, light, temperature, and other ecological factors in different regions, seed production performance and nutritional quality exhibit varying optimal levels [38,39]. The results of this study show that in different saline–alkali lands, there are significant differences in seed yield, yield components, and other traits, with variations ranging from 4.07% to 76.92%. Grain yield and biomass yield showed the highest variation among all traits, and the differences in yield traits were likely caused by various unpredictable factors under field conditions. In contrast, nutritional quality is relatively stable within a certain range [40]. In this experiment, both the production performance and grain quality traits in the saline–alkali land of Dalat Banner exhibited higher biomass yield and crude protein content, with the highest biomass yield reaching 9571.45 kg/hm2 and the highest crude protein content reaching 15.88%. Other studies have also found that different ecological regions have a significant impact on crude fat and β-glucan contents in oat grains. The accumulation of β-glucan in oat grains is high [41]. Similar results were observed in this experiment, with crude fat and β-glucan performing better in the saline–alkali land in Dalat Banner, with increases of 17.81% and 2.47%, respectively, compared to the saline–alkali land in Tumt Left Banner. This indicates that there is a correlation between stress and changes in oat quality, which has reference value for high–quality oat breeding. Barley has good adaptability in warm climates and better performance in saline–alkali lands [26]. Similarly, in this study, 18 oat germplasms, including Zhangyan 14, Baiyan 1, and Dingyou 5, showed performance advantages in the identification of salinity tolerance and as high-yielding and high–quality germplasms in different saline–alkali areas; these present promising germplasms for enriching the saline–alkali–tolerant oats in similar areas.

5. Conclusions

Based on the comprehensive evaluation method, the 524 oat germplasms were classified into five categories based on their saline–alkali tolerance during the germination stage. Among them, 11 germplasms were classified as highly tolerant, 63 as moderately tolerant, and 100 as slightly tolerant. Additionally, a regression equation was established: D = −0.05469 + 0.34354X1 + 0.09846X2 + 0.5101X3 + 0.35364X4, with an F value of 4935.28, p < 0.05, and an R2 of 0.97419. A comprehensive evaluation of the performance of oat germplasms in different saline-alkali soils identified 18 high-quality, high–yield, saline–alkali–tolerant oat germplasm resources. These germplasms provide valuable parental materials for oat breeding with saline–alkali tolerant oat breeding. Moreover, the saline–alkali–tolerant varieties among them can be popularized and planted as the preferred varieties for local oat cultivation.

Supplementary Materials

The following supporting information can be downloaded at: https://www.mdpi.com/article/10.3390/agronomy15061267/s1: Table S1: 524 germplasm resources of oat; Table S2: Description statistics of various characters of oat germplasm under control and saline–alkali stress; Table S3: Classification of saline–alkali tolerance of oat germplasm resources during germination; Table S4:Classification results of saline–alkali tolerance of oat germplasm resources in Tumt Left Banner; Table S5: Classification results of saline–alkali tolerance of oat germplasm resources in Dalat Banner.

Author Contributions

Conceptualization: B.Z. (Biru Zhang), J.M., B.Z. (Baoping Zhao), Z.X., X.L. and J.L.; methodology: B.Z. (Biru Zhang), J.M., B.Z. (Baoping Zhao), Z.X., X.L. and J.L.; investigation: B.Z. (Biru Zhang), J.M., B.Z. (Baoping Zhao), Z.X., X.L., J.L. and Z.Y.; data curation: B.Z. (Biru Zhang); writing—original draft preparation: B.Z. (Biru Zhang); writing—review and editing: J.M. and B.Z. (Baoping Zhao); supervision: J.L.; project administration: J.L.; funding acquisition: J.L. All authors have read and agreed to the published version of the manuscript.

Funding

This research was funded by the Capacity Building Project for Oat Engineering Laboratory in Inner Mongolia Autonomous Region (BR221023), the National Modern Agricultural Industry Technology System (CARS-07), the National Key R&D Program of China (2018YFE0107900), and the Evaluation of Stress-resistant Germplasm Resources, Breeding and Utilization of New Varieties of Oat (BR22-11-15).

Data Availability Statement

The data presented in this study are available upon request from the corresponding author.

Acknowledgments

We thank all members of the National Outstanding Talents in Agricultural Research and Their Innovative Teams for their assistance during laboratory work and data analysis.

Conflicts of Interest

The authors declare no conflicts of interest.

References

  1. Shiv, P.Y.; Reshu, B.; Harsita, N.; Rakhi, M.; Rajesh, K.S.; Saroj, K.P. Impact of salt stress on growth, productivity and physicochemical properties of plants: A review. Int. J. Chem. Stud. 2019, 7, 1793–1798. [Google Scholar]
  2. Butcher, K.; Wick, A.F.; DeSutter, T.; Chatterjee, A.; Harmon, J. Soil salinity: A threat to global food security. Agron. J. 2016, 108, 2189–2200. [Google Scholar] [CrossRef]
  3. Yin, D.J.; Ye, S.J.; Sun, X.Y.; Chen, Q.Y.; Min, T.; Wang, H.X.; Wang, L.M. Integrative analysis of the transcriptome and metabolome reveals genes involved in phenylpropanoid and flavonoid biosynthesis in the trapa bispinosa roxb. Front. Plant Sci. 2022, 13, 913265. [Google Scholar] [CrossRef]
  4. Li, J.; Yang, Y. How do plants maintain pH and ion homeostasis under saline-alkali stress? Front. Plant Sci. 2023, 14, 1217193. [Google Scholar] [CrossRef] [PubMed]
  5. Yasin, A.M.; Abdul, R.A.; Khalid, M. Rehabilitation of salina ecosystems through cultivation of salt tolerant plants. Pak. J. Bot. 2012, 44, 69–75. [Google Scholar]
  6. Zhang, B.; Wang, N. Study on the harm of saline alkali land and its improvement technology in China. IOP Conf. Ser. Earth Environ. Sci. 2021, 692, 42053–42058. [Google Scholar] [CrossRef]
  7. Yu, J.; Li, B.; Song, T.; He, J.; KongLing, Z.; Lian, L.; He, W.; Hai, T.; Huang, X.; Liu, Z.; et al. Integrated physiological and transcriptomic analyses responses to altitude stress in oat (Avena sativa L.). Front. Genet. 2021, 12, 638683. [Google Scholar] [CrossRef]
  8. Chen, Z.; Li, X.; Zhou, R.; Hu, E.; Peng, X.; Jiang, F.; Wu, Z. An optimized protocol for comprehensive evaluations of salt tolerance in crop germplasm accessions: A case study of Tomato (Solanum lycopersicum L.). Agronomy 2024, 14, 842. [Google Scholar] [CrossRef]
  9. Sreesaeng, J.; Qiu, C.-W.; Zhang, S.; Shi, S.-H.; Luo, L.; Holford, P.; Wu, F. Identification and characterization of hull-less barley (Hordeum vulgare L.) germplasms for salt tolerance. Plant Growth Regul. 2024, 104, 975–989. [Google Scholar] [CrossRef]
  10. Li, F.; Zhou, Y.; Wang, Y.; Sun, L.; Bai, W.; Yan, T.; Xu, W.; Huang, R. Screening and identification of sorghum cultivars for alkali tolerance during germination. Sci. Agric. Sin. 2013, 46, 1762–1771. [Google Scholar] [CrossRef]
  11. Ahmed, S.; Patel, R.; Singhal, R.K.; Kumar, N.; Rana, M.; Chand, S.; Chandra, A.; Rengel, Z. Salinity, alkalinity and their combined stress effects on germination and seedling growth attributes in oats (Avena sativa). Crop Pasture Sci. 2023, 74, 1094–1102. [Google Scholar] [CrossRef]
  12. Güngör, H.; Çıkılı, Y.; Dumlupınar, Z. Screening of oat varieties and landraces at early vegetative stage under salt stress conditions: Morpho-physiological and PCA biplot analysis. Cereal Res. Commun. 2021, 49, 587–597. [Google Scholar] [CrossRef]
  13. Zhang, J.; Gao, W.; Yan, L.; Zhang, Z.; Zhou, H.; Wu, B. Identification and evaluation of salt-alkali tolerance and screening of salt-alkali tolerant germplasm of oat (Avena sativa L.). Acta Agron. Sin. 2023, 49, 1551–1561. [Google Scholar] [CrossRef]
  14. Premkumar, R.; Nirmalakumari, A.; Anandakumar, C.R. Correlation studies for yield components in oats germplasm. Electron. J. Plant Breed. 2017, 8, 980–985. [Google Scholar] [CrossRef]
  15. Gao, Y.; Jin, Y.; Guo, W.; Xue, Y.; Yu, L. Metabolic and physiological changes in the roots of two oat cultivars in response to complex saline-alkali stress. Front. Plant Sci. 2022, 13, 835414. [Google Scholar] [CrossRef]
  16. Zhu, G.; Xu, Z.; Xu, Y.; Lu, H.; Ji, Z.; Zhou, G. Different types of fertilizers enhanced salt resistance of oat and associated physiological mechanisms in saline soils. Agronomy 2022, 12, 317. [Google Scholar] [CrossRef]
  17. Quamruzzaman, M.; Manik, S.M.N.; Livermore, M.; Johnson, P.; Zhou, M.; Shabala, S. Multidimensional screening and evaluation of morphophysiological indices for salinity stress tolerance in wheat. J. Agron. Crop Sci. 2022, 208, 454–471. [Google Scholar] [CrossRef]
  18. Gao, H.; Zhang, X.; Liang, Y.; Dong, L.; Han, C.; Cao, Y.; Ma, W. Comprehensive evaluation of salt tolerance in asparagus germplasm accessions (Asparagus officinalis L.) at different growth stages. J. Food Qual. 2021, 2021, 6626112. [Google Scholar] [CrossRef]
  19. Wu, L.; Du, J.; Zhang, Y.; Xue, Y.; Jiang, C.; Lu, W.; Zheng, Y.; Zhou, C.; Xiong, A.; Li, M. Identification and evaluation of celery germplasm resources for salt tolerance. Agronomy 2024, 14, 1048. [Google Scholar] [CrossRef]
  20. Jamshidi, A.; Javanmard, H.R. Evaluation of barley (Hordeum vulgare L.) genotypes for salinity tolerance under field conditions using the stress indices. Ain Shams Eng. J. 2018, 9, 2093–2099. [Google Scholar] [CrossRef]
  21. Chen, X.; Zhang, Z.; Wu, B. Comprehensive evaluation of salt tolerance and screening for salt tolerant accessions of naked oat (Avena nuda L.) at germination stage. Sci. Agric. Sin. 2014, 47, 2038–2046. [Google Scholar] [CrossRef]
  22. Han, F.; Zhuge, Y.; Lou, Y.; Wang, H.; Zhang, N.; He, W.; Zhao, Y. Evaluation of salt tolerance and screening for salt tolerant accessions of 63 foxtail millet germplasm. J. Plant Genet. Resour. 2018, 19, 685–693. [Google Scholar] [CrossRef]
  23. Ahmed, S.; Patel, R.; Rana, M.; Kumar, N.; Choudhary, M.; Chand, S.; Singh, A.K.; Ghosh, A.; Singhal, R.K. Effect of salt, alkali and combined stresses on root system architecture and ion profiling in a diverse panel of oat (Avena spp.). Funct. Plant Biol. 2023, 51, FP23031. [Google Scholar] [CrossRef]
  24. Langridge, P.; Waugh, R. Harnessing the potential of germplasm collections. Nat. Genet. 2019, 51, 200–201. [Google Scholar] [CrossRef]
  25. Du, Y.; Liu, X.; Zhang, L.; Zhou, W. Drip irrigation in agricultural saline-alkali land controls soil salinity and improves crop yield: Evidence from a global meta-analysis. Sci. Total Environ. 2023, 880, 163226. [Google Scholar] [CrossRef]
  26. Abbasipour, B.H.; Ghazvini, H.; Amiri, B.; Bazrafshan, F.; Nikkhah, H. Responses of barley (Hordeum vulgare L.) genotypes to salinity stress under controlled and field conditions. Gesunde Pflanz. 2022, 75, 499–513. [Google Scholar] [CrossRef]
  27. Igartua, E. Choice of selection environment for improving crop yields in saline areas. Theor. Appl. Genet. 1995, 91, 1016–1021. [Google Scholar] [CrossRef]
  28. Song, Y.; Gao, M.; Li, Z. Impacts of straw return methods on crop yield, soil organic matter, and salinity in saline-alkali land in North China. Field Crops Res. 2025, 322, 109752. [Google Scholar] [CrossRef]
  29. Moustafa, E.S.A.; Ali, M.M.A.; Kamara, M.M.; Awad, M.F.; Hassanin, A.A.; Mansour, E. Field screening of wheat advanced lines for salinity tolerance. Agronomy 2021, 11, 281. [Google Scholar] [CrossRef]
  30. Ebrahim, F.; Arzani, A.; Rahimmalek, M.; Rezaei, S.; Cheghamirza, K. Yield related traits and tolerance indices to screen salinity tolerant genotypes in cultivated and wild barley. Gesunde Pflanz. 2022, 74, 1099–1108. [Google Scholar] [CrossRef]
  31. Zhang, J.; Zhang, Y.; Yu, C.; Lin, J.; Liu, J.; Liu, B.; Wang, J.; Huang, A.; Li, H.; Zhao, T. Osmph1 regulates plant height and improves grain yield in rice. PLoS ONE 2017, 12, e0180825. [Google Scholar] [CrossRef] [PubMed]
  32. Sobczyński, G.; Studnicki, M.; Mądry, W.; Wijata, M.; Gozdowski, D.; Noras, K.; Samborski, S.; Rozbicki, J. Impact of cultivar and environment soil suitability on the contribution of yield components to grain yield variation in spring wheat. Crop Sci. 2020, 60, 428–440. [Google Scholar] [CrossRef]
  33. Zhang, H.; Liu, C.; Mao, L.; Li, Y.; Shen, Y. Divergent response of hay and grain yield of oat: Effects of environmental factors and sowing rate. J. Sci. Food Agric. 2022, 103, 233–242. [Google Scholar] [CrossRef]
  34. Zhao, G.Q.; Ma, B.L.; Ren, C.Z. Salinity effects on yield and yield components of contrasting naked oat genotypes. J. Plant Nutr. 2009, 32, 1619–1632. [Google Scholar] [CrossRef]
  35. Muhammad, A.U.; Imdad, A.M.; Muhammad, S.; Muhammad, R. Screening of oat (Avena sativa) varieties in saline-sodic soil. Am. J. Bio. Sci. Res. 2019, 4, 104–106. [Google Scholar] [CrossRef]
  36. Yu, R.; Wang, G.; Yu, X.; Li, L.; Li, C.; Song, Y.; Xu, Z.; Zhang, J.; Guan, C.; Luo, Z.B. Assessing alfalfa (Medicago sativa L.) tolerance to salinity at seedling stage and screening of the salinity tolerance traits. Plant Biol. 2021, 23, 664–674. [Google Scholar] [CrossRef] [PubMed]
  37. Zheng, C.; Yi, Z.; Xiao, L.; Sun, G.; Li, M.; Xue, S.; Peng, X.; Duan, M.; Chen, Z. The performance of miscanthus hybrids in saline-alkaline soil. Front. Plant Sci. 2022, 13, 921824. [Google Scholar] [CrossRef]
  38. Guo, Y.; Kuang, L.; Xu, Y.; Yan, T.; Jiang, L.; Dong, J.; Wu, D. Construction of a worldwide core collection of rapeseed and association analysis for waterlogging tolerance. Plant Growth Regul. 2022, 98, 321–328. [Google Scholar] [CrossRef]
  39. Zhang, Y.; Li, Y.; Ren, X.; Gao, J.; Wang, Y.; Zhu, D. Comparative study on the nutritional quality of peanut in saline and non-saline land. Foods 2024, 13, 3751. [Google Scholar] [CrossRef]
  40. Zeki, M.; Hasan, A.; Özge, D.E.K. Grain yield, quality traits and grain yield stability of local oat cultivars. J. Soil Sci. Plant Nut. 2018, 18, 269–281. [Google Scholar] [CrossRef]
  41. Farooq, S.; Sahil; Mahajan, G.; Loura, D.; Raymont, K.; Chauhan, B.S. Influence of soil moisture levels on the growth and reproductive behaviour of avena fatua and avena ludoviciana. PLoS ONE 2020, 15, e0234648. [Google Scholar] [CrossRef]
Figure 1. Geographic location of the test site: Tumt Left Banner (40°40′47.2″ N, 111°22′37.6″ E) and Dalat Banner (40°25′52.5″ N, 110°11′10.3″ E).
Agronomy 15 01267 g001
Figure 2. Performance of indicators of the germination period of oat germplasm resources in saline–alkali stress group (Y) and control group (CK): germination potentials (a); germination rates (b); bud length (c); root length (d).
Agronomy 15 01267 g002
Figure 3. Distribution of relative values of each index during germination of oat germplasm resources: relative germination potential (a); relative germination rate (b); relative bud length (c); relative root length (d).
Agronomy 15 01267 g003
Figure 4. Clustering map of saline–alkali tolerance of oat germplasm resources during germination. Different color branches are represented: red = Cluster 1, blue = Cluster 2, green = Cluster 3, violet = Cluster 4, yellow = Cluster 5.
Agronomy 15 01267 g004
Figure 5. Correlation of germplasm resources of oats: Tumt Left Banner (a); Dalat Banner (b). Note: X1: emergence rate; X2: plant height; X3: spike length; X4: spikelet number; X5: spike number per plant; X6: grain weight per plant; X7: biological yield; X8: grain yield; X9: crude protein; X10: crude fat; X11: β-glucan; the same below.
Agronomy 15 01267 g005
Figure 6. Clustering map for the identification of saline–alkali tolerance of oat germplasm resources: Tumt Left Banner (a); Dalat Banner (b). Different color branches are represented: red = Cluster 1, blue = Cluster 2, green = Cluster 3, violet = Cluster 4, yellow = Cluster 5.
Agronomy 15 01267 g006
Figure 7. Venn diagram of saline–alkali-tolerant oat germplasm resources. Note: Highly saline–alkali–tolerant and the highest–tolerant genetic materials; yellow represents the collection of different tolerant germplasms of Dalat Banner, and blue represents the collection of different tolerant germplasms of Tumt Left Banner.
Agronomy 15 01267 g007
Table 1. Basic soil characteristics at the test site.
Experimental
Field
pHSalinity
g/kg
OM Content
g/kg
AN Content
mg/kg
AP Content
mg/kg
AK Content
mg/kg
TA Content
g/kg
TP Content
g/kg
TK Content
g/kg
Tumt Left Banner8.686.079.3263.112.71171.330.531.660.53
Dalat Banner8.959.207.5459.613.83 98.30.700.5410.18
Table 2. Principal components and contribution rates of each index in the oat germination stage under saline–alkali stress.
IndexPC1PC2
Relative germination potential0.4240.822
Relative germination rate0.5160.126
Relative bud length0.527−0.394
Relative root length0.526−0.391
Eigenvalue3.1050.605
Contributive ratio (%)77.6315.12
Cumulative contributive ratio (%)77.6392.74
Table 3. Descriptive statistics of various characteristics of oat germplasm resources.
TraitTumt Left BannerDalat Banner
MinMaxMeanSDCV (%)MinMaxMeanSDCV (%)
Seeding ratio38.4092.2062.8111.2517.9143.0088.2765.8311.2617.11
Plant height32.1678.6754.918.9616.3245.5698.8565.6710.7016.30
Ear length9.4025.8715.372.8718.678.3022.2714.072.5117.83
Select number10.8036.4017.994.7326.316.9025.0014.283.0421.28
Grain number of single plant10.3051.4028.268.2029.0213.0052.1026.428.8333.40
Grain weight per plant0.251.340.680.2130.780.231.140.600.2033.96
Biological yield1667.5011,405.705338.682080.5338.971167.256303.153199.711231.9438.50
Grain yield286.742880.371318.64713.7154.12347.841181.59685.80176.0225.67
Crude protein12.2315.8314.270.584.039.5015.8812.650.886.97
Crude fat2.725.304.210.4510.673.236.984.960.7915.84
β-glucan2.565.874.050.7718.962.306.764.150.8620.76
Table 4. Principal components and contribution rates of oat indexes in Tumt Left Banner and Dalat Banner.
IndexTumt Left BannerDalat Banner
PC1PC2PC3PC4PC5PC6PC1PC2PC3PC4PC5PC6
X10.415−0.312−0.004−0.1720.015−0.1300.0990.571−0.0970.028−0.014−0.059
X20.2050.0290.5750.325−0.1520.1160.353−0.0820.0170.277−0.4590.439
X30.2200.1550.563−0.0690.2840.2100.3690.0170.2250.497−0.1760.058
X40.1880.4600.206−0.052−0.0280.1870.456−0.0140.028−0.047−0.0260.039
X50.3360.490−0.278−0.022−0.017−0.1060.491−0.095−0.171−0.2080.309−0.212
X60.3460.456−0.2770.001−0.030−0.1470.511−0.107−0.139−0.2310.211−0.126
X70.451−0.3350.068−0.141−0.028−0.1460.1050.591−0.088−0.030−0.007−0.071
X80.447−0.266−0.054−0.113−0.089−0.137−0.0010.523−0.1050.0860.0520.095
X90.104−0.074−0.1330.4990.817−0.137−0.071−0.083−0.5420.3230.5170.539
X100.192−0.152−0.342−0.0390.0800.8930.0160.0350.5620.4600.555−0.191
X110.141−0.085−0.1160.757−0.4610.0370.0460.1260.512−0.5020.2000.630
Eigenvalue3.2441.8971.2041.0180.9680.8492.8162.4511.2081.0770.9610.793
Contributive
ratio (%)
29.4917.2410.949.268.807.7125.6022.2810.999.808.737.21
Cumulative
contributive ratio (%)
29.4946.7357.6766.9375.7383.4525.6047.8858.8768.6677.4084.61
Disclaimer/Publisher’s Note: The statements, opinions and data contained in all publications are solely those of the individual author(s) and contributor(s) and not of MDPI and/or the editor(s). MDPI and/or the editor(s) disclaim responsibility for any injury to people or property resulting from any ideas, methods, instructions or products referred to in the content.

