Article

RLDD-YOLOv11n: Research on Rice Leaf Disease Detection Based on YOLOv11

1
College of Information and Intelligence, Hunan Agricultural University, Changsha 410128, China
2
College of Information and Engineering, Swan College of Central South University of Forestry and Technology, Changsha 410211, China
*
Author to whom correspondence should be addressed.
Agronomy 2025, 15(6), 1266; https://doi.org/10.3390/agronomy15061266
Submission received: 28 April 2025 / Revised: 19 May 2025 / Accepted: 20 May 2025 / Published: 22 May 2025
(This article belongs to the Topic Digital Agriculture, Smart Farming and Crop Monitoring)

Abstract

:
Rice disease identification plays a critical role in ensuring yield stability, enabling precise prevention and control, and promoting agricultural intelligence. However, existing approaches rely heavily on manual inspection, which is labor-intensive and inefficient. Moreover, the significant variability in disease features poses further challenges to accurate recognition. To address these issues, this paper proposes a novel rice leaf disease detection model—RLDD-YOLOv11n. First, the improved RLDD-YOLOv11n integrates the SCSABlock residual attention module into the neck layer to enhance multi-semantic information fusion, thereby improving the detection capability for small disease targets. Second, recognizing the limitations of the native upsampling module in YOLOv11n in reconstructing rice-disease-related features, the CARAFE upsampling module is incorporated. Finally, a rice leaf disease dataset focusing on three common diseases—Bacterial Blight, Rice Blast, and Brown Spot—was constructed. The experimental results demonstrate the effectiveness of the proposed improvements. RLDD-YOLOv11n achieved a mean Average Precision (mAP) of 88.3%, representing a 2.8% improvement over the baseline model. Furthermore, compared with existing mainstream lightweight YOLO models, RLDD-YOLOv11n exhibits a superior detection performance and robustness.

1. Introduction

Rice, an eminent cornerstone of global sustenance, occupies an increasingly pivotal role in the alimentary provisioning of diverse nations [1]. However, rice is susceptible to disease during its growth, resulting in a significant reduction in both quality and yield. Therefore, prioritizing effective rice disease control is essential for ensuring food security [2]. Currently, experts primarily diagnose diseases in rice plants visually [3]. This method is not only time-consuming and labor-intensive, but also limited in both recognition accuracy and efficiency, making it inadequate for meeting the practical requirements of efficient pest management.
With the advancement of computer vision technology, researchers have begun to apply image processing and machine learning methods for the detection of crop diseases and pests. In the case of rice disease detection, artificial intelligence (AI) technologies, such as computer vision and deep learning, offer a promising solution [4]. Sahu et al. [5] employed Support Vector Machine (SVM) and a novel hybrid Random Forest (RF) model to detect plant leaf diseases. Regiana et al. [6] improved a leaf image clustering model using the K-means algorithm for the identification of rice leaf diseases. In Guan et al. [7], a method for identifying peanut leaf spot disease based on hyperspectral UAV imagery was proposed, integrating hyperspectral imaging with superpixel unmixing techniques. In An et al. [8], hyperspectral data combined with SVM were utilized to detect and classify wheat powdery mildew (WPM), effectively distinguishing between healthy and infected wheat, and further enabling the classification of varying infection levels of WPM. Rajput et al. [9] constructed a comprehensive dataset containing healthy and diseased pigeon pea leaf images, and K-Nearest Neighbors (KNN) and SVM were employed to classify pigeon pea leaf diseases. Terensan et al. [10] applied the K-means clustering method to distinguish between rice blast and brown spot diseases. Harjanti et al. [11] employed Euclidean distance and K-means clustering to classify mint leaf types. Banerjee et al. [12] utilized convolutional neural network (CNN) and SVM methods to identify and classify banana leaf diseases, distinguishing them from healthy leaves. Additionally, Saputra et al. [13] employed the SVM algorithm for the detection of rice leaf diseases. In summary, traditional methods for detecting crop diseases often rely on manual feature extraction, which is time-consuming and limits both the accuracy and efficiency of detection. Consequently, this affects the real-time performance and practical application of disease identification.
Recently, with the rapid advancement of image processing technologies, the field of deep learning has evolved significantly and has been increasingly integrated into object detection tasks. By leveraging deep learning methods, the field has acquired the capability to autonomously extract disease-related features. Consequently, the integration of artificial intelligence (AI) into agriculture has opened new avenues for improving crop management. One notable application is the detection of rice diseases. Artificial intelligence, particularly machine learning algorithms, has proven effective at analyzing large-scale image datasets to identify patterns associated with various plant diseases. Global research endeavors are currently underway in the realm of plant disease detection. Object detection algorithms are divided into two categories. One is the two-stage algorithm based on regional suggestion box prediction, such as Fast-RCNN [14] and Faster-RCNN [15]. Junare et al. [16] proposed an improved Mask R-CNN model based on Faster R-CNN for plant disease detection in complex scenarios. The experimental results demonstrated that the proposed model outperformed existing methods in terms of detection performance. Guan et al. [17] introduced a more efficient GC-Faster R-CNN model for agricultural pest detection. Compared with the original Faster R-CNN, the proposed model achieved a 4.5% improvement in mAP and a significant 16.6% increase in recall, substantially enhancing overall detection effectiveness. Hou et al. [18] proposed the FPN-ISResNet-Faster RCNN model, effectively enhancing the precision of leaf disease detection. Their model exhibited impressive accuracy and generalization in detecting diseases in apple leaves. Admass et al. [19] proposed an automated system for mango disease detection and classification that integrated CNN with Histogram of Oriented Gradients (HOG). Experimental results demonstrated that the hybrid CNN-HOG model outperformed the use of CNN or HOG alone in both detection and classification tasks, highlighting the complementary strengths of the two methods. The model achieved accuracy rates of 98.80% on the training set and 99.5% on the testing set, and exhibited an outstanding performance across various metrics, including accuracy, precision, and recall. Meanwhile, WANG et al. [20] pioneered an innovative technique for in situ sweet potato leaf detection. This method, predicated on a refined Faster R-CNN framework and a visual attention mechanism, attained a mean average precision of 95.7%. Notably, this performance surpassed the original Faster R-CNN by 2.9% and outperformed YOLOv5 by 7.0%. This innovation holds immense potential for applications in smart agriculture and ecological monitoring, particularly for tasks such as growth monitoring and plant phenotyping, especially when dealing with densely populated or occluded leaves. While such algorithms deliver commendable detection efficacy, their operational pace regrettably lags.
Another useful method is the use of a single-stage algorithm based on the regression problem, such as SSD [21] or YOLO [22]. While these algorithms may exhibit a slightly diminished detection efficacy in comparison to their two-stage counterparts, they more than compensate with their swiftness and real-time performance. Yin et al. [23] proposed a high-precision detection model for jujube leaf spot diseases, termed JujubeSSD. The model achieved an mAP of 97.1% in the detection task, representing an improvement of approximately 6.35 percentage points over the baseline algorithm. These results effectively validate the model’s superior performance and strong practical applicability in the identification of jujube diseases. Dahua et al. [24] presented a novel SSD-based architecture for detecting citrus leaf diseases. The model utilizes the lightweight neural network MobileNetV2 [25] as the backbone of the SSD framework and integrates the Coordinate Attention (CA) [26] mechanism along with the Receptive Field Block (RFB) [27] module. These enhancements resulted in a model size reduction of 52.3 MB, an increase of 3.15 FPS in inference speed, and a 4.4 percentage point improvement in mAP. This approach not only significantly enhanced detection performance, but also demonstrated a strong real-time capability, offering an effective technical solution for the rapid and accurate diagnosis of citrus leaf diseases. It facilitates early identification and timely intervention, thereby supporting farmers in effective disease management. Wang et al. [28] introduced a lightweight design into the YOLO architecture by replacing conventional convolutional layers with ghost modules to effectively reduce the number of model parameters. Additionally, the Convolutional Block Attention Module (CBAM) [29] was integrated to enhance feature representation, and an additional prediction head was incorporated to improve detection capability. The proposed MGA-YOLO model demonstrated excellent performance in apple leaf disease detection, achieving an mAP of 89.3% and an inference speed of 84.1 FPS on a GPU server, highlighting its strong detection accuracy and real-time applicability. Sangaiah et al. [30] developed a rice leaf disease identification model based on Tiny YOLO v4, which was deployed on unmanned aerial vehicles (UAVs) to leverage aerial computing for large-scale monitoring and recognition of agricultural diseases. By incorporating Spatial Pyramid Pooling (SPP), CBAM, ghost modules, and additional convolutional layers into the network, the resulting UAV Tiny YOLO Rice (UAV T-YOLO-RICE) model was trained on a custom rice leaf disease dataset. The model achieved a testing mAP of 86%, outperforming all other models in prior studies, thus demonstrating its effectiveness in real-world agricultural disease detection scenarios. He et al. [31] proposed an improved method for corn leaf pest and disease detection based on the YOLOv11 framework. The approach first integrates the RepLKNet module to enhance the model’s ability to represent disease and pest features. Then, the CBAM attention mechanism is incorporated into the neck network to improve feature extraction accuracy. Finally, the detection head is enhanced with DynamicHead and the Weighted IoU (WIoU) loss function to improve both the detection precision and localization performance. The experimental results indicated that the proposed model achieved improvements of 4.9% in accuracy and 9.0% in recall compared to the baseline model.
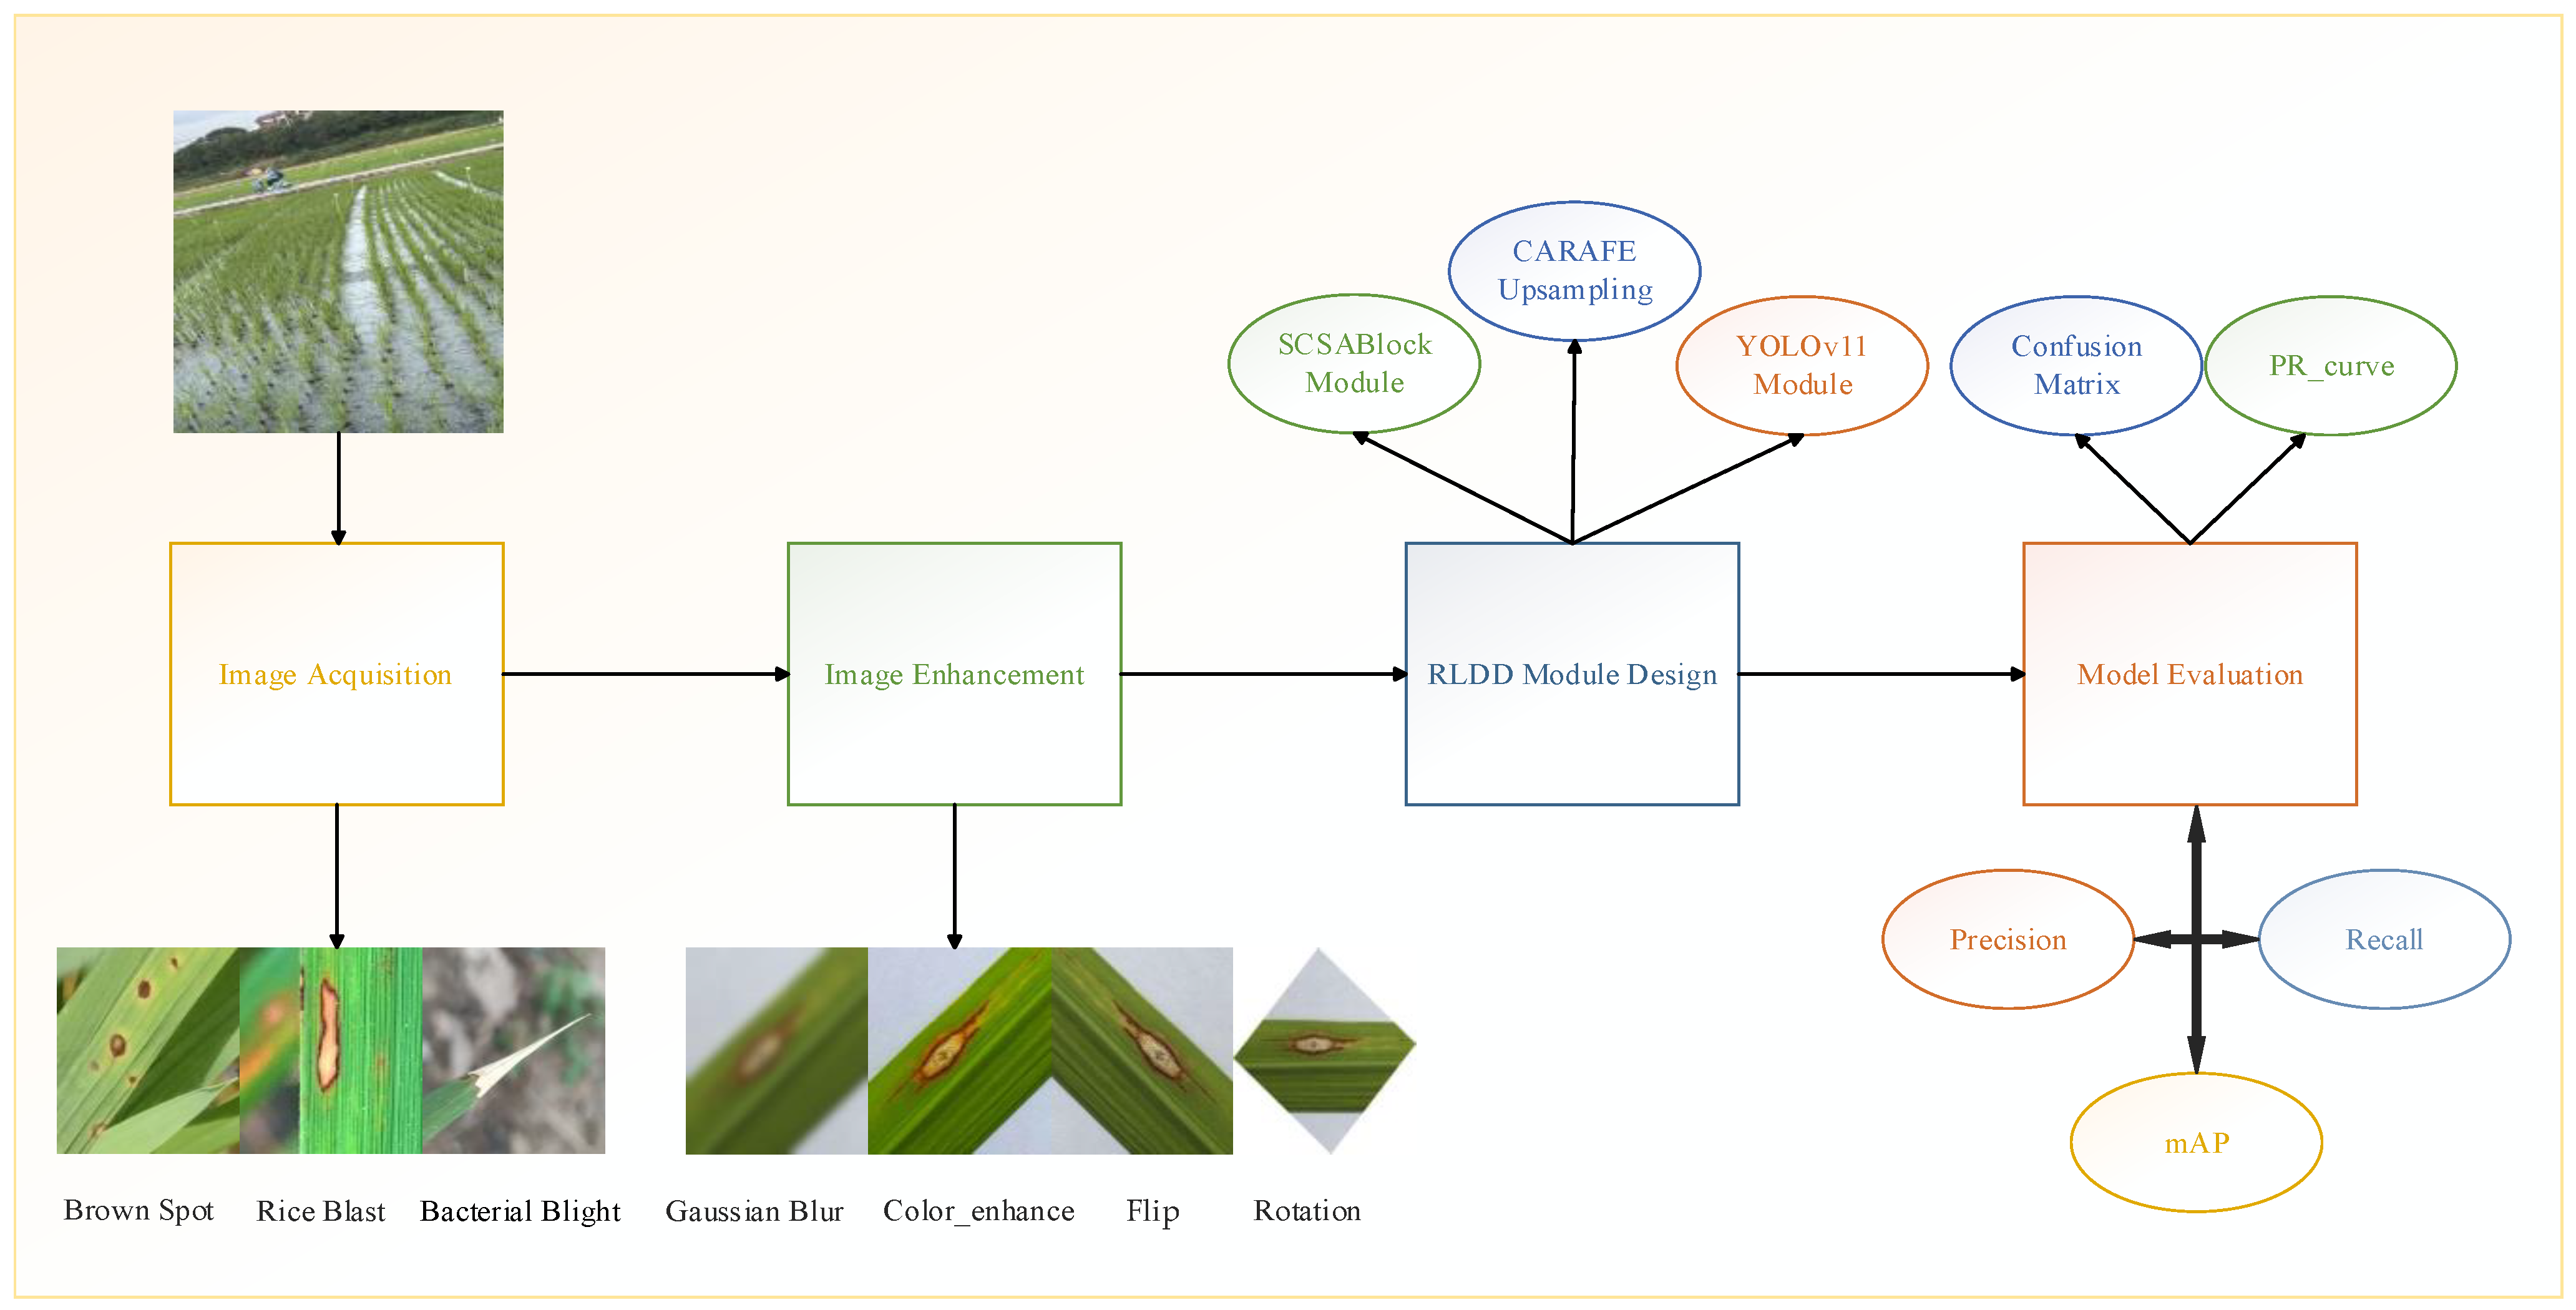
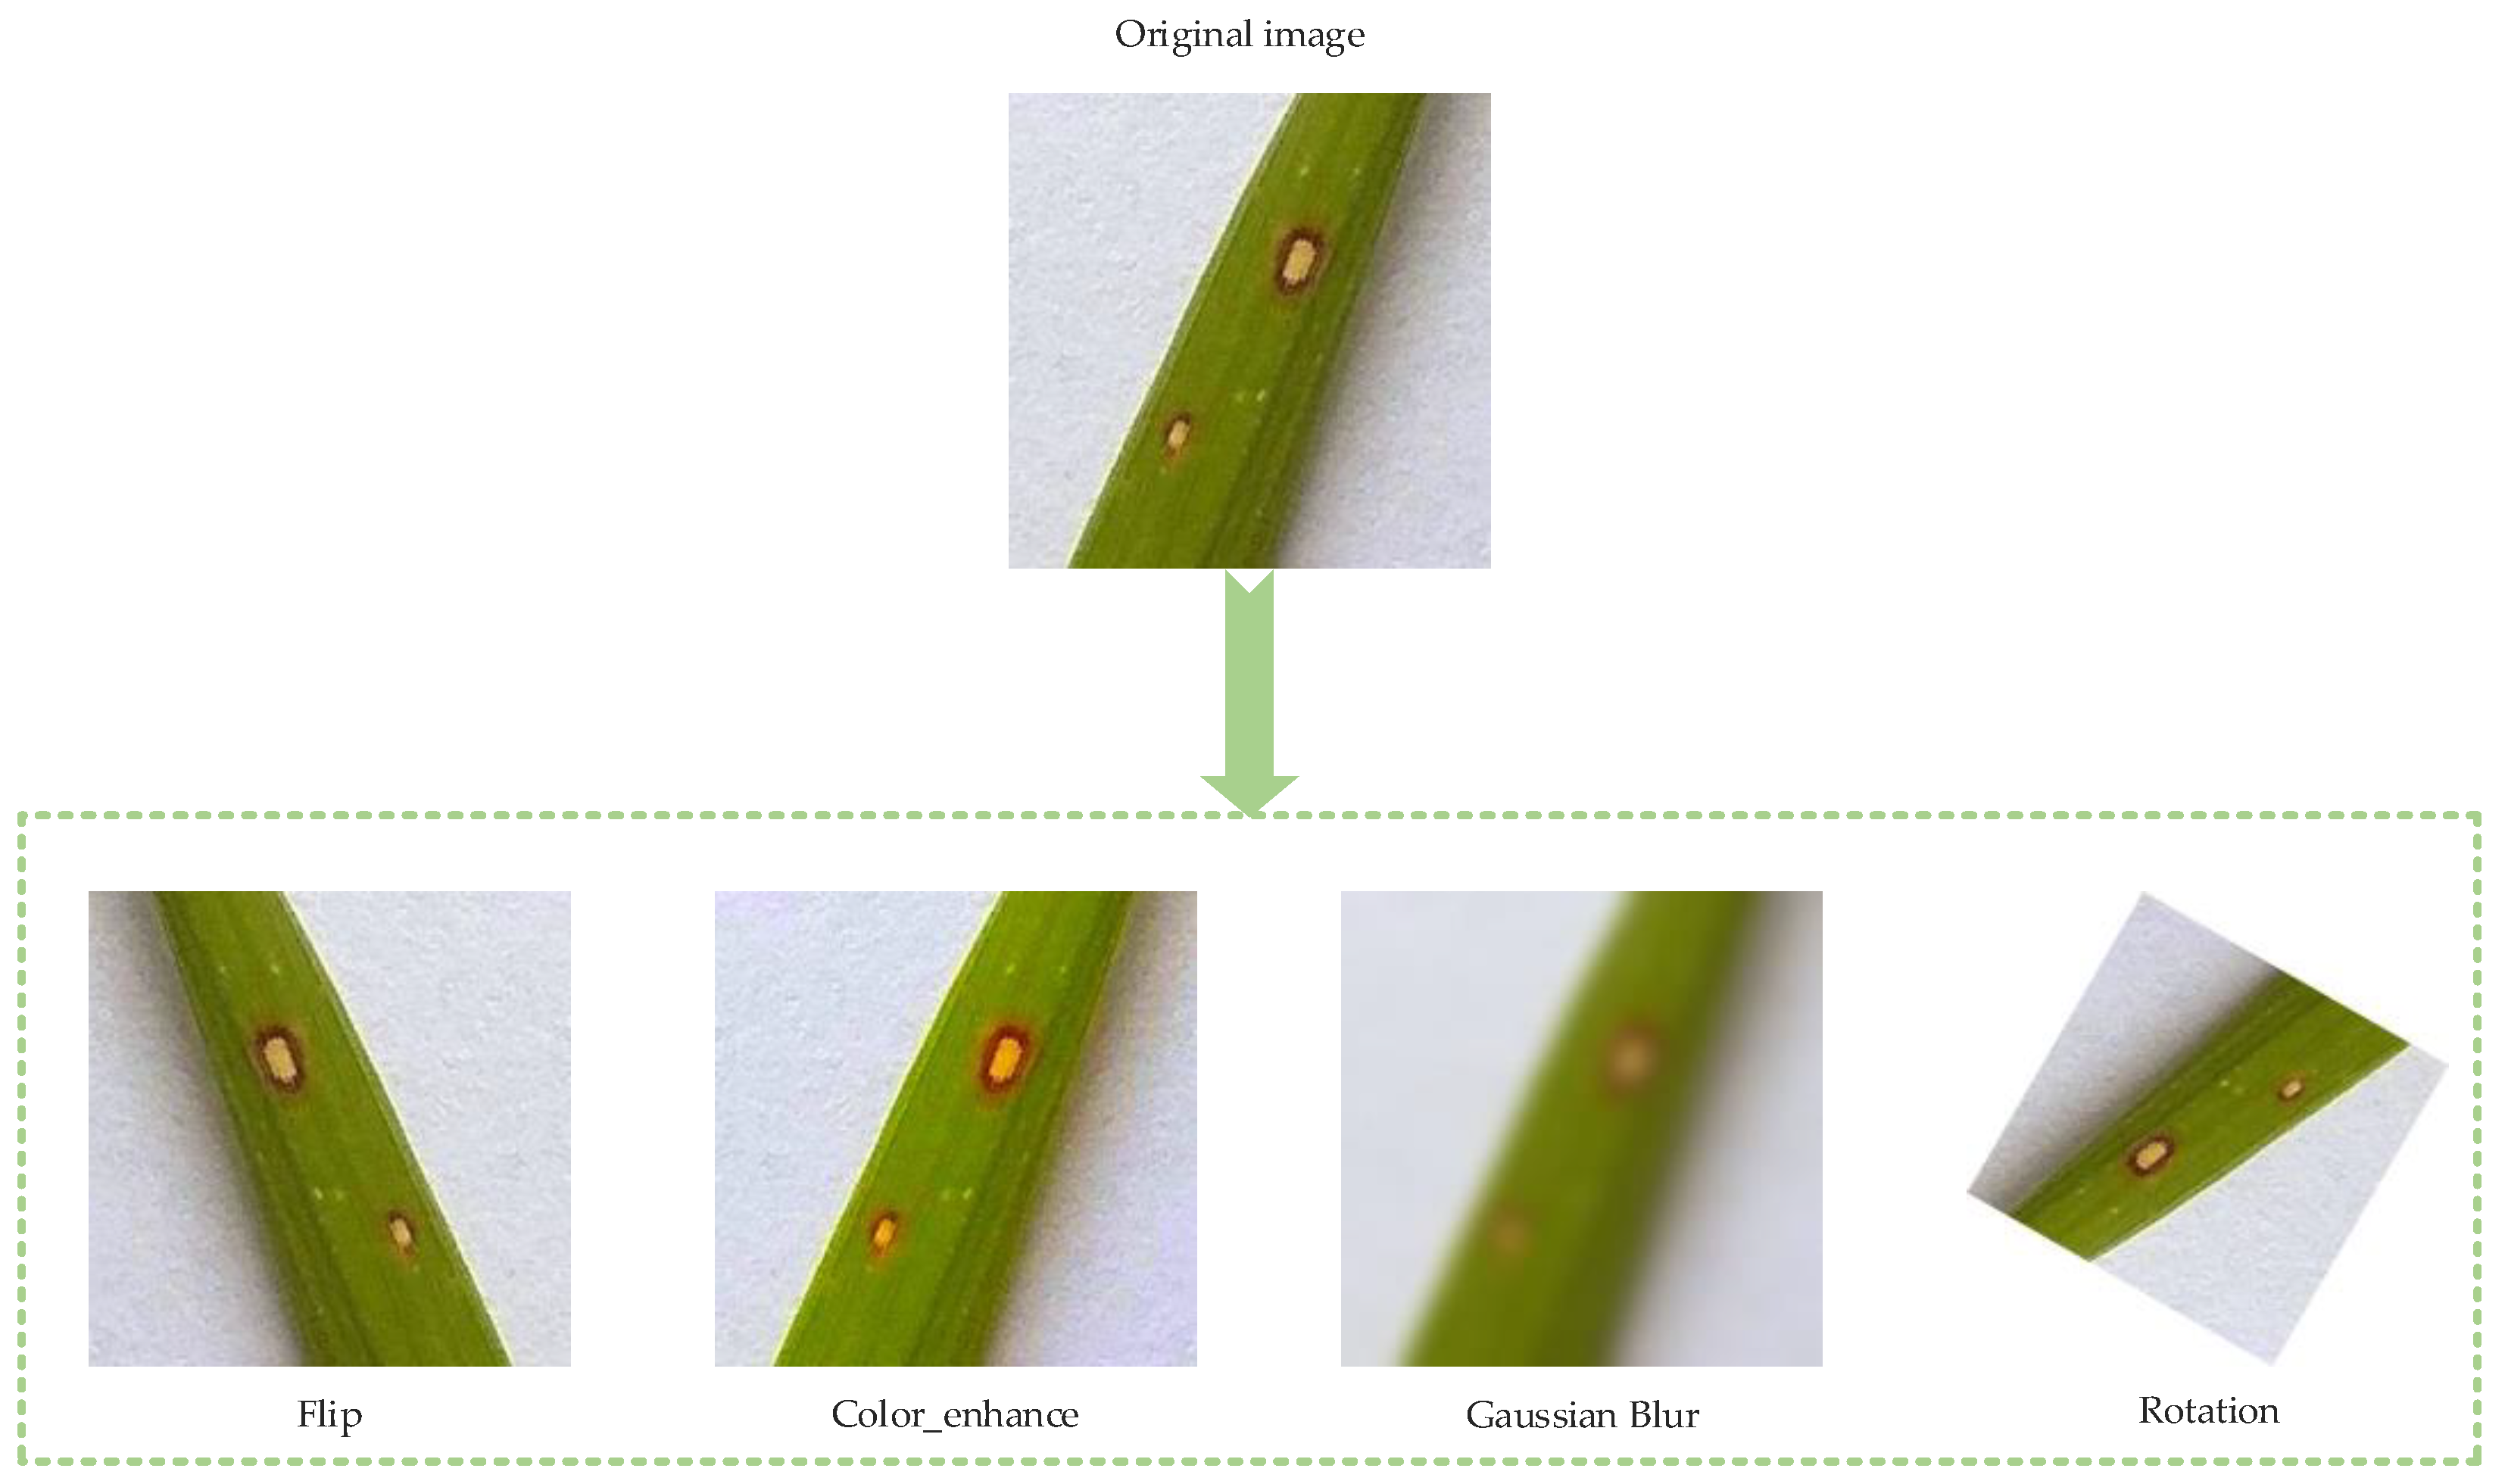
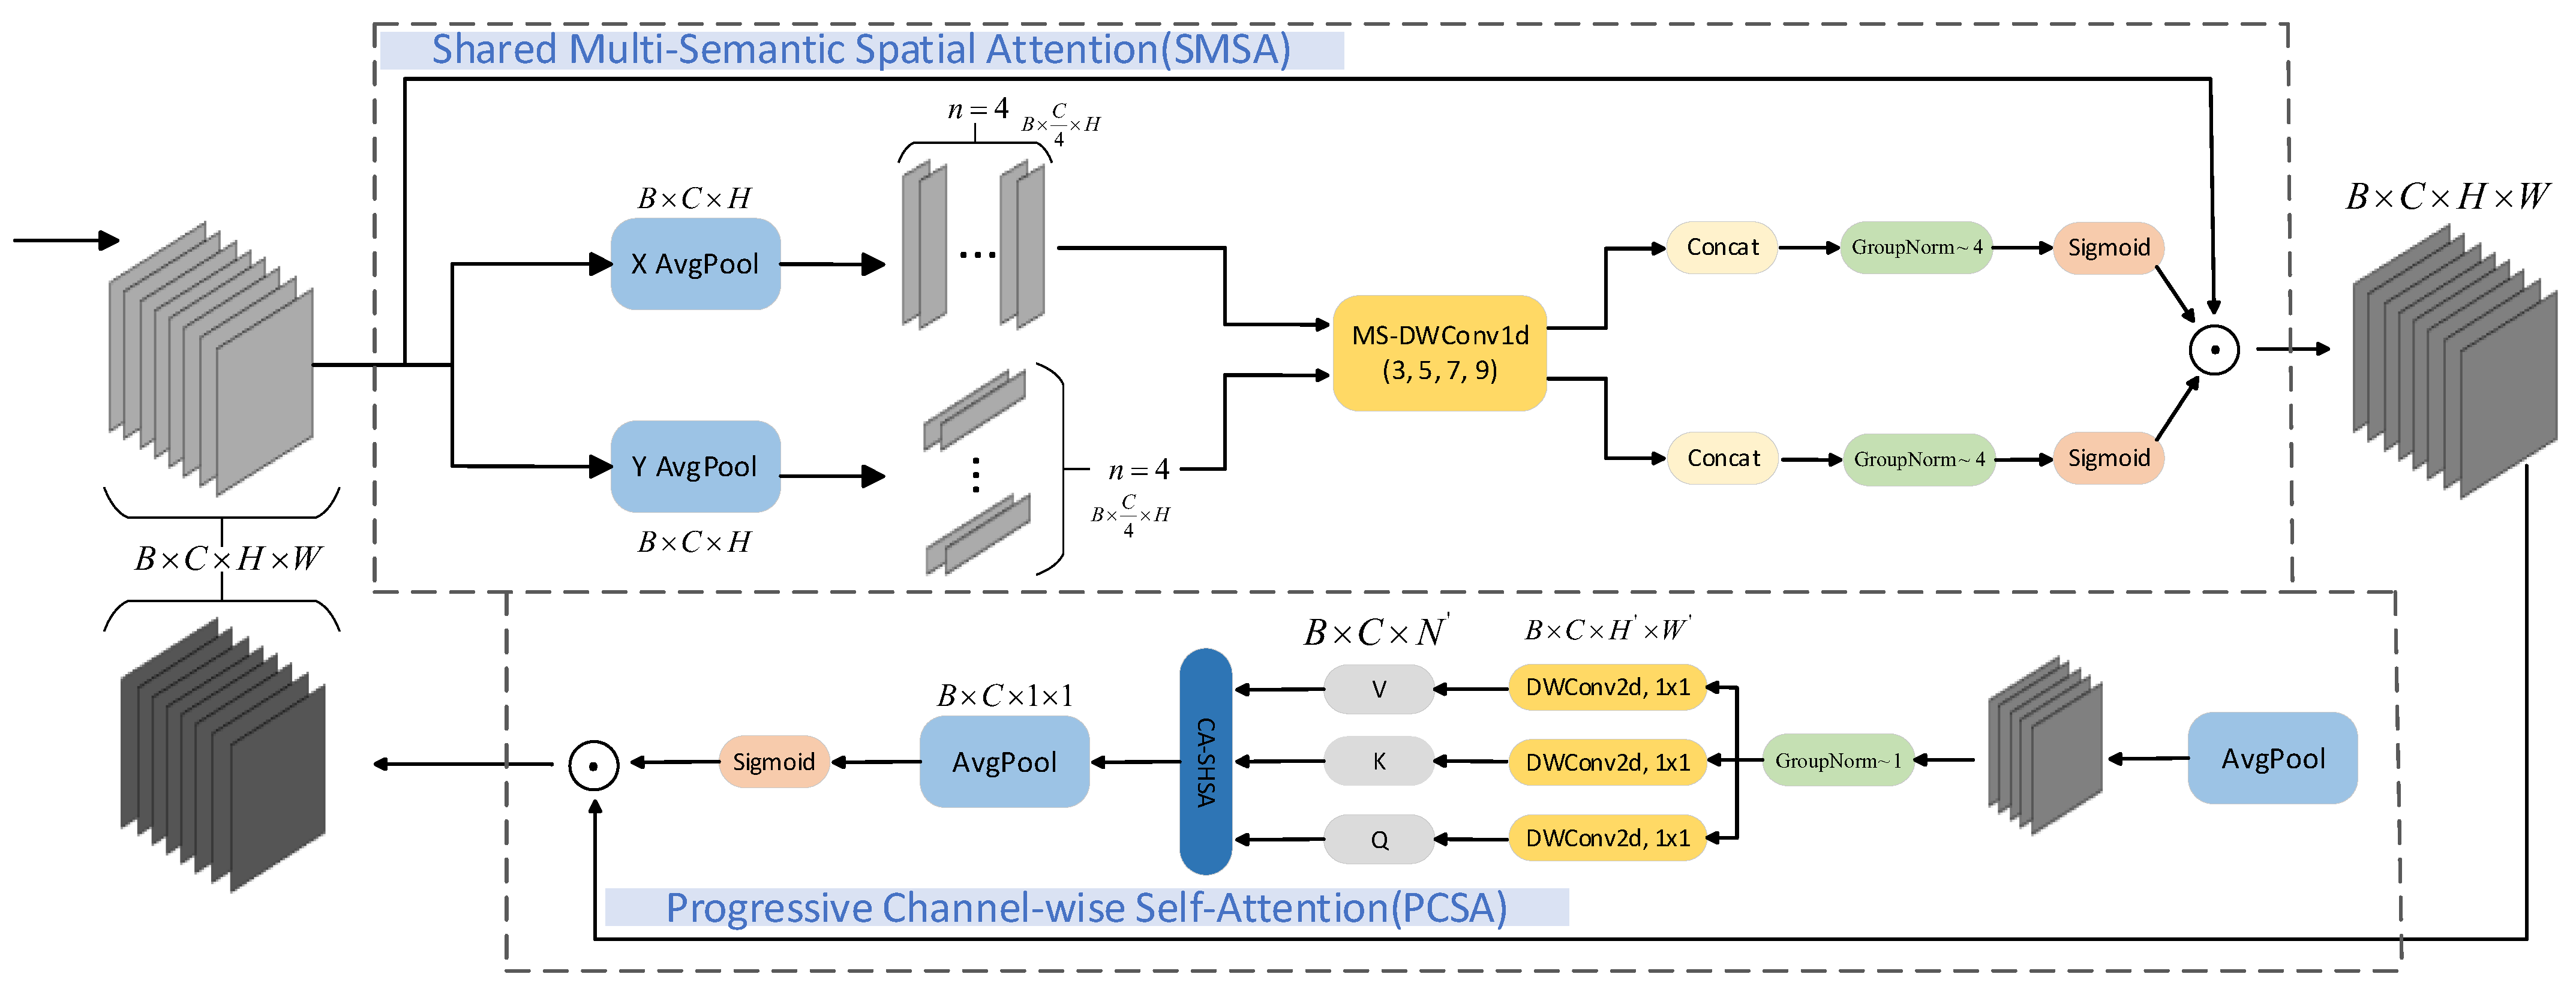
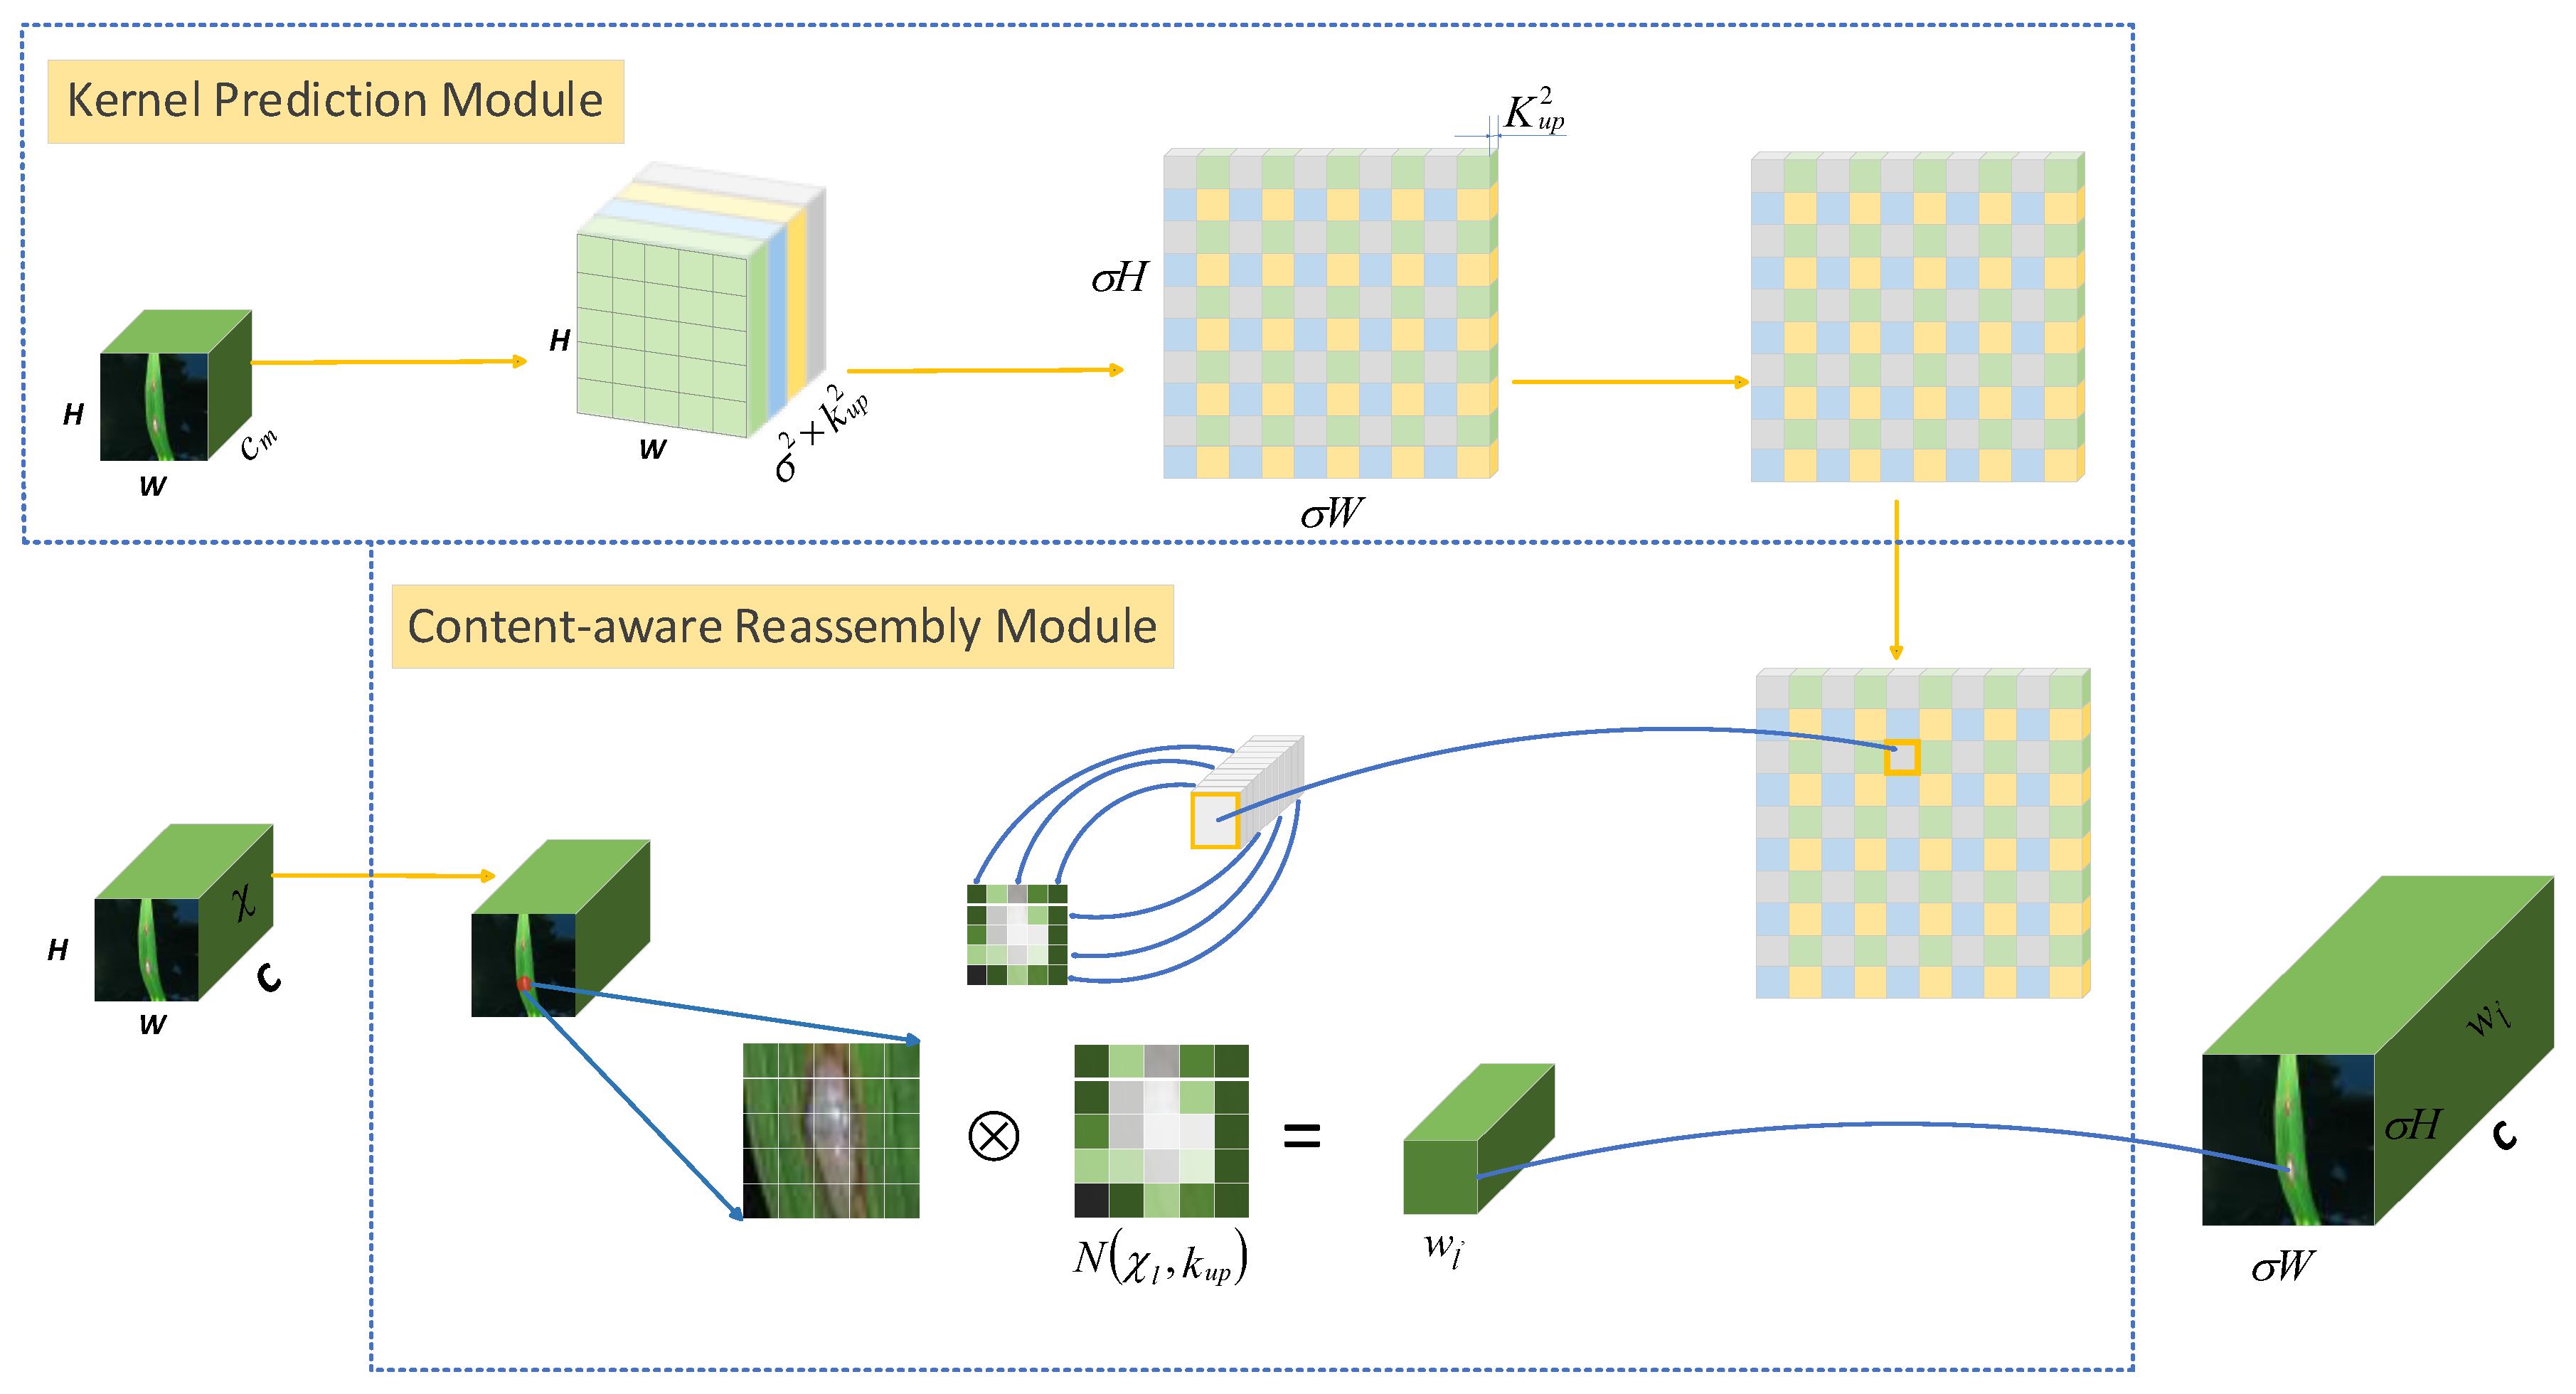
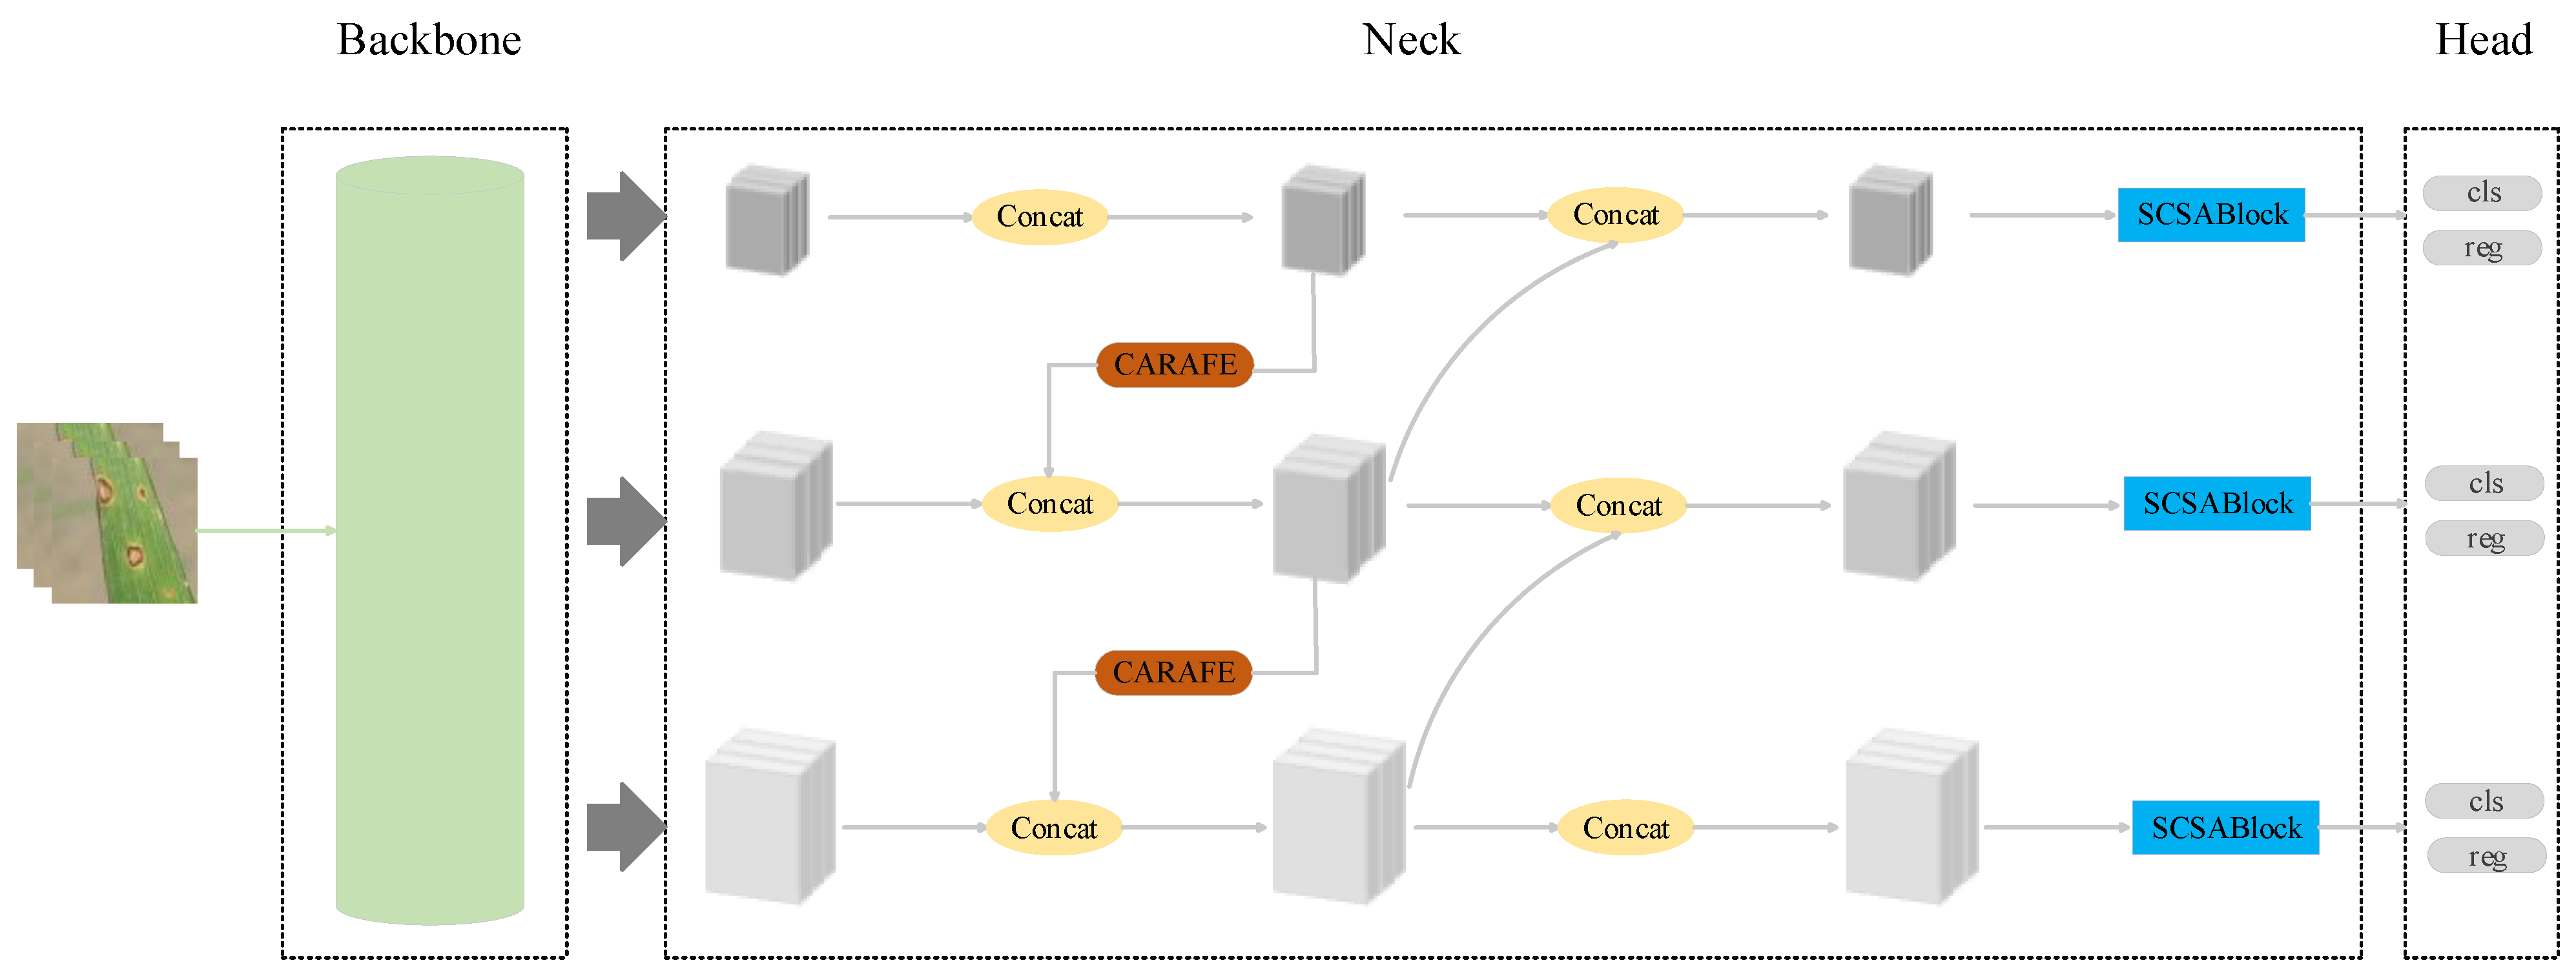
Currently, traditional manual inspection methods are inefficient and susceptible to subjective factors, making them inadequate to meet the demands of modern agricultural production. In recent years, deep-learning-based object detection techniques have achieved significant progress in the field of agricultural disease identification; however, challenges such as insufficient detection accuracy, high model complexity, and difficulties in practical application remain. To address these issues, this study proposes a rice leaf disease detection model, RLDD-YOLOv11n, based on the YOLOv11n framework, aiming to improve the detection accuracy and real-time performance of rice leaf disease identification, overcome the shortcomings of existing methods in practical applications, and provide effective technical support for precise agricultural disease management. The results demonstrate that the proposed model exhibits a strong performance in rice leaf disease recognition tasks. The main contributions of this study are as follows: (1) The integration of the Residual Attention (SCSABlock) module at each object detection output location. SCSABlock combines the SCSA attention mechanism and residual structure to facilitate multi-semantic information fusion, thereby improving recognition accuracy. (2) Replacing the traditional upsampling module with the CARAFE upsampling module effectively restores fine image details, which effectively recovers fine image details. (3) A rice leaf disease dataset was constructed to validate the effectiveness of the model.

2. Materials and Methods

2.1. Overview of the Research Methodology

Figure 1 illustrates the overall technical framework of this study, encompassing four core components: image acquisition, image augmentation, model construction, and performance evaluation. First, high-quality leaf images exhibiting Brown Spot, Rice Blast, and Bacterial Blight were collected from rice fields to establish a representative and diverse disease sample database. Subsequently, various image augmentation techniques, including Gaussian blur, color enhancement, and geometric transformations (flipping and rotation), were applied to increase data diversity and improve model generalization. The model design is based on the advanced YOLOv11 framework, innovatively integrating the CARAFE upsampling module and the SCSA Block module to optimize feature representation and spatial information recovery, thereby enhancing detection accuracy and robustness. During the model evaluation phase, multiple metrics such as Precision, Recall, and mAP were employed. Combined with the confusion matrix and PR curve, a systematic and comprehensive quantitative analysis of the model performance was conducted to ensure scientific rigor and evaluation reliability.

2.2. Image Acquisition and Enhancement

2.2.1. Image Acquisition

Due to the wide variety of rice leaf diseases and their characteristics of rapid outbreak and short epidemic cycles, large-scale and systematic collection of disease images presents significant challenges [32]. Therefore, this study focuses on three representative types of rice leaf diseases: Bacterial Blight, Rice Blast, and Brown Spot. Relevant attributes are listed in Table 1. The experimental data consist of two parts: data collected from web scraping and field collection. The field data collection was conducted in 2024 at the Rice Research Base of the Hunan Academy of Agricultural Sciences in China. Under natural cultivation conditions, rice leaf disease images were captured using an iPhone 14 Pro. Relevant sample images are shown in Figure 2.

2.2.2. Image Enhancement

To mitigate the impact of class imbalance on model training, this study applied targeted image augmentation techniques. A series of image enhancement methods were employed, including Gaussian blur, rotation, horizontal flipping, and color augmentation, as illustrated in Figure 3. Combined with the original images, the final dataset comprised 2318 images in total. All images were divided into training, validation, and test sets at a ratio of 6:2:2. Detailed data distribution is presented in Table 2.

2.3. RLDD Module Design

2.3.1. YOLOv11 Model

YOLOv11 [33] is a versatile deep learning framework that integrates multiple tasks, including object detection, instance segmentation, pose estimation, and oriented object detection. The model is available in five variants—n, s, m, l, and x—all of which adhere to a unified network architecture design.
The YOLOv11 framework consists of three main components: the backbone, the neck, and the detection head. The backbone is responsible for extracting multi-scale image features and comprises the following key modules. C3K2 Module: As the core feature extraction unit, the C3K2 module employs a series of 3 × 3 small-kernel convolutions to partition and reconstruct feature maps, thereby optimizing the information flow and significantly enhancing the feature representation capability. Fast Spatial Pyramid Pooling (SPPF) [34] Module: The optimized SPPF structure accelerates training, reduces redundant gradient information, and improves the overall learning efficiency of the network. Convolutional Block with Pyramid Spatial Attention (C2PSA): The C2PSA module incorporates multi-head attention within the C2f mechanism, similar to the Polarized Self-Attention (PSA) [35] mechanism. This design ensures that the model effectively focuses on spatial information, further enhancing the feature extraction capabilities. The neck adopts a Path Aggregation Network (PAN) [36], which effectively fuses features at different scales, improving the model’s ability to detect objects of varying sizes. The PAN structure enhances interactions between low-level and high-level features, thereby strengthening the detection of small objects. In the detection head, YOLOv11 employs a decoupled structure to separately process classification and regression tasks, thereby improving detection accuracy. Specifically, the classification branch utilizes binary cross-entropy (BCE) loss, ensuring precise classification performance. The regression branch integrates distribution-focal loss and extended intersection over union (EIoU) loss, which jointly enhance bounding box localization accuracy and improve the model’s robustness. Furthermore, YOLOv11 incorporates a consistent dual sample assignment strategy to ensure a more reasonable division of positive and negative samples, thereby enhancing the detection stability and generalization capability. The initial YOLOv11 network architecture used in this study is illustrated in Figure 4.

2.3.2. SCSABlock Module

In the neck structure of YOLOv11n, the original feature fusion approach, while effective in integrating multiscale information, inadequately emphasizes the small and scattered spot features that are critical for rice leaf disease recognition, thereby potentially degrading the overall performance. To address this issue, this study introduces the SCSABlock module after the 16th, 19th, and 22nd layers of the neck, thereby enhancing the extraction of multi-semantic information. Specifically, the SCSABlock combines the Spatial and Channel Synergistic Attention (SCSA) [37] mechanism with a residual bottleneck structure, leveraging self-calibrated spatial attention to amplify key region features while preserving original information through residual connections. Consequently, the model is able to more precisely focus on disease regions during feature fusion, which improves the accuracy of small spot detection without compromising information flow or training stability. Experimental results demonstrate that this enhancement significantly improves the mAP for rice leaf disease detection while maintaining a superior inference speed. The structure of the SCSA is illustrated in Figure 5.
The SCSA attention module consists of two components, as illustrated in Figure 3. The first is the Shared Multi-Semantic Spatial Attention (SMSA) module, which investigates the effectiveness of multi-semantic information guidance. Given an input feature map of size B × C × H × W, where B denotes the batch size, C is the number of channels, and H and W represent the height and width of the feature map, respectively, the global average pooling (X AvgPool) is first applied. The resulting features are then split along the height (H) and width (W) dimensions into four equal and independent sub-feature maps, denoted as X(i,w). The sub-feature decomposition process is as follows:
X H i = X H : , i 1 × C K : i × C K , :
X W i = X W : , i 1 × C K : i × C K , :
Next, each group of sub-features is processed by MS-DWConv1d, a multi-scale depthwise separable 1D convolution, to extract information from different receptive fields. The implementation is defined in Equations (3) and (4). Subsequently, the outputs from all groups are concatenated, followed by group normalization and sigmoid activation to generate spatial attention weights, which are then applied to the original features via element-wise multiplication to obtain the spatial attention map. The calculation of the output features is given in Equations (5)–(7).
X H i = D W C o n v 1 d k i C K C K X H i
X W i = D W C o n v 1 d k i C K C K X W i
A t t n H = σ G N H K C o n c a t X H 1 , X H 2 , , X H K
A t t n W = σ G N W K C o n c a t X W 1 , X W 2 , , X W K
S M S A X = X s = A t t n H × A t t n W × X
Following this is the Progressive Channel-wise Self-Attention (PCSA) module, with the detailed implementation provided in the following equation. The target feature map first undergoes sigmoid activation and average pooling to obtain global channel-wise statistical information, which guides the subsequent attention computation. Then, CA-SHSA is employed to compute self-attention, where DWConv2d is used to generate the query (Q), key (K), and value (V) representations, improving computational efficiency and reducing complexity. Finally, the enhanced feature is produced through group normalization and attention-based weighting.
X p = P o o l 7 , 7 H , W H , W X s
F p r o j = D W C o n v 1 d 1 , 1 C C
Q = F p r o j Q X p , K = F p r o j K X p , V = F p r o j V X p
X a t t n = A t t n Q , K , V = S o f t max Q K T C V
P C S A X s = X c = X s × σ P o o l H , W H , W 1 , 1 X a t t n

2.3.3. CARAFE Upsampling Module

YOLOv11n adopts the nearest neighbor interpolation method for upsampling. This approach extracts the grayscale value of the nearest pixel situated among the adjacent pixels surrounding the sampling point, albeit neglecting the influence emanating from other pixels. While this algorithm possesses simplicity, it is susceptible to inducing jagged edges or lines, consequently compromising the quality of the upsampling image and, in turn, impacting detection accuracy. Counteracting this, CARAFE [38] emerges as a lightweight upsampling operator. It predicts the respective upsampling kernel for each position by using the input feature map and then carries out feature recombination according to the predicted upsampling kernel to complete the upsampling operation. This approach hinges upon feature content, transcending the dependence on positional distance. The outcome of this process leads to a feature map enriched with heightened semantic information, thus rendering CARAFE-facilitated upsampling as an advantageous conduit for preserving the nuanced characteristics of rice leaves.
The CARAFE upsampling module consists of two steps, as shown in Figure 6. Its initial stride involves the kernel prediction module. Herein, each targeted position generates a content-aware reassembly kernel. The process initiates with a 1 × 1 convolution layer that undertakes dimensionality reduction, reducing the channel count from C to Cm. Cm signifies the number of channels in the feature layer following dimensionality reduction, as shown in Equation (13):
C m = σ 2 k u p 2
where σ is the upsample ratio and k u p is the size of reassembly kernel. Subsequently, employing PixelShuffle, the feature map reshapes into kup2 × σH × σW, thereby generating the reassembly kernels. A concluding step sees normalization being applied to each reassembly kernel. The ensuing phase, the content-aware reassembly module, ushers the feature map into its fold. This module orchestrates a multiplication of features on each layer’s feature map with the content-aware reassembly module. The resultant outcome encapsulates the upsampled result, effectively culminating in the completion of the upsampling.

2.3.4. Improved YOLOv11n Network Architecture

As a representative of single-stage object detection algorithms, the YOLO series has attracted significant attention due to its favorable balance between accuracy and speed. Considering the requirements for real-time performance and accuracy in rice disease detection, this study selects the lightweight YOLOv11n as the baseline model. The model features a compact architecture and high computational efficiency, making it suitable for resource-constrained environments. YOLOv11n streamlines the inference process, demonstrating a strong stability and generalization capability. Moreover, it has shown consistent performance across multiple benchmark tests and possesses considerable application potential, thus making it an appropriate foundational architecture for this study.
To further improve feature representation and the efficiency of cross-scale information interaction, SCSABlock was introduced into the neck structure of YOLOv11n, aiming to strengthen the fusion and transmission of multi-semantic information and, thus, enhance the detection of small target diseases. In addition, to address the limitations of the original upsampling module in detail reconstruction, a content-aware CARAFE upsampling mechanism was incorporated, effectively improving the quality of image detail reconstruction. The final improved model architecture is shown in Figure 7.

2.3.5. Model Evaluation Criteria

To comprehensively and objectively evaluate the performance of our model in this paper, we used a confusion matrix (Shown in Table 3) for comprehensive evaluation.
TP represents correct detection—the prediction of the model is positive and the actual value is also positive. FN represents detection error—the prediction of the model is negative and the actual value is positive. FP represents detection error—the prediction of the model is positive, but the actual value is negative. TN represents correct detection—the model prediction is negative and the actual value is also negative.
The expressions of precision and recall are as follows:
P r e c i s i o n = T P T P + F P R e c a l l = T P T P + F N
In the evaluation of the rice leaf disease detection performance, AP is the integral over the precision−recall curve and represents the average precision, and mAP is the average of all species of all rice leaf disease. AP and mAP are formulated as follows:
A P = 0 1 P r e c i s i o n R e c a l l R e c a l l d R e c a l l
m A P = 1 N i = 1 N A P i
where N is the number of species of rice leaf disease.

3. Results

3.1. Experimental Platform and Parameter Settings

To verify the effectiveness of the improved method proposed in this paper, ablation studies were implemented. The baseline of each experiment is the YOLOV11n model. Thereafter, an overall performance evaluation of the proposed model is discussed.
The proposed rice leaf disease detection model is implemented on PyTorch 1.8 and uses NVIDIA for training and testing. The SGD (Stochastic Gradient Descent) optimizer is adopted with an initial learning rate set to 0.1, which effectively improves convergence stability in the later stages of training and enhances the final model performance. The momentum factor is set to 0.937 and the weight decay coefficient is 0.0005 to suppress overfitting and accelerate gradient updates. The input image size is fixed at 320 × 320 pixels, which balances detection accuracy while significantly reducing the model’s computational resource consumption. The batch size is set to 16, which maintains gradient update stability and improves training efficiency under the memory constraints of the current GPU (RTX 2080 Ti). The total number of training epochs is 200, ensuring sufficient iterations for the network to capture key features and prevent underfitting. The hardware and software platform used for training includes an Intel Xeon E5-2680v3 CPU and an RTX 2080 Ti GPU, with the environment configured as CUDA 11.2 and PyTorch 1.8, which meets the requirements for model training. The specific training parameters and configurations are shown in Table 4.

3.2. Ablation Experiment

To assess the specific impact of each module on the model’s performance, this study conducted ablation experiments to verify the effectiveness of the SCSABlock attention module and the CARAFE upsampling module within the YOLOv11n architecture. As shown in Table 5, the baseline YOLOv11n model achieved AP@0.5 scores of 0.906 for Brown Spot, 0.676 for Rice Blast, and 0.984 for Bacterial Blight, with an overall mAP@0.5 of 0.855 and mAP@0.95 of 0.547. After incorporating the SCSABlock module, detection accuracy for all disease categories improved, and the mAP@0.5 increased to 0.865. This validates the effectiveness of the attention mechanism in enhancing feature representation and improving feature focus. Subsequently, the CARAFE module was integrated into the original model to replace the conventional upsampling operation. This led to a further increase in mAP@0.5 to 0.876, indicating that the enhanced spatial information restoration contributed to more accurate localization of diseased regions.
The final proposed RLDD-YOLOv11n model, which integrates both the SCSABlock and CARAFE modules, achieved the best overall performance, with an mAP@0.5 of 0.883—an improvement of 2.8% over the baseline—and an mAP@0.95 of 0.607. These results further demonstrate the synergistic effect of the two modules in significantly improving the model’s ability to perceive fine-grained disease features. From the perspective of individual class metrics, RLDD-YOLOv11n achieved an AP of 0.969 for Brown Spot, 0.699 for Rice Blast, and 0.982 for Bacterial Blight, reflecting a strong adaptability and stable detection performance across all disease types. However, RLDD-YOLOv11 achieved an AP@0.5 of 0.699 for the Rice Blast category, which is relatively lower compared to other disease categories. This phenomenon is mainly attributed to the short infection cycle and scattered distribution of Rice Blast, resulting in a limited number of field-collected samples. To supplement the dataset, some images were sourced from the internet; however, these images often suffer from low resolution and blurred features. Additionally, the visual similarity between Rice Blast and Brown Spot increases the difficulty of discrimination for the model, thereby affecting the detection performance. In summary, the ablation study results clearly demonstrate the advantages of the introduced modules in enhancing information interaction and feature reconstruction, further highlighting the superior performance and practical value of RLDD-YOLOv11n in the task of rice leaf disease detection.

3.3. Comparison of the Results of Different Models

To validate the overall performance advantages of the proposed RLDD-YOLOv11n model in the task of rice leaf disease detection, a series of comparative experiments were conducted using several mainstream object detection models. These include the two-stage detection algorithm Faster R-CNN, as well as lightweight one-stage detection models such as YOLOv5s, YOLOv7, YOLOv8n, YOLOv10n, and YOLOv11n.
As shown in Table 6, the RLDD-YOLOv11n model demonstrates a superior performance across all evaluation metrics. With a model size of only 2.58 MB and a computational complexity of just 6.3 GFLOPS, it achieves a precision of 91.6%, a recall of 83.8%, and a mAP@0.5 of 88.3%, significantly outperforming other models in terms of overall performance. Compared to the baseline YOLOv11n model, it improves precision by 4.9 percentage points and mAP@0.5 by 2.8 percentage points, fully demonstrating a favorable balance between detection accuracy and computational efficiency.
Faster R-CNN, as a classical two-stage detection algorithm, performs reasonably well in recall (84.9%) and mAP@0.5 (79.9%), but its precision is only 68.8%. Moreover, it has a large model size of 82.1 MB and a high computational cost of 120.7 GFLOPS, making it unsuitable for deployment in resource-constrained environments. In contrast, although YOLOv5s and YOLOv7 achieve high precision and mAP@0.5 (with precisions of 88.9% and 86.0%, and mAP@0.5 values of 86.9% and 86.6%, respectively), they also incur considerable model sizes and computational costs (7.01 MB/15.8 GFLOPS and 36.8 MB/103.5 GFLOPS, respectively). Lightweight models such as YOLOv8n and YOLOv10n offer smaller model sizes (3.0 MB and 2.69 MB, respectively), but their detection precision and recall rates are notably lower, limiting their applicability in high-precision agricultural disease detection tasks.
In summary, RLDD-YOLOv11n improves detection performance while maintaining a lightweight architecture, demonstrating its application potential in intelligent agricultural disease monitoring and suitability for deployment in resource-constrained edge computing scenarios.
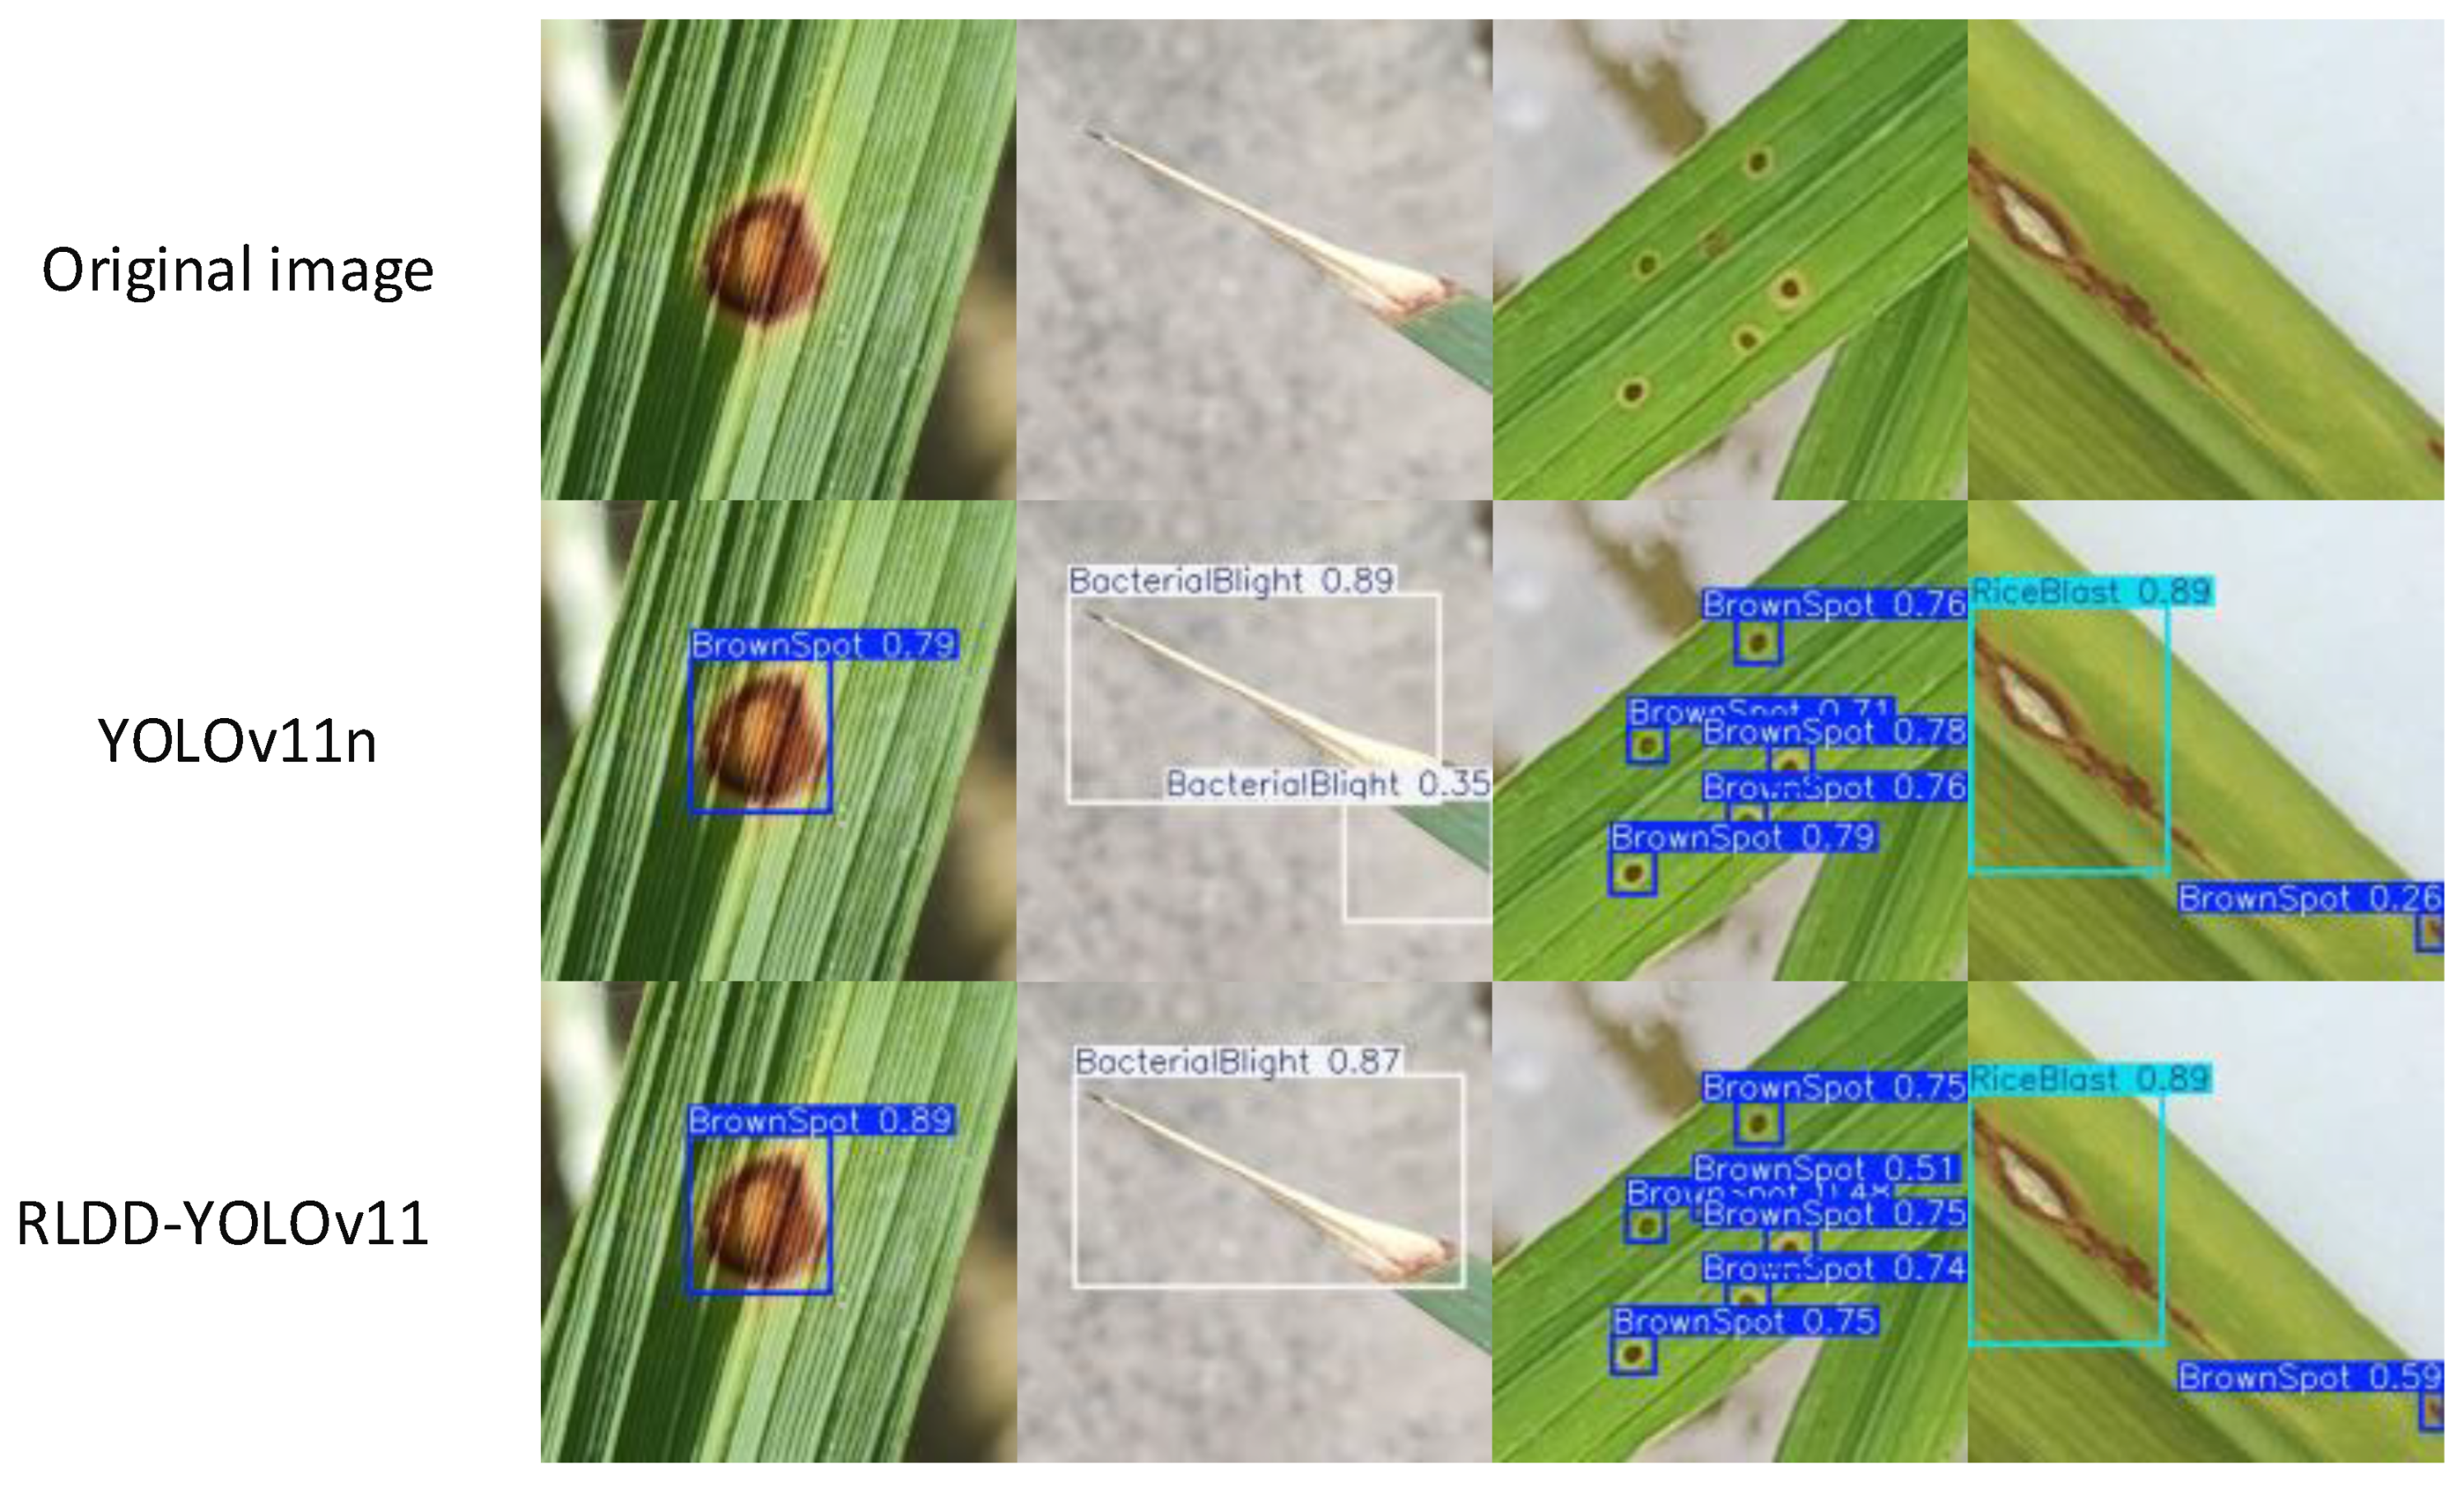
To validate the effectiveness of the proposed model in real-world application scenarios, Figure 8 presents a comparative analysis of detection results between YOLOv11n and RLDD-YOLOv11n on actual rice leaf images. In the first column, RLDD-YOLOv11n achieves a confidence score of 0.89 for typical Brown Spot symptoms, significantly outperforming YOLOv11n’s score of 0.79, indicating superior feature extraction and object recognition capabilities. The second column demonstrates that when lesion appearance closely resembles the background, YOLOv11n generates false detections, whereas RLDD-YOLOv11n successfully distinguishes between disease and background, reflecting higher robustness. In the third column, under densely distributed lesion conditions, RLDD-YOLOv11n achieves precise identification of all targets, while YOLOv11n exhibits missed detections. Finally, when multiple disease types are present in the same image, RLDD-YOLOv11n continues to provide higher-confidence predictions, confirming its enhanced multi-class recognition ability. In summary, RLDD-YOLOv11n exhibits a superior comprehensive detection performance in small object identification, background interference suppression, and multi-disease coexistence recognition.
Combining quantitative metrics and qualitative visualizations, RLDD-YOLOv11n achieves a favorable balance between detection accuracy and lightweight design, demonstrating greater robustness and deployment efficiency, particularly suitable for large-scale agricultural disease identification tasks in resource-constrained environments.

3.4. RLDD-YOLOv11n Detection Results Analysis

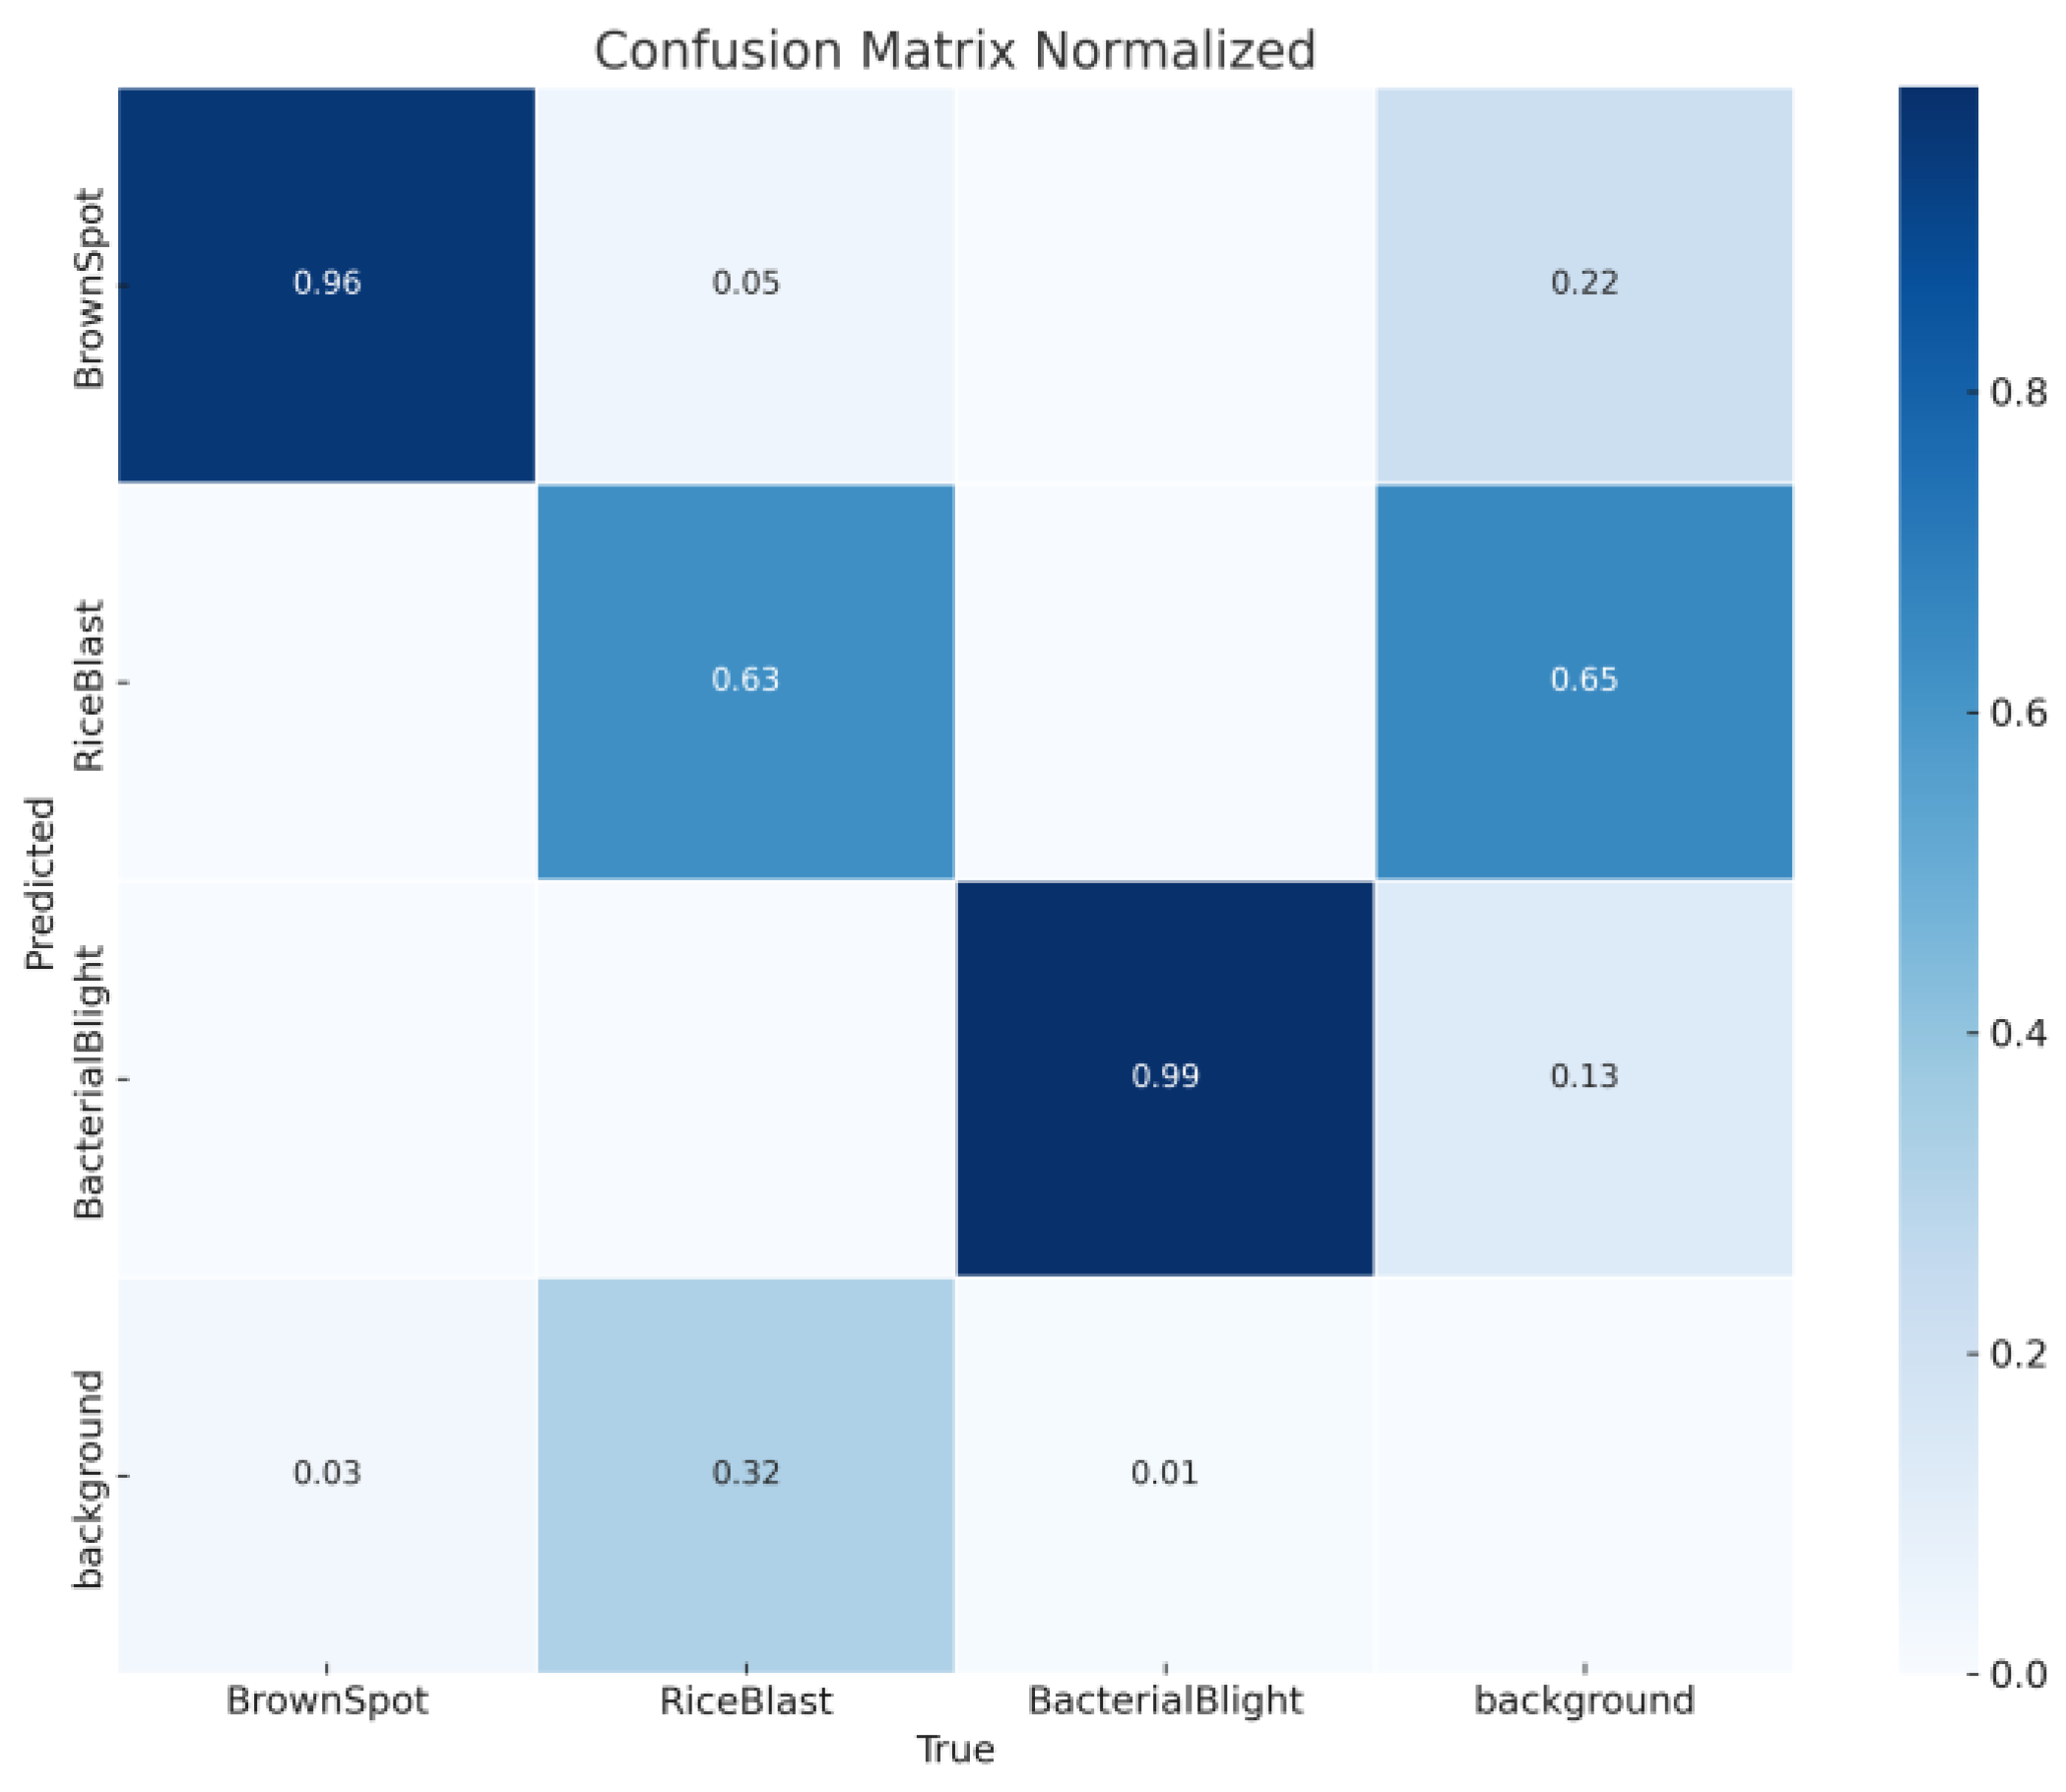
The confusion matrix is a vital tool in machine learning, offering a detailed analysis of classification performance by juxtaposing the predicted results with the ground truth. In this study, the primary objective of the confusion matrix is to rigorously evaluate the performance of RLDD-YOLOv11n. As shown in Figure 9, the Brown Spot class achieves 96% accuracy along the main diagonal; however, it exhibits a 3% false negative rate (Bacterial Blight misclassified as background) and a 22% background false positive rate (background misclassified as Bacterial Blight). These findings suggest the model’s limited sensitivity to early-stage symptoms and insufficient generalization to diverse background conditions. The classification accuracies for Rice Blast and Bacterial Blight both exceed 90%, confirming the model’s strong capability in capturing complex textured lesions. Nevertheless, cross-category errors between background and disease classes (e.g., 0.22, 0.03) reflect a bottleneck in fine-grained feature differentiation, which may be constrained by factors such as lighting variations or image resolution. In summary, the confusion matrix provides an intuitive visualization of RLDD-YOLOv11n’s strengths and weaknesses across different lesion types, highlighting both its advantages and the areas that require further improvement.
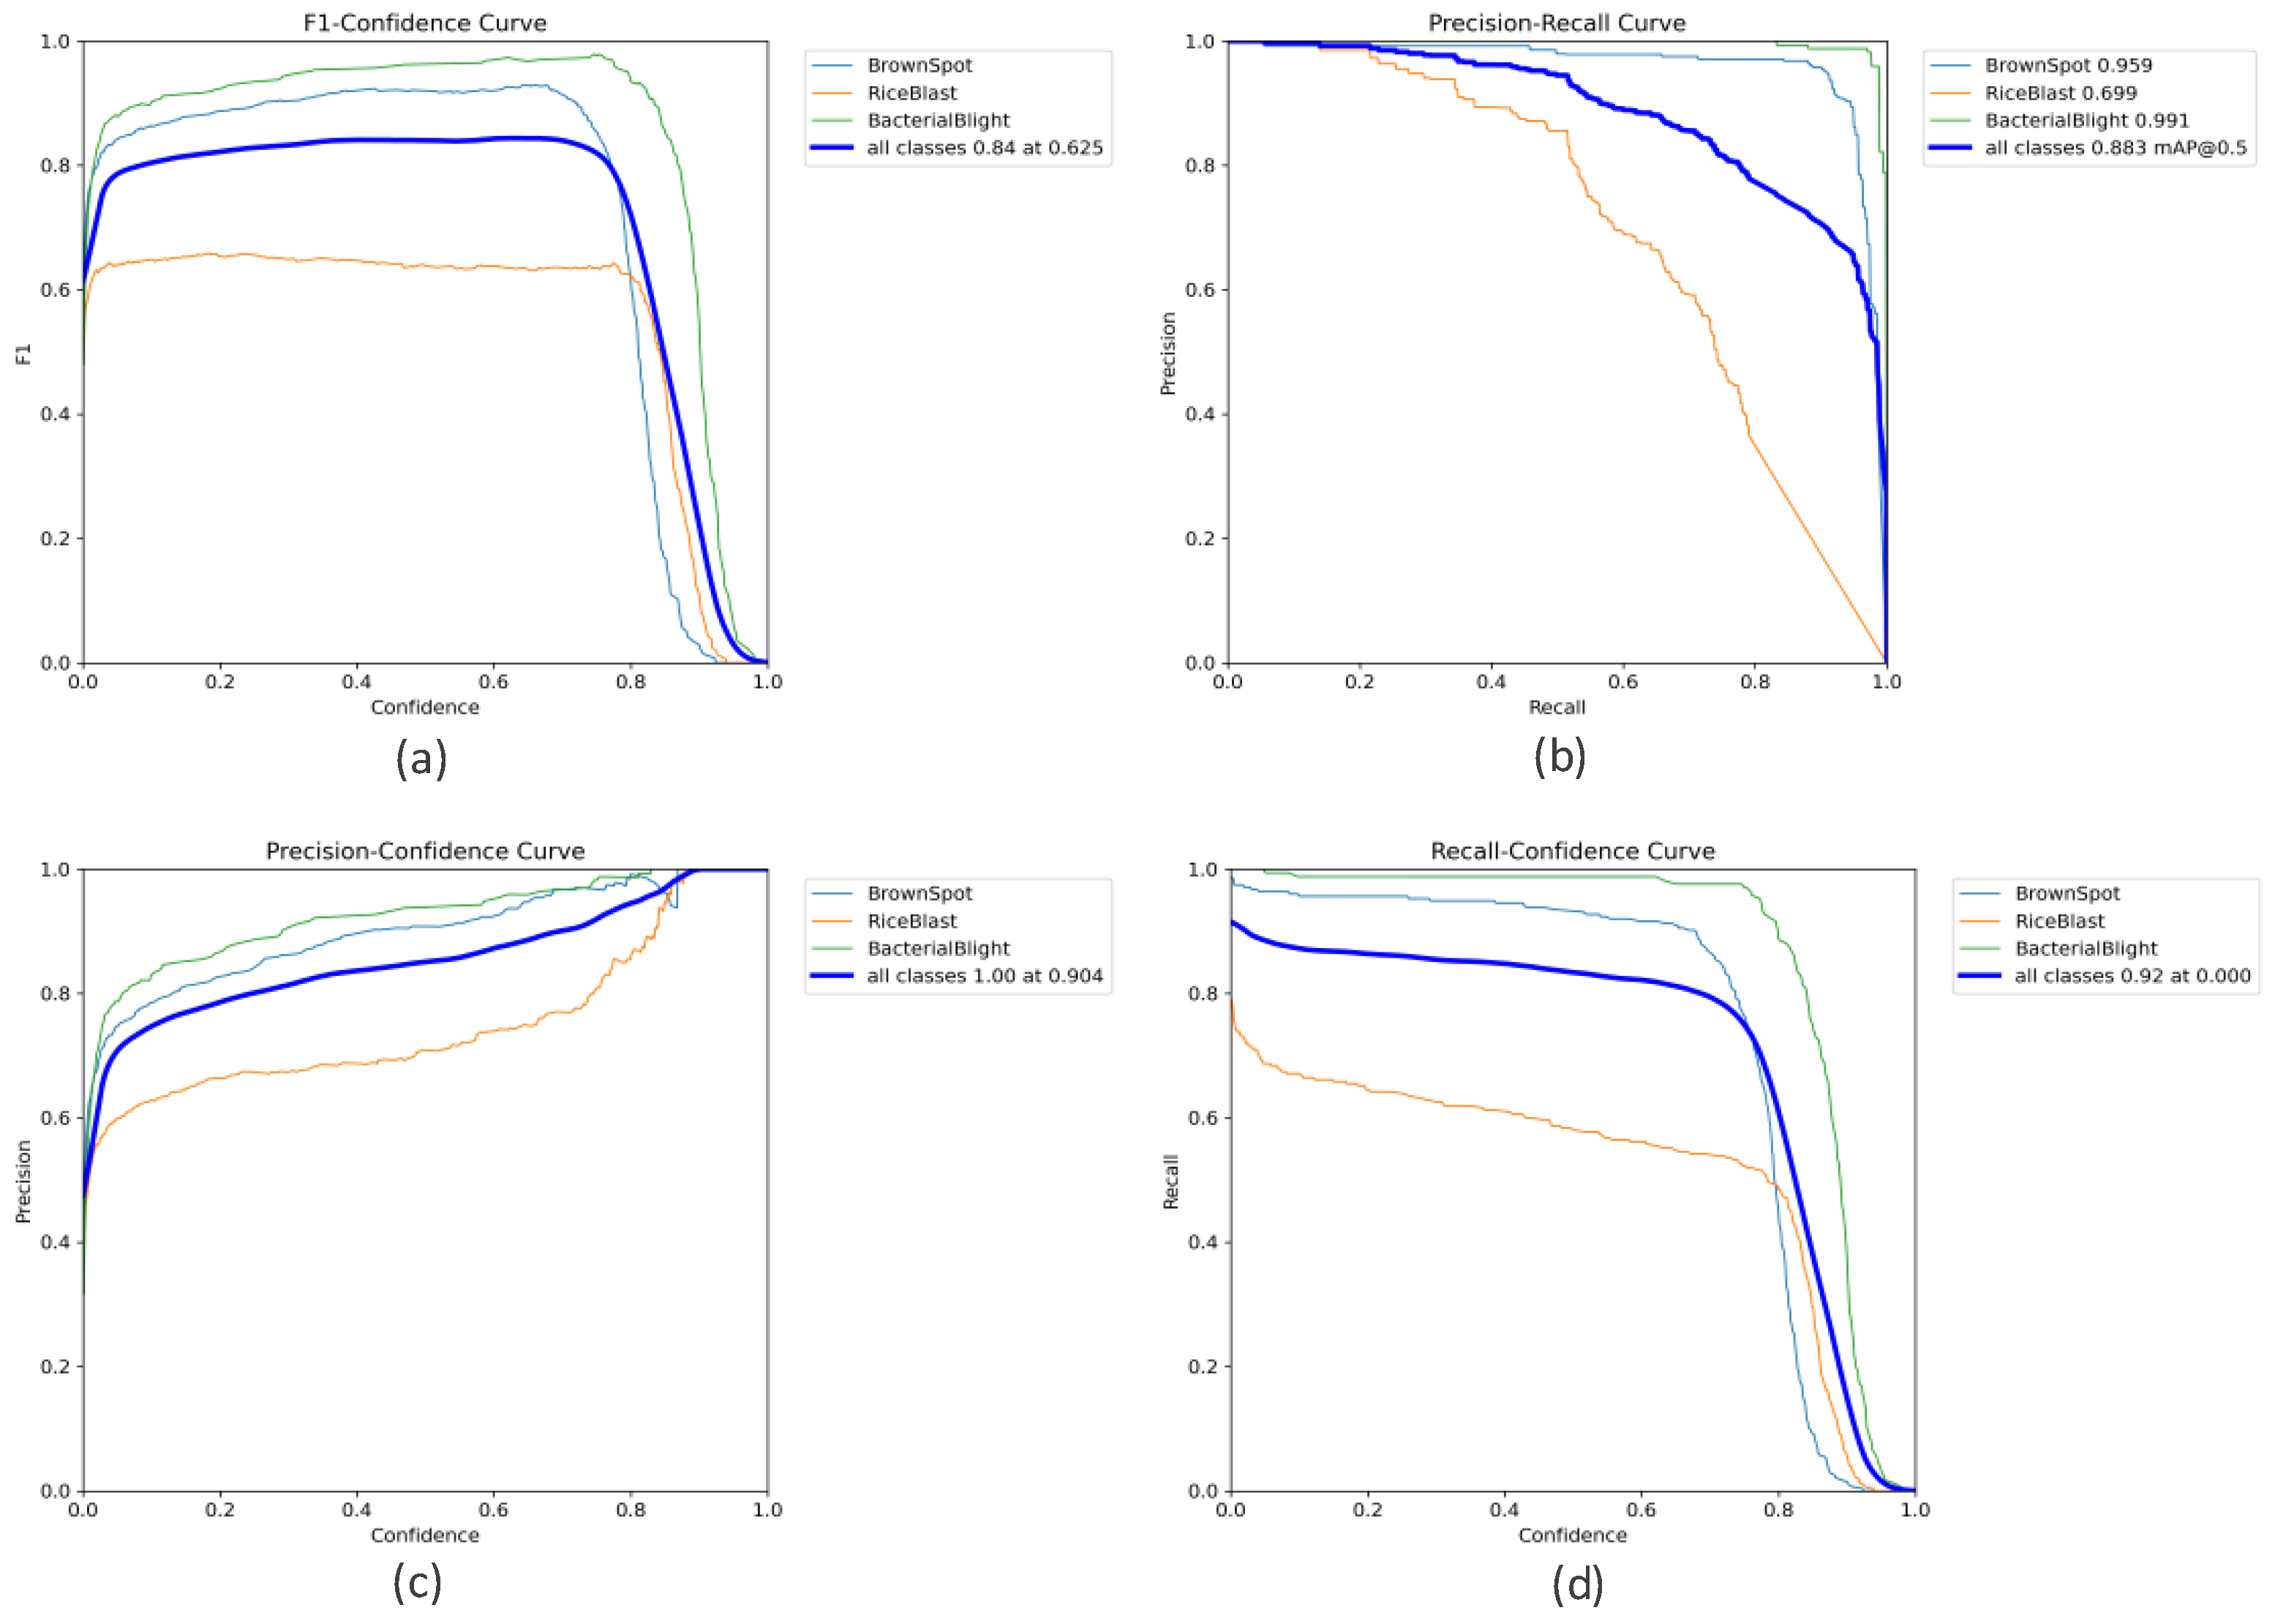
Figure 10 illustrates the performance of RLDD-YOLOv11n across multiple evaluation metrics. The F1−Confidence curve demonstrates that the model maintains a high F1 score even at high confidence thresholds, with a peak value of 0.84, outperforming the conventional YOLOv11n. This indicates a more optimal balance between precision and recall. The Precision−Recall curve further highlights the model’s high stability, particularly achieving an mAP@0.5 of 0.991 for the Bacterial Blight class and 0.959 for the Brown Spot class, suggesting that RLDD-YOLOv11n can more effectively distinguish between different disease categories and exhibits excellent class discrimination capabilities. Additionally, the Precision−Confidence and Recall−Confidence curves indicate that the model retains robust detection performance even under low-confidence conditions, reflecting a stronger generalization ability.
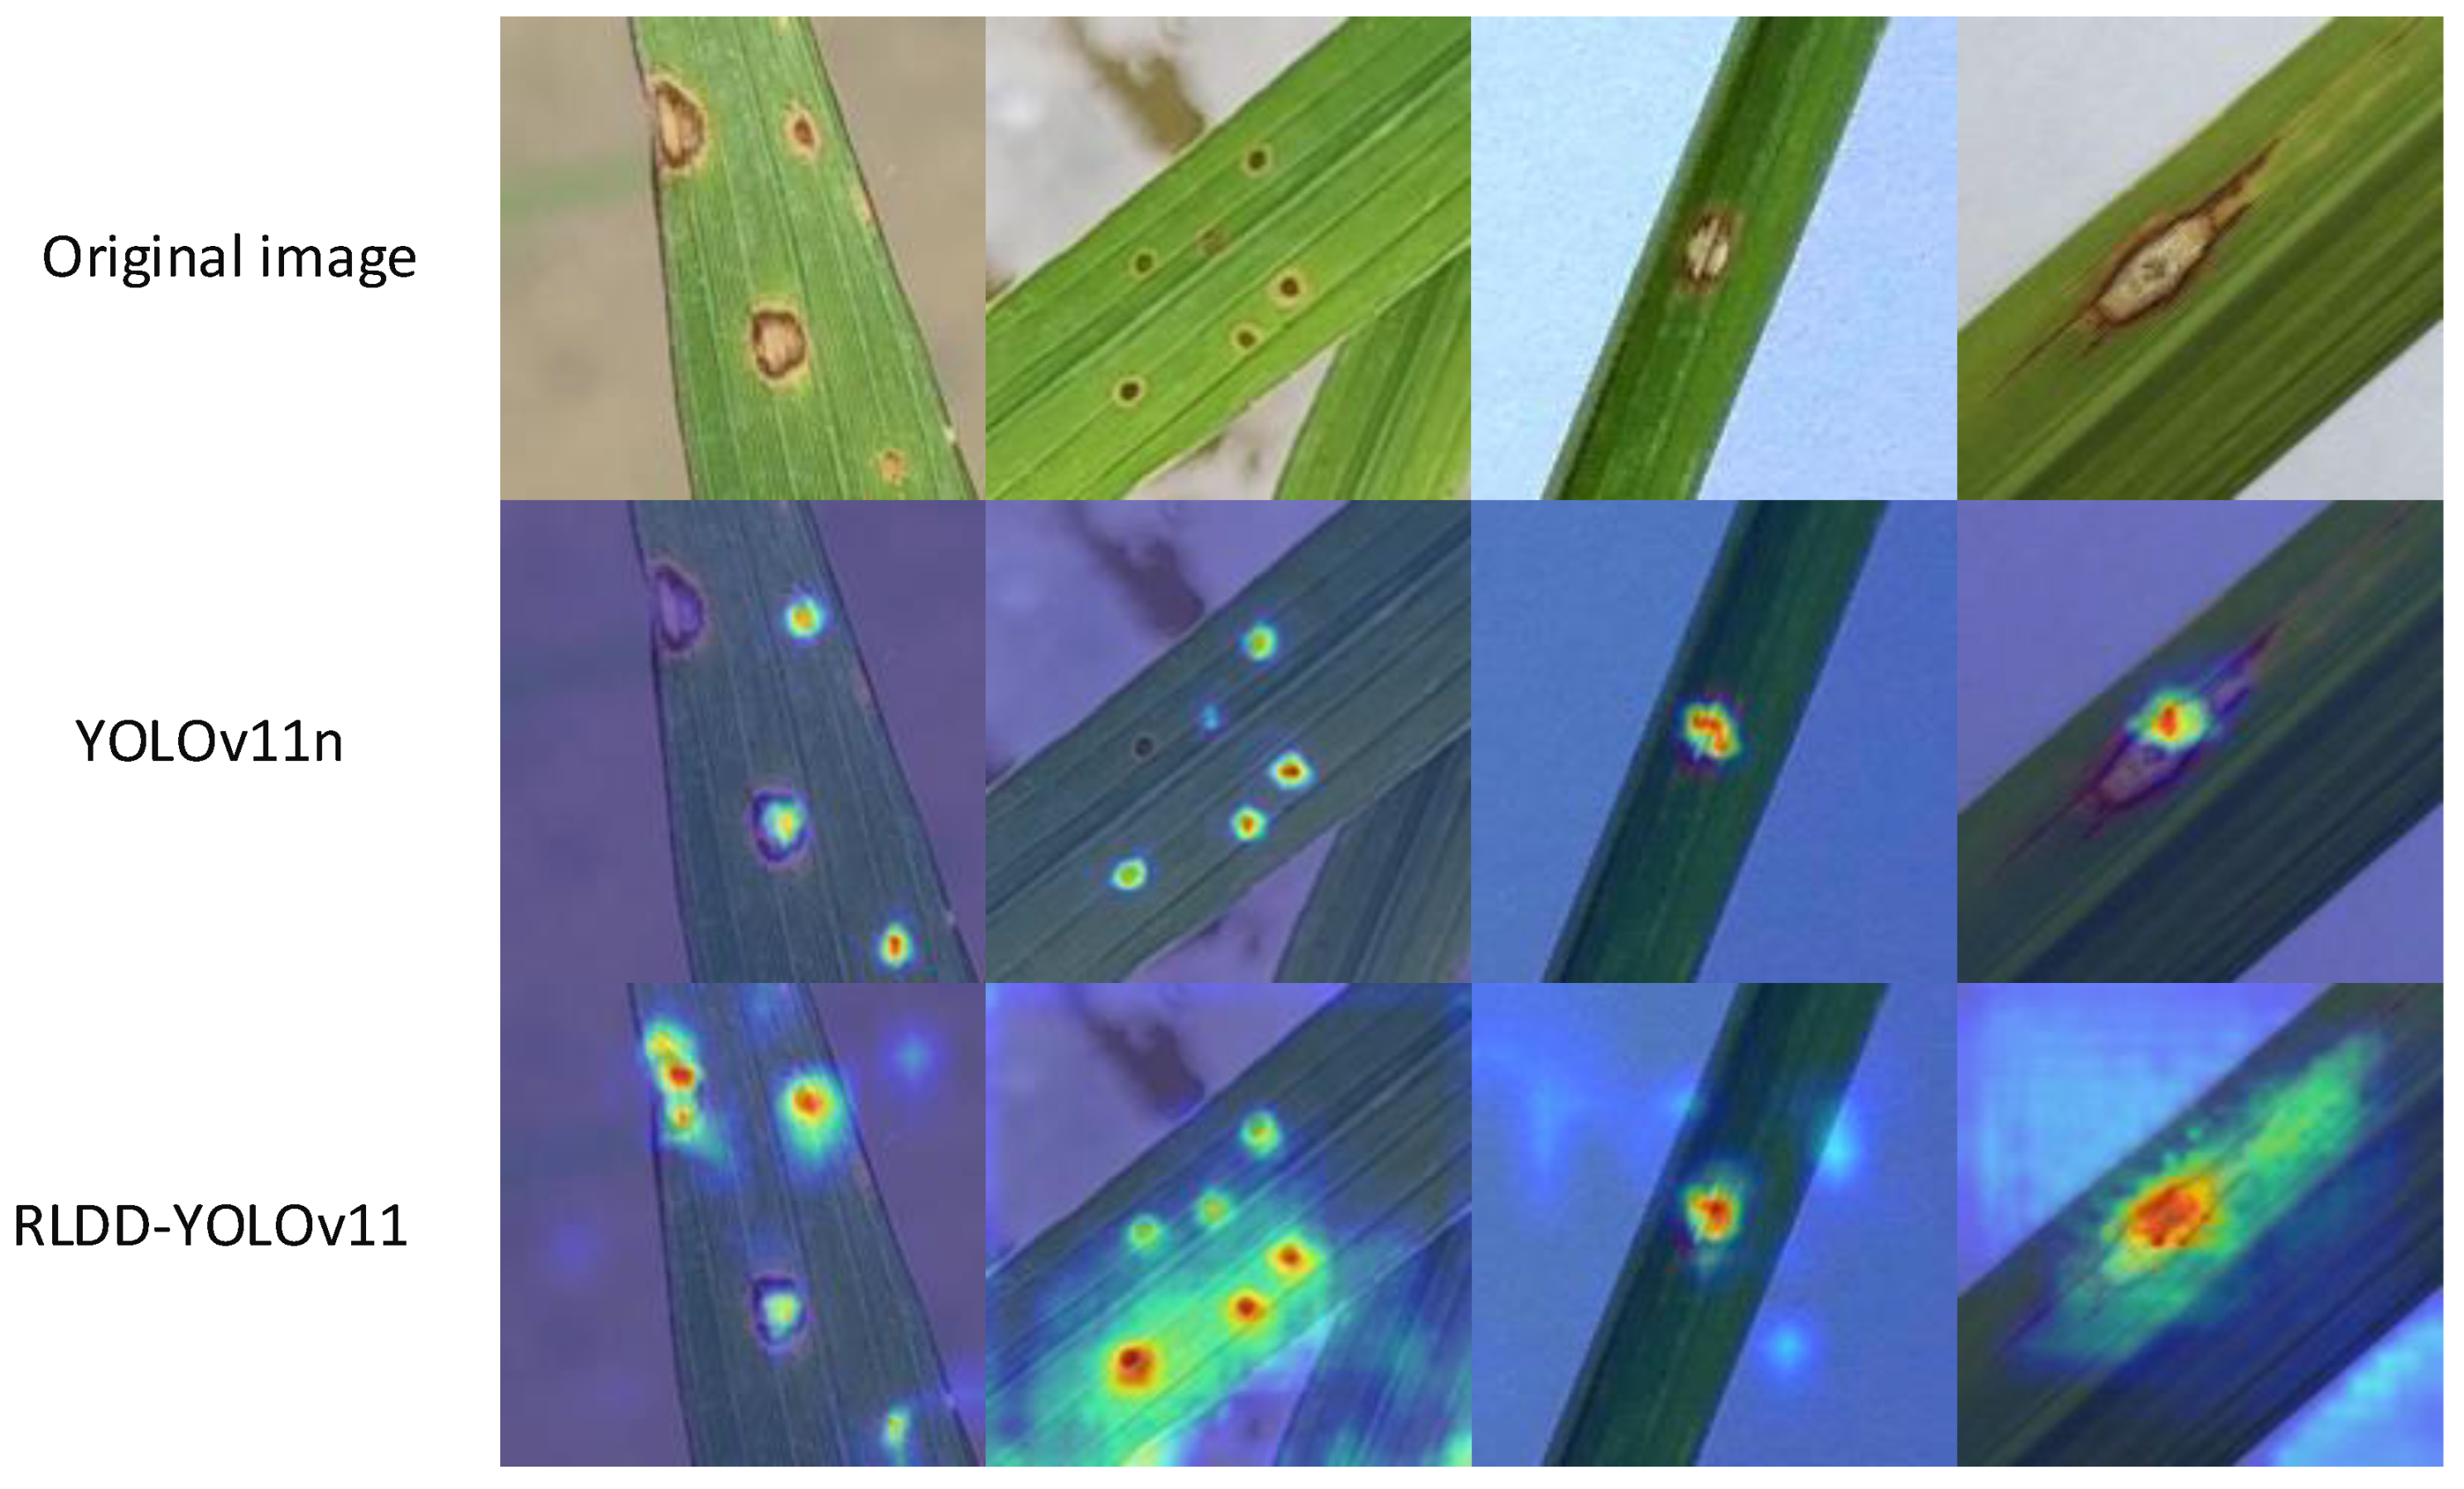
To further verify the model’s understanding and focus on semantic regions within images, Figure 11 visualizes the attention distribution on representative samples using Grad-CAM [39]. As shown in the visualizations, YOLOv11n’s heatmaps exhibit issues such as imprecise localization and attention drift, especially in cases with dense lesions or blurred edges, leading to an unstable performance. In contrast, RLDD-YOLOv11n accurately concentrates on key features within diseased areas. Its heatmaps show compact, well-defined attention regions that closely align with the actual lesion areas, demonstrating a superior spatial focus and fine-grained feature extraction capabilities. In the bottom-right image, the heatmap generated by RLDD-YOLOv11n not only covers the entire lesion, but also reasonably extends to the lesion’s boundaries, indicating more refined modeling of lesion morphology and edges.
In summary, the combined analysis of Figure 10 and Figure 11 confirms that RLDD-YOLOv11n significantly outperforms YOLOv11n in terms of numerical performance, perceptual visualization, and fine-grained target modeling. It is particularly well-suited for complex scenarios involving multi-class, multi-target dense detection of rice leaf diseases, showcasing enhanced robustness and practical applicability.

4. Discussion

4.1. Key Contributions

This study primarily addresses the challenges encountered in rice leaf disease detection, including the time-consuming and labor-intensive nature of manual detection, the significant differences between various disease categories, and the trade-off between model accuracy and complexity. First, by integrating residual bottleneck blocks and an SCSA, the fusion of multi-semantic information is enhanced, thereby improving the detection capability for small target diseases. Second, the CARAFE lightweight upsampling module is employed, utilizing intelligent feature map reconstruction to enhance the quality of feature map recovery and thereby improve detection accuracy. Finally, a rice leaf disease dataset was constructed based on the training data used in this study.

4.2. Comparison with Existing Methods

Compared with mainstream models in the YOLO series, RLDD-YOLOv11n improves detection performance while maintaining a lightweight structure. Compared to YOLOv7, it achieves a 1.7% improvement in mAP, with a 92% reduction in parameters and a 94% decrease in GFLOPs. Compared to YOLOv5, it reduces parameters by 63.2%, lowers GFLOPs by 60.1%, and improves mAP by 1.4%. Compared to YOLOv8n, it shows a 5% increase in mAP@0.5 and superior performance in mAP@0.95. Compared to YOLOv10n, mAP@0.5 and mAP@0.5:0.95 are improved by 12.9% and 18.4%, respectively. Furthermore, the RLDD-YOLOv11n model size is only 2.58 MB, smaller than that of the UAV T-YOLO-rice model [31] (3.12 MB), and it achieves a recall of 83.8% under complex back-grounds, surpassing the approximately 79.5% recall of UAV T-YOLO-rice, reflecting a superior lightweight design and robustness in complex environments.
To address the challenge of detecting small lesion areas in rice leaf diseases, the pro-posed RLDD-YOLOv11n model introduces CARAFE upsampling and the SCSABlock module, effectively enhancing multi-scale feature representation. Under the more stringent mAP@0.5:0.95 metric, RLDD-YOLOv11n achieves 0.607, significantly higher than YOLOv5-Lite (approximately 0.49) [32] and the improved SSD (approximately 0.55) [25], demonstrating superior localization accuracy and robustness.
In summary, RLDD-YOLOv11n exhibits comprehensive advantages in detection ac-curacy, lightweight model design, and localization capability, offering strong practical application value, particularly suitable for edge computing and resource-constrained environments.

4.3. Limitations and Future Work

This study still has some limitations and areas for further exploration. First, the model’s reliance on GPU computing power limits its application in resource-constrained environments. Future work will explore lightweight optimization strategies, such as model quantization and structured pruning, to improve real-time performance and energy efficiency for deployment on edge devices. Second, although RLDD-YOLOv11n demonstrates an excellent disease detection performance on the existing dataset, its generalization capability in complex field environments—such as variations in leaf morphology across different growth stages, overlapping occlusions, and lighting interference—still has room for improvement. Therefore, there are plans to construct an enhanced dataset that includes multiple growth stages, varied lighting conditions, and background interference to improve the model’s generalization. Moreover, although RLDD-YOLOv11 is specifically designed for rice leaf disease detection, its architecture and feature learning possess strong transfer potential. Given the visual similarities among various crop diseases, the model can be fine-tuned on crops such as wheat and maize through transfer learning, thereby reducing annotation requirements. The adopted SCSABlock and CARAFE modules enhance the recognition of complex textures and small targets, improving the model’s generalization performance in complex environments. This design supports the future extension of the model to various agricultural applications, including fruit and vegetable disease identification, weed detection, and farmland pest and disease monitoring, demonstrating broad application prospects. Finally, this study will compare the performance boundaries of current mainstream detection models and integrate cutting-edge technologies, such as knowledge distillation and dynamic network structures, to further enhance the model’s ability to represent small-scale disease features and improve classification accuracy.

5. Conclusions

To facilitate the accurate and timely detection of rice leaf diseases and enable effective control measures to mitigate yield losses, we propose an improved object detection model called RLDD-YOLOv11n. First, we introduce the SCSABlock module in the neck layer to enhance the model’s ability to extract multi-scale and multi-semantic information. Compared to conventional structures, this module captures fine-grained details in feature layers more precisely, significantly improving the model’s recognition of disease targets—particularly in complex backgrounds and small-target detection tasks. Second, to address the insufficient detail recovery in traditional upsampling methods, we integrate the CARAFE upsampling module. This enhancement preserves and restores texture information in the target region more effectively, improving the model’s ability to characterize disease features. Through these optimizations, the RLDD-YOLOv11n model achieves significant improvements in detection performance. The experimental results show that, compared with the original YOLOv11n model, our method increases mAP by 2.8%, reaching 88.3%. This improvement not only enhances the model’s robustness, but also maintains a high detection efficiency while ensuring accurate disease identification, demonstrating the effectiveness of our approach in rice leaf disease detection.

Author Contributions

Conceptualization, methodology, software, validation and writing—original draft: R.Z.; validation and investigation: N.D.; methodology and validation: C.L.; resources, supervision, and funding acquisition: K.F. and X.Z. All authors have read and agreed to the published version of the manuscript.

Funding

This research was funded by the Hunan Province Key RD Plan Project, grant number 2023NK2011.

Data Availability Statement

The data used to support the findings of this study are available from the corresponding author upon request.

Acknowledgments

The authors fully appreciate the editors and all anonymous reviewers for their constructive comments on this manuscript.

Conflicts of Interest

The authors declare no conflicts of interest.

References

  1. Ashraf, H.; Ghouri, F.; Baloch, F.S.; Nadeem, M.A.; Fu, X.; Shahid, M.Q. Hybrid Rice Production: A Worldwide Review of Floral Traits and Breeding Technology, with Special Emphasis on China. Plants 2024, 13, 578. [Google Scholar] [CrossRef] [PubMed]
  2. Prismantoro, D.; Akbari, S.I.; Permadi, N.; Dey, U.; Anhar, A.; Miranti, M.; Doni, F. The Multifaceted Roles of Trichoderma in Managing Rice Diseases for Enhanced Productivity and Sustainability. J. Agric. Food Res. 2024, 18, 101324. [Google Scholar] [CrossRef]
  3. Naresh Kumar, B.; Sakthivel, S. Rice Leaf Disease Classification Using a Fusion Vision Approach. Sci. Rep. 2025, 15, 8692. [Google Scholar] [CrossRef]
  4. Gülmez, B. Advancements in Rice Disease Detection through Convolutional Neural Networks: A Comprehensive Review. Heliyon 2024, 10, e33328. [Google Scholar] [CrossRef]
  5. Sahu, S.K.; Pandey, M. An Optimal Hybrid Multiclass SVM for Plant Leaf Disease Detection Using Spatial Fuzzy C-Means Model. Expert Syst. Appl. 2023, 214, 118989. [Google Scholar] [CrossRef]
  6. Regiana, G.; Purnamasari, A.I.; Bahtiar, A.; Tohidi, E. K-Means Algorithm to Improve Leaf Image Clustering Model for Rice Disease Early Detection. J. Artif. Intell. Eng. Appl. 2025, 4, 1156–1160. [Google Scholar] [CrossRef]
  7. Guan, Q.; Qiao, S.; Feng, S.; Du, W. Investigation of Peanut Leaf Spot Detection Using Superpixel Unmixing Technology for Hyperspectral UAV Images. Agriculture 2025, 15, 597. [Google Scholar] [CrossRef]
  8. An, L.; Liu, Y.; Wang, N.; Liu, G.; Liu, M.; Tang, W.; Li, M. Classification of Wheat Powdery Mildew Based on Hyperspectral: From Leaves to Canopy. Crop Prot. 2024, 177, 106559. [Google Scholar] [CrossRef]
  9. Rajput, G.G.; Doddamani, V.B. Exploring Support Vector Machine and K-Nearest Neighbors for Pigeonpea Leaf Image Disease Detection and Classification. In Proceedings of the 2024 4th Asian Conference on Innovation in Technology (ASIANCON), Pimari Chinchwad, India, 23–25 August 2024; pp. 1–5. [Google Scholar]
  10. Terensan, S.; Salgadoe, A.S.A.; Kottearachchi, N.S.; Weerasena, O.J. Proximally Sensed RGB Images and Colour Indices for Distinguishing Rice Blast and Brown Spot Diseases by K-Means Clustering: Towards a Mobile Application Solution. Smart Agric. Technol. 2024, 9, 100532. [Google Scholar] [CrossRef]
  11. Harjanti, T.W.; Setiyani, H.; Trianto, J.; Rahmanto, Y. Classification of Mint Leaf Types Based on the Image Using Euclidean Distance and K-Means Clustering with Shape and Texture Feature Extraction. Tech-E 2022, 5, 115–124. [Google Scholar] [CrossRef]
  12. Banerjee, D.; Kukreja, V.; Hariharan, S.; Sharma, V. Precision Agriculture: Classifying Banana Leaf Diseases with Hybrid Deep Learning Models. In Proceedings of the 2023 IEEE 8th International Conference for Convergence in Technology (I2CT), Lonavla, India, 7–9 April 2023; pp. 1–5. [Google Scholar]
  13. Saputra, K.; Zuriati, Z. Identification of Rice Disease Types Based on Digital Image Leaves Using Algorithm Support Vector Machine (SVM). In Proceedings of the International Conference on Agriculture and Applied Science, Bandar Lampung, Indonesia, 15 November 2022; pp. 9–16. [Google Scholar]
  14. Wang, X.; Shrivastava, A.; Gupta, A. A-Fast-RCNN: Hard Positive Generation via Adversary for Object Detection. In Proceedings of the IEEE Conference on Computer Vision and Pattern Recognition, Honolulu, HI, USA, 21–26 July 2017; pp. 2606–2615. [Google Scholar]
  15. Cheng, B.; Wei, Y.; Shi, H.; Feris, R.; Tong, J.; Huang, T. Revisiting RCNN: On Awakening the Classification Power of Faster RCNN. In Proceedings of the European Conference on Computer Vision (ECCV), Munich, Germany, 8–14 September 2018; pp. 453–468. [Google Scholar]
  16. Junare, C.B.; Ghanokar, V.S.; Khandare, R.M.; Koche, S.P.; Pagrut, S.B. Plant disease detection using mask RCNN. SSGM J. Sci. Eng. 2024, 2, 21–26. [Google Scholar]
  17. Guan, B.; Wu, Y.; Zhu, J.; Kong, J.; Dong, W. GC-Faster RCNN: The object detection algorithm for agricultural pests based on improved hybrid attention mechanism. Plants 2025, 14, 1106. [Google Scholar] [CrossRef]
  18. Hou, J.; Yang, C.; He, Y.; Hou, B. Detecting diseases in apple tree leaves using FPN–ISResNet–Faster RCNN. Eur. J. Remote Sens. 2023, 56, 2186955. [Google Scholar] [CrossRef]
  19. Admass, W.S.; Munaye, Y.Y.; Bogale, G.A. Convolutional neural networks and histogram-oriented gradients: A hybrid approach for automatic mango disease detection and classification. Int. J. Inf. Technol. 2024, 16, 817–829. [Google Scholar] [CrossRef]
  20. Wang, M.; Fu, B.; Fan, J.; Wang, Y.; Zhang, L.; Ma, C. Sweet potato leaf detection in a natural scene based on faster R-CNN with a visual attention mechanism and DIoU-NMS. Ecol. Inform. 2023, 73, 101931. [Google Scholar] [CrossRef]
  21. Liu, W.; Anguelov, D.; Erhan, D.; Szegedy, C.; Reed, S.; Fu, C.Y.; Berg, A.C. SSD: Single shot multibox detector. In Proceedings of the Computer Vision–ECCV 2016: 14th European Conference, Amsterdam, The Netherlands, 11–14 October 2016; Proceedings, Part I. pp. 21–37. [Google Scholar]
  22. Redmon, J.; Divvala, S.; Girshick, R.; Farhadi, A. You only look once: Unified, real-time object detection. In Proceedings of the IEEE Conference on Computer Vision and Pattern Recognition, Las Vegas, NV, USA, 27–30 June 2016; pp. 779–788. [Google Scholar]
  23. Yin, Z.B.; Liu, F.Y.; Geng, H.; Li, Y.J.; Zeng, D.B.; Si, C.J.; Shi, M.D. A high-precision jujube disease spot detection based on SSD during the sorting process. PLoS ONE 2024, 19, e0296314. [Google Scholar] [CrossRef]
  24. Dahua, L.I.; Shu, K.O.N.G.; Dong, L.I.; Zhao, Y.U. Lightweight detection model of citrus leaf disease based on improved SSD. Acta Agric. Zhejiangensis 2024, 36, 662. [Google Scholar]
  25. Sandler, M.; Howard, A.; Zhu, M.; Zhmoginov, A.; Chen, L.C. MobileNetV2: Inverted residuals and linear bottlenecks. In Proceedings of the IEEE Conference on Computer Vision and Pattern Recognition, Salt Lake City, UT, USA, 18–23 June 2018; pp. 4510–4520. [Google Scholar]
  26. Hou, Q.; Zhou, D.; Feng, J. Coordinate attention for efficient mobile network design. In Proceedings of the IEEE/CVF Conference on Computer Vision and Pattern Recognition, Nashville, TN, USA, 20–25 June 2021; pp. 13713–13722. [Google Scholar]
  27. Liu, S.; Huang, D. Receptive field block net for accurate and fast object detection. In Proceedings of the European Conference on Computer Vision (ECCV), Munich, Germany, 8–14 September 2018; pp. 385–400. [Google Scholar]
  28. Wang, Y.; Wang, Y.; Zhao, J. MGA-YOLO: A lightweight one-stage network for apple leaf disease detection. Front. Plant Sci. 2022, 13, 927424. [Google Scholar] [CrossRef] [PubMed]
  29. Woo, S.; Park, J.; Lee, J.Y.; Kweon, I.S. CBAM: Convolutional block attention module. In Proceedings of the European Conference on Computer Vision (ECCV), Munich, Germany, 8–14 September 2018; pp. 3–19. [Google Scholar]
  30. Sangaiah, A.K.; Yu, F.N.; Lin, Y.B.; Shen, W.C.; Sharma, A. UAV T-YOLO-rice: An enhanced tiny YOLO networks for rice leaves diseases detection in paddy agronomy. IEEE Trans. Netw. Sci. Eng. 2024, 11, 5201–5216. [Google Scholar] [CrossRef]
  31. He, J.; Ren, Y.; Li, W.; Fu, W. YOLOv11-RCDWD: A new efficient model for detecting maize leaf diseases based on the improved YOLOv11. Appl. Sci. 2025, 15, 4535. [Google Scholar] [CrossRef]
  32. Seelwal, P.; Dhiman, P.; Gulzar, Y.; Kaur, A.; Wadhwa, S.; Onn, C.W. A systematic review of deep learning applications for rice disease diagnosis: Current trends and future directions. Front. Comput. Sci. 2024, 6, 1452961. [Google Scholar] [CrossRef]
  33. Khanam, R.; Hussain, M. YOLOv11: An overview of the key architectural enhancements. arXiv 2024, arXiv:2410.17725. [Google Scholar]
  34. Jooshin, H.K.; Nangir, M.; Seyedarabi, H. Inception-YOLO: Computational cost and accuracy improvement of the YOLOv5 model based on employing modified CSP, SPPF, and inception modules. IET Image Process. 2024, 18, 1985–1999. [Google Scholar] [CrossRef]
  35. Liu, H.; Liu, F.; Fan, X.; Huang, D. Polarized self-attention: Towards high-quality pixel-wise regression. arXiv 2021, arXiv:2107.00782. [Google Scholar]
  36. Liu, S.; Qi, L.; Qin, H.; Shi, J.; Jia, J. Path aggregation network for instance segmentation. In Proceedings of the IEEE Conference on Computer Vision and Pattern Recognition, Salt Lake City, UT, USA, 18–23 June 2018; pp. 8759–8768. [Google Scholar]
  37. Si, Y.; Xu, H.; Zhu, X.; Zhang, W.; Dong, Y.; Chen, Y.; Li, H. SCSA: Exploring the synergistic effects between spatial and channel attention. Neurocomputing 2025, 634, 129866. [Google Scholar] [CrossRef]
  38. Wang, J.; Chen, K.; Xu, R.; Liu, Z.; Loy, C.C.; Lin, D. CARAFE: Content-aware reassembly of features. In Proceedings of the IEEE/CVF International Conference on Computer Vision, Seoul, Republic of Korea, 27 October–2 November 2019; pp. 3007–3016. [Google Scholar]
  39. Selvaraju, R.R.; Cogswell, M.; Das, A.; Vedantam, R.; Parikh, D.; Batra, D. Grad-CAM: Visual explanations from deep networks via gradient-based localization. In Proceedings of the IEEE International Conference on Computer Vision, Venice, Italy, 22–29 October 2017; pp. 618–626. [Google Scholar]
Figure 1. Process overview diagram.
Agronomy 15 01266 g001
Figure 2. Some images in the dataset.
Agronomy 15 01266 g002
Figure 3. Image augmentation method.
Agronomy 15 01266 g003
Figure 4. Schematic of structure of Yolov11.
Agronomy 15 01266 g004
Figure 5. The network structure of the SCSA.
Agronomy 15 01266 g005
Figure 6. Overall framework of CARAFE.
Agronomy 15 01266 g006
Figure 7. Structure of the improved YOLOv11n model.
Agronomy 15 01266 g007
Figure 8. Identification result of YOLOv11n and RLDD-YOLOv11n.
Agronomy 15 01266 g008
Figure 9. Confusion matrix.
Agronomy 15 01266 g009
Figure 10. (a) F1_curve; (b) PR_curve; (c) P_curve; (d) R_curve.
Agronomy 15 01266 g010
Figure 11. Comparison of heatmap images.
Agronomy 15 01266 g011
Table 1. Disease characteristics of rice.
Disease NameDisease Characteristics
Rice BlastIt presents needle-eyed brown spots with gray lesions on both sides of the leaves
Bacterial BlightThere are grayish-white spots along one or both sides of the leaf margin or along the midvein, and they curl inward
Brown SpotOften oblong or irregularly reddish-brown in shape
Table 2. Rice dataset distribution.
Disease TypeQuantityTraining SetValidation SetTest Set
Bacterial Blight797478157162
Rice Blast713428142143
Brown Spot808483163162
Total23181389462467
Table 3. Confusion matrix.
ReferencePositiveNegative
Prediction
PositiveTrue positive (TP)False negative (FN)
NegativeFalse positive (FP)True negative (TN)
Table 4. Experimental environment configuration.
ParametersConfiguration
CPUE5-2680v3
GPURTX2080ti
CUDA11.2
Torch1.8
Momentum0.937
Weight decay0.0005
Batch Size16
Learning rate0.01
Epochs200
Table 5. Performance comparison of different neck structures.
ModelAP(@0.5)mAP(@0.5)mAP(@0.95)
Brown SpotRice BlastBacterial Blight
YOLOv11n0.9060.6760.9840.8550.547
YOLOv11n-SCSABlock0.9010.7080.9860.8650.543
YOLOv11n-CARAFE0.9490.6910.9870.8760.568
RLDD-YOLOv11n0.9690.6990.9820.8830.607
Table 6. Performance comparison of YOLO models across key detection metrics.
ModelPrecision (%)Recall (%)mAP50 (%)Weight (MB) GFLOPS   × 10 9
Faster R-CNN0.6880.8490.79982.1120.7
YOLOv5s0.8890.8180.8697.0115.8
YOLOv70.8600.8660.86636.8103.5
YOLOv8n0.8600.8020.8333.08.1
YOLOv10n0.7790.7060.7542.698.2
YOLOv11n0.8670.8170.8552.546.3
RLDD-YOLOv11n0.9160.8380.8832.586.3
Disclaimer/Publisher’s Note: The statements, opinions and data contained in all publications are solely those of the individual author(s) and contributor(s) and not of MDPI and/or the editor(s). MDPI and/or the editor(s) disclaim responsibility for any injury to people or property resulting from any ideas, methods, instructions or products referred to in the content.

