Article

QTL Identification and Candidate Gene Prediction for Spike-Related Traits in Barley

1
Hubei Hongshan Laboratory, College of Plant Science and Technology, Huazhong Agricultural University, Wuhan 430070, China
2
Biology Department, Saint Mary’s University, Halifax, NS B3H 3C3, Canada
*
Author to whom correspondence should be addressed.
These authors contributed equally to this work.
Agronomy 2025, 15(5), 1185; https://doi.org/10.3390/agronomy15051185
Submission received: 31 March 2025 / Revised: 9 May 2025 / Accepted: 10 May 2025 / Published: 14 May 2025
(This article belongs to the Section Crop Breeding and Genetics)

Abstract

:
Barley (Hordeum vulgare L.) is one of the most important cereal crops in the world, and its production is important to humans. Barley spike morphology is highly correlated with yield and is also a complex multigene-controlled quantitative trait. To date, a considerable number of spike-related quantitative trait loci (QTLs) have been reported in barley, but the large physical distances between most of them and the lack of follow-up studies have made it difficult to use them in molecular-assisted breeding in barley. To explore more novel and yield-enhancing spike QTLs, in this study, a high-density genetic linkage map was developed based on a population of 172 F2:12 recombinant inbred lines (RILs) developed from a cross between the barley variety Yongjiabaidamai (YJ) and Hua 30 (H30), and used to map the spike length (SL), rachis node number (SRN), and spike density (SD). A total of 50 additive QTLs (LOD > 3) were mapped in four environments, four of them being stable and major QTLs. The qSL2-5 overlaps with the zeo1 gene, comparing the gene sequences of both parents and combining with previous studies, zeo1 was determined to be the SL regulatory gene in qSL2-5. The qSRN2-1 overlaps with vrs1, but it has not been previously reported that vrs1 affects SRN. Notably, two novel QTLs, one each on chromosomes 2H (qSL2-1) and 5H (qSL5-1), respectively, were first identified in this study. The qSL2-1 has only 0.06 Mb and contains three high-confidence genes. In addition, this study explored the relationship between three spike traits, and found that SL was affected by both SRN and SD, while there was almost no relationship between SRN and SD. We also explored the effect of these QTLs on grain weight per spike (GWPS) to assess their effect on yield and found that qSRN2-1 and qSL5-1 had a greater effect on GWPS, suggesting that they are potential loci to increase yield.

1. Introduction

Barley (Hordeum vulgare L. 2n = 14) is an annual herbaceous crop in the grass family and is one of the most important crops in the world, with total yield and cultivation area of cereal crops only less than that of maize (Zea mays L.), wheat (Triticum aestivum L.), and rice (Oryza sativa L.) [1,2]. Barley is a nutrient-rich crop that is commonly used for brewing, human consumption, and livestock feed [3,4].
The spike is a crucial organ of barley, which is influenced by environmental, phytohormonal and genetic factors, and is a quantitative trait controlled by multiple genes, often associated with the yield of crops [5,6]. The yield of cereal crops is generally determined by the spike number per unit area, grain number per spike, and grain weight [7,8]. In barley, the grain number per spike is determined mainly by the spike rachis node number (SRN), row-type, and fertile grain number per spikelet [9]. The row-type (2-rowed vs. 6-rowed) is one of the most important phenotypes for barley breeding and germplasm management because of its recognizable characteristics [10]. So far, five genes determining row-type, Six-rowed spike 1 (vrs1) [11,12], vrs2 [13], vrs3 [14], vrs4 [15], and vrs5 [16], have been cloned. Despite the fact that six-rowed barley has almost three times as many grains as two-rowed barley, there is not much difference between their final yields [17]. The fertile grain number per spikelet correlates with fertility genes in barley, such as CCT MOTIF FAMILY 4 (HvCMF4). It can result in higher primordium death rates and pollination failure, further reducing the number of grains in the spikelet [18]. The spike rachis node is a site of spikelet attachment---increasing the number of rachis nodes may be an effective way to increase the barley grain number. Spike length (SL) and spike density (SD) are not components of yield, but they can still have an indirect impact on yield and can also affect grain quality [19,20].
In recent years, many quantitative trait loci (QTLs) and genes related to barley spike traits have been identified. The best known of these is ZEOCRITON1 (zeo1), which is homologous to the well-known wheat domestication gene Q and was found to be associated with spike rachis node length (SRL) and closely linked to the cleistogamy gene (cly1) (it was later shown that the two traits are regulated by the same gene) [9,21,22,23,24]. Chen et al. (2009) also localized the QTL near zeo1 by investigating SD and predicted this gene to be the AP2 gene within the interval. Houston et al. (2013) demonstrated that zeo1 is an AP2-like ethylene-responsive transcription factor and noted that AP2 interacts with miRNA172 to regulate SRL in barley, but does not affect SRN [25,26]. Recently, Fan et al. (2024) identified a QTL related to SRN, qSRN1, on barley chromosome 2H using recombinant inbred lines and identified the gene in this QTL interval as HvSRN1 by fine localization [9]. In addition, many underlying SL and SD control loci were reported, such as dense spike 1 (dsp1) in the proximal region of the short arm of 7HS [27], dsp12 in chromosome 3HL [28,29], dsp9, dsp10, dsp11, etc. [30,31,32,33,34]; these loci are distributed on all seven chromosomes of barley.
QTL mapping is a traditional and important method for resolving the genetic basis of complex quantitative traits, the core of which is to determine the chromosomal location of genes controlling traits through the linkage between molecular markers and the target traits [35,36]. The accuracy of QTL mapping is affected by a variety of factors, including the size of population, the accuracy of the phenotypic data, the quality of the genotype typing, and the density of markers. QTL mapping strategies based on biparental segregating populations have been widely used for the genetic resolution of complex and quantitative traits [37].
The spike traits of barley are controlled by multiple genes and are highly correlated with yield. Although so many loci have been reported, the large physical distances between most of them and the lack of follow-up studies have made it difficult to further explore candidate genes at these loci, and the effect of these loci on yield is not clear, making it difficult to use them in molecular-assisted breeding in barley. In this study, whole genome resequencing technology was applied to barley QTL mapping for the first time. The aims were to construct a high-density genetic linkage map for fine QTL mapping of barley spike traits, and to mine novel, stable, and major QTLs and predict candidate genes with regulatory effects on barley SL, SRN, and SD. Further, by associating QTL with one of the yield factors, we finally analyzed and mined QTLs for spike traits that could enhance barley yield, which is valuable for breeding applications.

2. Materials and Methods

2.1. Plant Materials

A recombinant inbred line population (RIL, F2:12, 172 lines) derived from the cross of Yongjiabaidamai (YJ) × Hua 30 (H30) was used for QTL mapping. Yongjiabaidamai is a six-rowed landrace collected from Yongjia County, Wenzhou City, Zhejiang Province, China. Hua 30 is a two-rowed cultivar bred by the Academy of Agricultural Sciences of Jiaxing City, Zhejiang Province, China, with significantly longer spike and more rachis nodes compared with YJ. YJ and H30 are distantly related barley varieties, which means that using them as parents to construct mapping populations can generate a greater number of molecular markers and a higher-density genetic linkage map.

2.2. Field Trials and Phenotypic Evaluation

All populations, along with their parents, were planted and phenotyped at the Huazhong Agricultural University (30°28′26″ N, 114°20′50″ E, altitude 40 m), Wuhan, Hubei province, China. The RIL population and their parents were grown in 2021–2022, 2022–2023, and 2023–2024. Each line was planted in three replicates with a two-row plot, with 2.0 m row, row space of 0.2 m, and plant space of 15 cm. Field management followed normal barley production practices for each environmental condition.
The main spikes of 6 plants from each RIL and their parents in each replication were randomly selected for phenotype analysis at the mature stage. The SRN was counted directly by hand from the base rachis node to the top rachis node; the SL was measured as the length from the base of the axis to the tip of the terminal spikelet (excluding awn) by using a ruler; the SD was defined as the ratio between SRN and SL, and calculated using the SRN/SL. After grains harvesting, 1000 full and pest-free grains were selected from each line and weighed and recorded as thousand-grains weight (TGW); theoretical grain weight per spike (GWPS) was calculated as the following equation:
G W P S   ( g ) = S R N × T G W × r o w   t y p e 2 × 10 3
The number of spikelets in 2-rowed and 6-rowed barley is different due to the influence of the row type. In order that they can be expressed by the same formula, the number of spikelets was represented here by row type/2.
The best linear unbiased prediction (BLUP) method [38] was calculated by using the lmer function in the R package “lme4” with both genotype and environment as random factors and used for combined QTL detection, correlation analyses, and effect analyses. Broad-sense heritability (H2) was calculated as the following equation:
H 2 = V g V g + V e L o c
Genotypic variance (Vg) and error variance (Ve) were obtained from the R package “lme4” with both genotype and environment as random factors; Loc means location number.

2.3. QTL Mapping and the RIL Population Genotyping

In this study, 172 lines and their parents were subjected to whole-genome resequencing, and a high-density genetic linkage map was constructed using their whole-genome resequencing data. To ensure the quality of the genetic linkage map, parental marker depths below 5× and line marker depths below 3× were removed. In order to be in a position to ensure the quality of the map and to simplify the amount of computation, SNP intervals in which recombination did not occur were classified as Bin markers for the construction of the genetic map. The genetic linkage map consisted of 12,905 bin markers and covered a total genetic distance of 1086.46 cM, with an average marker density of 0.08 cM. The physical positions of the high-density genetic linkage maps were referred to the Morex V3 reference genome (https://plants.ensembl.org/Hordeum_vulgare/Info/Index, accessed on 16 November 2024). IciMapping 4.2 software (https://www.isbreeding.net, accessed on 12 October 2024) was used to construct the genetic linkage map and perform QTL mapping. QTL mapping was defined as follows: step = 1 cM and PIN = 0.001. QTLs with LOD > 3 were considered as high-confidence QTLs. Genotyping was based on whole genome resequencing data. SNPs in each QTL interval were extracted for all RIL population lines, and these SNPs were aligned with the parents using the following criteria: the lines in which the target QTL was pure and sequencing depth >3× were counted, and the lines in which the target QTL was heterozygous or exchange occurred were removed. Genotypes identical to YJ were denoted with AA, and to H30 were denoted with BB. QTLs were named based on the International Rules of Genetic Nomenclature [39], such as qSL2-1, q standards for QTL, SL for spike length, 2-1 for the first QTL on chromosome 2H.

2.4. Identification of Parents’ Differential Gene DNA Sequences

DNA from parents was extracted using a Plant Genomic DNA Kit (TianGen Biotech, Beijing, China). The reference gene sequence for primer design was obtained from the reference genome sequence of barley cv. Morex V3 (http://202.194.139.32/jbrowse-1.12.3-release/?data=Barley3, accessed on 25 November 2024).

3. Results

3.1. Spike Traits Evaluation of the RIL Population and Their Parents
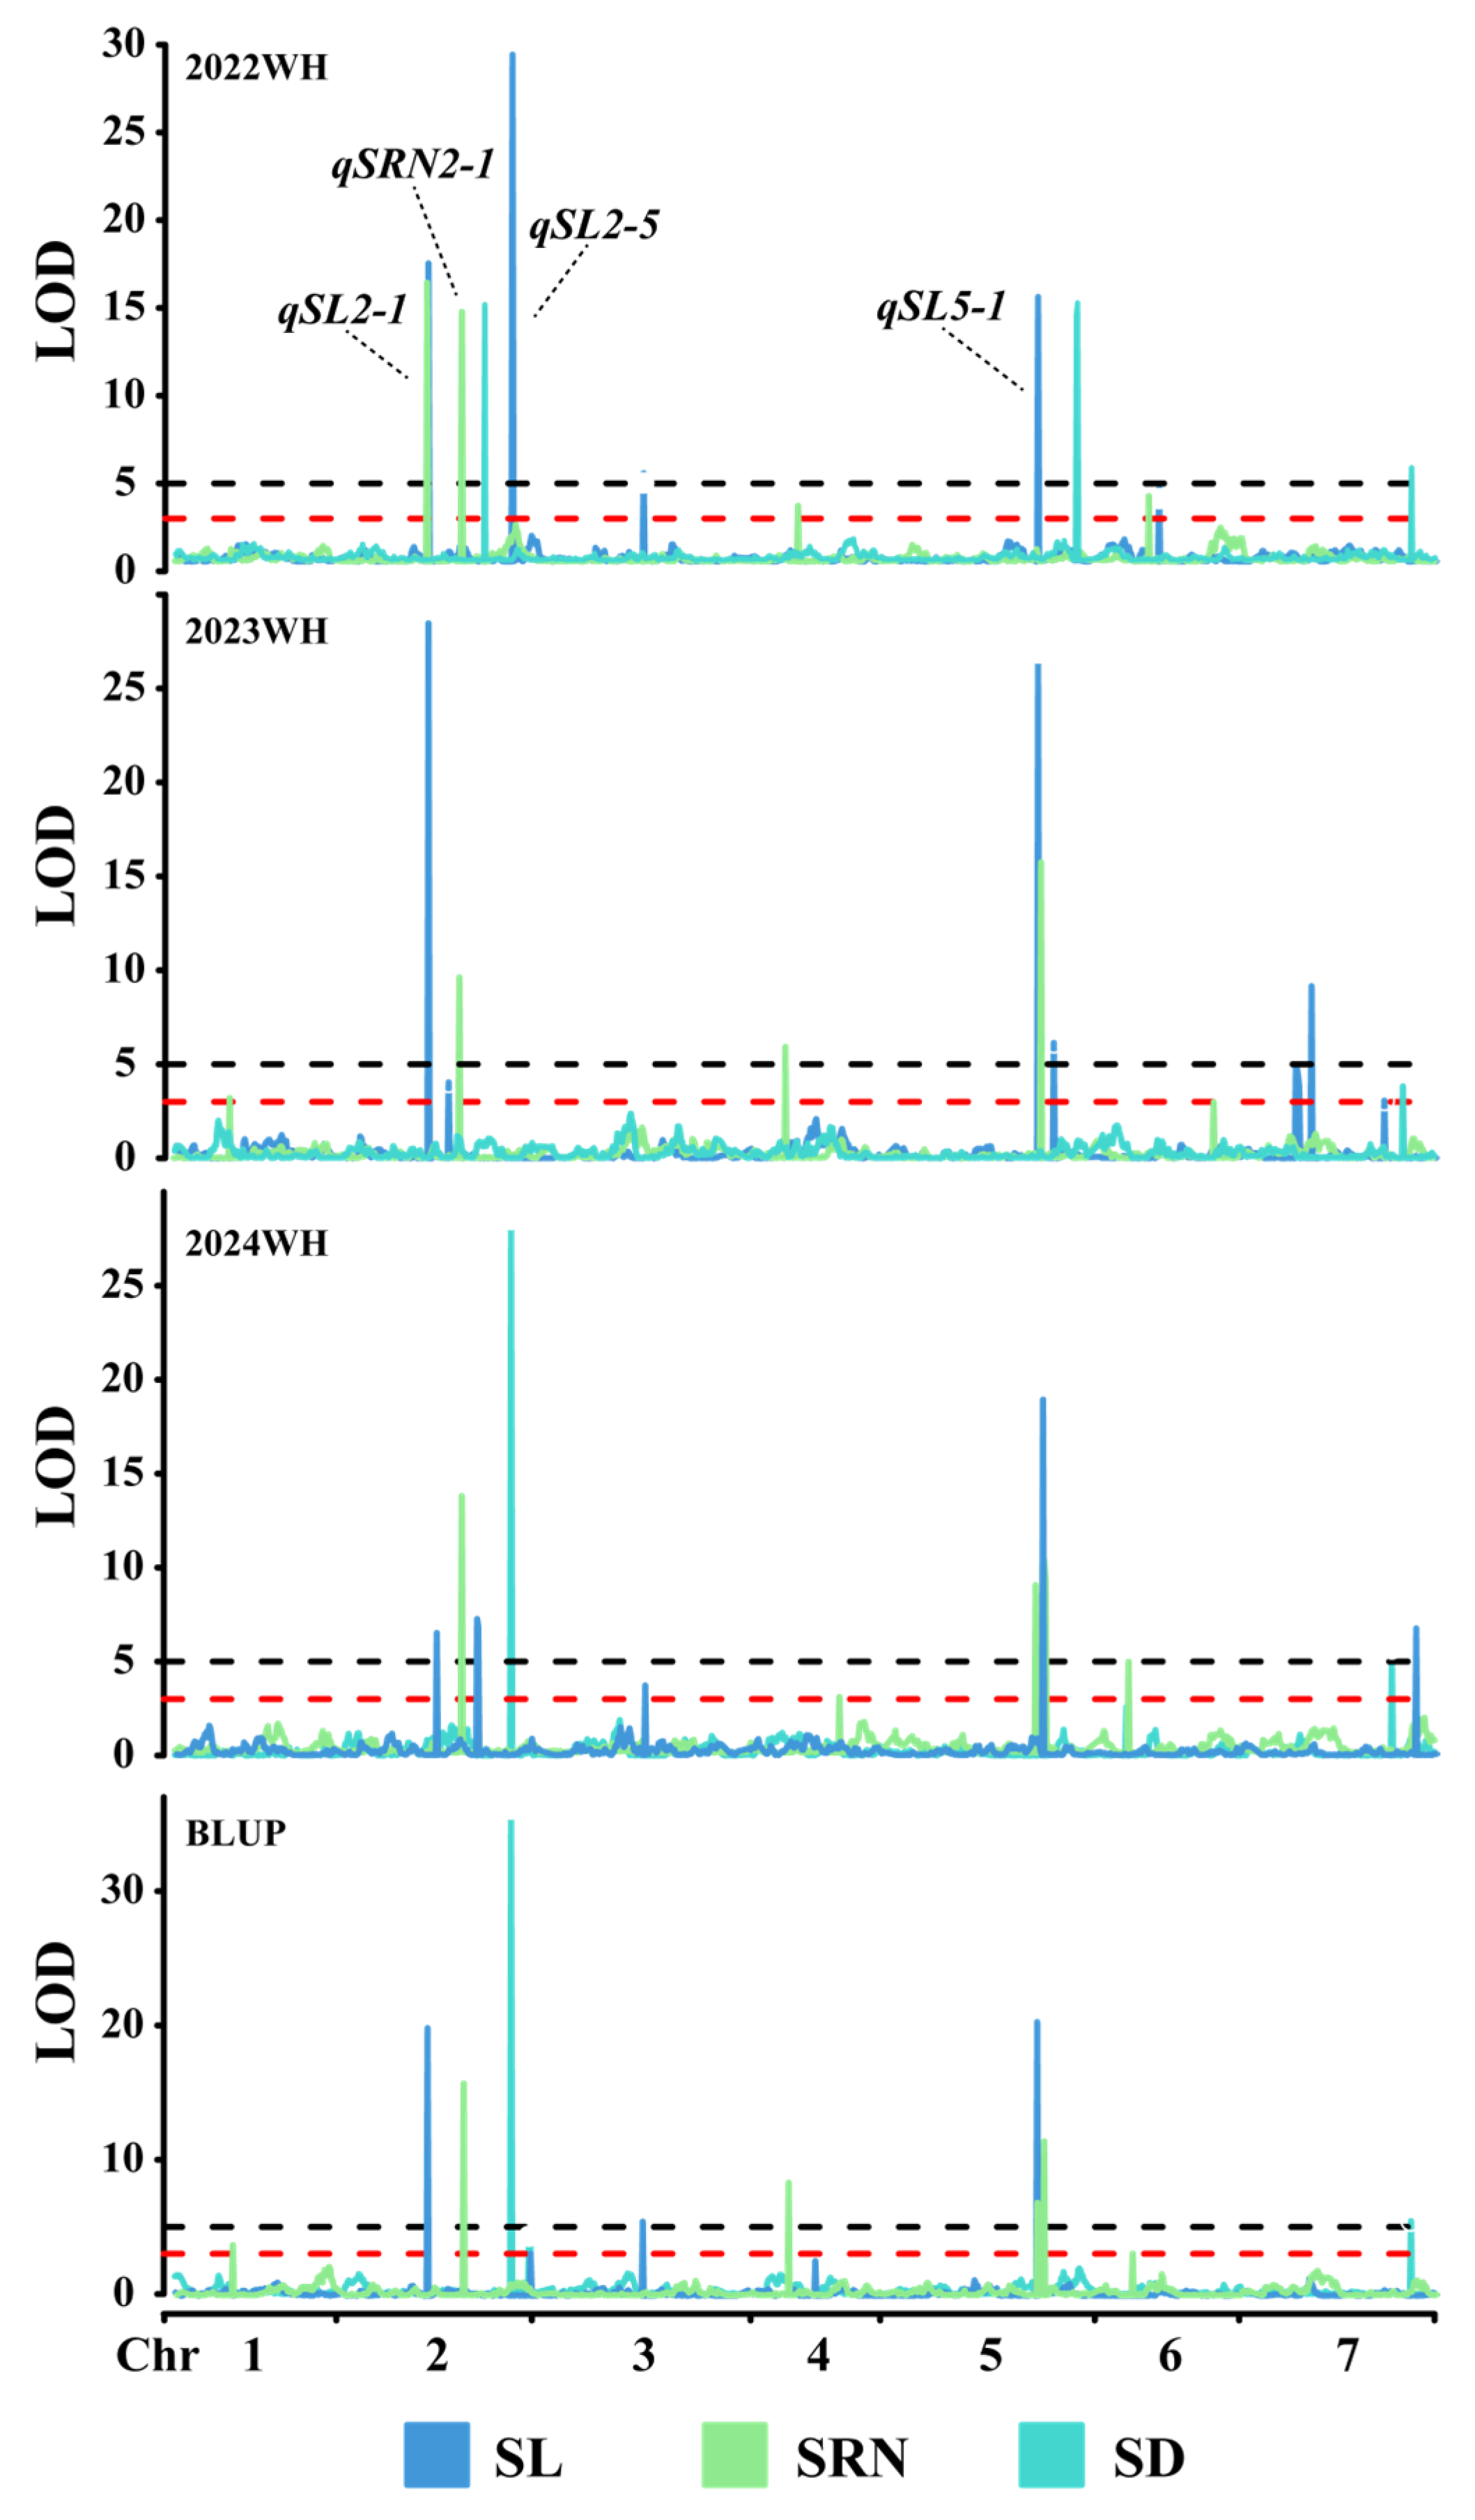
The spike of the two parents is distinctly different in spike morphology. The YJ exhibits a short, six-rowed spike, while the H30 has a longer, two-rowed spike. However, both spikes appear to be compact in structure (Figure 1A). According to the phenotyping data of parental specimens collected from three consecutive planting seasons, H30 showed significantly longer SL and more SRN than YJ, and a small difference in SD (Table 1).
In the RIL population, a wide range of variability in SL, SRN, and SD was found, and both maximum and minimum values were higher/lower than their parents, with the SL ranging from 3.53 to 10.63 cm, the SRN ranging from 18.00 to 47.00, and the SD ranging from 3.11 to 8.30 cm−1. The broad-sense heritability (H2) for the SL, SRN, and SD were 96.33%, 92.16%, and 85.89%, respectively, suggesting that these three traits are primarily influenced by genetics (Table 1). The histogram, skewness, and kurtosis all indicated SL, SRN, and SD in the RIL exhibited a normal distribution (Table 1 and Figure 1B), indicating that they are controlled by quantitative genes that can be used for QTL mapping.
Significant Pearson correlations (p < 0.05) were observed for different spike-related traits among the different environments (Figure 1C). Significant positive correlation (p < 0.001) between SL and SRN, and significant negative correlations (p < 0.001) between SL and SD were observed, but no significant correlation (p > 0.05) was observed between SRN and SD.

3.2. QTL Analysis

The QTL Icimapping 4.2 software was used for mapping, and a Manhattan plot was used to display the localization results (Figure 2). A total of 50 additive QTLs (LOD > 3) for SL (22), SRN (19), and SD (9) were mapped (Table S1). These QTLs were collated, merged, and named as shown in Table S2. QTLs detected in more than one environment were considered to be stable QTLs, and QTLs with PVE > 10% were considered to be major QTLs. Among them, four QTLs were considered stable and major QTLs (Table 2). qSL2-1 was mapped to chromosome 2H, and was detected as stable in three environments, explaining 14.23% to 14.82% of the SL phenotypic variation (average of 14.61%), so it was considered a major and stable QTL for SL. qSRN2-1 was mapped to chromosome 2H, which is 30 cM away from qSL2-1 and stable in all four environments, explaining 10.74% to 18.24% of the phenotypic variation in SRN (average of 15.69%), so it was considered a major and stable QTL for SRN. qSL2-5 was also mapped to chromosome 2H, being 42 cM away from qSRN2-1, so they were considered to be different loci. This QTL was detected for both SL and SD, explaining 28.51% of the SL phenotypic variation, and 49.56% to 53.87% of the SD phenotypic variation (average of 51.71%), so it was considered a major and stable QTL for SL and SD. qSL5-1 was mapped on chromosome 5H, and explained 12.32% to 20.79% of the SL phenotypic variation (average of 15.73%), and 6.34% to 19.57% of the SRN phenotypic variation (average of 11.77%), so it was considered a major and stable QTL for both SL and SRN.

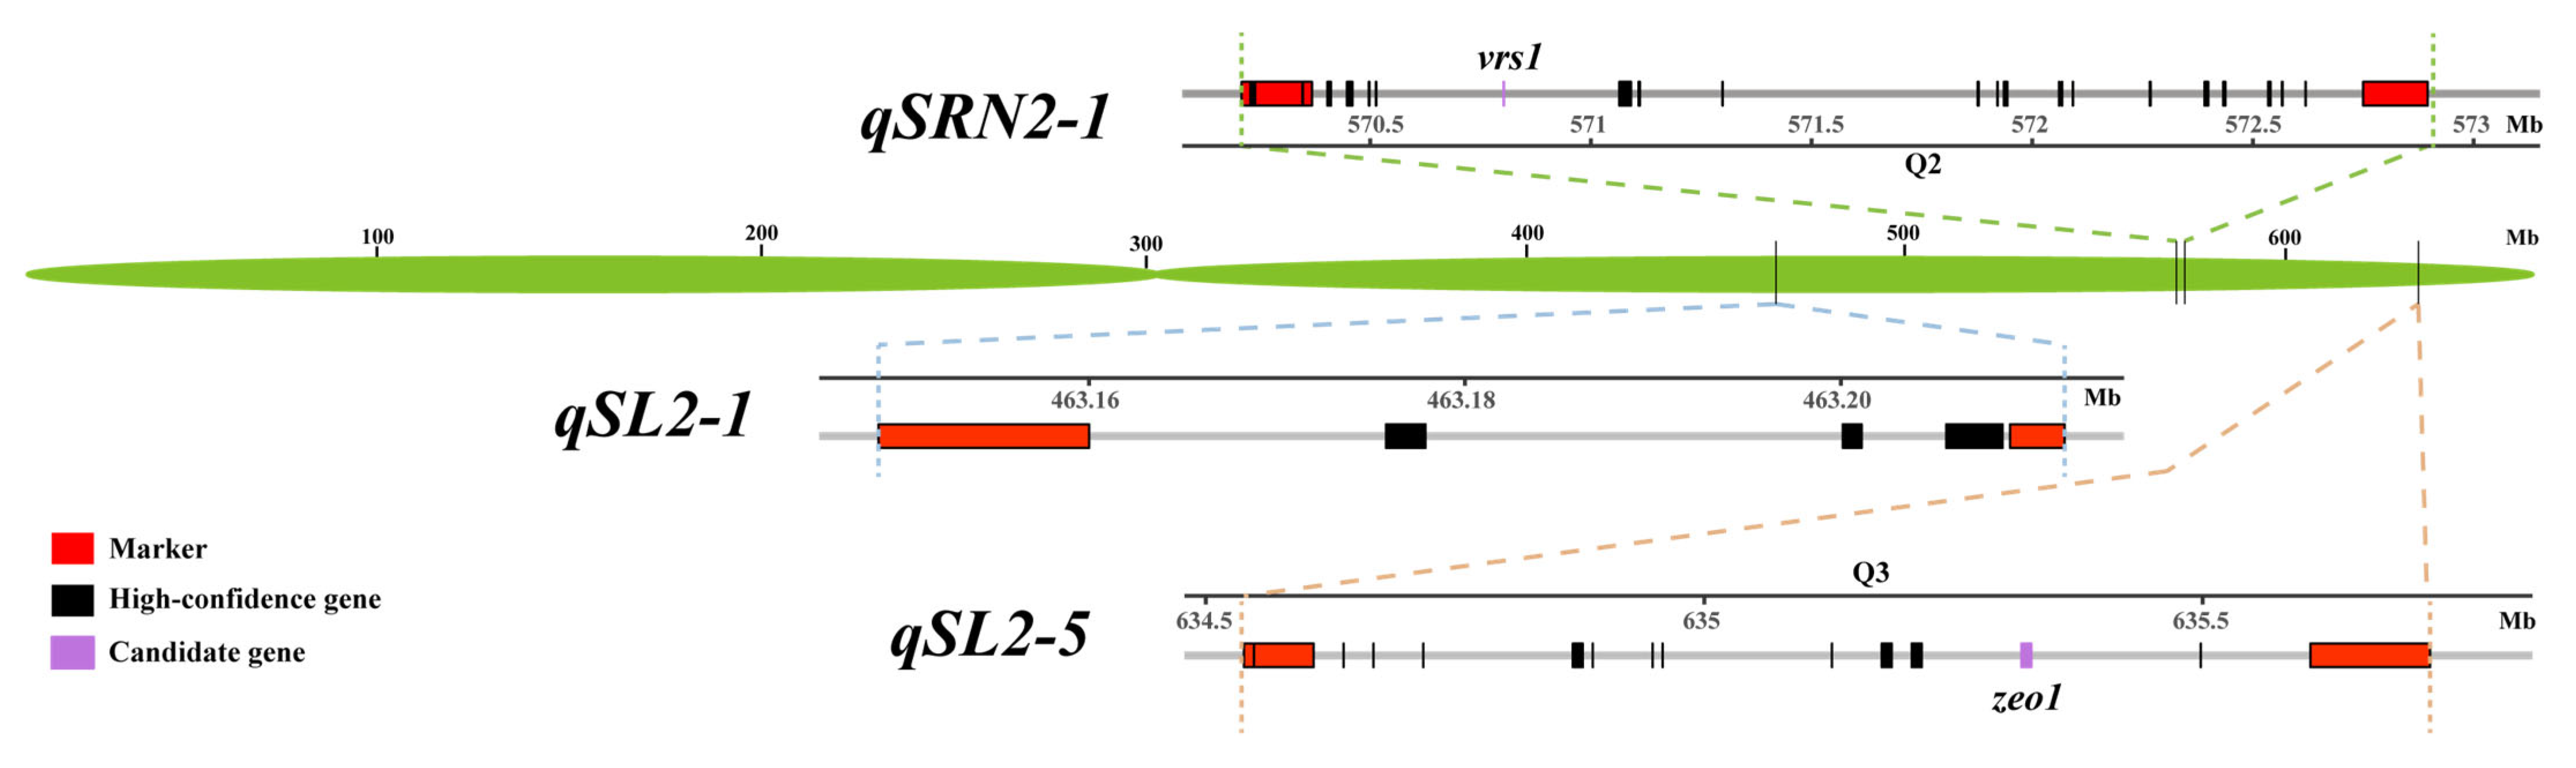
3.3. Candidate Gene Prediction and Analysis for Stable QTL Intervals

The QTLs on the linkage map were compared with the Morex3.0 reference genome, and the physical distances between the four stable QTL intervals were obtained (Table 3). qSL2-1 was located within the physical interval from 463,148,813 bp to 463,211,912 bp in the chromosome 2HL genome of Morex V3. This is a short and novel QTL regulating SL. The interval contains 8 genes but does not have high-confidence genes; however, comparison with the barley pan-genome V2 revealed three high-confidence genes (Figure 3). qSRN2-1 was located within the physical interval from 570,208,797 bp to 572,896,231 bp in the chromosome 2HL genome of Morex V3. We note that vrs1 (HORVU.MOREX.r3.2HG0184740, 570,802,392 bp to 570,803,252 bp) is in this interval. In addition, the parents of the RIL population differed significantly in spike rows, so vrs1 is the most likely candidate gene for this interval. qSL2-5 was located within the physical interval from 634,533,780 bp to 635,723,402 bp in the chromosome 2HL genome of Morex V3. A previously reported gene affecting SL and SD was found in the interval, named zeo1 (HORVU.MOREX.r3.2HG0204770, 635,314,602 bp to 635,318,153 bp). To verify whether the candidate gene in this interval is the previously reported zeo1, we cloned the coding region sequences of the zeo1 gene from the parents. The results showed three base differences between the parents, the most important of which is a nonsynonymous mutation at the miR172 binding site. Previous studies have found that non-synonymous mutations in the miR172 binding site affect gene function, making spikes shorter and more compact. Our findings correspond well with previous findings [26], with the difference that YJ is a new haplotype (Figure 4). Combined with previous studies, we determined that the candidate gene for qSL2-5 is zeo1. qSL5-1 was located within the physical interval from 526,921,437 bp to 537,239,981 bp in the Chr5HL genome of Morex V3. This QTL is a new interval regulating SRN and SL, but this interval is large with 10.31 Mb.

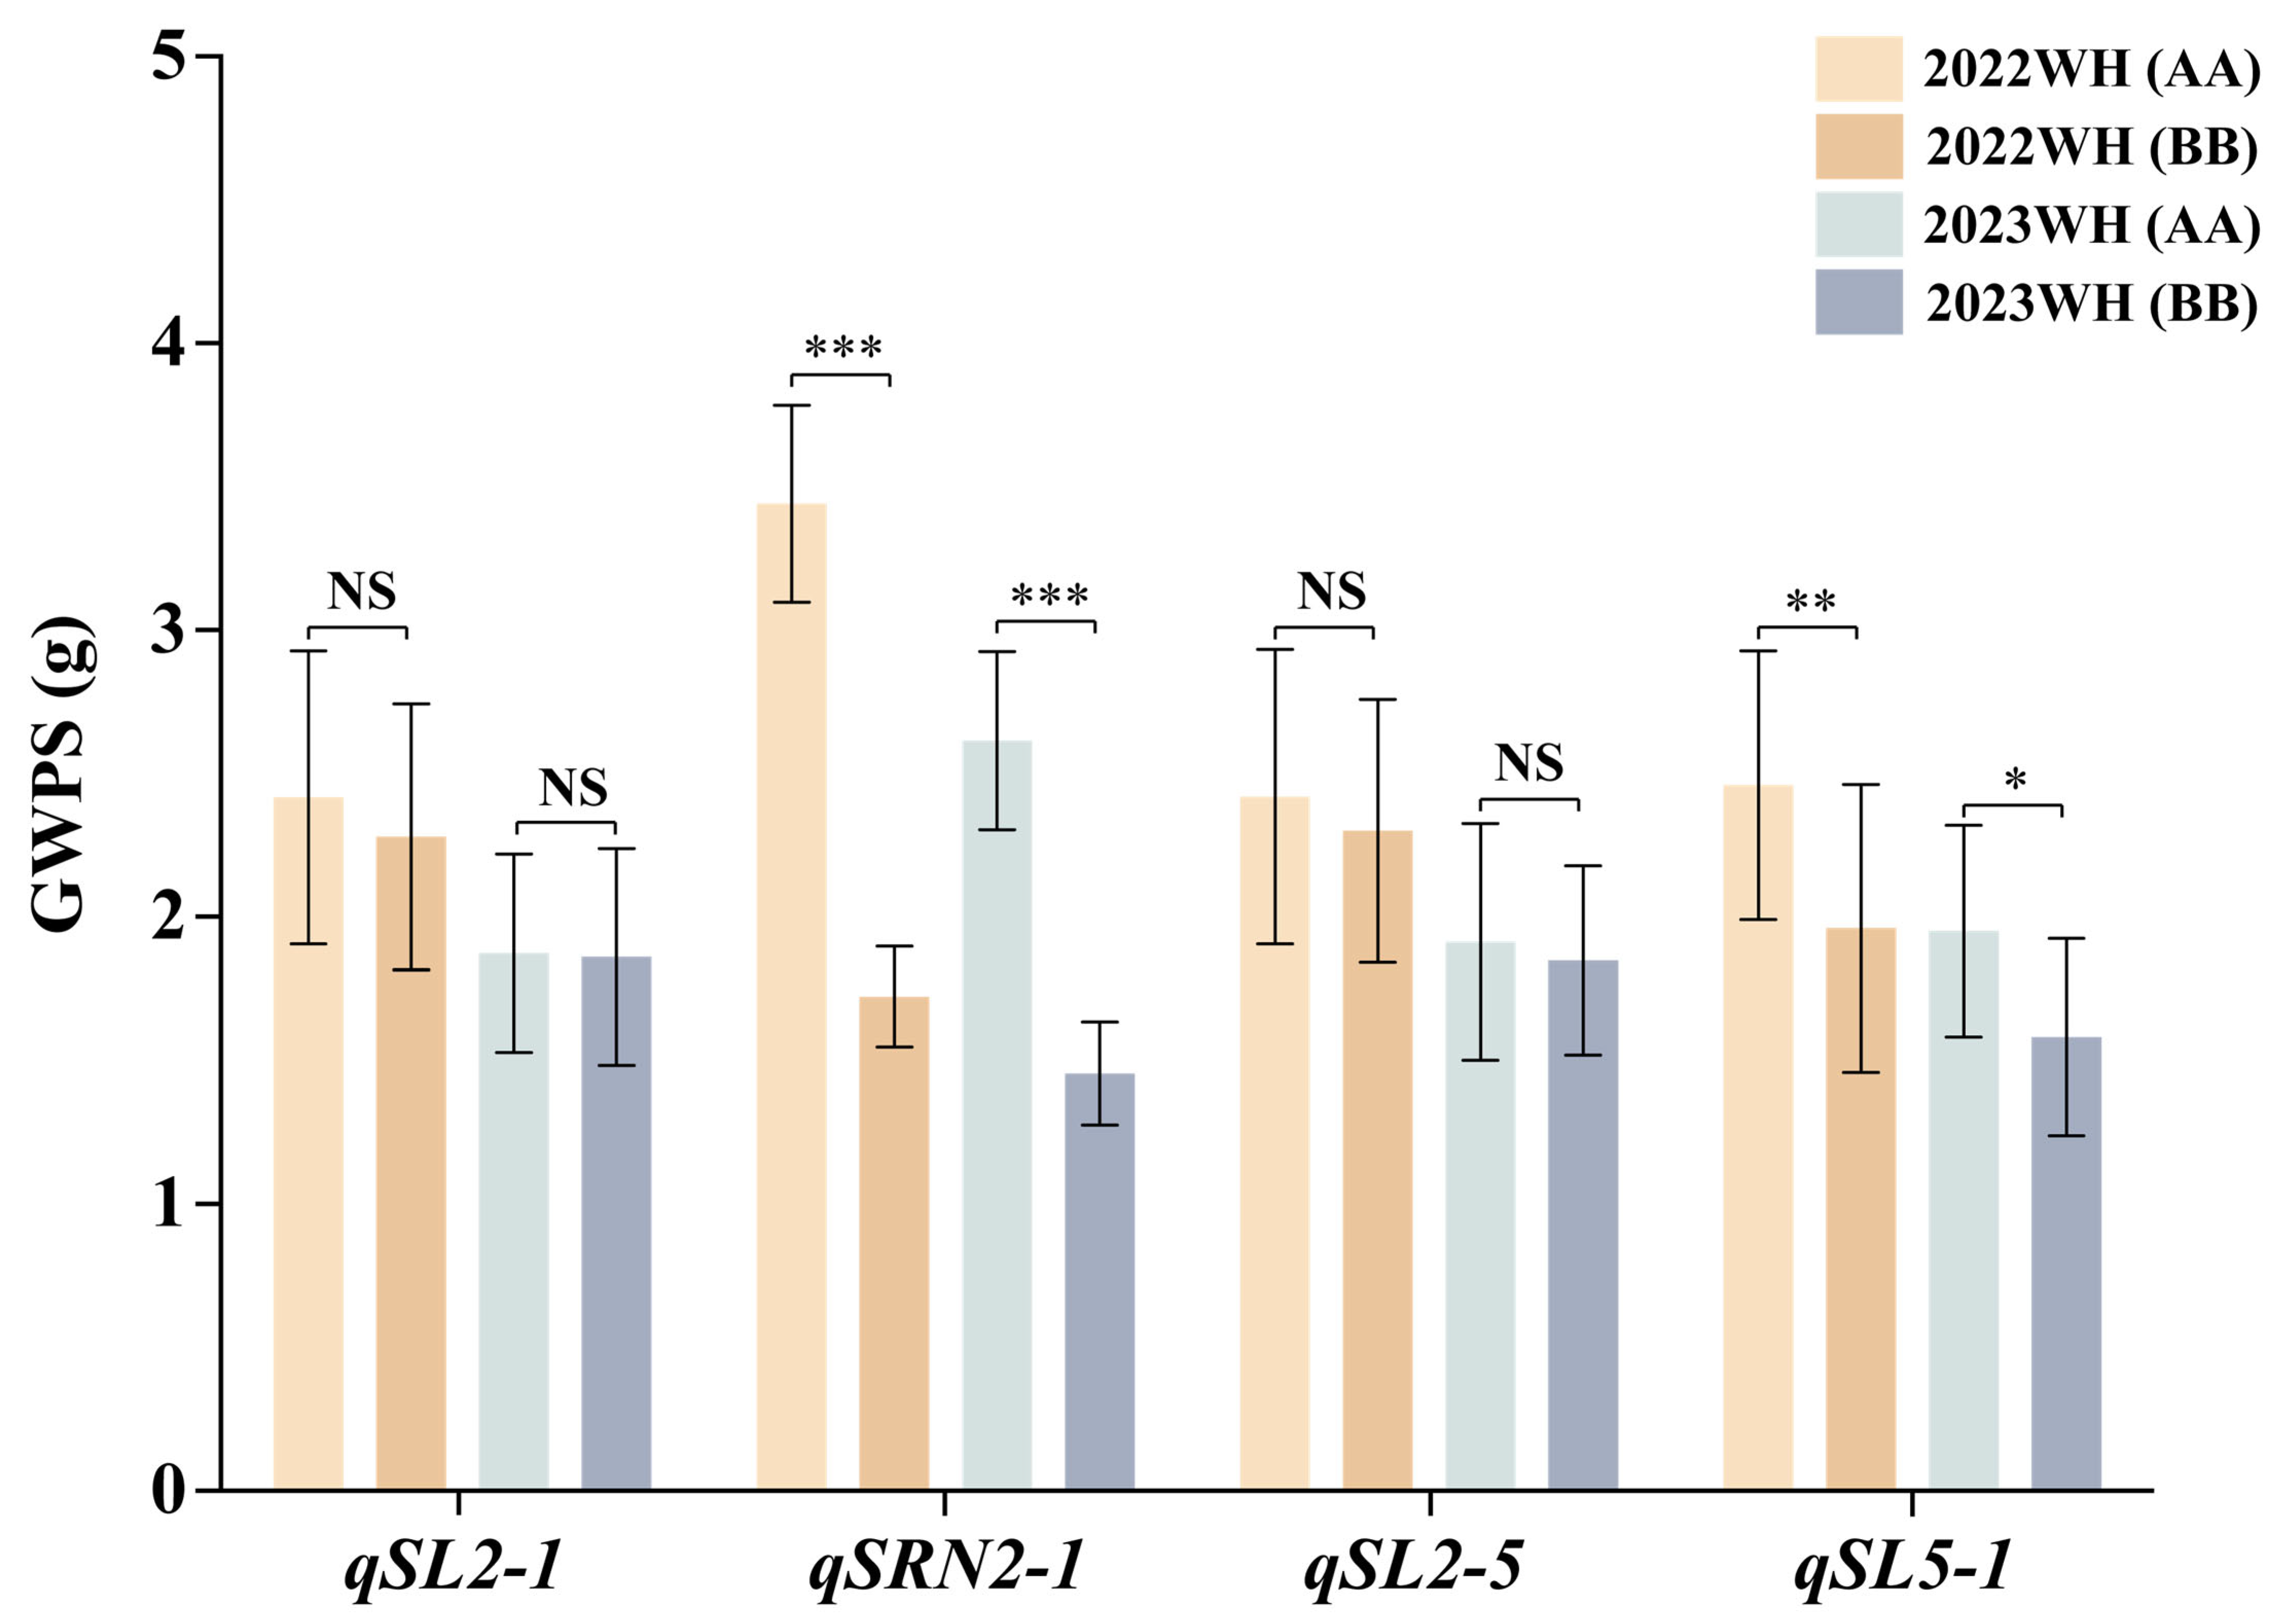
3.4. QTL Effects on Theoretical GWPS

To assess the effect of these QTLs on yield, the theoretical GWPS for each line was calculated. For each QTL, the RIL population was categorized into two groups (i.e., genotype same as YJ or H30), and two genotypes of theoretical GWPS were compared to assess each QTL’s effect on GWPS. The results of one-way analysis of variance (one-way ANOVA) showed that the theoretical GWPS values for the phenotypes of qSRN2-1 and qSL5-1 of the AA genotypes in the two environments were significantly different from BB, and qSRN2-1 had a larger effect on TGW than qSL5-1. There was no significant difference between the AA and BB genotypes in qSL2-1 and qSL2-5. This suggests that qSRN2-1 and qSL5-1 are potential QTLs contributing to barley yield.

4. Discussion

4.1. SD QTL Is Concurrent with SL Rather than SRN

SD is actually a function of two traits (SL and SRN) potentially controlled by multiple genes. Theoretically, SD should be correlated with both SL and SRN. However, Sourdille et al. (2000) evaluated a hexaploid wheat population and reported QTLs for SL on 1A, 2B, 2D, 4A, and 5A, all of which coincided with QTLs for spike compactness. Faris et al. (2014), mapping genes of spike compactness from wild emmer wheat, found spike compactness QTLs usually coincided with QTLs for SL as opposed to the number of spikelets per spike [5,42]. The results of these previous studies suggest that SD is strongly correlated with SL, and almost uncorrelated with SRN. Our studies on spike morphology and density have come to similar conclusions (Figure 1C and Table 2). In previous studies, no reasons were discussed for this situation. Here, the possible reason is that SD = SRN/SL. The barley spike consists of a segment of rachis nodes, so under ideal conditions, SL is equal to the product of SRN and SRL. Therefore, SD = SRN/SRN×SRL, SRN is eliminated, SD is theoretically equal to the reciprocal of SRL, and SRL only has an effect on SL, not SRN.

4.2. vrs1 Is a Candidate Gene for the qSRN2-1

The barley spike is characterized by a triple spikelet meristem (one central and two lateral spikelets). Previous studies have shown that vrs1 regulates lateral spikelet development, reducing it in size and making it sterile [43]. There is no doubt that vrs1 could regulate spike morphology in barley; however, vrs1 has not been shown to regulate SRN in previous studies [9]. In this study, a QTL interval containing vrs1 was targeted for the regulation of SRN, and can influence GWPS. Recent studies have shown that a locus (Morex V3 physical distance: 570,228,805–570,231,947 bp, within qSRN2-1), approximately 0.57 Mb upstream of the vrs1 gene, has been identified as a site which could affect barley SL, thousand-grains weight, and chlorophyll content in heat stress [44]. It has been reported that vrs1 can affect leaf width and vein number [45]. These studies suggest that vrs1 may be a pleiotropy gene. Consequently, we presume that vrs1 is a potential gene within the qSRN2-1 interval that regulates SRNs, and its functioning may be related to the environment or specific SNP mutations.

4.3. Analysis of Candidate Genes for Other Stable and Major QTLs

qSL2-1 is the smallest interval localized in this study, with only 0.06 Mb, and Morex V3 shows no high-confidence genes within this interval. Comparison to the pan-genome 2.0 identifies three high-confidence genes, HORVU.MOREX.PROJ.2HG00146000, HORVU.MOREX.PROJ.2HG00146020, and HORVU.MOREX.PROJ.2HG00146040, which are annotated as D-3-phosphoglycerate dehydrogenase, retrotransposon protein, and 40S ribosomal protein S14, respectively. This QTL is approximately 10 Mb away from the gene HvSRN1 (HORVU.MOREX.r3.2HG064020) that regulates SRN in barley [9]. qSL2-1 was localized in the SRN but was not stable. Because of its distance from HvSRN1, it was not considered a candidate gene for this interval.
zeo1 encodes an APELATA2 transcription factor, and regulates SL with miR172, but has no effect on SRN in barley. Plants carrying the mutant zeo1 gene have shorter and more compact spikes. The mechanism of the zeo1 regulation of SL is that a sequence can be targeted by miR172, resulting in cleavage of the mRNA transcript by zeo1. When a non-synonymous mutation occurs in a base within the miR172 binding domain, miR172 binds to it in an unstable manner, leading to a decrease in the cleavage rate; ultimately, AP2 functions properly and inhibits spike growth [26]. In the present study, one of the parents YJ has a non-synonymous mutation in the miR172 binding domain of zeo1. Although the mutated locus is different from the material previously studied, it is likely to be a reason for the reduction in SL in YJ.

4.4. Different Genes and Loci Regulate SL in Different Ways

Some association between the three spike traits was observed; spike-related regulatory genes can affect SL by controlling the number and compactness of rachis nodes. Consequently, changes in SL are most likely caused by changes in SRN or SD. In this study, qSL2-1 and qSL5-1 were determined to control both SL and SRN, suggesting that these two QTLs are responsible for the control of SL by regulating SRN. qSL2-5 was localized in both SL and SD, suggesting that it affects SL by regulating SD. However, it is curious that qSRN2-1 is only localized in SRN. The most probable explanation is that qSRN2-1 increases the seed angle while increasing SRN, resulting in a more compact arrangement of seeds and counteracting the effect of SRN in increasing SL. This is consistent with previous research, such as the finding that dsp.ar and zeo1 affect SL by affecting SD [29], and that HvSRN1 affects SL by affecting SRN [9]. Most of the QTLs and genes affecting SRN can have an impact on yield, such as qSRN2-1, qSL5-1, and HvSRN1 (Figure 5 shows that qSL2-1 did not have a significant effect on GWPS), implying that these loci and genes are more valuable for research and application in molecular-assisted breeding to increase yield. Although QTLs and genes affecting SD also affect grain traits, with loose spike patterns giving more space for seed growth and compact spike patterns reducing the probability of seed infection by fungi, the effects are weaker compared to the former. There are no genes or loci identified that can affect SL, SRN, and SD simultaneously.

4.5. Study Limitations and Breeding Perspectives

Although four stable and primary QTLs were identified in this study, there are still some shortcomings. For example, the population size used in this study was small with only 172 lines, and if the mapping population is expanded, a larger number of QTLs with smaller physical distances may be found; in addition, only multi-year, single-site investigations of spike traits were carried out in this study, which may mean that the identified QTLs reflect site-specific bias.
For future research work, this study found that qSL2-1 is a QTL with a particularly small physical distance, which should facilitate further subsequent mining for candidate genes. qSRN2-1 and qSL5-1 are two QTLs with a strong correlation with GWPS, and molecular markers can be developed subsequently to help breeders improve spike traits more efficiently and accurately, thereby increasing yield.

5. Conclusions

In conclusion, four QTLs regulating the stable and major effect of spike traits were detected using high-density genetic linkage mapping, of which two were novel QTLs, one QTL candidate gene was probably vrs1, and one was determined to be a gene that has been previously reported. qSRN2-1 and qSL5-1 are potential yield-enhancing QTLs, which require further characterization. In the future, we will verify whether vrs1 is a candidate gene within the qSRN2-1 and further narrow down the physical interval of qSL5-1 to identify candidate genes.

Supplementary Materials

The following supporting information can be downloaded at: https://www.mdpi.com/article/10.3390/agronomy15051185/s1, Table S1: QTL mapping results of three spike traits in four environments; Table S2. Collated, merging, and naming of 50 QTLs; Table S3: Phenotypes of 172 lines of RIL population on three spike traits; Table S4: Calculation procedure and results of GWPS for 172 lines of the RIL population.

Author Contributions

Conceptualization, X.R.; methodology, X.R. and X.W.; software, X.W. and J.C.; validation, X.R. and X.W.; formal analysis, X.W.; investigation, X.W., J.C. and C.W.; resources, X.R.; data curation, X.W.; writing—original draft preparation, X.W. and J.C.; writing—review and editing, X.R. and G.S.; visualization, J.C. and Q.C.; supervision, X.R.; project administration, X.R.; funding acquisition, X.R. All authors have read and agreed to the published version of the manuscript.

Funding

This work was supported by funding from the China Agriculture Research System of MOF and MARA (CARS-5), Hubei Provincial Key R&D Program (2023BBB100).

Data Availability Statement

Data are contained within the article.

Conflicts of Interest

The authors declare no conflicts of interest.

Abbreviations

The following abbreviations are used in this manuscript:
QTLQuantitative trait locus
RILRecombinant inbred line
YJYongjiabaidamai
H30Hua 30
SLSpike length
SRNSpike rachis node number
SDSpike density
SRLSpike rachis node length
Vrs1Six-rowed spike 1
Cly1Cleistogamy1
Zeo1Zeocriton1
DpsDense spike
TGWThousand-grains weight
GWPSGrain weight per spike

References

  1. Niu, C.; Cen, Q.; Chen, Y.; Yan, J.; Ding, N.; Zhang, X.; Zhang, X.; Wu, Y.; Fang, Y.; Xue, D. QTL analysis of Chlorophyll Content at different growth stages of Barley. Plant Growth Regul. 2022, 98, 491–497. [Google Scholar] [CrossRef]
  2. Raj, R.; Shams, R.; Pandey, V.K.; Dash, K.K.; Singh, P.; Bashir, O. Barley phytochemicals and health promoting benefits: A comprehensive review. J. Agric. Food Res. 2023, 14, 100677. [Google Scholar] [CrossRef]
  3. Harwood, W.A. An Introduction to Barley: The Crop and the Model. Methods Mol. Biol. 2019, 1900, 1–5. [Google Scholar] [CrossRef] [PubMed]
  4. Sakellariou, M.; Mylona, P.V. New Uses for Traditional Crops: The Case of Barley Biofortification. Agronomy 2020, 10, 1964. [Google Scholar] [CrossRef]
  5. Faris, J.D.; Zhang, Z.; Garvin, D.F.; Xu, S.S. Molecular and comparative mapping of genes governing spike compactness from wild emmer wheat. Mol. Genet. Genom. 2014, 289, 641–651. [Google Scholar] [CrossRef]
  6. Koppolu, R.; Schnurbusch, T. Developmental pathways for shaping spike inflorescence architecture in barley and wheat. J. Integr. Plant Biol. 2019, 61, 278–295. [Google Scholar] [CrossRef]
  7. Sakuma, S.; Schnurbusch, T. Of floral fortune: Tinkering with the grain yield potential of cereal crops. New Phytol. 2020, 225, 1873–1882. [Google Scholar] [CrossRef]
  8. Wang, C.; Yang, X.; Li, G. Molecular Insights into Inflorescence Meristem Specification for Yield Potential in Cereal Crops. Int. J. Mol. Sci. 2021, 22, 3508. [Google Scholar] [CrossRef]
  9. Fan, C.; Xu, D.; Wang, C.; Chen, Z.; Dou, T.; Qin, D.; Guo, A.; Zhao, M.; Pei, H.; Zhao, M.; et al. Natural variations of HvSRN1 modulate the spike rachis node number in barley. Plant Commun. 2024, 5, 100670. [Google Scholar] [CrossRef]
  10. Casas, A.M.; Contreras-Moreira, B.; Cantalapiedra, C.P.; Sakuma, S.; Gracia, M.P.; Moralejo, M.; Molina-Cano, J.L.; Komatsuda, T.; Igartua, E. Resequencing theVrs1 gene in Spanish barley landraces revealed reversion of six-rowed to two-rowed spike. Mol. Breed. 2018, 38, 51. [Google Scholar] [CrossRef]
  11. Komatsuda, T.; Li, W.; Takaiwa, F.; Oka, S. High resolution map around the vrs1 locus controlling two- and six-rowed spike in barley, Hordeum vulgare. Genome 1999, 42, 248–253. [Google Scholar] [CrossRef]
  12. Komatsuda, T.; Pourkheirandish, M.; He, C.; Azhaguvel, P.; Kanamori, H.; Perovic, D.; Stein, N.; Graner, A.; Wicker, T.; Tagiri, A.; et al. Six-rowed barley originated from a mutation in a homeodomain-leucine zipper I-class homeobox gene. Proc. Natl. Acad. Sci. USA 2007, 104, 1424–1429. [Google Scholar] [CrossRef] [PubMed]
  13. Youssef, H.M.; Eggert, K.; Koppolu, R.; Alqudah, A.M.; Poursarebani, N.; Fazeli, A.; Sakuma, S.; Tagiri, A.; Rutten, T.; Govind, G.; et al. VRS2 regulates hormone-mediated inflorescence patterning in barley. Nat. Genet. 2017, 49, 157–161. [Google Scholar] [CrossRef] [PubMed]
  14. Bull, H.; Casao, M.C.; Zwirek, M.; Flavell, A.J.; Thomas, W.T.B.; Guo, W.; Zhang, R.; Rapazote-Flores, P.; Kyriakidis, S.; Russell, J.; et al. Barley SIX-ROWED SPIKE3 encodes a putative Jumonji C-type H3K9me2/me3 demethylase that represses lateral spikelet fertility. Nat. Commun. 2017, 8, 936. [Google Scholar] [CrossRef] [PubMed]
  15. Koppolu, R.; Anwar, N.; Sakuma, S.; Tagiri, A.; Lundqvist, U.; Pourkheirandish, M.; Rutten, T.; Seiler, C.; Himmelbach, A.; Ariyadasa, R.; et al. Six-rowed spike4 (Vrs4) controls spikelet determinacy and row-type in barley. Proc. Natl. Acad. Sci. USA 2013, 110, 13198–13203. [Google Scholar] [CrossRef]
  16. Ramsay, L.; Comadran, J.; Druka, A.; Marshall, D.F.; Thomas, W.T.B.; Macaulay, M.; MacKenzie, K.; Simpson, C.; Fuller, J.; Bonar, N.; et al. INTERMEDIUM-C, a modifier of lateral spikelet fertility in barley, is an ortholog of the maize domestication gene TEOSINTE BRANCHED 1. Nat. Genet. 2011, 43, 169–172. [Google Scholar] [CrossRef]
  17. Evans, L.T.; Law, I.F.W. Aspects of the Comparative Physilogy of Grain Yield in Cereals. Adv. Agron. 1976, 28, 301–359. [Google Scholar]
  18. Huang, Y.; Kamal, R.; Shanmugaraj, N.; Rutten, T.; Thirulogachandar, V.; Zhao, S.; Hoffie, I.; Hensel, G.; Rajaraman, J.; Moya, Y.A.T.; et al. A molecular framework for grain number determination in barley. Sci. Adv. 2023, 9, eadd0324. [Google Scholar] [CrossRef]
  19. Slafer, G.A.; Molina-Cano, J.L.; Savin, R.; Araus, J.L.; Romagosa, I. Barley Science: Recent Advances from Molecular Biology to Agronomy of Yield and Quality; CRC Press: Boca Raton, FL, USA, 2002. [Google Scholar]
  20. Wang, J.; Yang, J.; McNeil, D.L.; Zhou, M. Identification and molecular mapping of a dwarfing gene in barley (Hordeum vulgare L.) and its correlation with other agronomic traits. Euphytica 2010, 175, 331–342. [Google Scholar] [CrossRef]
  21. Costa, J.M.; Corey, A.; Hayes, P.M.; Jobet, C.; Kleinhofs, A.; Kopisch-Obusch, A.; Kramer, S.F.; Kudrna, D.; Li, M.; Riera-Lizarazu, O.; et al. Molecular mapping of the Oregon Wolfe Barleys: A phenotypically polymorphic doubled-haploid population. Theor. Appl. Genet. 2001, 103, 415–424. [Google Scholar] [CrossRef]
  22. Kato, K.; Sonokawa, R.; Miura, H.; Sawada, S. Dwarfing effect associated with the threshability gene Q on wheat chromosome 5A. Plant Breed. 2003, 122, 489–492. [Google Scholar] [CrossRef]
  23. Turuspekov, Y.; Mano, Y.; Honda, I.; Kawada, N.; Watanabe, Y.; Komatsuda, T. Identification and mapping of cleistogamy genes in barley. Theor. Appl. Genet. 2004, 109, 480–487. [Google Scholar] [CrossRef] [PubMed]
  24. Zhao, K.; Xiao, J.; Liu, Y.; Chen, S.; Yuan, C.; Cao, A.; You, F.M.; Yang, D.; An, S.; Wang, H.; et al. Rht23 (5Dq′) likely encodes a Q homeologue with pleiotropic effects on plant height and spike compactness. Theor. Appl. Genet. 2018, 131, 1825–1834. [Google Scholar] [CrossRef]
  25. Chen, A.; Baumann, U.; Fincher, G.B.; Collins, N.C. Flt-2L, a locus in barley controlling flowering time, spike density, and plant height. Funct. Integr. Genom. 2009, 9, 243–254. [Google Scholar] [CrossRef]
  26. Houston, K.; McKim, S.M.; Comadran, J.; Bonar, N.; Druka, I.; Uzrek, N.; Cirillo, E.; Guzy-Wrobelska, J.; Collins, N.C.; Halpin, C.; et al. Variation in the interaction between alleles of HvAPETALA2 and microRNA172 determines the density of grains on the barley inflorescence. Proc. Natl. Acad. Sci. USA 2013, 110, 16675–16680. [Google Scholar] [CrossRef] [PubMed]
  27. Taketa, S.; Yuo, T.; Sakurai, Y.; Miyake, S.; Ichii, M. Molecular mapping of the short awn 2 and dense spike 1genes on barley chromosome 7H. Breed. Sci. 2011, 61, 80–85. [Google Scholar] [CrossRef]
  28. Druka, A.; Franckowiak, J.; Lundqvist, U.; Bonar, N.; Alexander, J.; Houston, K.; Radovic, S.; Shahinnia, F.; Vendramin, V.; Morgante, M.; et al. Genetic dissection of barley morphology and development. Plant Physiol. 2011, 155, 617–627. [Google Scholar] [CrossRef]
  29. Shahinnia, F.; Druka, A.; Franckowiak, J.; Morgante, M.; Waugh, R.; Stein, N. High resolution mapping of Dense spike-ar (dsp.ar) to the genetic centromere of barley chromosome 7H. Theor. Appl. Genet. 2012, 124, 373–384. [Google Scholar] [CrossRef]
  30. Mikołajczak, K.; Ogrodowicz, P.; Gudyś, K.; Krystkowiak, K.; Sawikowska, A.; Frohmberg, W.; Górny, A.; Kędziora, A.; Jankowiak, J.; Józefczyk, D.; et al. Quantitative Trait Loci for Yield and Yield-Related Traits in Spring Barley Populations Derived from Crosses between European and Syrian Cultivars. PLoS ONE 2016, 11, e0155938. [Google Scholar] [CrossRef]
  31. Li, Z.; Lhundrup, N.; Guo, G.; Dol, K.; Chen, P.; Gao, L.; Chemi, W.; Zhang, J.; Wang, J.; Nyema, T.; et al. Characterization of Genetic Diversity and Genome-Wide Association Mapping of Three Agronomic Traits in Qingke Barley (Hordeum vulgare L.) in the Qinghai-Tibet Plateau. Front. Genet. 2020, 11, 638. [Google Scholar] [CrossRef]
  32. Lu, Q.; Dockter, C.; Sirijovski, N.; Zakhrabekova, S.; Lundqvist, U.; Gregersen, P.L.; Hansson, M. Analysis of barley mutants ert-c.1 and ert-d.7 reveals two loci with additive effect on plant architecture. Planta 2021, 254, 9. [Google Scholar] [CrossRef] [PubMed]
  33. Yao, E.; Blake, V.C.; Cooper, L.; Wight, C.P.; Michel, S.; Cagirici, H.B.; Lazo, G.R.; Birkett, C.L.; Waring, D.J.; Jannink, J.-L.; et al. GrainGenes: A data-rich repository for small grains genetics and genomics. Database 2022, 2022, baac034. [Google Scholar] [CrossRef] [PubMed]
  34. Wang, J.; Tang, Y.; Li, J.; Zhang, J.; Huang, F.; Li, Q.; Chen, B.; Zhang, L.A.; Li, T.; Zhang, H.; et al. Fine mapping and candidate gene mining of QSc/Sl.cib-7H for spike compactness and length and its pleiotropic effects on yield-related traits in barley (Hordeum vulgare L.). Theor. Appl. Genet. 2024, 137, 269. [Google Scholar] [CrossRef]
  35. Powder, K.E. Quantitative Trait Loci (QTL) Mapping. Methods Mol. Biol. 2020, 2082, 211–229. [Google Scholar] [CrossRef]
  36. Ikram, M.; Rauf, A.; Rao, M.J.; Maqsood, M.F.K.; Bakhsh, M.Z.M.; Ullah, M.; Batool, M.; Mehran, M.; Tahira, M. CRISPR-Cas9 based molecular breeding in crop plants: A review. Mol. Biol. Rep. 2024, 51, 227. [Google Scholar] [CrossRef]
  37. Zhang, F.; Wen, Y.; Guo, X. CRISPR/Cas9 for genome editing: Progress, implications and challenges. Hum. Mol. Genet. 2014, 23, R40–R46. [Google Scholar] [CrossRef]
  38. Li, T.; Deng, G.; Su, Y.; Yang, Z.; Tang, Y.; Wang, J.; Zhang, J.; Qiu, X.; Pu, X.; Yang, W.; et al. Genetic dissection of quantitative trait loci for grain size and weight by high-resolution genetic mapping in bread wheat (Triticum aestivum L.). Theor. Appl. Genet. 2022, 135, 257–271. [Google Scholar] [CrossRef]
  39. McCouch, S.; Cho, Y.-G.; Yano, M.; Paul, E.; Blinstrub, M.; Morishima, H.; Kinoshita, T. Report on QTL nomenclature. Rice Genet. Coop. 1997, 14, 11–13. [Google Scholar]
  40. Navrátilová, P.; Toegelová, H.; Tulpová, Z.; Kuo, Y.T.; Stein, N.; Doležel, J.; Houben, A.; Šimková, H.; Mascher, M. Prospects of telomere-to-telomere assembly in barley: Analysis of sequence gaps in the MorexV3 reference genome. Plant Biotechnol. J. 2022, 20, 1373–1386. [Google Scholar] [CrossRef]
  41. Nair, S.K.; Wang, N.; Turuspekov, Y.; Pourkheirandish, M.; Sinsuwongwat, S.; Chen, G.; Sameri, M.; Tagiri, A.; Honda, I.; Watanabe, Y.; et al. Cleistogamous flowering in barley arises from the suppression of microRNA-guided HvAP2 mRNA cleavage. Proc. Natl. Acad. Sci. USA 2010, 107, 490–495. [Google Scholar] [CrossRef]
  42. Sourdille, P.; Tixier, M.H.; Charmet, G.; Gay, G.; Cadalen, T.; Bernard, S.; Bernard, M. Location of genes involved in ear compactness in wheat (Triticum aestivum) by means of molecular markers. Mol. Breed. 2000, 6, 247–255. [Google Scholar] [CrossRef]
  43. Ren, X.; Wang, Y.; Yan, S.; Sun, D.; Sun, G. Population genetics and phylogenetic analysis of the vrs1 nucleotide sequence in wild and cultivated barley. Genome 2014, 57, 239–244. [Google Scholar] [CrossRef] [PubMed]
  44. Elkelish, A.; Alqudah, A.M.; Alhudhaibi, A.M.; Alqahtani, H.; Börner, A.; Thabet, S.G. Inherited endurance: Deciphering genetic associations of transgenerational and intergenerational heat stress memory in barley. Plant Mol. Biol. 2025, 115, 42. [Google Scholar] [CrossRef] [PubMed]
  45. Thirulogachandar, V.; Alqudah, A.M.; Koppolu, R.; Rutten, T.; Graner, A.; Hensel, G.; Kumlehn, J.; Bräutigam, A.; Sreenivasulu, N.; Schnurbusch, T.; et al. Leaf primordium size specifies leaf width and vein number among row-type classes in barley. Plant J. 2017, 91, 601–612. [Google Scholar] [CrossRef]
Disclaimer/Publisher’s Note: The statements, opinions and data contained in all publications are solely those of the individual author (s) and contributor (s) and not of MDPI and/or the editor (s). MDPI and/or the editor (s) disclaim responsibility for any injury to people or property resulting from any ideas, methods, instructions or products referred to in the content.
Figure 1. (A): Parents’ spike morphology at two weeks after heading stage; (B): Normal distribution of the RIL population in different environments; (C): Correlation analysis of different spike-related traits based on different environments (***: significant at the level of p < 0.001).
Agronomy 15 01185 g001
Figure 2. Mapping results of three spike traits in four environments. The red and black dashed lines represent LOD = 3 and LOD = 5, respectively.
Agronomy 15 01185 g002
Figure 3. Physical location of 3 stable and major QTLs on chromosome 2H. Centromere position refers to Navrátilová et al. [40].
Agronomy 15 01185 g003
Figure 4. Parental amino acid comparison of zeo1. miR172 targeting site refers to Nair et al. [41] and Houston et al. [26]. Red font indicates parents differential SNPs.
Agronomy 15 01185 g004
Figure 5. Effect of different QTLs and genotypes on GWPS. ‘*’, ‘**’, and ‘***’ represent significant at p < 0.05, p < 0.01, and p < 0.001 levels, respectively, ‘NS’ represents no significant difference. AA indicates the RIL population group genotypes same as YJ and BB indicates the RIL population group genotypes same as H30.
Agronomy 15 01185 g005
Table 1. Descriptive statistical analysis of SL, SRN, and SD of the parents and the RIL population.
TraitsYearParentThe YJ × H30 RIL Lines
YJH30Min.Max.MeanSDSkewnessKurtosisCV (%)H2 (%)
SL (cm)2022WH5.007.803.5310.636.691.490.203−0.50622.2596.33
2023WH4.287.433.809.286.571.29−0.021−0.7419.68
2024WH5.137.303.609.586.461.400.049−0.75421.60
BLUP 4.059.246.571.300.03−0.82119.73
SRN2022WH24.0035.5018.0047.0032.815.03−0.181−0.21915.3492.16
2023WH23.0038.0018.6746.6733.415.74−0.044−0.37817.20
2024WH26.0036.5020.0044.5033.795.39−0.118−0.63215.95
BLUP 21.1243.7733.284.63−0.054−0.49813.91
SD (cm−1)2022WH4.814.553.477.945.050.940.671−0.09918.6885.89
2023WH5.385.153.117.285.170.870.379−0.24416.80
2024WH5.045.013.478.305.381.020.611−0.08618.98
BLUP 3.977.035.200.720.515−0.50513.80
SL, SRN, and SD represent the spike length (cm), spike rachis node number, and spike density (cm−1), respectively. BLUP: Best linear unbiased prediction; SD: Standard deviation; CV (%): Coefficient of variation; H2 (%): Broad-sense heritability; Bolded numbers are phenotypic values of the parents.
Table 2. The most stable and major QTLs for the spike-related traits mapped in this study.
QTLTraitsEnvironmentChromosomePosition (cM)Left MarkerRight MarkerLODPVE (%)
qSL2-1SL/SRN22WH/23WH/BLUP2H75.5–76.5BM1294BM129516.82–28.4814.23–20.38
qSRN2-1SRN22WH/23WH/24WH/BLUP2H106.5–108.5BM1767BM17799.67–17.2510.74–18.24
qSL2-5SL/SD22WH/24WH/BLUP2H150.5–151.5BM1997BM199828.47–36.1128.51–53.87
qSL5-1SL/SRN22WH/23WH/24WH/BLUP5H126.5–133.5EM1736EM17977.53–26.889.93–20.79
Table 3. Stable and major QTLs physical distance in Morex V3.
Stable and Major QTLsChromosomesMorex V3
Left Physical Distance (bp)Right Physical Distance (bp)Interval Length (Mb)
qSL2-12H463,148,813463,211,9120.06
qSRN2-12H570,208,797572,896,2312.69
qSL2-52H634,533,780635,723,4021.19
qSL5-15H526,921,437537,239,98110.31
Disclaimer/Publisher’s Note: The statements, opinions and data contained in all publications are solely those of the individual author(s) and contributor(s) and not of MDPI and/or the editor(s). MDPI and/or the editor(s) disclaim responsibility for any injury to people or property resulting from any ideas, methods, instructions or products referred to in the content.

