Article

The Projected Effects of Climate Change on the Potential Distribution of Planococcus minor Based on Ensemble Species Distribution Models

1
State Key Laboratory of Agricultural and Forestry Biosecurity, MARA Key Lab of Surveillance and Management for Plant Quarantine Pests, College of Plant Protection, China Agricultural University, Beijing 100193, China
2
Technical Center for Animal, Plant and Food Inspection and Quarantine of Shanghai Customs, Shanghai 201210, China
3
The Animal, Plant & Foodstuff Inspection Center of Tianjin Customs, Tianjin 300461, China
*
Authors to whom correspondence should be addressed.
Agronomy 2025, 15(5), 1165; https://doi.org/10.3390/agronomy15051165
Submission received: 8 April 2025 / Revised: 7 May 2025 / Accepted: 8 May 2025 / Published: 10 May 2025
(This article belongs to the Special Issue Sustainable Pest Management under Climate Change)

Abstract

:
Planococcus minor is an invasive pest of significant economic importance that has attracted international attention. Predicting the potential geographic distribution of P. minor under climate change is crucial to developing effective prevention and control strategies for safeguarding agricultural productivity. In this study, we selected four species distribution models (GBM, GLM, MARS, MAXENT) and utilized the Biomod2 package to construct an ensemble model for predicting the suitable habitats of P. minor under the averaged climate conditions of 1970–2000 and 2041–2060 (2050s), including a low-emission pathway (SSP1-2.6) and a high-emission pathway (SSP5-8.5). Among the 19 bioclimatic variables considered, precipitation of the wettest quarter and temperature seasonality were identified as the most influential factors affecting the distribution of P. minor. Under the averaged climate conditions of 1970–2000, suitable habitats for P. minor are mainly distributed in tropical and subtropical regions worldwide. In China, highly suitable zones are concentrated in Yunnan, Guangxi, Guangdong, Hainan, and Taiwan. In the future, the global range of P. minor is projected to expand, with some highly suitable areas transitioning toward medium and low suitability. Under the high-emission pathway (SSP5-8.5) scenario, suitable habitats in China are anticipated to exhibit a pronounced trend of inland expansion. Establishing an ensemble model to predict the potential geographic distribution of P. minor will facilitate the assessment of invasion and spread risks, thereby providing a scientific foundation for developing targeted prevention and monitoring strategies for relevant regions.

1. Introduction

Climate change has significantly reshaped the distribution ranges of agricultural pests [1,2]. Rising global temperatures and shifting precipitation patterns are anticipated to exacerbate several challenges, including the expansion of insect ranges, enhanced overwintering survival rates, increased numbers of breeding generations, and elevated risks of invasive pest outbreaks [3,4]. These changes pose serious threats to agricultural ecosystems and the conservation of biodiversity. In 2023, the IPCC’s Sixth Assessment Report highlighted a global temperature rise of 1.1 °C above pre-industrial levels [5]. As temperatures continue to rise, pests once confined to specific regions are surpassing ecological barriers, broadening their geographic ranges [6,7]. Invasive alien species (IAS) have a significant impact on ecosystems and human health at local and regional levels [8]. Over 3500 IAS are documented globally; in China, 660 have been identified, with 120 severely affecting agriculture [9,10]. The processes of globalization and international trade have intensified human-driven IAS spread [11,12]. Global climate change is reshaping the distribution, migration, and adaptability of IAS [13]. This underscores the necessity of incorporating climate considerations into management strategies and enhancing monitoring and preventive measures to tackle emerging challenges, thereby safeguarding ecosystem stability and sustainability [14].
Planococcus minor (Hemiptera: Pseudococcidae), commonly referred to as the passionvine mealybug, Pacific mealybug, or guava mealybug [15], is a globally significant quarantine pest, particularly prevalent in tropical and subtropical regions. This pest is notable for its broad host range and exceptional adaptability, infesting over 250 plant species spanning more than 80 genera [16]. These hosts include many economically important tropical and subtropical fruits, vegetables, ornamental plants, and crops, such as bananas, guavas, mangoes, durians, potatoes, soybeans, sweet potatoes, cotton, coffee, and cocoa [16,17]. Both nymphs and adults of P. minor feed on host plants by piercing and sucking sap, which can result in stunted growth, reduced yield and quality, and, in severe cases, plant death [18]. The honeydew excreted by the pest promotes the growth of sooty mold, which impairs photosynthesis [19], and attracts ants, such as Anoplolepis longipes, that facilitate the pest’s spread and protect it from natural predators [20]. Moreover, P. minor serves as a vector for plant pathogens, including mottle diseases and cocoa swollen shoot virus, with reported transmission rates of up to 40% for mottle diseases [21]. Under favorable conditions, P. minor completes multiple overlapping generations annually. In Taiwan, it causes year-round damage, with 8 to 9 generations per year. Female adults deposit eggs in cotton-like white waxy ovisacs, laying between 234 and 257 eggs per month. The egg stage lasts approximately 12 to 13 days. Temperature and humidity significantly influence its life cycle, with low temperatures and dry conditions enhancing reproduction [22].
Planococcus minor, originally native to South Asia [23], has now spread widely across more than 60 countries and regions, including the Neotropical zone [19]. In China, it was initially recorded only in Taiwan. However, since its first interception in fruit imports from Shenyang, Liaoning Province, northeast China, in 2008 [24], its detection frequency in the mainland has increased steadily. An analysis of intercepted quarantine pests in fruit imports from ASEAN countries to China (2005–2019) revealed that P. minor has risen from the third to the most frequently intercepted pest. The primary host plants associated with these interceptions include durian, longan, banana, rambutan, and custard apple, with Thailand and Vietnam identified as the main source countries [25,26]. This trend highlights the species’ increasing invasion potential. If P. minor were to spread widely across mainland China, it could pose a serious threat to both agricultural production and ecological security. Therefore, predicting its potential geographic distribution under climate change is crucial for developing effective prevention strategies and safeguarding agricultural systems.
Species Distribution Models (SDMs) are ecological tools that can establish relationships between species occurrence points and their environmental conditions. In practical applications, SDMs develop complex models of species–environment interactions by analyzing species distribution data alongside relevant environmental variables [27,28]. These models offer insights into the survival and reproductive potential of species under varying environmental conditions, enabling predictions of their potential distribution across diverse geographical areas. Since the introduction of BIOCLIM, the first widely adopted SDM, in 1984 [29], SDMs have seen significant advancements over the past four decades. They are now extensively applied in fields such as biodiversity conservation [30,31], species invasion studies [32,33,34], and species distribution forecasting [35]. A common method for predicting the potential impacts of climate change on species distribution is bioclimatic envelope modeling [36,37]. However, predictions derived from a single model often yield divergent outcomes. For instance, Pearson et al. [38] employed nine well-established single models to predict the potential distribution of four plant species in South Africa under both current and future climate scenarios. Despite using identical environmental variables and sampling points, their predictions varied considerably. The concept of ensemble modeling was first introduced by J.M. Bates and Nobel laureate C.W.J. Granger in 1969 [39]. Its application in ecology, however, emerged much later, with ensemble models for species distribution predictions only gaining attention in the early 21st century [40,41].
Biomod2 is an open-source R package developed in 2009 by Wilfried Thuiller and his team. It enables the treatment of a range of methodological uncertainties in models and the examination of species–environment relationships [42]. The package supports a wide range of species distribution models, including Generalized Linear Models (GLM), Generalized Additive Models (GAM), Maximum Entropy Model (MaxEnt), Random Forest (RF), Multivariate Adaptive Regression Splines (MARS), Classification Tree Analysis (CTA), Mixture Discriminant Analysis (MDA), Artificial Neural Networks (ANN), Boosted Regression Trees (BRT), Bioclimatic Envelope (BIOCLIM), and eXtreme Gradient Boosting (XGBoost) [43]. Biomod2 also facilitates ensemble predictions, enhancing forecast accuracy by integrating outputs from multiple models. Additionally, it can assess temporal species dynamics, generate species response curves, and evaluate the predictor variables that determine the distribution of species [43]. Compared to single models, ensemble models offer several key advantages. Single models are prone to overfitting specific datasets during training, whereas ensemble models mitigate this risk. When datasets contain noise or outliers, single models can be significantly affected, while ensemble models improve robustness by aggregating predictions from multiple models [44]. Moreover, ensemble models provide greater flexibility, allowing customization to address specific problems and data characteristics, thereby making them suitable for a wide range of complex classification and regression tasks [43,45,46].
Research on the suitable habitats of P. minor remains limited, with only a few studies reported by Qi et al. [47] and Shao et al. [22]. However, these studies relied on single models, which have inherent limitations. This study represents the first application of an ensemble modeling approach, implemented via the Biomod2 platform, to predict the potential geographic distribution of P. minor under climate change. We compiled distribution records of P. minor, identified key environmental variables (bio4: temperature seasonality; bio9: mean temperature of driest quarter; bio10: mean temperature of warmest quarter; bio11: mean temperature of coldest quarter; bio16: precipitation of wettest quarter), evaluated individual models, and selected appropriate models and ensemble strategies for further analysis. The results provide predictions of suitable habitat distribution for P. minor under the averaged climate conditions of 1970–2000 and 2041–2060 (2050s). These findings offer a robust scientific basis for precise risk assessments, the development of effective preventive strategies, and the implementation of targeted quarantine measures by regulatory authorities.

2. Materials and Methods

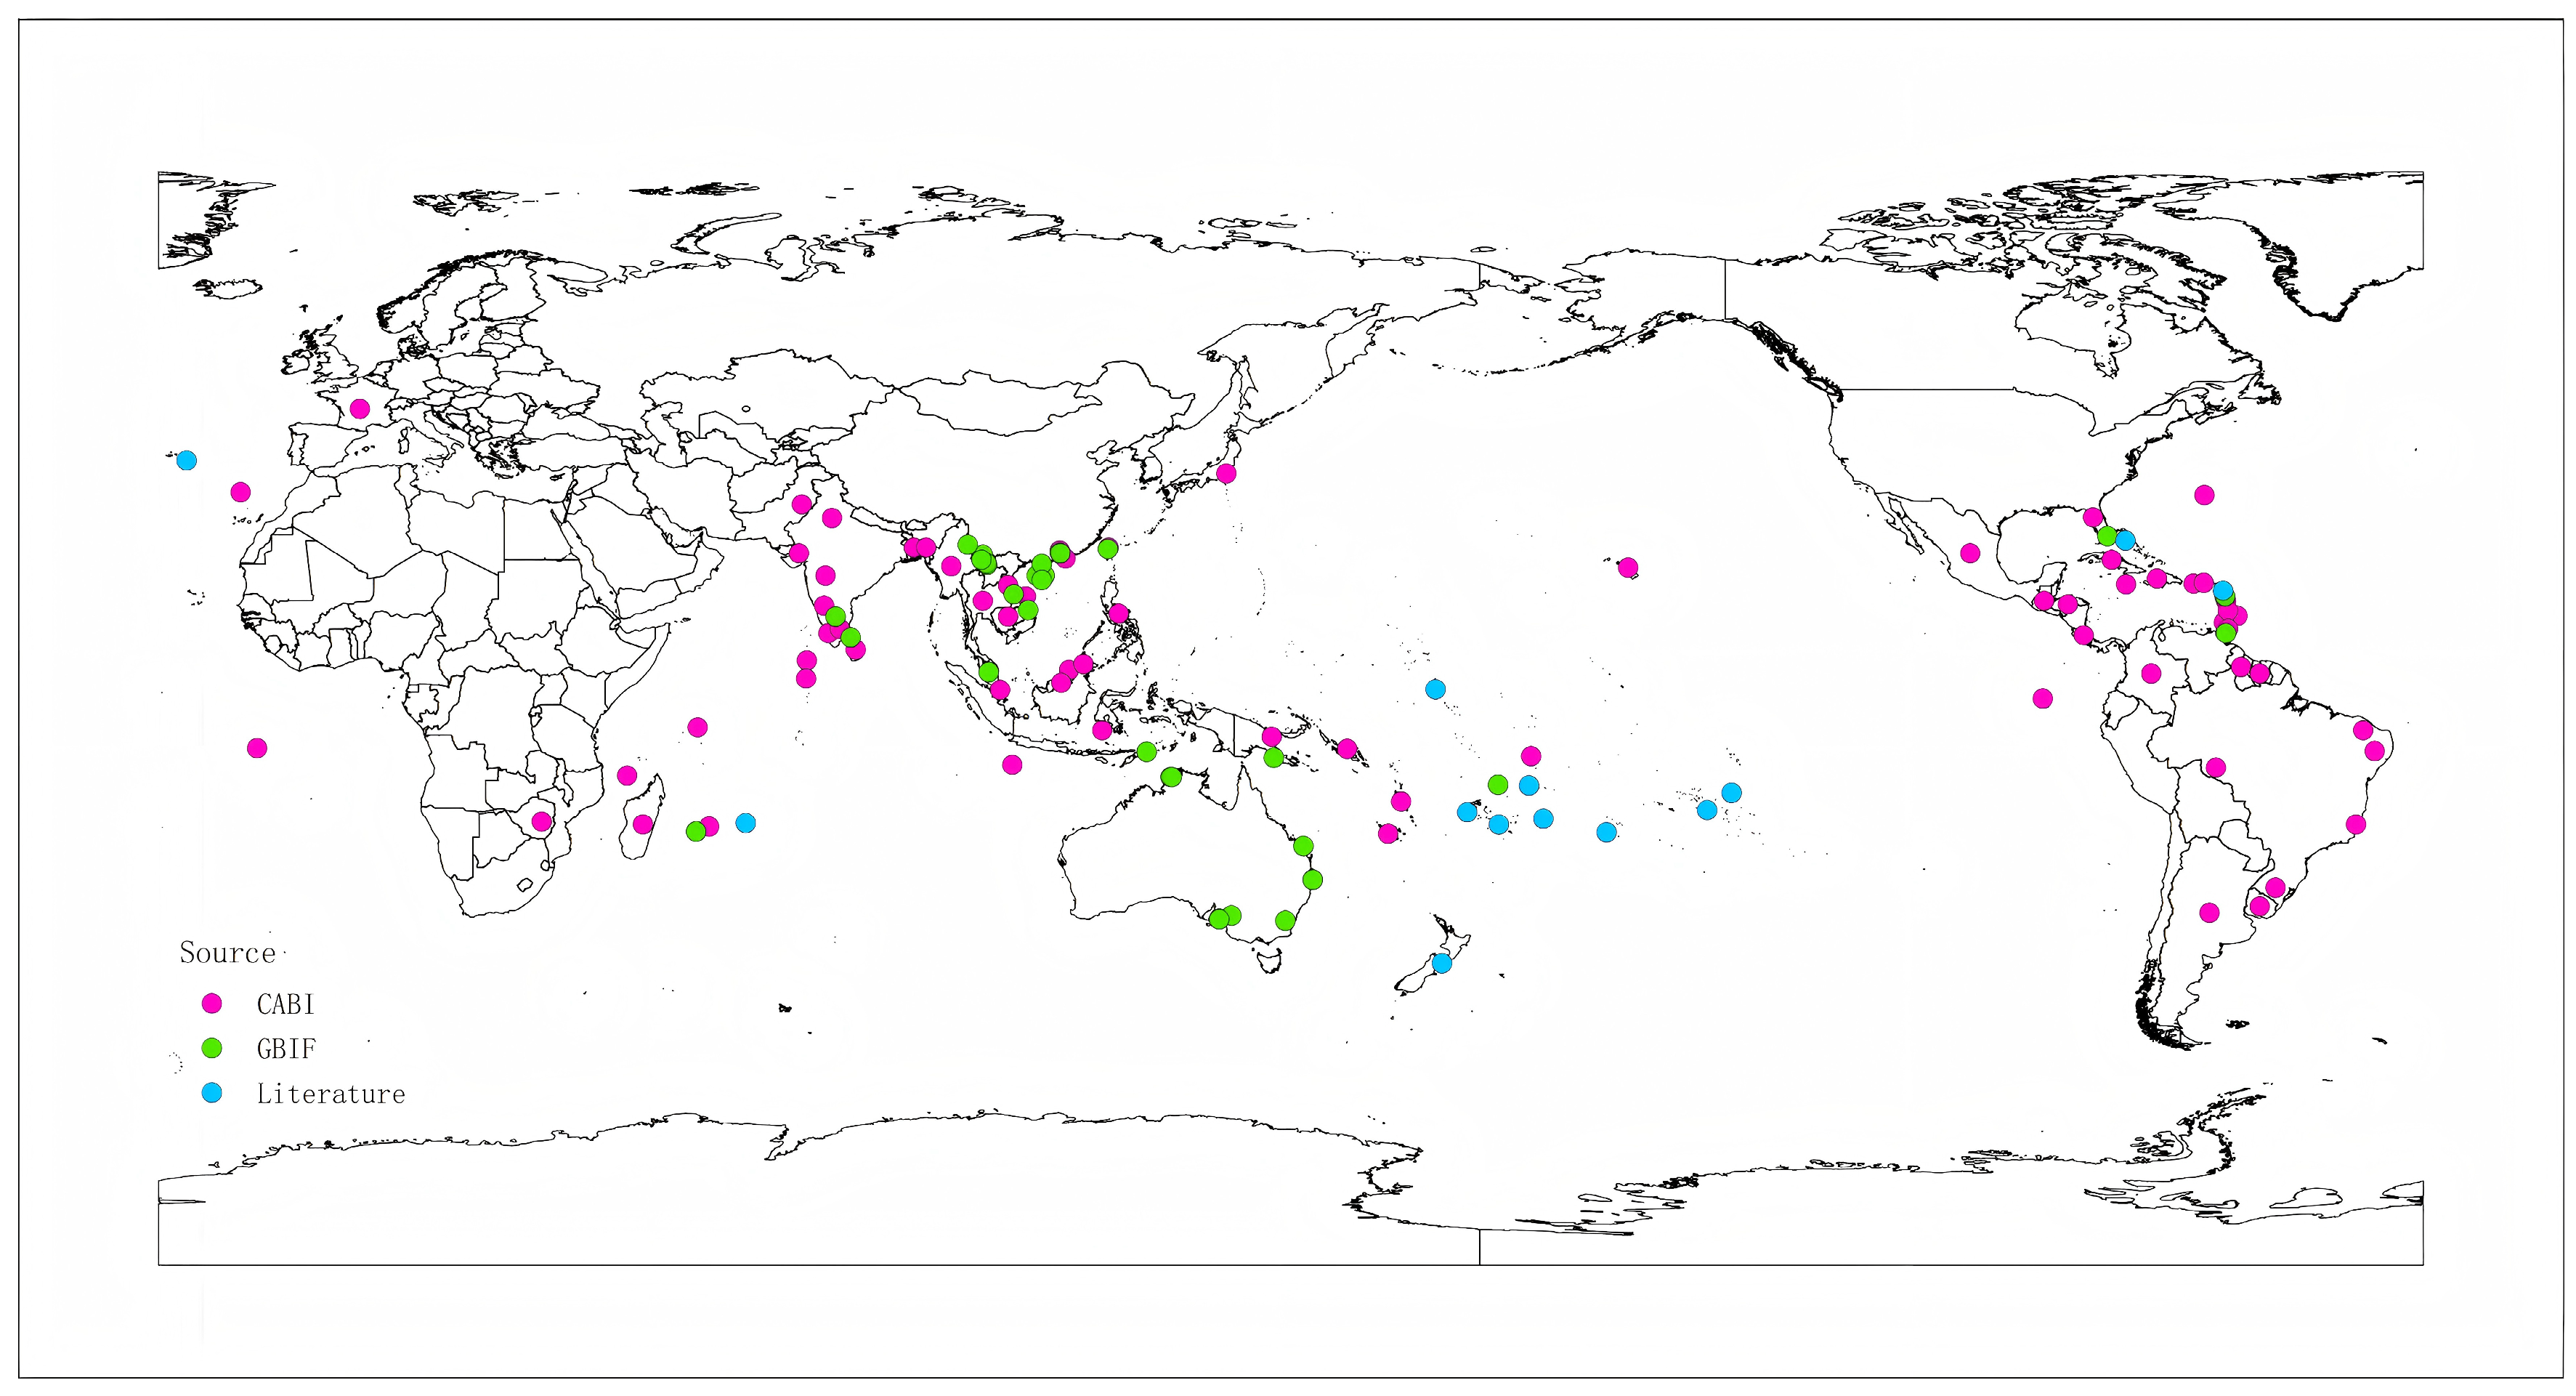
2.1. Collecting and Processing Occurrence Records

The occurrence records of P. minor were obtained from the International Centre for Agriculture and Biosciences (CABI) [48], the Global Biodiversity Information Facility (GBIF) [49], and the relevant studies [19,50]. The data were imported into ArcGIS, where duplicate and erroneous records were removed. To minimize spatial autocorrelation and sampling bias, the spThin package in R was used to retain one occurrence point per raster cell (5 min × 5 min) [45,51,52]. This process resulted in 117 occurrence records (69 from CABI, 34 from GBIF, and 14 from studies) of P. minor (Figure 1). To better simulate the species’ actual distribution, the occurrence data were formatted using the BIOMOD_FormatingData function from the Biomod2 package (version 4.2-4). Pseudo-absence (PA) points were generated by specifying the parameters PA.nb.rep, PA.nb.absences, and PA.strategy [53]. In this study, pseudo-absences were randomly generated at a rate of ten times the number of occurrence points, with the process repeated three times.

2.2. Acquiring and Screening Environmental Variables

We obtained 19 bioclimatic variables, representing the annual climate averages from 1970 to 2000, from WorldClim version 2.1 (https://www.worldclim.org, accessed on 2 May 2024), as the current climate data (Table 1). For future climate scenarios, we selected two different Shared Socioeconomic Pathways (SSP1-2.6, a low-emission, sustainable development pathway, and SSP5-8.5, a high-emission, rapidly changing pathway) from the Beijing climate center climate system model2 medium resolution (BCC-CSM2-MR) for the period 2041–2060 (2050s) [54]. Its intermediate climate sensitivity (Equilibrium Climate Sensitivity, ECS = 3.03 °C) [55] aligns closely with the multi-model median (3.74 °C) of the Coupled Model Intercomparison Project Phase 6 (CMIP6), thus avoiding extreme warming biases [5]. Both datasets have a spatial resolution of 5 arc minutes. We extracted environmental raster data variables at the distribution points of P. minor and employed a method combining principal component analysis (PCA) with a correlation matrix approach to screen environmental variables. Initially, PCA was utilized to extract the primary components of variation within the data. Varimax rotation was applied to the selected principal components to enhance interpretability. A factor loading threshold of 0.8 was set to retain variables with substantial loadings on the rotated principal components [56]. Additionally, a correlation matrix among variables was calculated to eliminate variables with lower loadings from highly correlated pairs, thereby mitigating the impact of multicollinearity. Ultimately, considering both statistical significance and the practical relevance of the variables, a subset of environmentally significant variables was identified as being crucial for model construction: bio4, bio9, bio10, bio11, and bio16.

2.3. Constructing and Evaluating Ensemble Models

Modeling for each single model was conducted using the BIOMOD_Modeling function from the Biomod2 package; 75% of the occurrence data were utilized as the training dataset, whereas the remaining 25% formed the test dataset. The model iteration process was controlled by setting the parameter CV.nb.rep, and each model was run 10 times. The accuracy of the models was evaluated using two metrics: the Area Under the Receiver Operating Characteristic Curve (AUC) and the True Skill Statistic (TSS). AUC is widely employed in machine learning and ecological forecasting as it does not depend on a specific classification threshold and remains insensitive to class distribution [57]. TSS combines sensitivity and specificity, providing a balanced evaluation of both positive and negative sample classifications. It reflects the model’s practical performance at specific thresholds and is robust against class imbalance [58]. Higher AUC and TSS values, approaching 1.0, indicate greater model accuracy. Single models with superior AUC and TSS scores, along with better interpretability of environmental variables, were selected for ensemble modeling. The em.algo parameter was utilized to specify one of six ensemble methods: EMmean (based on the probability mean of the selected model), EMmedian (based on the median probability of the selected model), EMca (based on the binary voting of the selected model), EMwmean (based on the evaluation score), EMcv (based on the probability coefficient of variation in the selected model), and EMci (based on the confidence interval around the probability mean of the selected model). The ROC and TSS values for each ensemble method were computed, and the optimal method was identified.

2.4. Dividing and Calculating Suitable Areas

The ensemble model was applied to the environmental variables to predict the potential geographic distribution of P. minor using the BIOMOD_EnsembleForecasting function in Biomod2. The suitability probability values obtained from the “Biomod2” ensemble model range from 0 to 1000, indicating the likelihood of species occurrence. We employed the TSS threshold as a pivotal reference for classifying suitable habitats. Areas scoring below this threshold were categorized as unsuitable (0–415.23). In contrast, regions with scores above the TSS threshold were further evenly divided into three distinct suitability categories: low-suitability areas (415.23–595.36), moderate-suitability areas (595.36–775.63), and high-suitability areas (775.63–1000) [59]. The predicted raster data under different future climate scenarios were reclassified, and the extent of suitable habitat expansion or contraction was quantified using the Raster Calculator [60]. Finally, the area of suitable habitat was calculated with the “Zonal Statistics as Table” tool in ArcGIS 10.2 to evaluate the overall changes in the potential distribution of P. minor.

3. Results

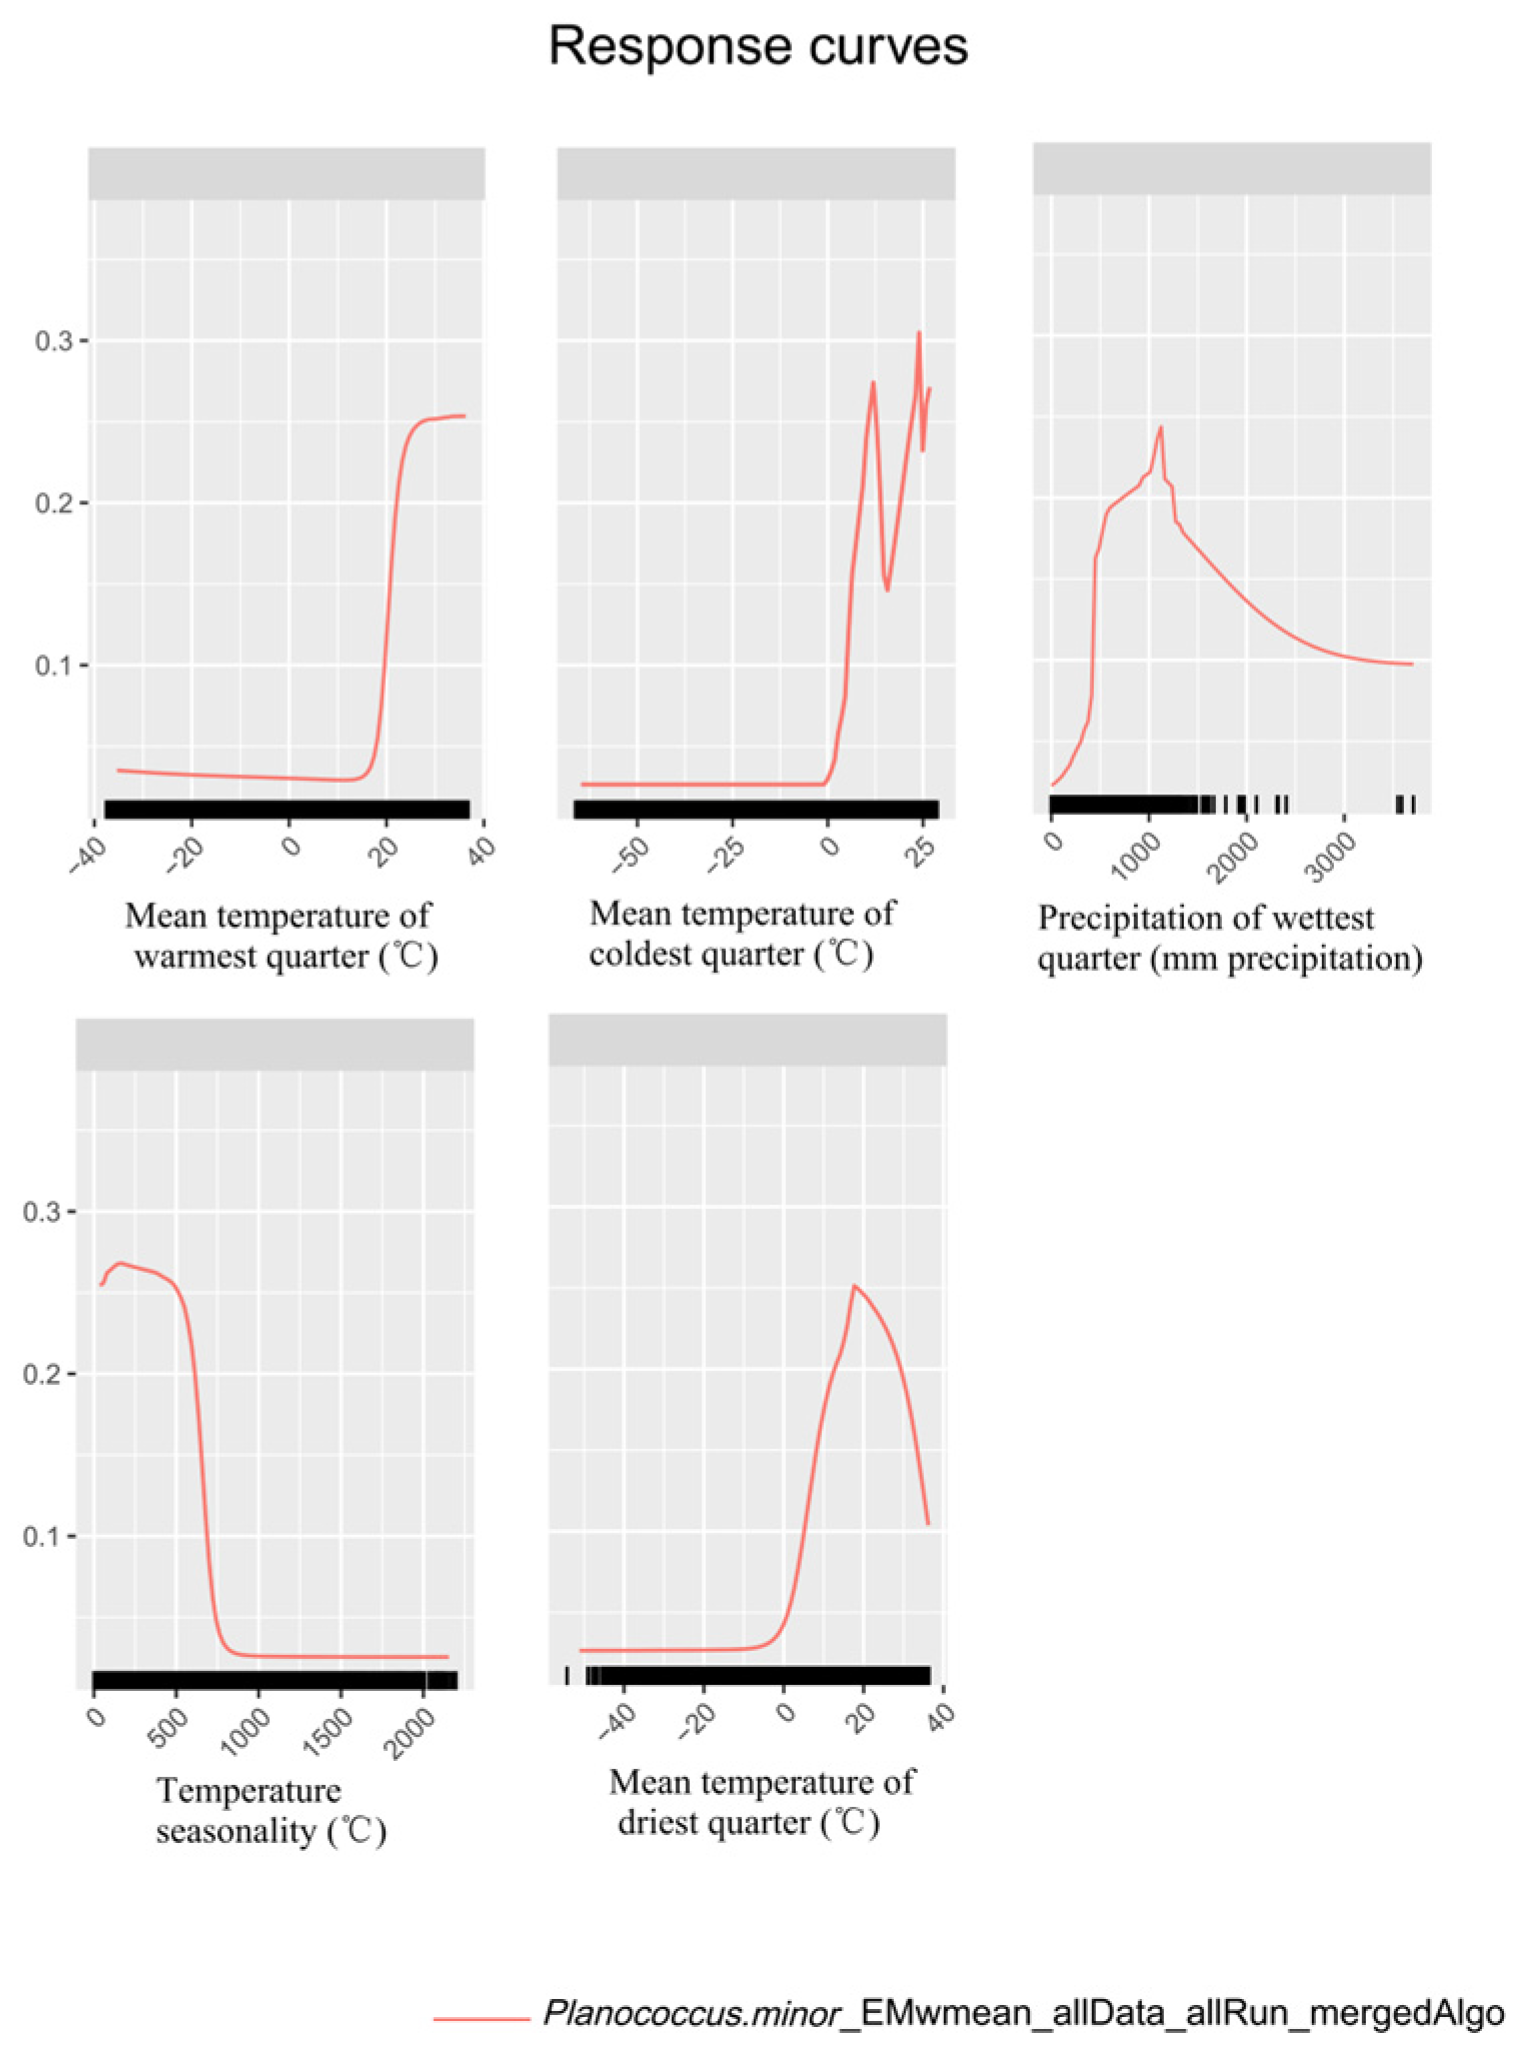
3.1. Contribution and Response of Environmental Variables

Correlation analysis and principal component analysis (PCA) were conducted in R on 19 bioclimatic variables. Highly correlated pairs were identified, and the variables with higher contribution rates were retained. The selected variables—bio4, bio9, bio10, bio11, and bio16—were used for prediction. Among these, bio16 and bio4 contributed most significantly to the ensemble model, accounting for 29.69% and 22.54%, respectively. The contributions of bio11, bio9, and bio10 were 17.79%, 12.20%, and 10.94%, respectively. Together, these five variables explained 93.16% of the total contribution to the model.
The environmental response curves for P. minor under the ensemble model (Figure 2) indicated that temperature and precipitation were key factors influencing habitat suitability. For bio10 (mean temperature of the warmest quarter), the probability of species occurrence increased rapidly as the temperature approached 20 °C, then stabilized. The suitability for bio11 (mean temperature of the coldest quarter) gradually increased between 0 °C and 12 °C, followed by a sharp change between 12 °C and 25 °C. Bio9 (mean temperature of the driest quarter) showed peak suitability around 18 °C. For bio16 (precipitation of the wettest quarter), the probability of species occurrence peaked at approximately 1000 mm and then declined, suggesting that excessively high precipitation may inhibit the distribution of P. minor. Similarly, the response curve for bio4 (temperature seasonality) peaked around a value of 125 and then decreased, indicating that large temperature fluctuations may negatively impact the survival of the species. These results suggest that P. minor prefers environments characterized by warm temperatures, moderate precipitation, and relatively stable climatic conditions.

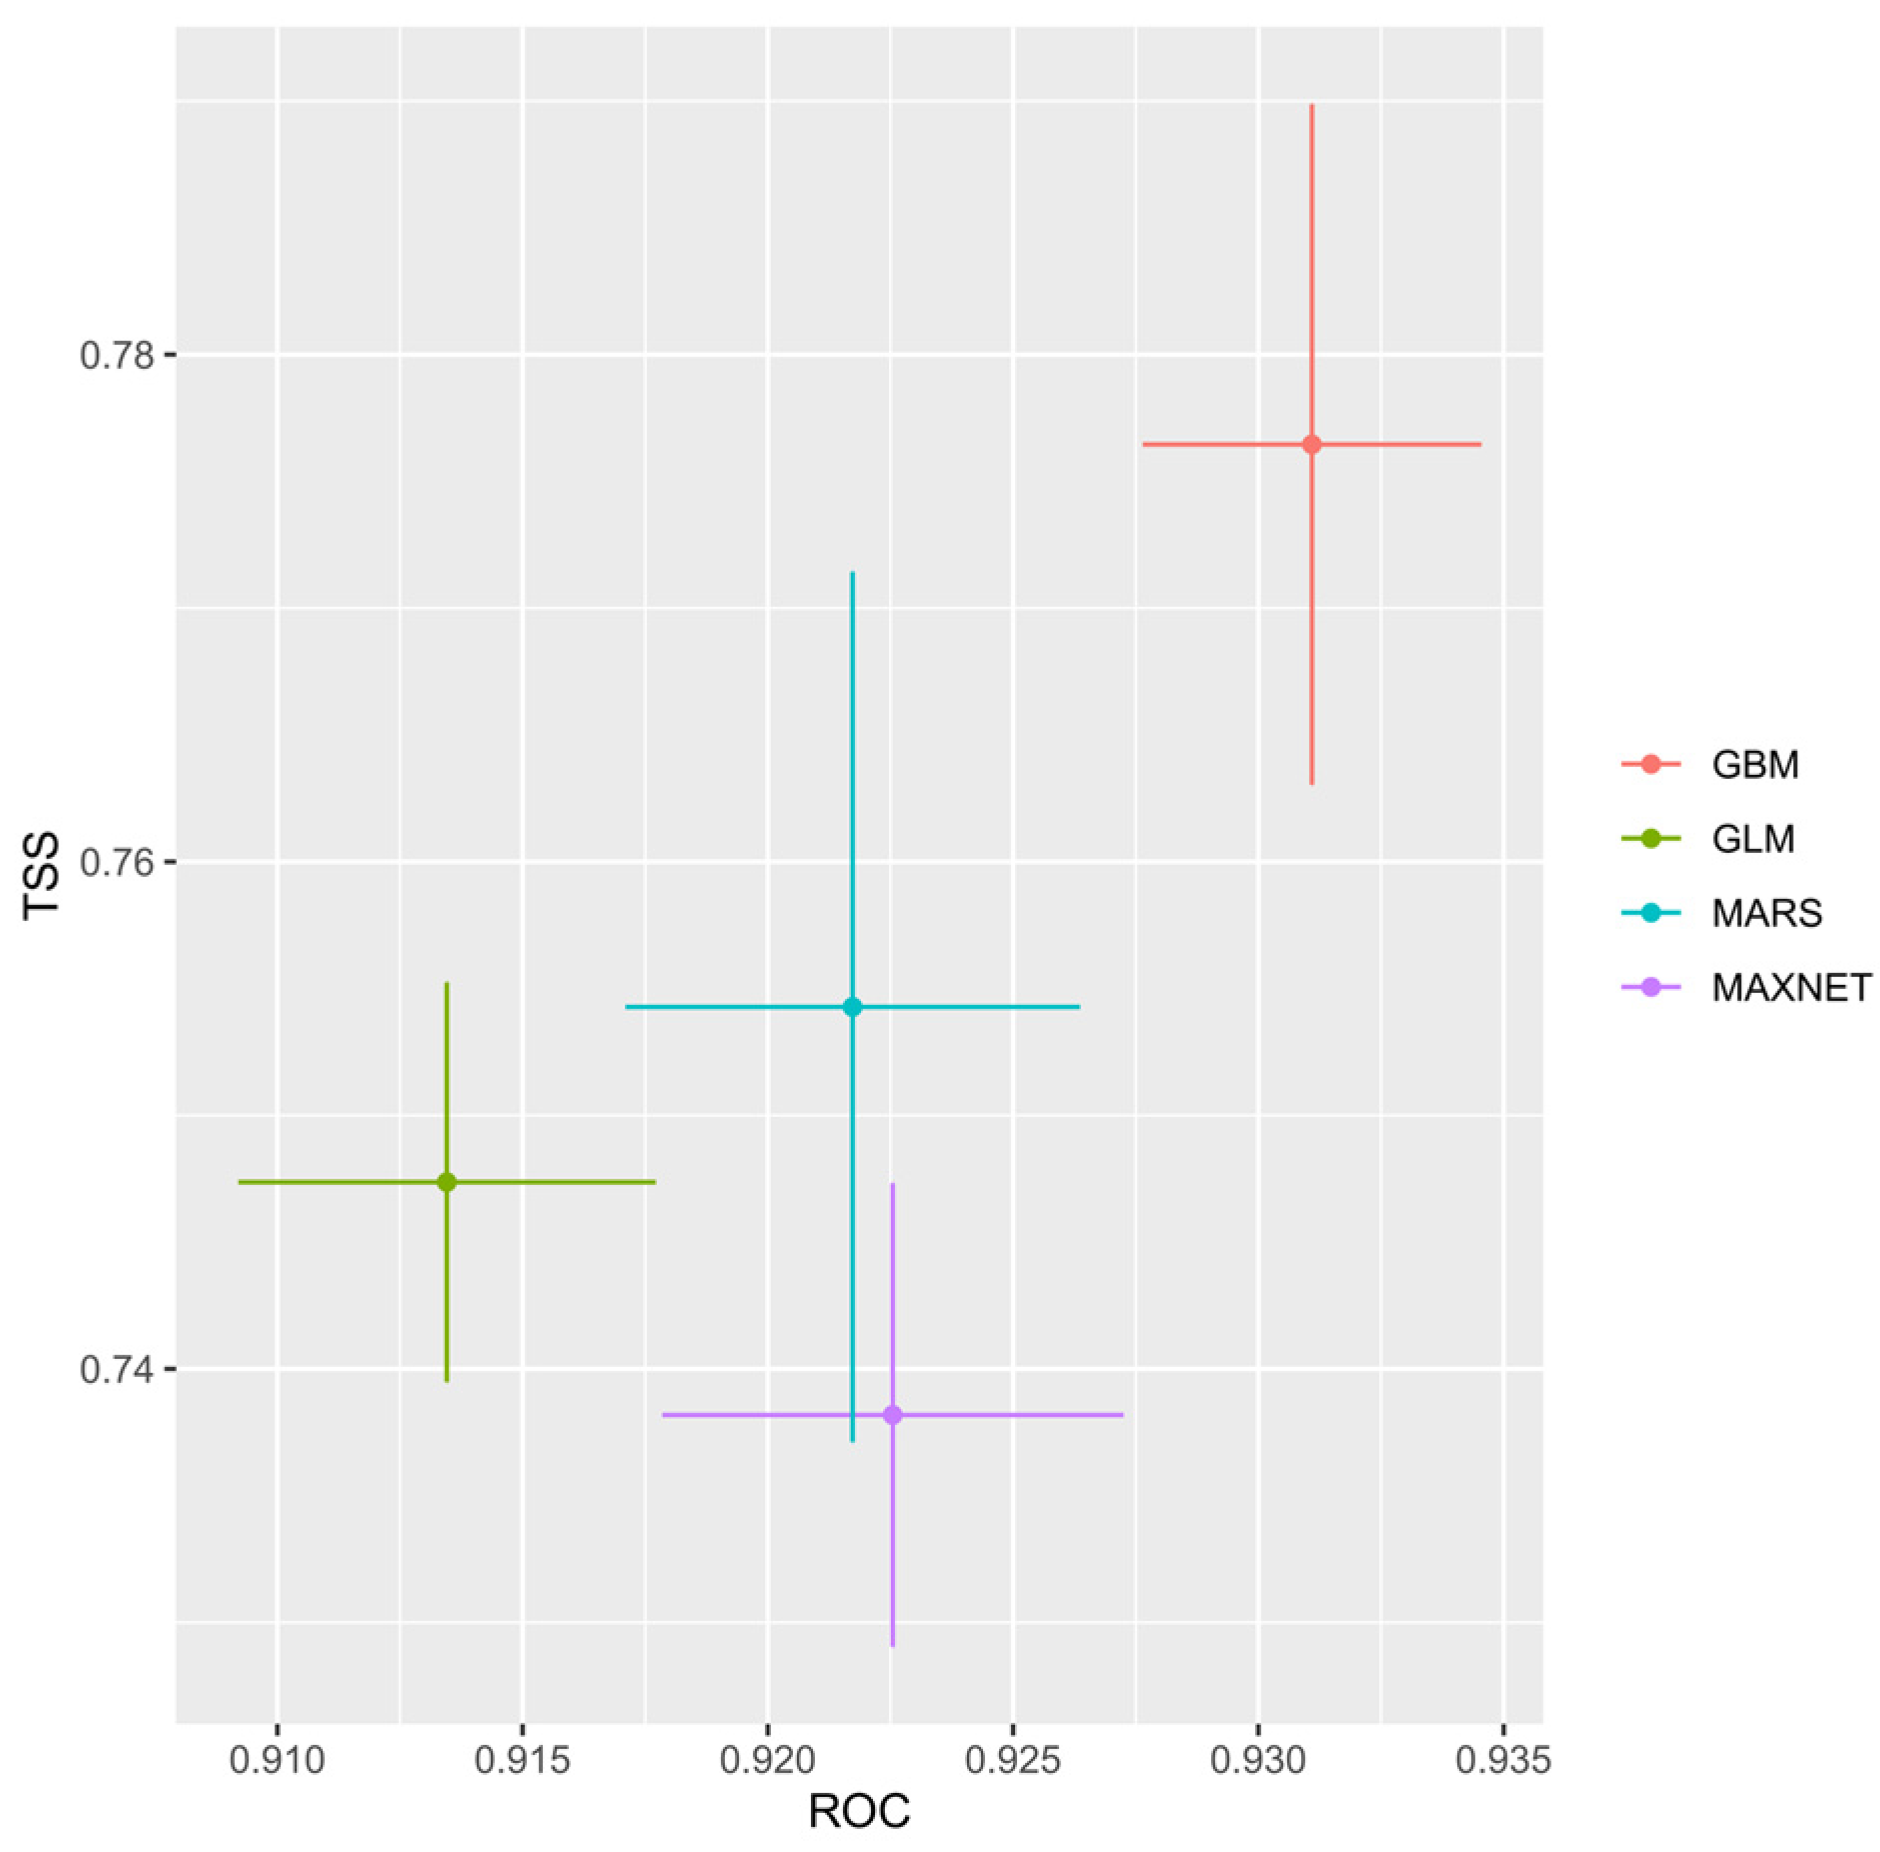
3.2. Evaluation of Ensemble Model

Single models for P. minor were developed, and four models were selected for ensemble modeling based on initial performance testing: GBM (AUC = 0.925, TSS = 0.768), GLM (AUC = 0.905, TSS = 0.738), MARS (AUC = 0.915, TSS = 0.749), and MAXENT (AUC = 0.915, TSS = 0.730) (Figure 3). Among the six ensemble methods, EMwmean exhibited the best performance. The weight of each single model in the ensemble was proportional to its performance, with higher-performing models contributing more significantly to the ensemble outcome. Using 75% of the data for training and 25% for testing, the ensemble model achieved an AUC value of 0.928 and a TSS value of 0.753, indicating high predictive accuracy.

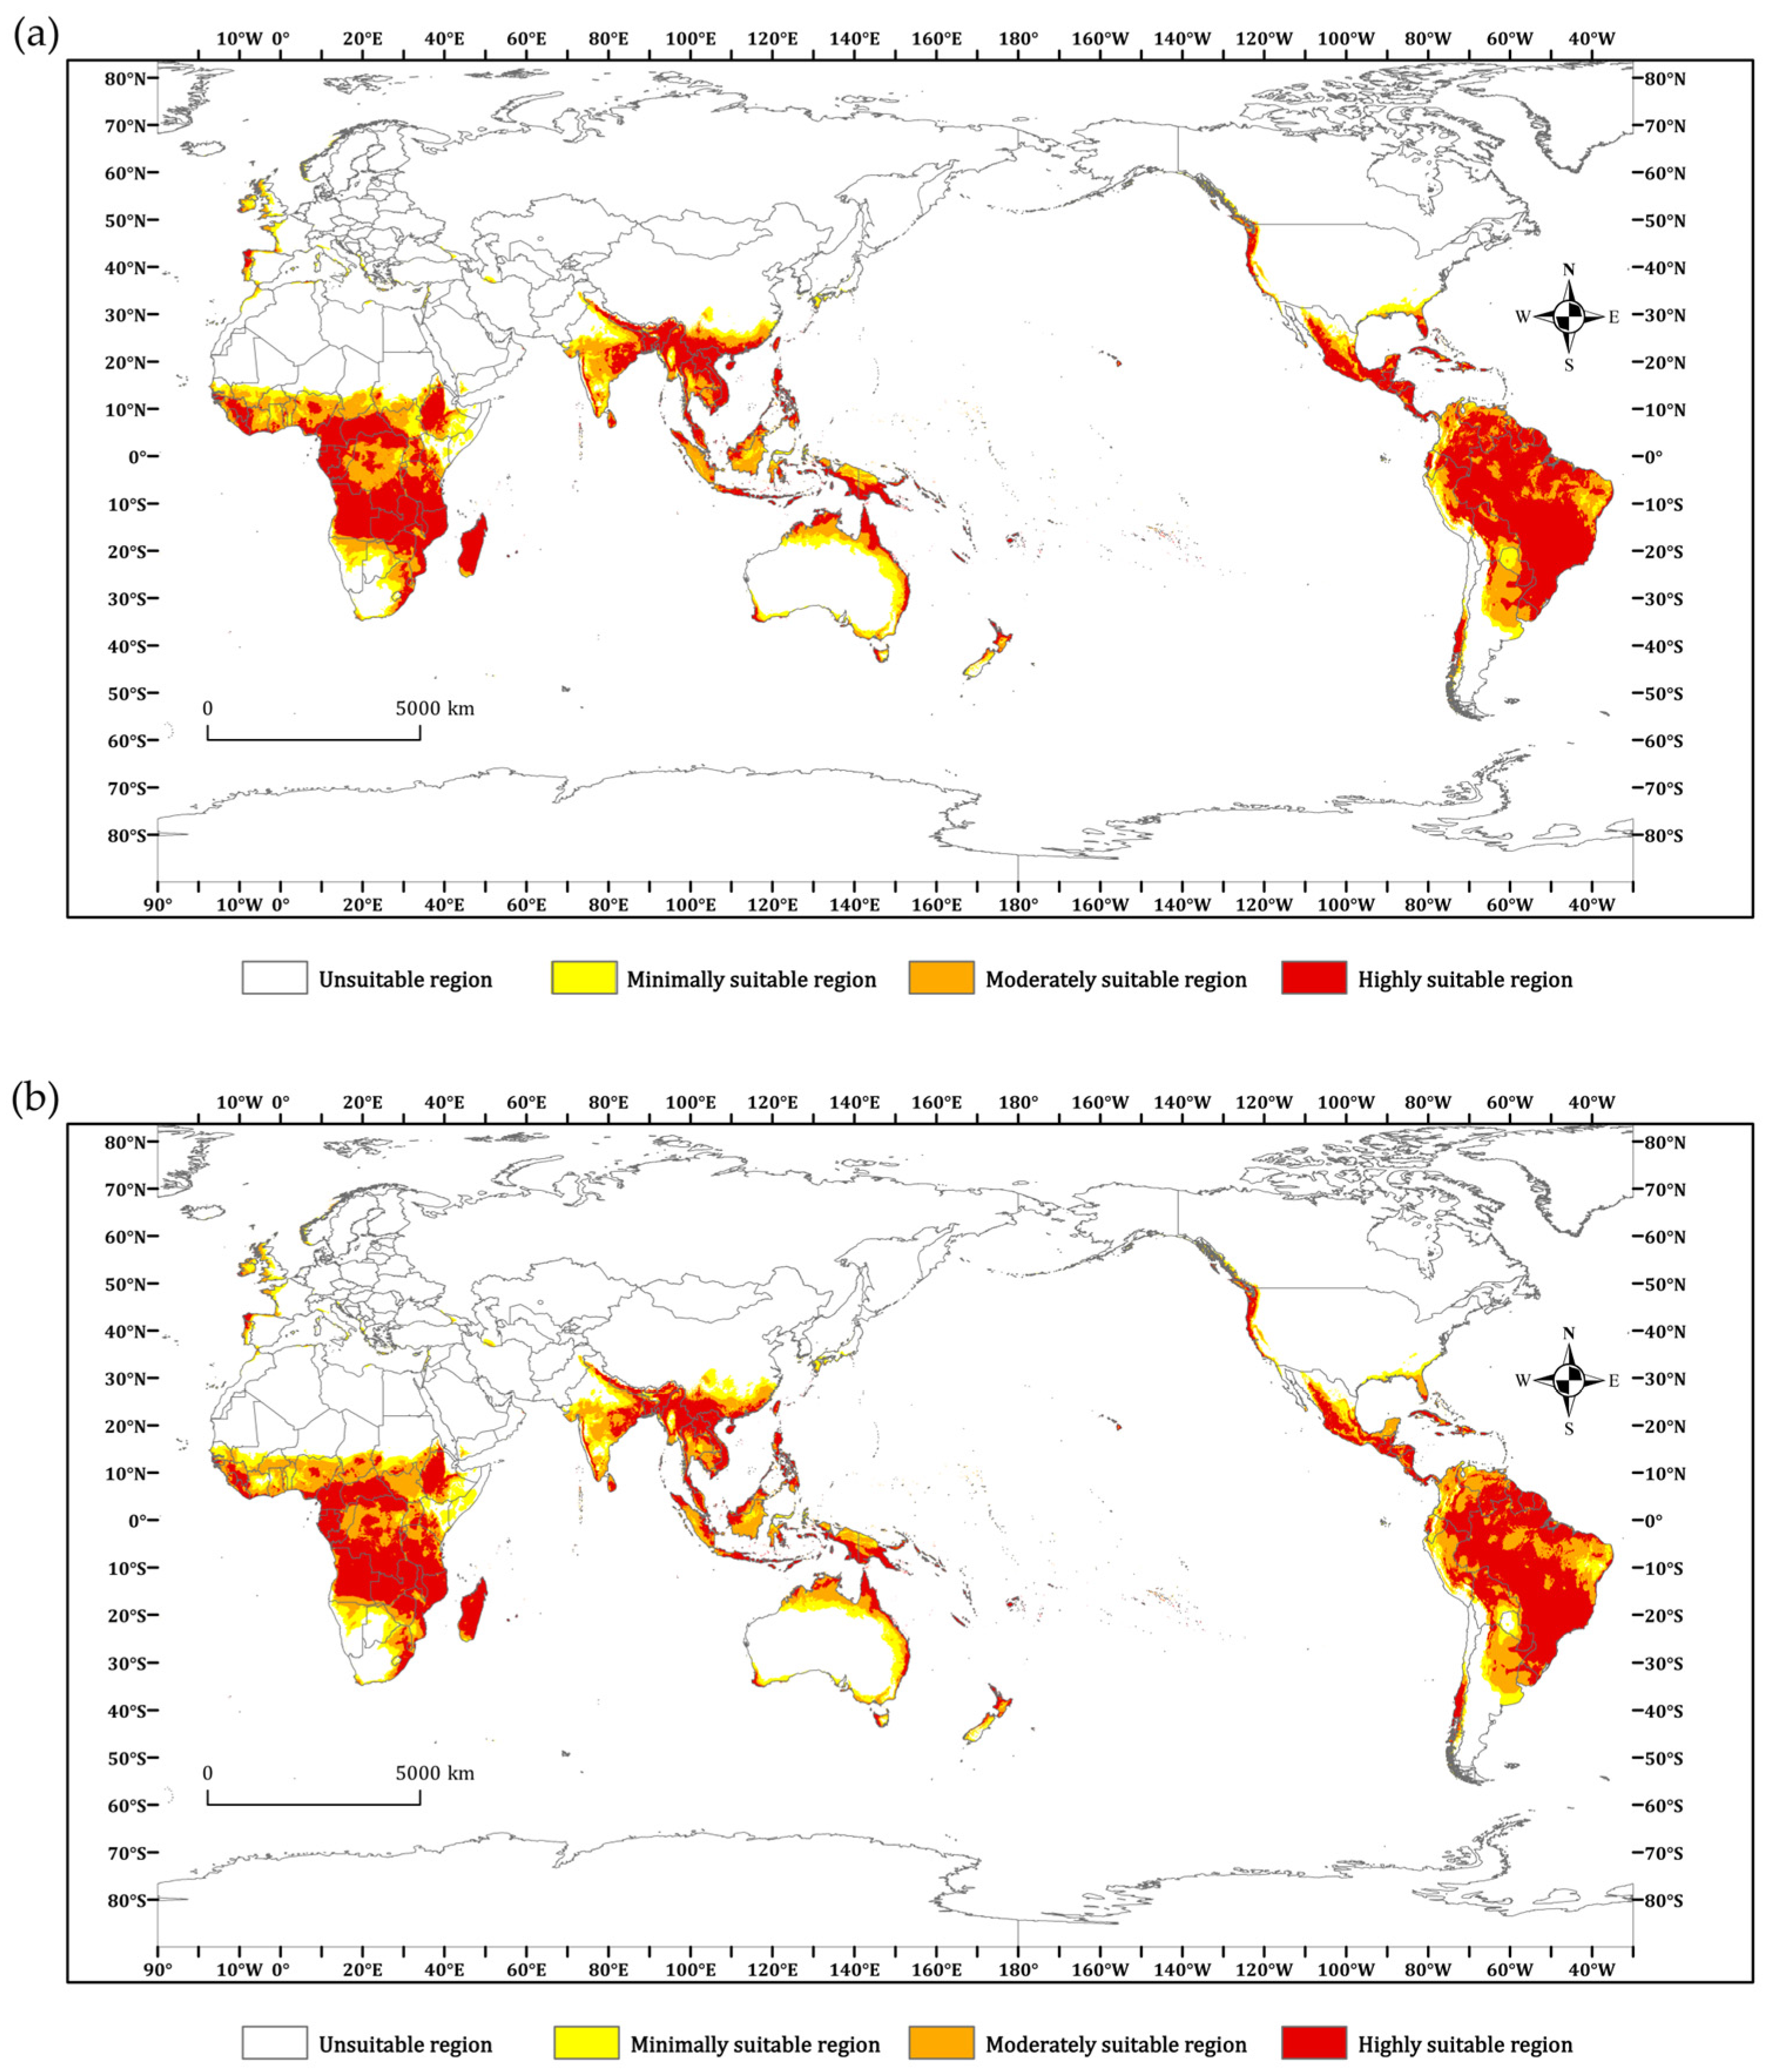
3.3. Current Potential Geographic Distribution of P. minor

Under current climatic conditions, the global prediction results for P. minor indicated that its suitable habitat was primarily concentrated in tropical and subtropical regions (Figure 4). Highly suitable areas were distributed across sub-Saharan Africa (including the Congo Basin, Nigeria, and neighboring countries), South and Southeast Asia (India, Sri Lanka, Bangladesh, Thailand, Malaysia, Indonesia, etc.), the Amazon Basin in South America (Brazil, Bolivia, Colombia, Guyana, Suriname, etc.), Central America, the southern regions of North America, and the northern and eastern coastal areas of Australia. Additionally, the islands of Polynesia and Melanesia were also identified as highly suitable regions for P. minor. Moderately and minimally suitable habitats were primarily distributed in peripheral areas and transitional zones surrounding highly suitable regions. These include parts of Southeast Asia, the southern United States, and Mexico in North America; northern Argentina and Peru in South America; Mediterranean coastal countries; and the Federated States of Micronesia.
The predicted current habitats of P. minor in China are primarily concentrated in the southern regions, displaying a distinct banded distribution pattern (Figure 5). The highly suitable habitats cover approximately 513,819 square kilometers, representing 5.35% of China’s total land area. These areas include the provinces of Yunnan, Guangdong, Guangxi, Hainan, and Taiwan, with a small portion also identified in southeastern Tibet. Moderately suitable habitats span around 351,806 square kilometers, accounting for 3.66% of the country’s total land area, and are primarily distributed across Fujian, northern Yunnan, northern Guangxi, and northern Guangdong. Minimally suitable habitats encompass about 246,875 square kilometers, or 2.57% of China’s land area, and are mainly found in Jiangxi, southeastern Sichuan, southern Guizhou, and southern Yunnan. Overall, the distribution of suitable habitats for P. minor in China is relatively concentrated, particularly in the southern provinces, where climatic conditions are favorable for its survival.

3.4. Future Potential Geographic Distribution of P. minor

Under two different socio-economic development pathways and carbon emission scenarios for the 2050s, the total area of suitable habitats for P. minor worldwide is projected to increase. While suitable habitats in tropical and subtropical regions are expected to remain generally stable, a slight decline in habitat suitability is observed, with some areas transitioning from highly suitable to moderately or minimally suitable (Figure 6). Under the SSP1-2.6 scenario, central Africa, the Amazon Basin in South America, and Southeast Asia remain core regions characterized by high habitat suitability for P. minor. However, some highly suitable habitats in Guinea, Côte d’Ivoire, Nigeria, and the Democratic Republic of the Congo are projected to shift to moderate suitability, whereas the extent of highly suitable habitats in central South America and Southeast Asia is expected to expand. Under the SSP5-8.5 scenario, compared to SSP1-2.6, the extent of highly suitable habitats is predicted to decrease further. Meanwhile, moderately and minimally suitable habitats are expected to gradually expand, accompanied by a northward shift in temperate regions of the Northern Hemisphere.
Under both future scenarios, the suitable habitats of P. minor in China exhibited significant inland expansion (Figure 7). The distribution and total area of highly suitable habitats remained largely consistent with those under historical climate conditions. Under the SSP1-2.6 scenario, the area of moderately suitable habitats increased to 374,931 km2 (3.91% of China’s total land area), representing a growth of approximately 6.57% compared to current climatic conditions. The area of minimally suitable habitats expanded to 287,847 km2 (3.00% of China’s total land area), an increase of about 16.60%. Under the SSP5-8.5 scenario, the moderately suitable habitats expanded significantly to 448,889 km2 (4.68% of China’s total land area), reflecting a growth of about 27.60% relative to current conditions. The minimally suitable habitats surged to 442,639 km2 (4.61% of China’s total land area), marking an increase of approximately 79.30%, with notable inland expansion into regions such as Sichuan, Chongqing, Hubei, and Anhui. Overall, as carbon emission scenarios intensified, the area of suitable habitats continued to expand. Under higher emission scenarios, the inland expansion trend was projected to become more pronounced (Table 2).

4. Discussion

4.1. Accuracy of Model Predictions

This study employed an ensemble modeling approach using the Biomod2 platform, which integrates predictions from multiple single models. The primary strength of the ensemble approach lies in its capacity to reduce both bias and variance, particularly in the presence of noise and uncertainty in the data [61]. Additionally, the ensemble model harnesses the complementary predictive capabilities of different models across diverse regions, further improving prediction accuracy and consistency [62]. Following preliminary testing, four models (GBM, GLM, MARS, and MAXENT) were selected for the ensemble. We compared the performance of the six ensemble methods provided by Biomod2. The EMwmean (weighted mean) method, which assigns different weights to individual models based on their evaluation metrics (AUC and TSS), was identified as the best-performing approach in this study. It achieved an AUC of 0.928 and a TSS of 0.753, indicating high predictive accuracy of the ensemble model. The accuracy of species distribution model predictions typically depends on the quality and quantity of the input data [63]. However, species distribution data are frequently affected by sampling bias and spatial autocorrelation. In regions with complex or remote ecological environments, such data are often sparse, potentially leading to underestimation or overestimation of suitable habitats. Moreover, Biomod2 relies primarily on bioclimatic variables, assuming that habitat suitability is solely determined by environmental factors. This approach does not account for ecological factors such as habitat fragmentation, interspecific competition, and predation, introducing certain simplifications and limitations. Given the substantial influence of human activities on species distribution, future SDMs should incorporate anthropogenic variables as essential components, thereby improving their ecological realism and predictive performance.

4.2. Key Environmental Variables Influencing the Distribution of P. minor

The key environmental variables influencing the potential geographic distribution of P. minor included bio4, bio9, bio10, bio11, and bio16. Temperature seasonality (bio4) and precipitation of the wettest quarter (bio16) had the most pronounced effects on habitat suitability. The response curves of environmental variables illustrate the quantitative relationship between the probability of species occurrence and environmental factors. These curves allow for the observation of how changes in a single environmental variable, while holding others constant, influence the probability of species occurrence [64]. Specifically, when bio10 ranged from 15 to 25 °C and when bio11 from 0 to 12 °C, the probability of species suitability increased sharply, suggesting that P. minor thrived in warmer environments. Extreme temperatures, whether too high or too low, inhibited its growth. Previous studies have demonstrated that the optimal developmental temperature range for P. minor is 20–29 °C, with egg inviability occurring below 15 °C or above 35 °C [22,65], which aligns with our model predictions. The suitability probability of P. minor was maximized when the precipitation of the wettest quarter (bio16) approached 1000 mm; however, excessive rainfall negatively affected the species’ survival. Furthermore, temperature seasonality (bio4) peaked at approximately 125, with the highest suitability observed in regions with moderate temperature seasonality. In areas with higher temperature seasonality, the species was limited by seasonal droughts or cold periods, reducing its habitat suitability.

4.3. Geographical Distribution Patterns of P. minor Under Climate Change

Climate change is a major driver of alterations in species distributions and ecosystem functions. As global temperatures continue to rise, suitable habitats for many species are shifting poleward [66]. Under current climatic conditions, the suitable habitat of P. minor is mainly concentrated in tropical and subtropical regions, including areas south of the Sahara Desert in Africa, South Asia, Southeast Asia, and the Amazon Basin in South America. The warm climate, favorable precipitation patterns, and relatively stable ecological conditions in these regions provide optimal conditions for the survival of P. minor [6]. Under two socio-economic development pathways and carbon emission scenarios for the 2050s (SSP1-2.6 and SSP5-8.5), the total global suitable habitat area for P. minor is projected to increase, with a particularly noticeable northward shift in temperate regions of the Northern Hemisphere. In tropical and subtropical regions, the overall suitable habitat is expected to remain relatively stable, although a slight decline in habitat suitability is anticipated. This decline may be attributed to local climate adjustments and the biological characteristics of P. minor. Further temperature increases and intensified precipitation variability could cause areas currently classified as highly suitable to transition to moderate or low suitability.
The highly suitable habitat for P. minor in China is primarily concentrated in the southern regions, exhibiting a distinct strip-like spatial pattern. This distribution is largely attributed to the warm and humid climate, abundant host resources, and favorable precipitation conditions in these areas. Highly suitable habitats are mainly located in Yunnan, Guangdong, Guangxi, Hainan, Taiwan, and southern Tibet, whereas moderately suitable habitats are distributed in Fujian, northern Yunnan, northern Guangxi, northern Guangdong, as well as southern Sichuan, southern Guizhou, southern Hunan, southern Jiangxi, and southern Zhejiang. The total suitable habitat area accounts for approximately 11.59% of China’s land area. As climate change intensifies, the suitable habitat for P. minor is projected to expand further inland, potentially reaching Chongqing, Hubei, and Anhui, with the proportion of suitable habitat increasing to 14.78%. Compared to the results of Qi et al. [47] and Shao [22], the predicted suitable habitat area for P. minor in this study is smaller. This discrepancy may be attributed to differences in model selection and the climate variables included, as the choice of environmental predictors can substantially affect the projected distribution and extent of suitable habitats. Furthermore, while Qi et al. and Shao’s studies were based on a single climate model, this study integrates predictions from an ensemble of multiple models, providing a more robust and comprehensive representation of the spatial distribution of P. minor’s suitable habitats.

4.4. Management and Monitoring Recommendations

Planococcus minor has an extensive host range, and its invasion poses a serious threat to local agriculture and ecosystems. Imported fruits from infested regions represent the primary pathway for the introduction of P. minor into mainland China. During the dry season, this pest can also spread rapidly through wind dispersal [20]. Additionally, P. minor is often misidentified as Planococcus citri due to similarities in appearance, host range, and geographical distribution [67]. This misidentification may result in delayed detection, allowing the pest population to increase unchecked and expand to broader areas. Given its significant population growth potential, broad host spectrum, and capacity for substantial damage, it is crucial to implement effective quarantine measures including early detection and monitoring, and to adopt science-based control strategies to curb its further spread. In the United States, synthetic pheromone traps have proven effective for locating and monitoring this pest in both Trinidad and Florida [68]. In Trinidad, a well-established natural enemy system, including predators and parasitoids, effectively controls pest population growth [25]. For regions in China where P. minor is already present, the introduction of natural enemies, such as the predatory species Cryptognatha nodiceps Marshall, Tenuisvalvae bisquinquepustulata, Calliodis sp., Ocyptamus stenogaster species group, and Diadiplosis coccidarum Cockerell, as well as parasitic species like Leptomastix dactylopii Howard and Coccidoxenoides perminutus Girault [65,69], may be considered as part of an integrated pest management strategy. Additionally, chemical control, such as nicotine-based insecticides, may also be employed to manage infestations [70]. Particular attention should be given to regions such as Yunnan, Hainan, and Taiwan, where coffee and cocoa are cultivated. These areas overlap with the highly suitable habitats of P. minor and are particularly vulnerable, as the pest poses a major threat to coffee and cocoa plantations [20]. In regions where the pest has not yet been detected, enhanced quarantine measures should be implemented, alongside surveys and monitoring of potential suitable habitats. If P. minor is detected, immediate and coordinated actions must be taken to prevent its establishment and further spread.

5. Conclusions

Four models (GLM, MARS, GBM, and MAXENT) were selected to construct an ensemble model for predicting the suitable habitat of P. minor under current climate conditions and two future climate scenarios for the 2050s (SSP1-2.6 and SSP5-8.5). Temperature and precipitation were identified as key determinants of its distribution. With climate change, the global suitable habitat for P. minor is projected to expand overall, although some highly suitable areas may transition to moderate or low suitability. Under high-emission scenarios, the suitable habitat is expected to shift significantly northward. In China, moderately suitable habitats are projected to expand substantially inland. To mitigate potential damage, it is crucial to strengthen control measures in affected areas, enhance quarantine systems in regions at risk—including prioritizing early warning and monitoring—and to tightly regulate pathways to prevent further spread of this invasive pest.

Author Contributions

Conceptualization, J.L. and Y.Q.; methodology, Y.Q.; software, Y.Q.; validation, T.X.; formal analysis, T.X., S.W., F.K. and J.L.; data curation, T.X.; writing—original draft preparation, T.X.; writing—review and editing, T.X., S.W., F.K., J.L. and Y.Q.; visualization, T.X.; supervision, Y.Q.; funding acquisition, J.L. All authors have read and agreed to the published version of the manuscript.

Funding

This research was funded by the National Key Research and Development Program of China (2023YFC2605200) and a research project of the General Administration of Customs (2024HK181).

Data Availability Statement

The data presented in this study are available upon request from the corresponding author.

Acknowledgments

We would like to thank all members of the Plant Quarantine and Invasion Biology Laboratory of China Agricultural University (CAUPQL). We acknowledge that the world climate research program has coordinated and promoted CMIP6 through its working group on coupled models.

Conflicts of Interest

The authors declare no conflicts of interest.

References

  1. Wei, J.; Peng, L.; He, Z.; Lu, Y.; Wang, F. Potential Distribution of Two Invasive Pineapple Pests under Climate Change. Pest Manag. Sci. 2020, 76, 1652–1663. [Google Scholar] [CrossRef] [PubMed]
  2. Qin, Y.; Wang, C.; Zhao, Z.; Pan, X.; Li, Z. Climate Change Impacts on the Global Potential Geographical Distribution of the Agricultural Invasive Pest, Bactrocera Dorsalis (Hendel) (Diptera: Tephritidae). Clim. Change 2019, 155, 145–156. [Google Scholar] [CrossRef]
  3. Skendzic, S.; Zovko, M.; Zivkovic, I.P.; Lesic, V.; Lemic, D. The Impact of Climate Change on Agricultural Insect Pests. Insects 2021, 12, 440. [Google Scholar] [CrossRef]
  4. Shrestha, S. Effects of Climate Change in Agricultural Insect Pest. Acta Sci. Agric. 2019, 3, 74–80. [Google Scholar] [CrossRef]
  5. Intergovernmental Panel on Climate Change. Sixth Assessment Report. Available online: https://www.ipcc.ch/assessment-report/ar6/ (accessed on 20 September 2024).
  6. Yan, Y.; Wang, Y.; Feng, C.; Wan, P.M.; Chang, K.T.T. Potential Distributional Changes of Invasive Crop Pest Species Associated with Global Climate Change. Appl. Geogr. 2017, 82, 83–92. [Google Scholar] [CrossRef]
  7. Porter, J.H.; Parry, M.L.; Carter, T.R. The Potential Effects of Climatic Change on Agricultural Insect Pests. Agric. For. Meteorol. 1991, 57, 221–240. [Google Scholar] [CrossRef]
  8. Pyšek, P.; Hulme, P.E.; Simberloff, D.; Bacher, S.; Blackburn, T.M.; Carlton, J.T.; Dawson, W.; Essl, F.; Foxcroft, L.C.; Genovesi, P.; et al. Scientists’ Warning on Invasive Alien Species. Biol. Rev. 2020, 95, 1511–1534. [Google Scholar] [CrossRef]
  9. Zhao, W. Meeting the Challenges of Invasive Alien Species. Natl. Sci. Rev. 2024, 11, nwae017. [Google Scholar] [CrossRef]
  10. IPBES. Summary for Policymakers of the Thematic Assessment Report on Invasive Alien Species and Their Control; Roy, H.E., Pauchard, A., Stoett, P., Renard Truong, T., Bacher, S., Galil, B.S., Hulme, P.E., Ikeda, T., Sankaran, K.V., McGeoch, M.A., et al., Eds.; IPBES Secretariat: Bonn, Germany, 2023. [Google Scholar] [CrossRef]
  11. Westphal, M.I.; Browne, M.; MacKinnon, K.; Noble, I. The Link between International Trade and the Global Distribution of Invasive Alien Species. Biol. Invasions 2008, 10, 391–398. [Google Scholar] [CrossRef]
  12. Hulme, P.E. Trade, Transport and Trouble: Managing Invasive Species Pathways in an Era of Globalization. J. Appl. Ecol. 2009, 46, 10–18. [Google Scholar] [CrossRef]
  13. Hulme, P.E. Climate Change and Biological Invasions: Evidence, Expectations, and Response Options. Biol. Rev. 2017, 92, 1297–1313. [Google Scholar] [CrossRef] [PubMed]
  14. Bradley, B.A.; Beaury, E.M.; Fusco, E.J.; Lopez, B.E. Invasive Species Policy Must Embrace a Changing Climate. Bioscience 2023, 73, 124–133. [Google Scholar] [CrossRef]
  15. Roda, A.; Francis, A.; Kairo, M.T.K.; Culik, M. Planococcus minor (Hemiptera: Pseudococcidae): Bioecology, Survey and Mitigation Strategies. In CABI Invasives Series; Pena, J.E., Ed.; CABI Publishing: Wallingford, UK, 2013; pp. 288–300. [Google Scholar]
  16. Bastos, C.S.; De Almeida, R.P.; Vidal Neto, F.D.C.; De Araújo, G.P. Occurrence of Planococcus minor Maskell (Hemiptera: Pseudococcidae) in Cotton Fields of Northeast Region of Brazil. Neotrop. Entomol. 2007, 36, 625–628. [Google Scholar] [CrossRef] [PubMed]
  17. Biswas, J.; Ghosh, A.B. Biology of the Mealybug, Planococcus minor (Maskell) on Various Host Plants. Environ. Ecol. 2000, 18, 929–932. [Google Scholar]
  18. de Sousa, A.L.V.; Souza, B.; Santa-Cecília, L.V.C.; Lima, R.R.; Costa, M.B. Host preference and biology of two cryptic species, Planococcus citri (Risso) and Planococcus minor (Maskell) (Hemiptera: Pseudococcidae). Sci. Agrar. 2018, 19, 71–77. [Google Scholar] [CrossRef]
  19. Lu, N.; Cai, B.; Ma, X.; Xu, M.; Long, Y.; Meng, R.; Wu, F.; Lin, W.; Xu, W.; Yuan, J.; et al. Warning on the Spread of the Quarantine Pest Planococcus minor in Mainland China. Plant Quar. 2021, 35, 65–69. [Google Scholar] [CrossRef]
  20. Puspitasari, M.; Susilawati, S.; Hapsari, A.D.; Harni, R. Mealybug (Planococcus spp. Hemiptera: Pseudococcidae) as a Pest on Plantation Crops and Its Control Techniques: A Review. In Proceedings of the IOP Conference Series: Earth and Environmental Science, International Conference on Modern and Sustainable Agriculture, Online, 8 March 2023; Volume 1133, p. 12032. [Google Scholar] [CrossRef]
  21. Cox, J.M. The Mealybug Genus Planococcus (Homoptera: Pseudococcidae). Bull. Br. Mus. Nat. Hist. 1989, 58, 1–78. [Google Scholar]
  22. Shao, W. Study on the Biological Characteristics of Planococcus minor. Master’s Thesis, Zhejiang A&F University, Hangzhou, China, 2016. [Google Scholar]
  23. Francis, A.W.; Kairo, M.T.K.; Roda, A.L.; Liburd, O.E.; Polar, P. The passionvine mealybug, Planococcus minor (Maskell) (Hemiptera: Pseudococcidae), and its natural enemies in the cocoa agroecosystem in Trinidad. Biol. Control 2012, 60, 290–296. [Google Scholar] [CrossRef]
  24. Fu, H.; Wang, F.; Lin, Y.; Zhao, X. First Interception of the Quarantine Pest Planococcus minor in China. Plant Quar. 2008, 22, 382–384. [Google Scholar]
  25. Gu, Y.; Liu, H.; He, R.; Wu, M.; Chen, K.; Hu, X. Analysis of Quarantine Scale Insects on ASEAN Fruits Exported to China. Plant Quar. 2013, 27, 95–99. [Google Scholar]
  26. Gu, Y.; Lu, X.; Ding, G.; Huang, F. Analysis of Interceptions on ASEAN Fruits Exported to China. Plant Quar. 2021, 35, 81–85. [Google Scholar] [CrossRef]
  27. Elith, J.; Leathwick, J.R. Species Distribution Models: Ecological Explanation and Prediction across Space and Time. Annu. Rev. Ecol. Evol. Syst. 2009, 40, 677–697. [Google Scholar] [CrossRef]
  28. Miller, J. Species Distribution Modeling. Geogr. Compass 2010, 4, 490–509. [Google Scholar] [CrossRef]
  29. Busby, J.R. BIOCLIM: A Bioclimate Analysis and Prediction System. Plant Prot. Q. 1991, 6, 64–68. [Google Scholar]
  30. Araújo, M.B.; Anderson, R.P.; Márcia Barbosa, A.; Beale, C.M.; Dormann, C.F.; Early, R.; Garcia, R.A.; Guisan, A.; Maiorano, L.; Naimi, B.; et al. Standards for Distribution Models in Biodiversity Assessments. Sci. Adv. 2019, 5, eaat4858. [Google Scholar] [CrossRef]
  31. Eyre, A.C.; Briscoe, N.J.; Harley, D.K.P.; Lumsden, L.F.; McComb, L.B.; Lentini, P.E. Using Species Distribution Models and Decision Tools to Direct Surveys and Identify Potential Translocation Sites for a Critically Endangered Species. Divers. Distrib. 2022, 28, 700–711. [Google Scholar] [CrossRef]
  32. Peterson, A.T. Predicting the Geography of Species’ Invasions via Ecological Niche Modeling. Q. Rev. Biol. 2003, 78, 419–433. [Google Scholar] [CrossRef]
  33. Srivastava, V.; Lafond, V.; Griess, V.C. Species Distribution Models (SDM): Applications, Benefits and Challenges in Invasive Species Management. CABI Rev. 2019, 1–13. [Google Scholar] [CrossRef]
  34. Barbet-Massin, M.; Rome, Q.; Villemant, C.; Courchamp, F. Can Species Distribution Models Really Predict the Expansion of Invasive Species? PLoS ONE 2018, 13, e0193085. [Google Scholar] [CrossRef]
  35. Wisz, M.S.; Pottier, J.; Kissling, W.D.; Pellissier, L.; Lenoir, J.; Damgaard, C.F.; Dormann, C.F.; Forchhammer, M.C.; Grytnes, J.-A.; Guisan, A.; et al. The Role of Biotic Interactions in Shaping Distributions and Realised Assemblages of Species: Implications for Species Distribution Modelling. Biol. Rev. 2013, 88, 15–30. [Google Scholar] [CrossRef]
  36. Araújo, M.B.; Townsend Peterson, A. Uses and Misuses of Bioclimatic Envelope Modeling. Ecology 2012, 93, 1527–1539. [Google Scholar] [CrossRef] [PubMed]
  37. Thomas, C.D.; Cameron, A.; Green, R.E.; Bakkenes, M.; Beaumont, L.J.; Collingham, Y.C.; Erasmus, B.F.N.; de Siqueira, M.F.; Grainger, A.; Hannah, L.; et al. Extinction Risk from Climate Change. Nature 2004, 427, 145–148. [Google Scholar] [CrossRef] [PubMed]
  38. Pearson, R.G.; Thuiller, W.; Araújo, M.B.; Martinez-Meyer, E.; Brotons, L.; McClean, C.; Miles, L.; Segurado, P.; Dawson, T.P.; Lees, D.C. Model-Based Uncertainty in Species Range Prediction. J. Biogeogr. 2006, 33, 1704–1711. [Google Scholar] [CrossRef]
  39. Bates, J.M.; Granger, C.W.J. The Combination of Forecasts. J. Oper. Res. Soc. 1969, 20, 451–468. [Google Scholar] [CrossRef]
  40. Araújo, M.B.; Thuiller, W.; Pearson, R.G. Climate Warming and the Decline of Amphibians and Reptiles in Europe. J. Biogeogr. 2006, 33, 1712–1728. [Google Scholar] [CrossRef]
  41. Thuiller, W. Patterns and Uncertainties of Species’ Range Shifts under Climate Change. Glob. Change Biol. 2004, 10, 2020–2027. [Google Scholar] [CrossRef]
  42. Thuiller, W.; Lafourcade, B.; Engler, R.; Araújo, M.B. BIOMOD—A Platform for Ensemble Forecasting of Species Distributions. Ecography 2009, 32, 369–373. [Google Scholar] [CrossRef]
  43. Hao, T.; Elith, J.; Guillera-Arroita, G.; Lahoz-Monfort, J.J. A Review of Evidence about Use and Performance of Species Distribution Modelling Ensembles like BIOMOD. Divers. Distrib. 2019, 25, 839–852. [Google Scholar] [CrossRef]
  44. Fletcher, R.J.; Hefley, T.J.; Robertson, E.P.; Zuckerberg, B.; McCleery, R.A.; Dorazio, R.M. A Practical Guide for Combining Data to Model Species Distributions. Ecology 2019, 100, e02710. [Google Scholar] [CrossRef]
  45. Zhang, Y.; Qin, Y.; Zhang, Y.; Fu, W.; Zhang, G.; Li, Z. Predicting the Potential Distribution of Invasive Plant Solanum rostratum Using Ensemble Models. J. Plant Prot. 2022, 49, 1434–1439. [Google Scholar] [CrossRef]
  46. Fan, Y.; Gao, H.; Tao, S.; Yin, C.; Yu, X. Predicting the Potential Distribution of Pomacea canaliculata in China Using Biomod2 Ensemble Models. Chin. J. Appl. Ecol. 2024, 35, 2237–2246. [Google Scholar] [CrossRef]
  47. Qi, G.; Chen, T.; Gao, Y.; Lei, Y.; Lü, L. Potential Distribution of Planococcus minor and Planococcus lilacinus in China Based on Maxent. J. Environ. Entomol. 2015, 37, 219–223. [Google Scholar]
  48. CABI Database. Available online: https://www.cabidigitallibrary.org/doi/abs/10.1079/cabicompendium.41892 (accessed on 26 July 2024).
  49. GBIF Database. Available online: https://www.gbif.org/species/8319203 (accessed on 26 July 2024).
  50. Shao, W.; Xu, Z. Research Progress on Planococcus minor. J. Zhejiang For. Sci. Technol. 2014, 34, 70–74. [Google Scholar]
  51. Brown, J.L.; Bennett, J.R.; French, C.M. SDMtoolbox 2.0: The next Generation Python-Based GIS Toolkit for Landscape Genetic, Biogeographic and Species Distribution Model Analyses. PeerJ 2017, 5, e4095. [Google Scholar] [CrossRef] [PubMed]
  52. Veloz, S.D. Spatially Autocorrelated Sampling Falsely Inflates Measures of Accuracy for Presence-only Niche Models. J. Biogeogr. 2009, 36, 2290–2299. [Google Scholar] [CrossRef]
  53. Huang, Y.; Li, T.; Chen, W.; Zhang, Y.; Xu, Y.; Guo, T.; Wang, S.; Liu, J.; Qin, Y. Analysis of the Distribution Pattern of Phenacoccus manihoti in China under Climate Change Based on the Biomod2 Model. Biology 2024, 13, 538. [Google Scholar] [CrossRef]
  54. Xin, X.; Wu, T.; Zhang, J.; Zhang, F.; Li, W.; Zhang, Y.; Lu, Q.; Fang, Y.; Jie, W.; Zhang, L.; et al. Introduction of BCC models and its participation in CMIP6. Adv. Clim. Change Res. 2019, 15, 533–539. [Google Scholar] [CrossRef]
  55. Wu, T.; Lu, Y.; Fang, Y.; Xin, X.; Li, L.; Li, W.; Jie, W.; Zhang, J.; Liu, Y.; Zhang, L.; et al. The Beijing climate center climate system model (BCC-CSM): The main progress from CMIP5 to CMIP6. Geosci. Model Dev. 2019, 12, 1573–1600. [Google Scholar] [CrossRef]
  56. Zhao, G.; Cui, X.; Sun, J.; Li, T.; Wang, Q.; Ye, X.; Fan, B. Analysis of the distribution pattern of Chinese Ziziphus jujuba under climate change based on optimized biomod2 and MaxEnt models. Ecol. Indic. 2021, 132, 108256. [Google Scholar] [CrossRef]
  57. Fawcett, T. An Introduction to ROC Analysis. Pattern Recognit. Lett. 2006, 27, 861–874. [Google Scholar] [CrossRef]
  58. Allouche, O.; Tsoar, A.; Kadmon, R. Assessing the Accuracy of Species Distribution Models: Prevalence, Kappa and the True Skill Statistic (TSS). J. Appl. Ecol. 2006, 43, 1223–1232. [Google Scholar] [CrossRef]
  59. Gan, T.; Liu, Q.; Xu, D.; He, Z.; Zhuo, Z. Assessing the Impact of Climate Change on Hippophae neurocarpa in China Using Biomod2 Modeling. Agriculture 2025, 15, 722. [Google Scholar] [CrossRef]
  60. Chen, B.; Zou, H.; Meng, X.; Wang, L.; Hao, X.; Kang, X.; Wang, C.; Zhang, X. Effects of Climate Change on the Potential Distribution of Bupleurum chinense and Bupleurum scorzonerifolium. Acta Ecol. Sin. 2022, 42, 8471–8482. [Google Scholar]
  61. Araújo, M.B.; New, M. Ensemble Forecasting of Species Distributions. Trends Ecol. Evol. 2007, 22, 42–47. [Google Scholar] [CrossRef]
  62. Grenouillet, G.; Buisson, L.; Casajus, N.; Lek, S. Ensemble Modelling of Species Distribution: The Effects of Geographical and Environmental Ranges. Ecography 2011, 34, 9–17. [Google Scholar] [CrossRef]
  63. Araújo, M.B.; Guisan, A. Five (or so) Challenges for Species Distribution Modelling. J. Biogeogr. 2006, 33, 1677–1688. [Google Scholar] [CrossRef]
  64. Bazzichetto, M.; Lenoir, J.; Da Re, D.; Tordoni, E.; Rocchini, D.; Malavasi, M.; Barták, V.; Sperandii, M.G. Sampling Strategy Matters to Accurately Estimate Response Curves’ Parameters in Species Distribution Models. Glob. Ecol. Biogeogr. 2023, 32, 1717–1729. [Google Scholar] [CrossRef]
  65. Francis, A.W.; Kairo, M.T.K.; Roda, A.L. Developmental and Reproductive Biology of Planococcus minor (Hemiptera: Pseudococcidae) under Constant Temperatures. Fla. Entomol. 2012, 95, 297–303. [Google Scholar] [CrossRef]
  66. Parmesan, C.; Yohe, G. A Globally Coherent Fingerprint of Climate Change Impacts across Natural Systems. Nature 2003, 421, 37–42. [Google Scholar] [CrossRef]
  67. Matthews, R.W. Mealybugs of Central and South America. Ann. Entomol. Soc. Am. 1994, 87, 487–488. [Google Scholar] [CrossRef]
  68. Roda, A.; Millar, J.G.; Rascoe, J.; Weihman, S.; Stocks, I. Developing Detection and Monitoring Strategies for Planococcus minor (Hemiptera: Pseudococcidae). J. Econ. Entomol. 2012, 105, 2052–2061. [Google Scholar] [CrossRef] [PubMed]
  69. Francis, A.W.; Kairo, M.T.K.; Roda, A. Passionvine Mealybug, Planococcus minor (Maskell) (Hemiptera: Pseudococcidae). EDIS 2012, 2012. [Google Scholar] [CrossRef]
  70. Buss, E.A.; Dale, A. Managing Scale Insects on Ornamental Plants: ENY-323/MG005, Rev. 7/2016. EDIS 2016, 2016, 6. [Google Scholar] [CrossRef]
Figure 1. Global occurrence records of P. minor. Pink dots from CABI; green dots from GBIF; blue dots from published studies.
Agronomy 15 01165 g001
Figure 2. Response curves of P. minor under the ensemble model. The x-axis represents the values of different environmental variables, while the y-axis represents the predicted probability of P. minor presence.
Agronomy 15 01165 g002
Figure 3. TSS and ROC value of four single models for P. minor. GBM: AUC = 0.925, TSS = 0.768; GLM: AUC = 0.905, TSS = 0.738; MARS: AUC = 0.915, TSS = 0.749; MAXENT: AUC = 0.915, TSS = 0.730.
Agronomy 15 01165 g003
Figure 4. Global suitability distribution of P. minor under current climate conditions. Blank areas indicate unsuitable regions, yellow areas indicate minimally suitable regions, orange areas indicate moderately suitable regions, and red areas indicate highly suitable regions.
Agronomy 15 01165 g004
Figure 5. Suitability distribution of P. minor in China under current climate conditions. The suitable habitats for P. minor are primarily distributed in southern provinces, forming a belt-like pattern.
Agronomy 15 01165 g005
Figure 6. Global suitability distribution of P. minor under two socio-economic pathways and carbon emission scenarios for the 2050s. (a) SSP1-2.6: a low-emission, sustainable development pathway; (b) SSP5-8.5: a high-emission, rapidly changing pathway.
Agronomy 15 01165 g006
Figure 7. Suitability distribution of P. minor in China under two socio-economic pathways and carbon emission scenarios for the 2050s. (a) SSP1-2.6: a low-emission, sustainable development pathway; (b) SSP5-8.5: a high-emission, rapidly changing pathway.
Agronomy 15 01165 g007
Table 1. The 19 bioclimatic variables from WorldClim version 2.1.
NumberClimate Variable CodeMeaning
1Bio1Annual mean temperature
2Bio2Mean diurnal range
3Bio3Isothermality
4Bio4Temperature seasonality
5Bio5Max temperature of warmest month
6Bio6Min temperature of coldest month
7Bio7Temperature annual range
8Bio8Mean temperature of wettest quarter
9Bio9Mean temperature of driest quarter
10Bio10Mean temperature of warmest quarter
11Bio11Mean temperature of coldest quarter
12Bio12Annual precipitation
13Bio13Precipitation of wettest month
14Bio14Precipitation of driest month
15Bio15Precipitation seasonality
16Bio16Precipitation of wettest quarter
17Bio17Precipitation of driest quarter
18Bio18Precipitation of warmest quarter
19Bio19Precipitation of coldest quarter
Table 2. Suitable habitat area of P. minor in China under current climate conditions and two different climate scenarios for the 2050s. SSP1-2.6 represents a low-emission, sustainable development pathway, while SSP5-8.5 represents a high-emission, rapidly changing pathway.
Climate ScenarioMinimally Suitable RegionModerately Suitable RegionHighly Suitable Region
Area (×104 km2) Percent (%)Area (×104 km2) Percent (%)Area (×104 km2) Percent (%)
Current conditions24.68752.5735.18063.6651.38195.35
SSP1-2.6(2050s)28.78473.0037.49313.9151.39585.35
SSP5-8.5(2050s)44.26394.6144.88894.6852.76395.50
Disclaimer/Publisher’s Note: The statements, opinions and data contained in all publications are solely those of the individual author(s) and contributor(s) and not of MDPI and/or the editor(s). MDPI and/or the editor(s) disclaim responsibility for any injury to people or property resulting from any ideas, methods, instructions or products referred to in the content.

