Article

Extraction of Cropland Based on Multi-Source Remote Sensing and an Improved Version of the Deep Learning-Based Segment Anything Model (SAM)

1
State Key Laboratory of Resources and Environmental Information System, Institute of Geographic Sciences and Natural Resources Research, Chinese Academy of Sciences, Beijing 100101, China
2
College of Resource and Environment, University of Chinese Academy of Sciences, Beijing 100049, China
3
School of Geography and Information Engineering, China University of Geosciences, Wuhan 430078, China
*
Author to whom correspondence should be addressed.
Agronomy 2025, 15(5), 1139; https://doi.org/10.3390/agronomy15051139
Submission received: 10 April 2025 / Revised: 29 April 2025 / Accepted: 1 May 2025 / Published: 6 May 2025
(This article belongs to the Section Precision and Digital Agriculture)

Abstract

:
Fine extraction of cropland parcels is an essential prerequisite for achieving precision agriculture. Remote sensing technology, due to its large-scale and multi-dimensional characteristics, can effectively enhance the efficiency of collecting information on agricultural land parcels. Currently, semantic segmentation models based on high-resolution remote sensing imagery utilize limited spectral information and rely heavily on a large amount of fine data annotation, while pixel classification models based on medium-to-low-resolution multi-temporal remote sensing imagery are limited by the mixed pixel problem. To address this, the study utilizes GF-2 high-resolution imagery and Sentinel-2 multi-temporal data, in conjunction with the basic image segmentation model SAM, by additionally introducing a prompt generation module (Box module and Auto module) to achieve automatic fine extraction of cropland parcels. The research results indicate the following: (1) The mIoU of SAM with the Box module is 0.711, and the OA is 0.831, showing better performance, while the mIoU of SAM with the Auto module is 0.679, and the OA is 0.81, yielding higher-quality cropland masks; (2) The combination of various prompts (box, point, and mask), along with the hierarchical extraction strategy, can effectively improve the performance of Box module SAM; (3) Employing a more accurate prompt data source can significantly boost model performance. The mIoU of the superior-performing Box module SAM is increased to 0.920, and the OA is raised to 0.958. Overall, the improved SAM, while reducing the demand for mask annotation and model training, can achieve high-precision extraction results for cropland parcels.

1. Introduction

Cropland, a pivotal element in the agricultural production system, holds a fundamental position in agriculture. The development of agriculture is closely linked to social stability, and also plays a crucial role in economic prosperity. The accurate delineation of cropland boundaries serves as a fundamental requirement for developing modern precision agriculture. This process carries substantial importance for establishing macro-agricultural policies, managing and planning agricultural operations, conserving agricultural resources, and achieving sustainable development goals—particularly in regions experiencing intense competition for land resources [1,2].
Traditional acquisition of cropland parcel information predominantly relies on field surveys, which are not only time-consuming and labor-intensive, but also pose challenges in terms of large-scale localization and long-term monitoring [3]. Remote sensing, characterized by its large-scale and multi-dimensional attributes, enables the rapid acquisition of cropland parcel information on a broad scale, thereby facilitating the provision of fundamental spatiotemporal data necessary for the implementation of robust and sustainable agricultural management [4].
With the ongoing accumulation and open sharing of remote sensing imagery data, leveraging computer technology for the automatic and rapid identification of agricultural land parcels is emerging as a research focus and a cutting-edge field [5]. Algorithms for the automatic recognition of remote sensing imagery can be categorized into traditional machine learning and deep learning approaches. Within traditional machine learning, there are supervised and unsupervised learning methods. Unsupervised learning algorithms [6] discover inherent patterns in unlabeled data by measuring similarity metrics in high-dimensional spaces. This method groups samples based on latent feature similarities without provided labels, simplifying the process, but it generally offers lower accuracy than supervised learning, and does not predict categories. Supervised learning, in contrast, necessitates the creation of labeled samples, and uses algorithms to discern patterns and relationships among features within the sample data for pixel classification. While it boasts higher classification accuracy, its effectiveness hinges on a substantial foundation of samples and feature analysis.
In order to enhance the accuracy of classification, numerous studies employ long-term monitoring of satellite data to capture the complete spectral information of seasonal variations, and construct features such as spectral indices based on the seasonal growth patterns of crops, thereby optimizing the accuracy of cropland extraction [7]. Pixel-based classification—the most straightforward way to utilize spectral data—assigns land cover labels by analyzing individual pixel spectra. Common methods include Random Forest [8], Support Vector Machine [9], etc. Object-oriented classification algorithms effectively tackle the salt-and-pepper noise issue inherent in pixel-based classification. These algorithms incorporate texture and spatial features in addition to spectral information, classify and merge adjacent pixels based on their similarity, and ultimately form multiple pixel units. However, they still encounter challenges such as complex parameter selection and poor portability [10]. The abovementioned machine learning algorithms are widely applied in the interpretation of medium- and low-resolution imagery, but suffer from poor adaptability, low accuracy, and excessive noise in the output results, failing to meet the demands for high-precision extraction of cropland parcel information across different spatiotemporal scenarios.
With the advancement of high-resolution remote sensing and artificial intelligence technologies, techniques such as deep learning semantic segmentation have delivered precise and stable outcomes in cropland extraction [11]. Convolutional Neural Networks (CNNs) [12] represent the most successful deep learning models in computer vision, capable of learning local patterns in images efficiently and automatically, eliminating the need for manual feature engineering [13,14]. Early CNN models were straightforward, comprising a sequence of convolutional layers, fully connected layers, pooling layers, and activation functions with varying parameters. As these models extracted features, the resolution of the feature maps decreased, which hindered restoration to the original input image size necessary for pixel-level classification in semantic segmentation tasks. Consequently, two seminal semantic segmentation models, FCN [15] and U-Net [16], were introduced. Both employ an encoder–decoder architecture, with the encoder comprising downsampling and convolutional layers for feature extraction, and the decoder utilizing transposed convolution to upscale the low-resolution feature maps from the encoder to the original image size, enabling end-to-end pixel-level classification. Models like DeepLabv3+ [17] and PSPNet [18] have built upon these classic models, innovating in the realms of multi-scale and global feature learning, which has significantly enhanced the models’ adaptability to various scenes and computational efficiency.
The end-to-end pixel-level prediction capability of semantic segmentation makes it highly suitable for extracting cropland from remote sensing imagery. In practice, researchers have adopted a variety of deep learning models and strategies to enhance the precision of cropland extraction. Jadhav et al. [19] initially employed SOM for regional segmentation, and then applied ResNet for semantic segmentation of land cover and crop types in regional remote sensing imagery. Persello et al. [4] began by using the FCN model to learn complex spatial contextual features and generate fragmented contours, followed by Oriented Watershed Transform (OWT) for hierarchical segmentation, and finally employed the Single-scale Combinatorial Grouping (SCG) region growing algorithm to obtain field information. Masoud et al. [20] designed a multi-dilated fully convolutional network (MD-FCN) for predicting the boundaries of farmland.
Semantic segmentation models that utilize single-phase, high-resolution imagery can provide more spatial details of cropland, but the absence of temporal and spectral features still presents challenges in image interpretation [21]. To overcome this, Rußwurm et al. [22] utilized Long Short-Term Memory (LSTM) to extract features from a sequence of medium-resolution imagery for crop type classification, and compared its performance with machine learning models such as SVM, demonstrating the superiority of LSTM in dynamic temporal feature extraction. Zhong et al. [7] compared the performance differences between 1DCNN [23] and LSTM in the Enhanced Vegetation Index (EVI) crop classification task, and confirmed the effectiveness of 1DCNN in extracting temporal features. These time series classification studies based on medium-resolution imagery make more effective use of multi-temporal data and use more spectral features compared to high-resolution imagery semantic segmentation studies. However, the lower spatial resolution of the imagery leads to pixel mixing, causing a certain degree of uncertainty in the boundary information of cropland parcels.
Recent studies have explored multi-source satellite sensor fusion to mitigate these limitations by combining high-resolution spatial data with multi-temporal spectral information. Cai et al. [24] proposed a Dual-branch Spatiotemporal Fusion Network (DSTFNet), which integrates multi-temporal Sentinel-2 image series (10 m) with high-resolution GF-2 imagery (1 m), achieving high-accuracy agricultural field parcel extraction over various landscapes. Hu et al. [25] developed the CMINet framework, which implements a decoupled architecture to separately process spatial features from PlanetScope (3 m) and temporal patterns from Sentinel-2 time series (10 m), setting new benchmarks in crop type classification accuracy.
In conclusion, semantic segmentation models exhibit superior analytical and generalization capabilities compared to machine learning methods, yet they face several challenges: (1) labor-intensive pixel-level annotation requirements that incur significant time and resource costs; (2) high computational resource consumption during both training and inference phases; and (3) geographical variability that necessitates additional mask annotation and model fine-tuning/retraining when applying the model to new regions, due to spatial heterogeneity in feature distributions.
In this study, utilizing medium-resolution multi-temporal imagery from Sentinel-2 and high-resolution imagery from GF-2, we improved the Segment Anything Model (SAM) to better handle multi-source data for the extraction of cropland. The specific contents of this study are as follows: (1) An automatic prompt generation module was introduced to improve the SAM, and a train-free workflow with simple labeling for extracting cropland parcels was established; (2) A cropland dataset of the Yellow River Delta was constructed, and extraction experiments were carried out to verify the effectiveness of the model; (3) The performances of the improved SAM and semantic segmentation models were compared on the test slices of the cropland dataset, and their potential in the precise extraction of cropland was explored.

2. Materials and Methods
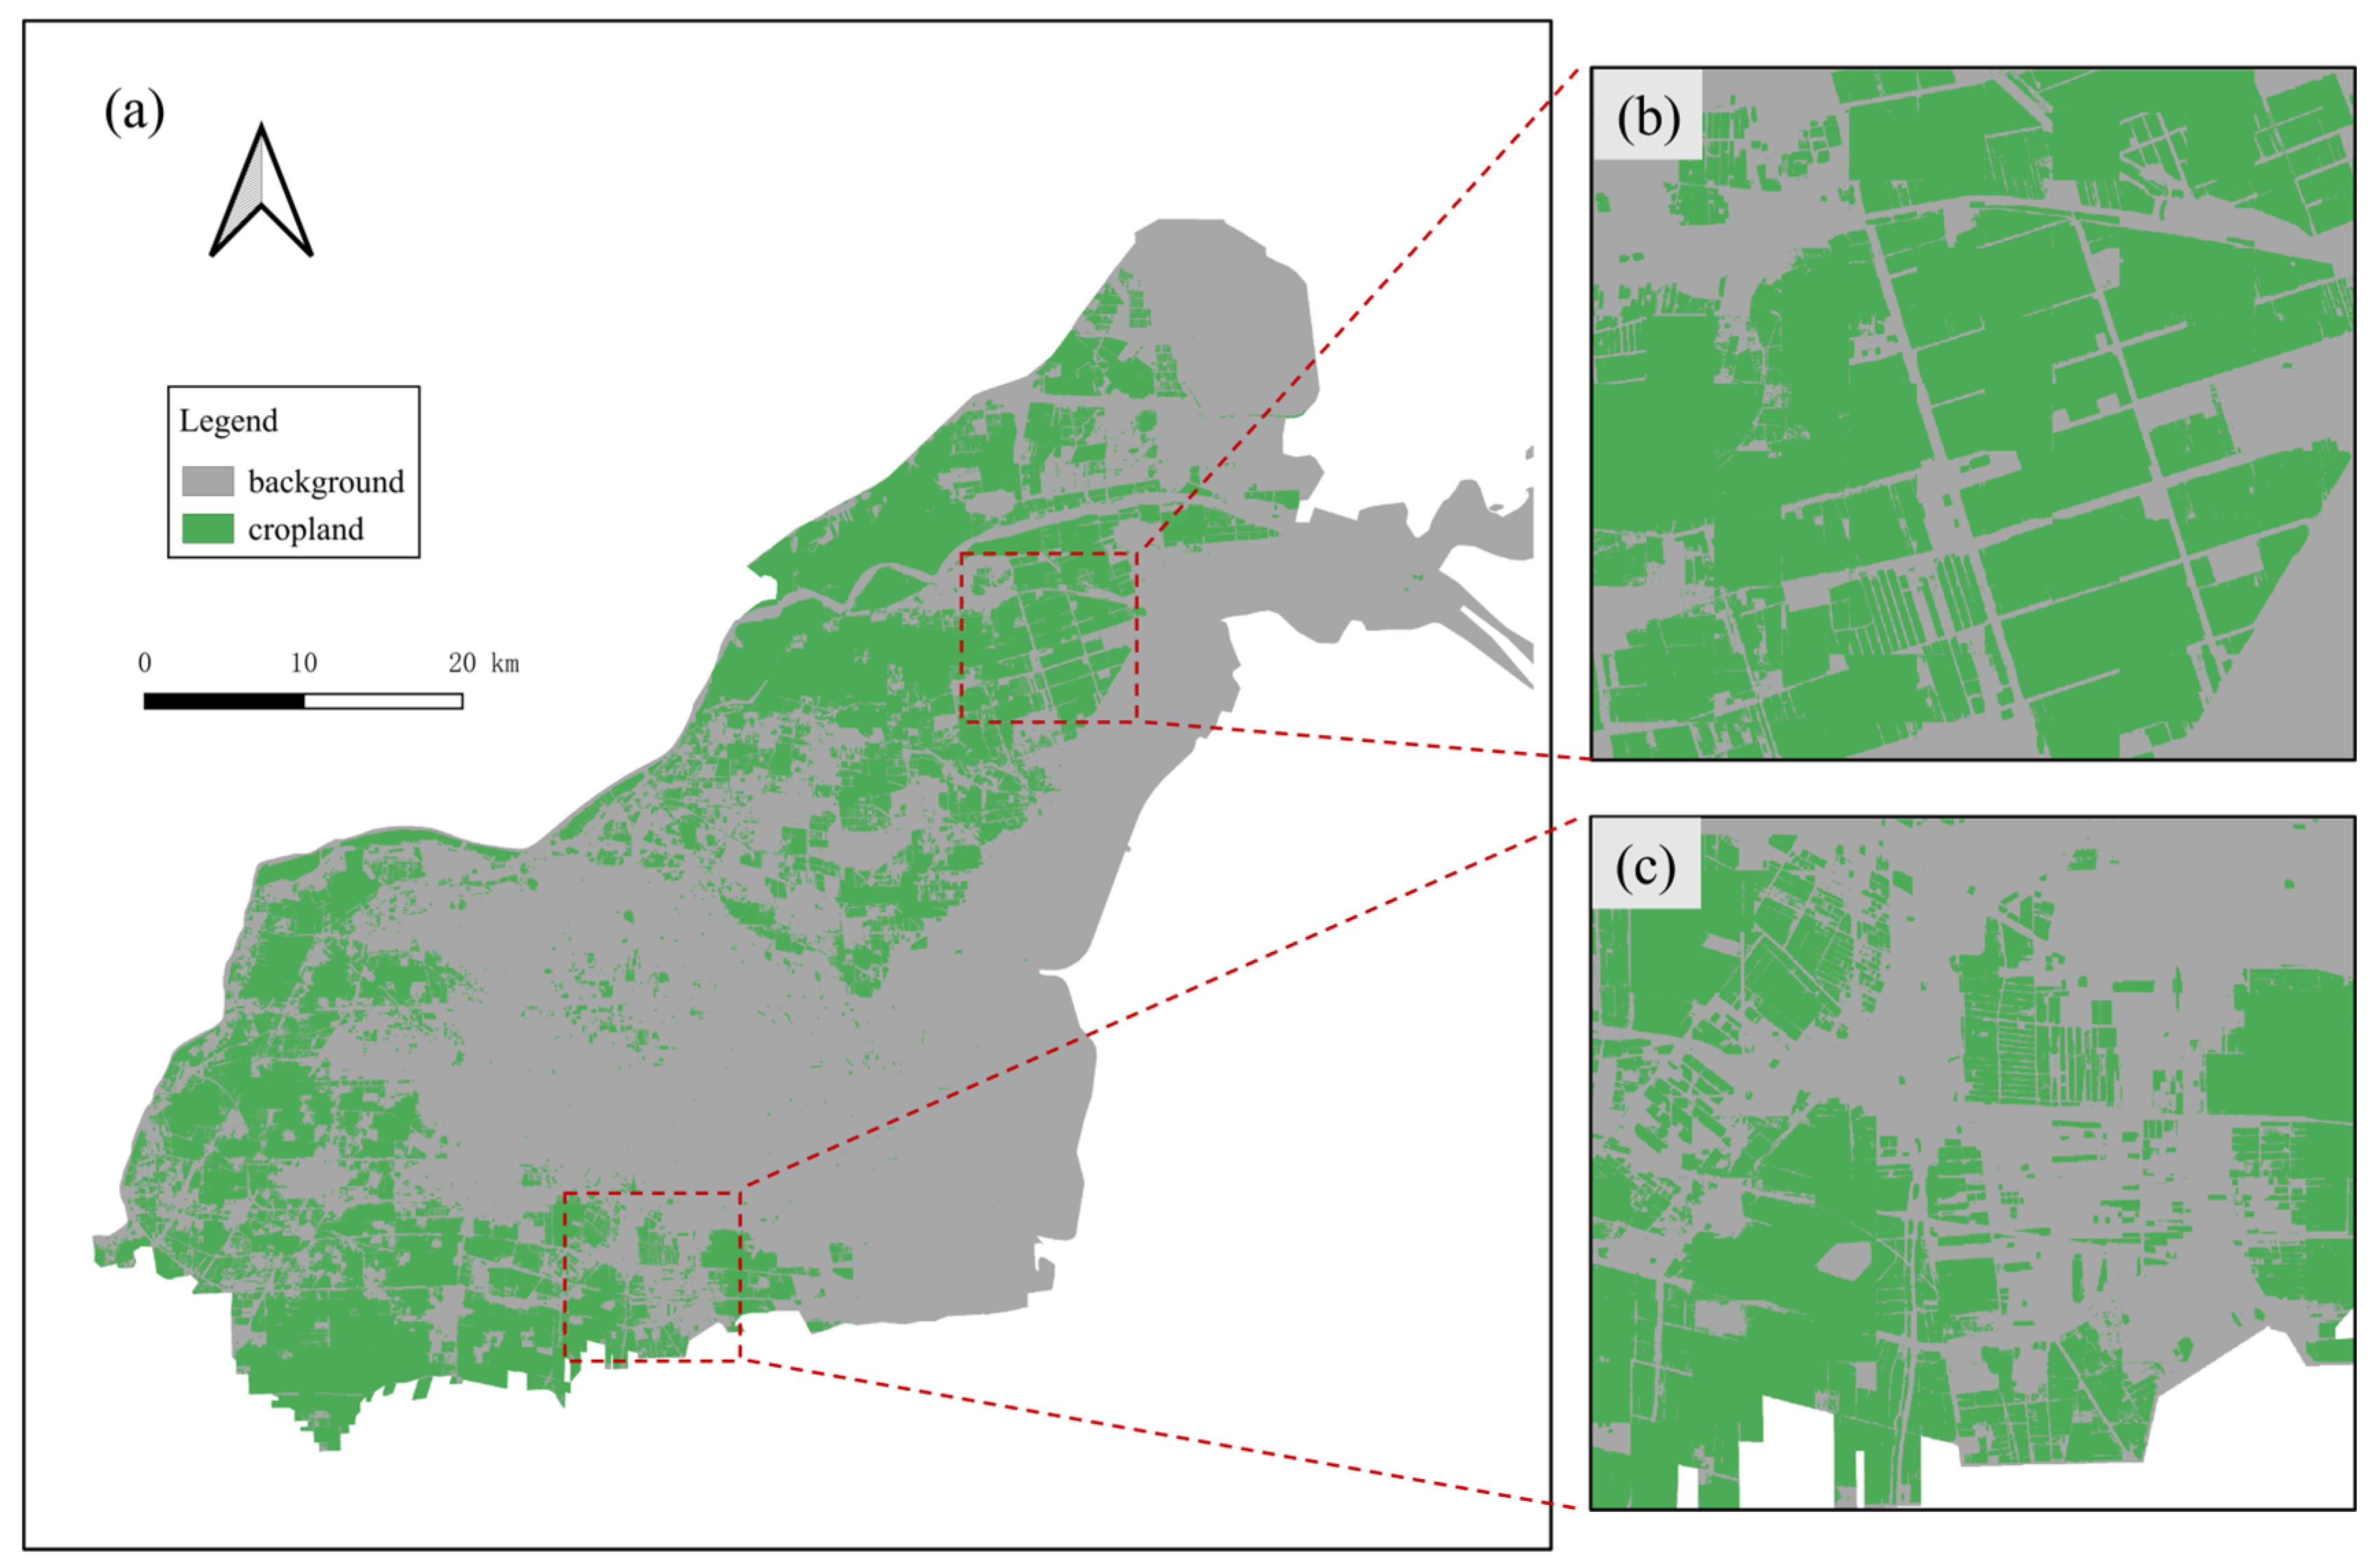
2.1. Study Area

The Yellow River Delta is located in the northeast of Shandong Province, adjacent to the Bohai Sea to the north and Laizhou Bay to the east. The study area, comprising Dongying District and Kenli District of Dongying City, is located between 36°55′ N and 38°10′ N latitude and 118°12′ E and 119°19′ E longitude, covering an area of approximately 10,400 square kilometers. This region, within the mid-latitude zone, experiences a warm, temperate continental monsoon climate with cold winters, hot summers, and well-defined seasons. The region has an average annual temperature of 12.8 °C, with precipitation and evaporation averaging 555.9 mm and 1885 mm per year, respectively. The frost-free period lasts approximately 206 days annually [26]. The predominant soil type in the area is saline and alkali soil, with about 52.11% of the land being arable and suitable for agricultural development. The cropland, which is neatly arranged, is primarily found in the central–northern and southwestern parts of the region, where the main crops are wheat, corn, and cotton [27].

2.2. Data

Gaofen-2(GF-2) imagery was obtained from the China Center for Resource Satellite Data and Application website (https://data.cresda.cn/ (accessed on 10 March 2025)). This satellite is equipped with a panchromatic/multispectral (PAN/MS) camera system, with the MS camera capturing four spectral bands—blue, green, red, and near-infrared—at a 4 m spatial resolution, and the PAN camera capturing panchromatic band imagery at a 1 m resolution [28]. For this study, images from Gaofen-2 with minimal cloud cover, captured between September and October 2023, were selected as the base data. These images were cropped in ArcGIS Pro and enhanced using panchromatic sharpening to produce multispectral imagery with a 1 m spatial resolution.
Sentinel-2 imagery was downloaded from the European Space Agency’s Copernicus Science Hub (https://dataspace.copernicus.eu/ (accessed on 10 March 2025)). To streamline the classification process for cropland using time series data and to mitigate the effects of data gaps, the study selected 262 cloud-free images (with less than 20% cloud cover) for the entire year of 2023. The red (B4) and near-infrared (B8) bands, which are effective for monitoring vegetation growth, were captured.
Monthly composite Normalized Difference Vegetation Index (NDVI) maps were generated by applying the mean value composite method. This process yielded 12 monthly average NDVI composites for the study area, with a spatial resolution of 10 m.
The cropland dataset for the study area included a time series point sample dataset from Sentinel-2 and a Gaofen-2 cropland mask dataset. The samples were utilized for pixel-wise classification of cropland in medium-resolution temporal imagery, while the mask data were utilized for the training and validation of comparative models for cropland semantic segmentation.
Point samples for cropland were sourced from Sentinel-2 imagery. Using true-color images as a reference within ArcGIS Pro, we performed visual interpretation to uniformly distribute sample points across the study area. Cropland samples were randomly collected within agricultural clusters, while non-cropland samples encompassed diverse land cover types (e.g., water bodies, built-up areas, and forest) to ensure representative coverage of other classes. The temporal spectral information of these points was then exported in CSV file format. A total of 1265 sample points, comprising cropland and background points, were established for the study, with 1050 used for training and 215 for testing (see Figure 1).
The mask data were derived from cropped and annotated true-color images from Gaofen-2, with each image measuring 1000 × 1000 pixels (for balancing efficiency and accuracy in cropland extraction) and categorized into two classes: cropland (with a field value of 1) and background (with a value of 0). To ensure representative samples, we selected image tiles from interior regions (avoiding study area boundaries) where cropland areas predominated, thereby better reflecting the model’s cropland extraction capability. A total of 60 annotated images were created for training comparative semantic segmentation models, and 20 were used for validating and comparing the accuracy of the comparative model and the improved model (see Figure 2).

2.3. Method

The flowchart of extracting cropland parcels based on the improved SAM is depicted in Figure 3. The initial machine learning classifier, trained on sparse time series point samples, generates cropland classification binary images. In the second stage, preliminary binary classification images are processed by an automatic prompt generation module to create SAM-compatible prompts (points, boxes, masks). Despite the unperfect prompt source, this OpenCV-based prompt generation module simulates manual prompt input to create effective crop-specific semantic prompts while excluding non-cropland objects. Ultimately, the generated prompts, along with high-resolution imagery, are processed by SAM to automatically segment the image and extract cropland parcels without manual prompt input. The workflow requires only sparse point samples to train the initial classifier, as the prompt generation module spares pixel-level mask annotations and extra training during cropland extraction.

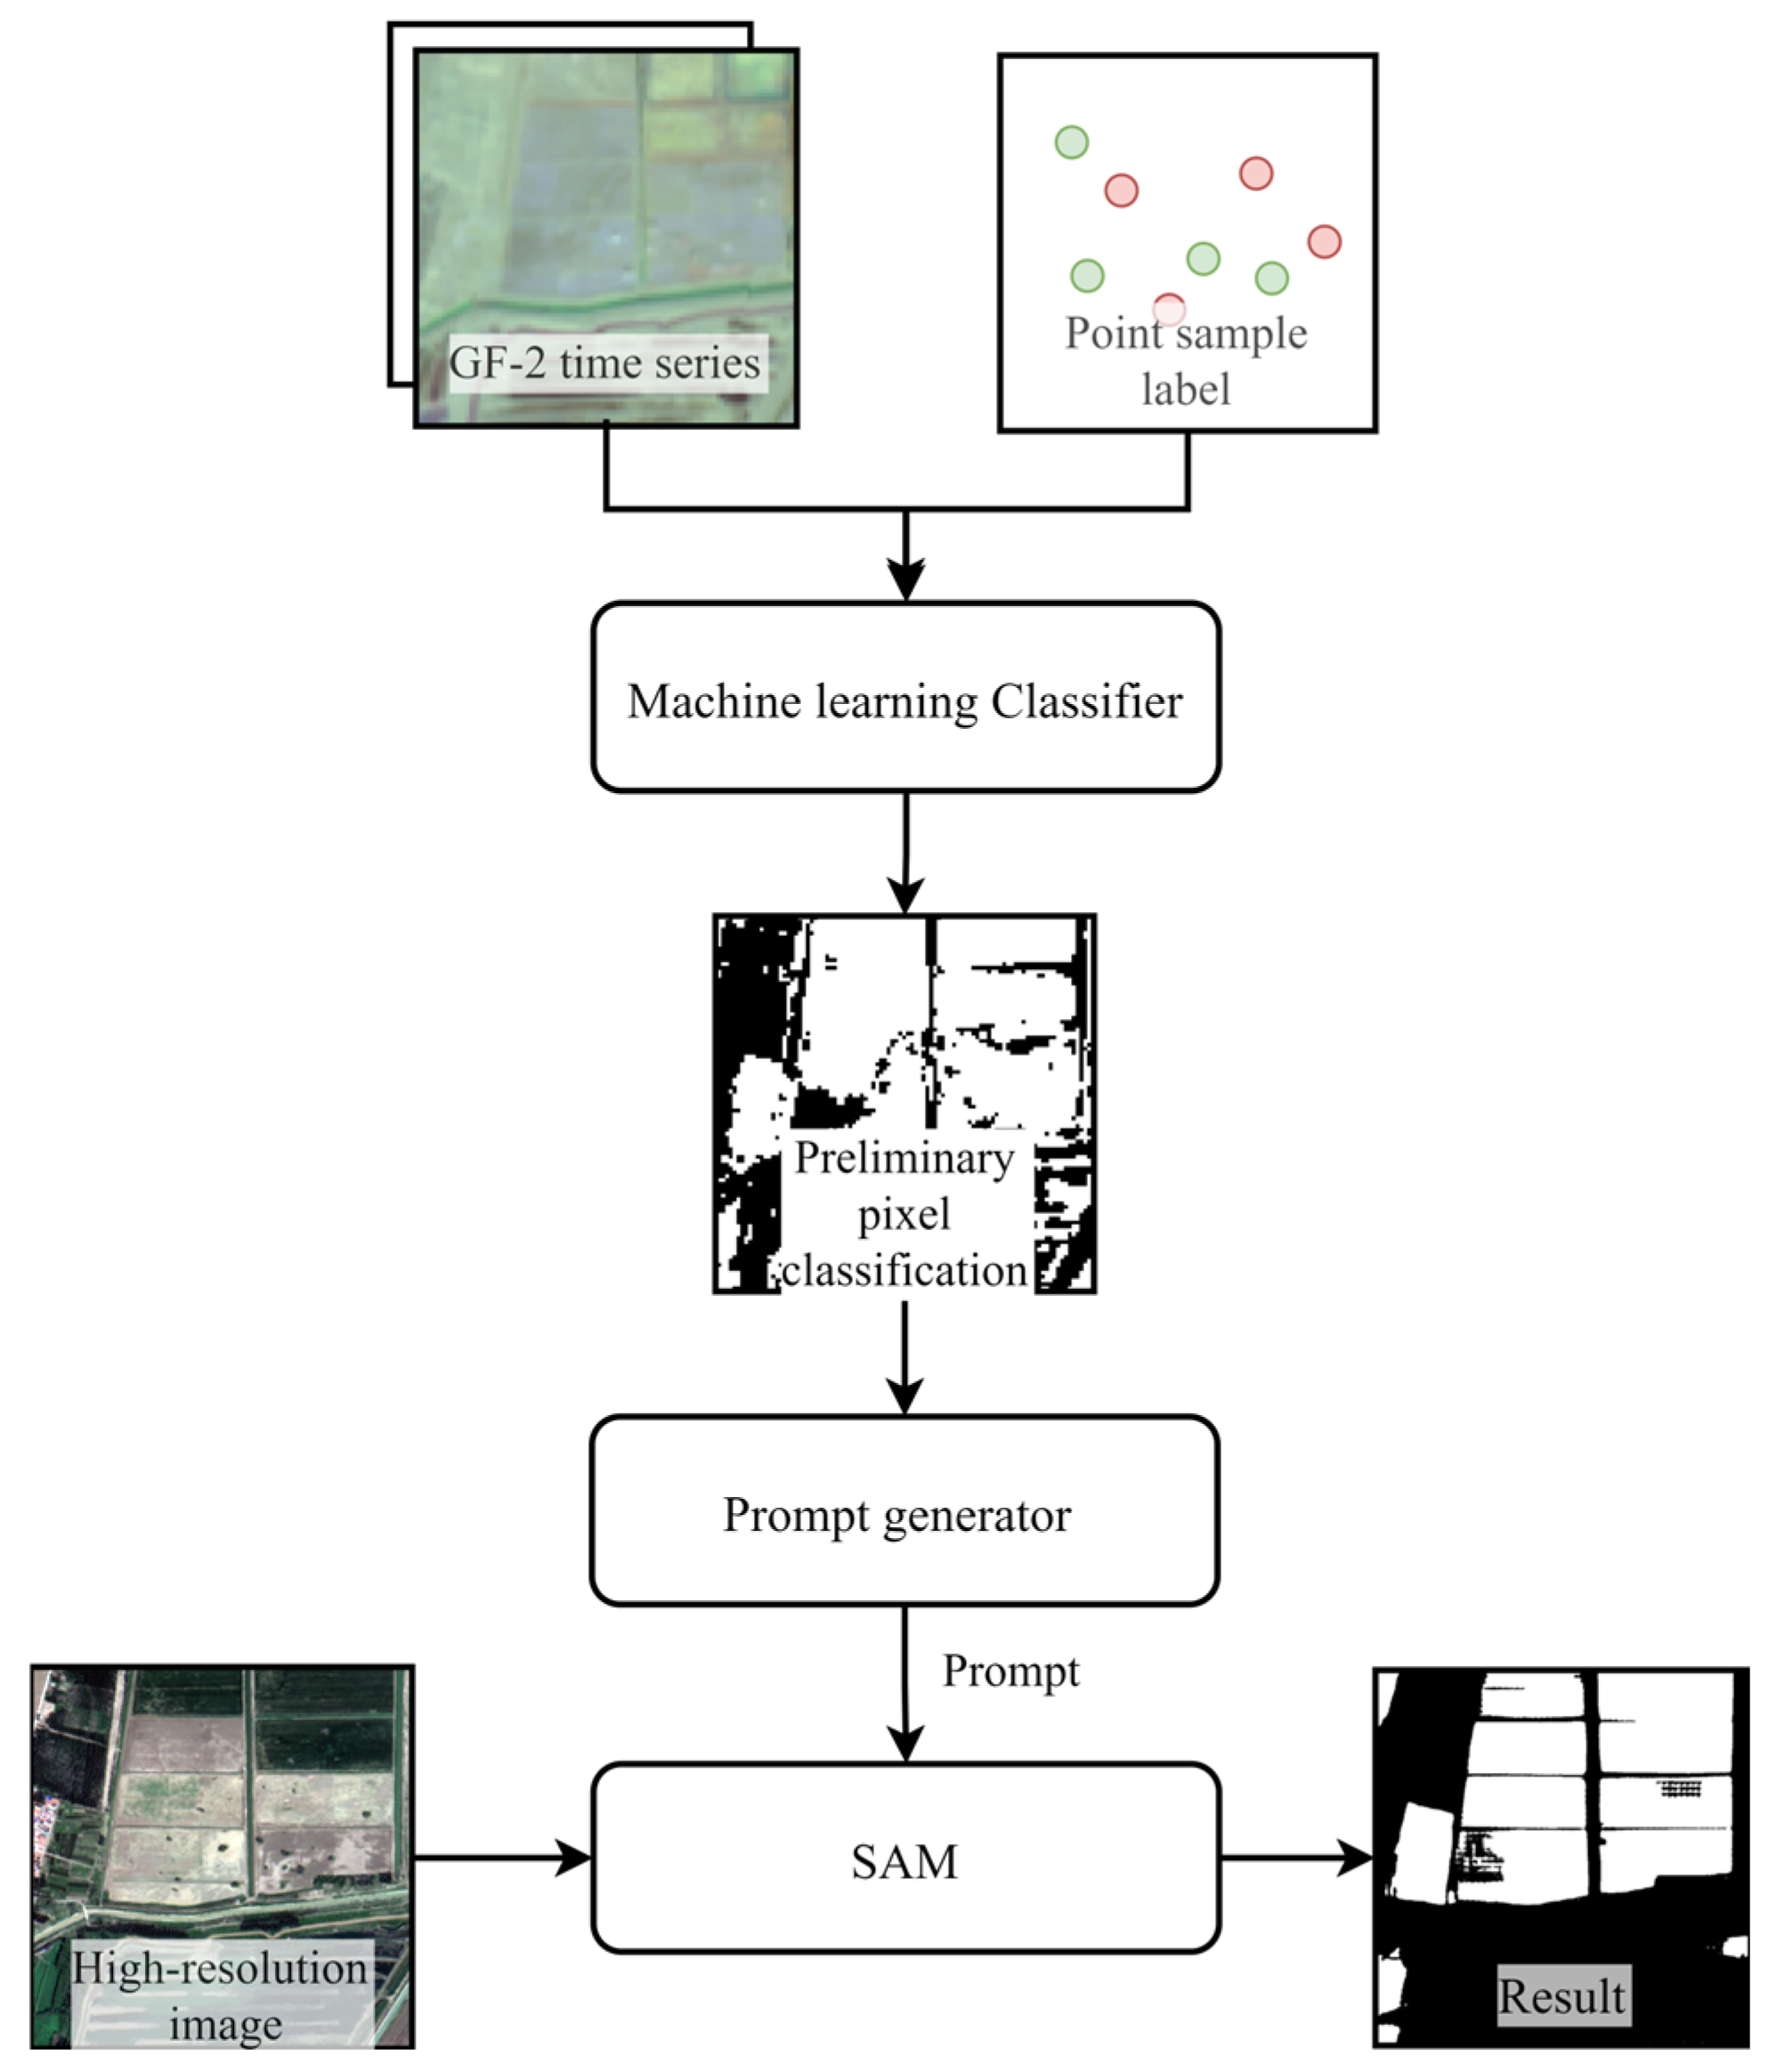
2.3.1. Preliminary Pixel Classification from Medium-Resolution Time Series Data

To achieve a trade-off between simplicity and accuracy in preliminary pixel classification, we utilized the 2023 monthly average NDVI values as classifier features. Four classifiers—Random Forest, XGBoost, KNN, and LSTM—were implemented for cropland pixel classification. Random Forest [29] is a typical ensemble learning algorithm that combines multiple weak classifier decision trees and determines the final prediction result through voting, enhancing the model’s overall accuracy in classification and regression tasks. XGBoost [30] is an efficient ensemble learning algorithm based on the gradient boosting framework, which incrementally adds new weak predictive models in a similar way to tree models, with subsequent models trained on the residuals of the previous ones, constructing a strong predictive model. KNN [31] is a supervised classification algorithm based on distance clustering, which predicts the category of a point by taking a weighted average of the labels of the K nearest points. The LSTM model is a typical time series model in deep learning, which manages long-term dependencies and controls information flow through input, forget, and output gates, effectively handling tasks such as time series regression and classification.
By comparing the performance of these models, the goal is to select a simple yet accurate classifier. The results of pixel classification are cropped into 100 × 100-pixel binary images, which are then fed into the automatic prompt generation module.

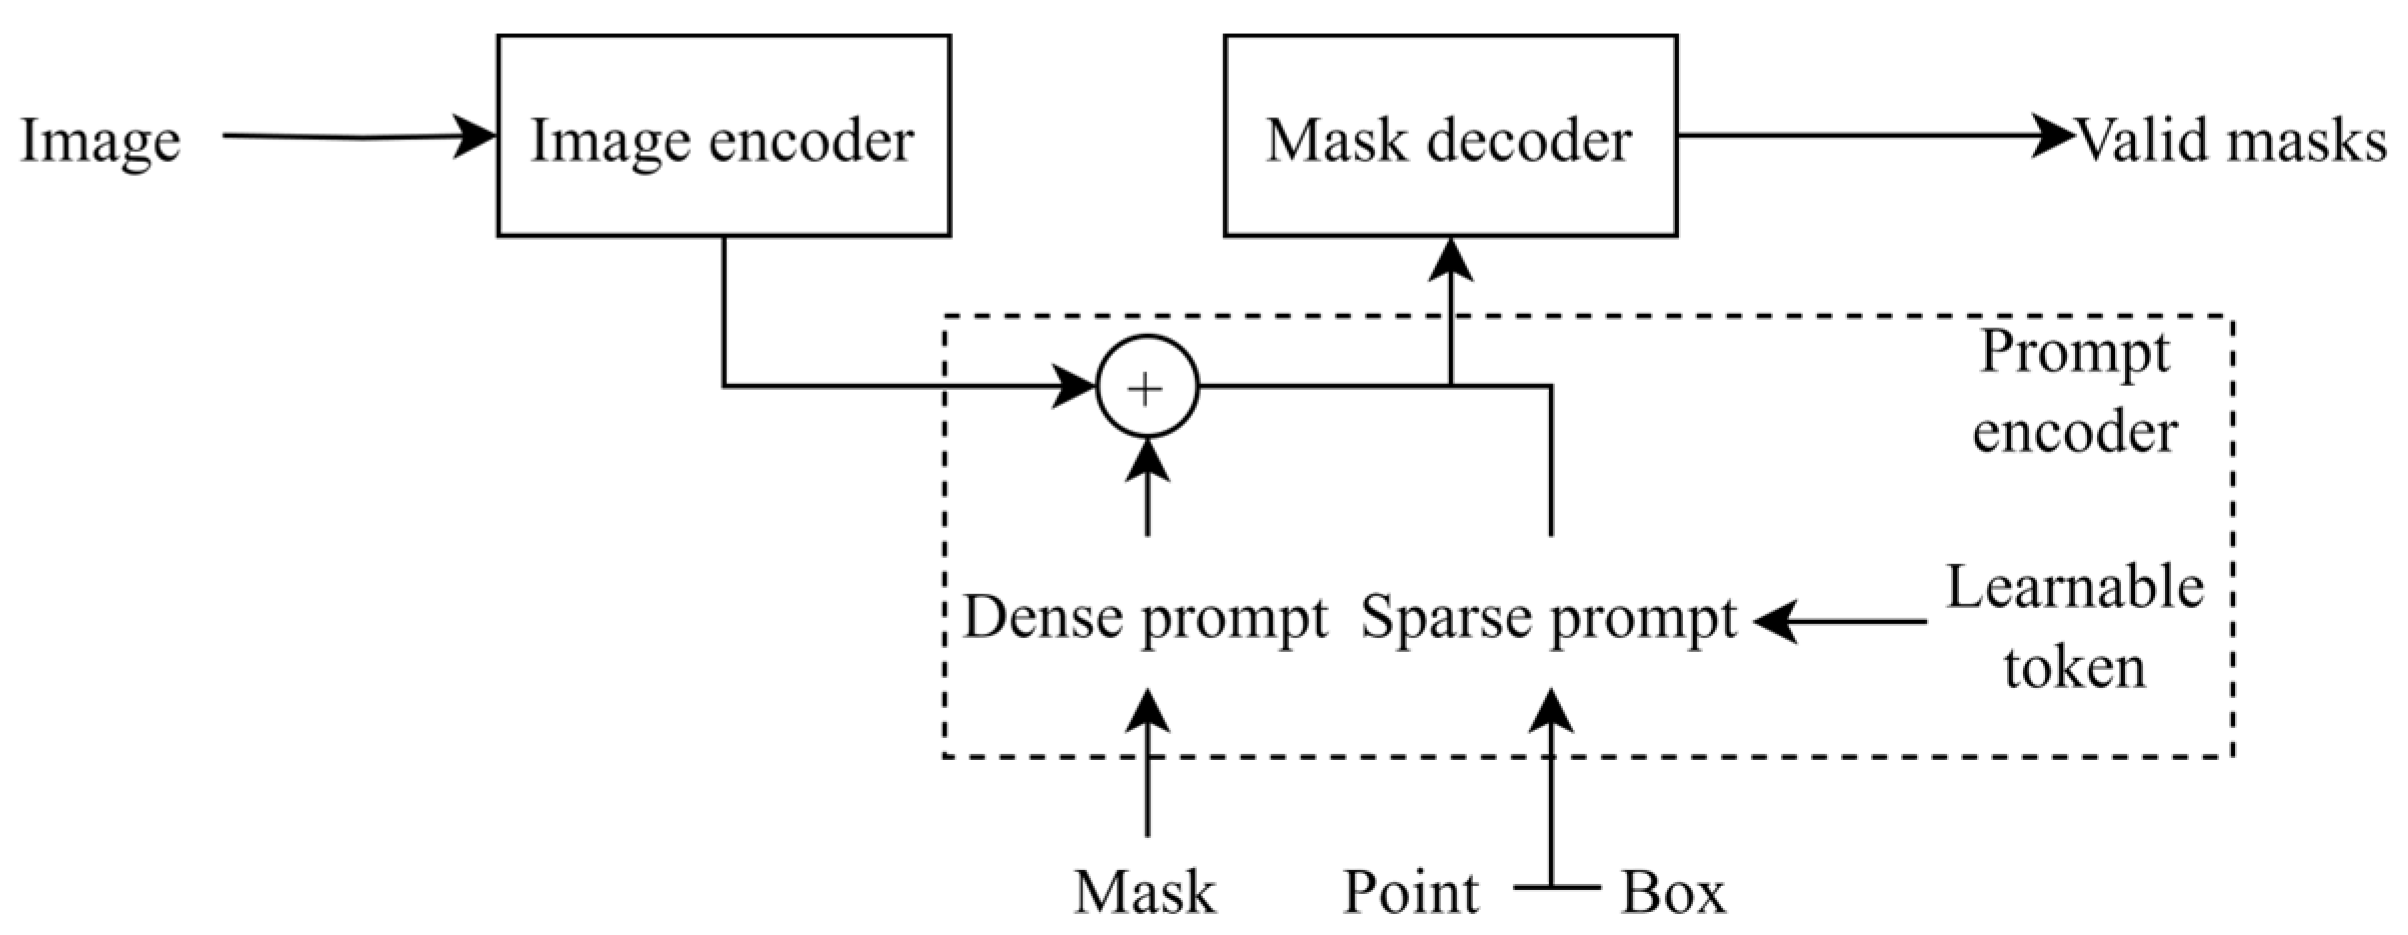
2.3.2. Brief Review of SAM

The Segment Anything Model (SAM), introduced by Meta, is a foundational interactive image segmentation model that can generate segmentation results guided by manual prompt inputs, including points, masks, bounding boxes, and text, without requiring additional training samples [32]. This model is primarily made up of three key components: an image encoder to process visual data, a prompt encoder to handle input prompts, and a mask decoder to generate the segmentation masks (see Figure 4).
The advantages of the SAM mainly include its capacity for interactive image segmentation based on prompts and its strong zero-shot learning capabilities. It can segment any object in any image without additional training when guided by manual prompts such as points and boxes. The interactive design of the SAM enables users to obtain preliminary segmentation results and provide further prompts to guide the model in achieving more precise target extraction and segmentation. The SAM’s zero-shot learning capabilities allow it to recognize categories unseen during training and perform additional tasks.
However, for remote sensing image segmentation tasks, the SAM has three main shortcomings: an inability to output segmentation image semantic information; dependence on manual prompts and an inability to automatically generate prompts; and unstable performance when transferred to remote sensing imagery. The SAM does not incorporate semantic information during processing, and its output lacks category information for the segmented instances. Specifically, for remote sensing image segmentation, the SAM can only extract object masks without providing object category information. Additionally, as an interactive segmentation model, the SAM’s output relies on the type, location, and number of user-provided prompts, and it cannot automatically generate prompts for end-to-end image segmentation [33]. Moreover, the SAM’s performance on remote sensing imagery can be significantly impacted by complex backgrounds and unclear object edges, especially in zero-shot learning scenarios. Without sufficient annotated training data, it may struggle to consistently produce high-quality masks.
Therefore, the key aim of model adjustment is to automatically generate prompts suitable for enabling the SAM to accomplish semantic segmentation of cropland while avoiding the segmentation of other irrelevant objects.

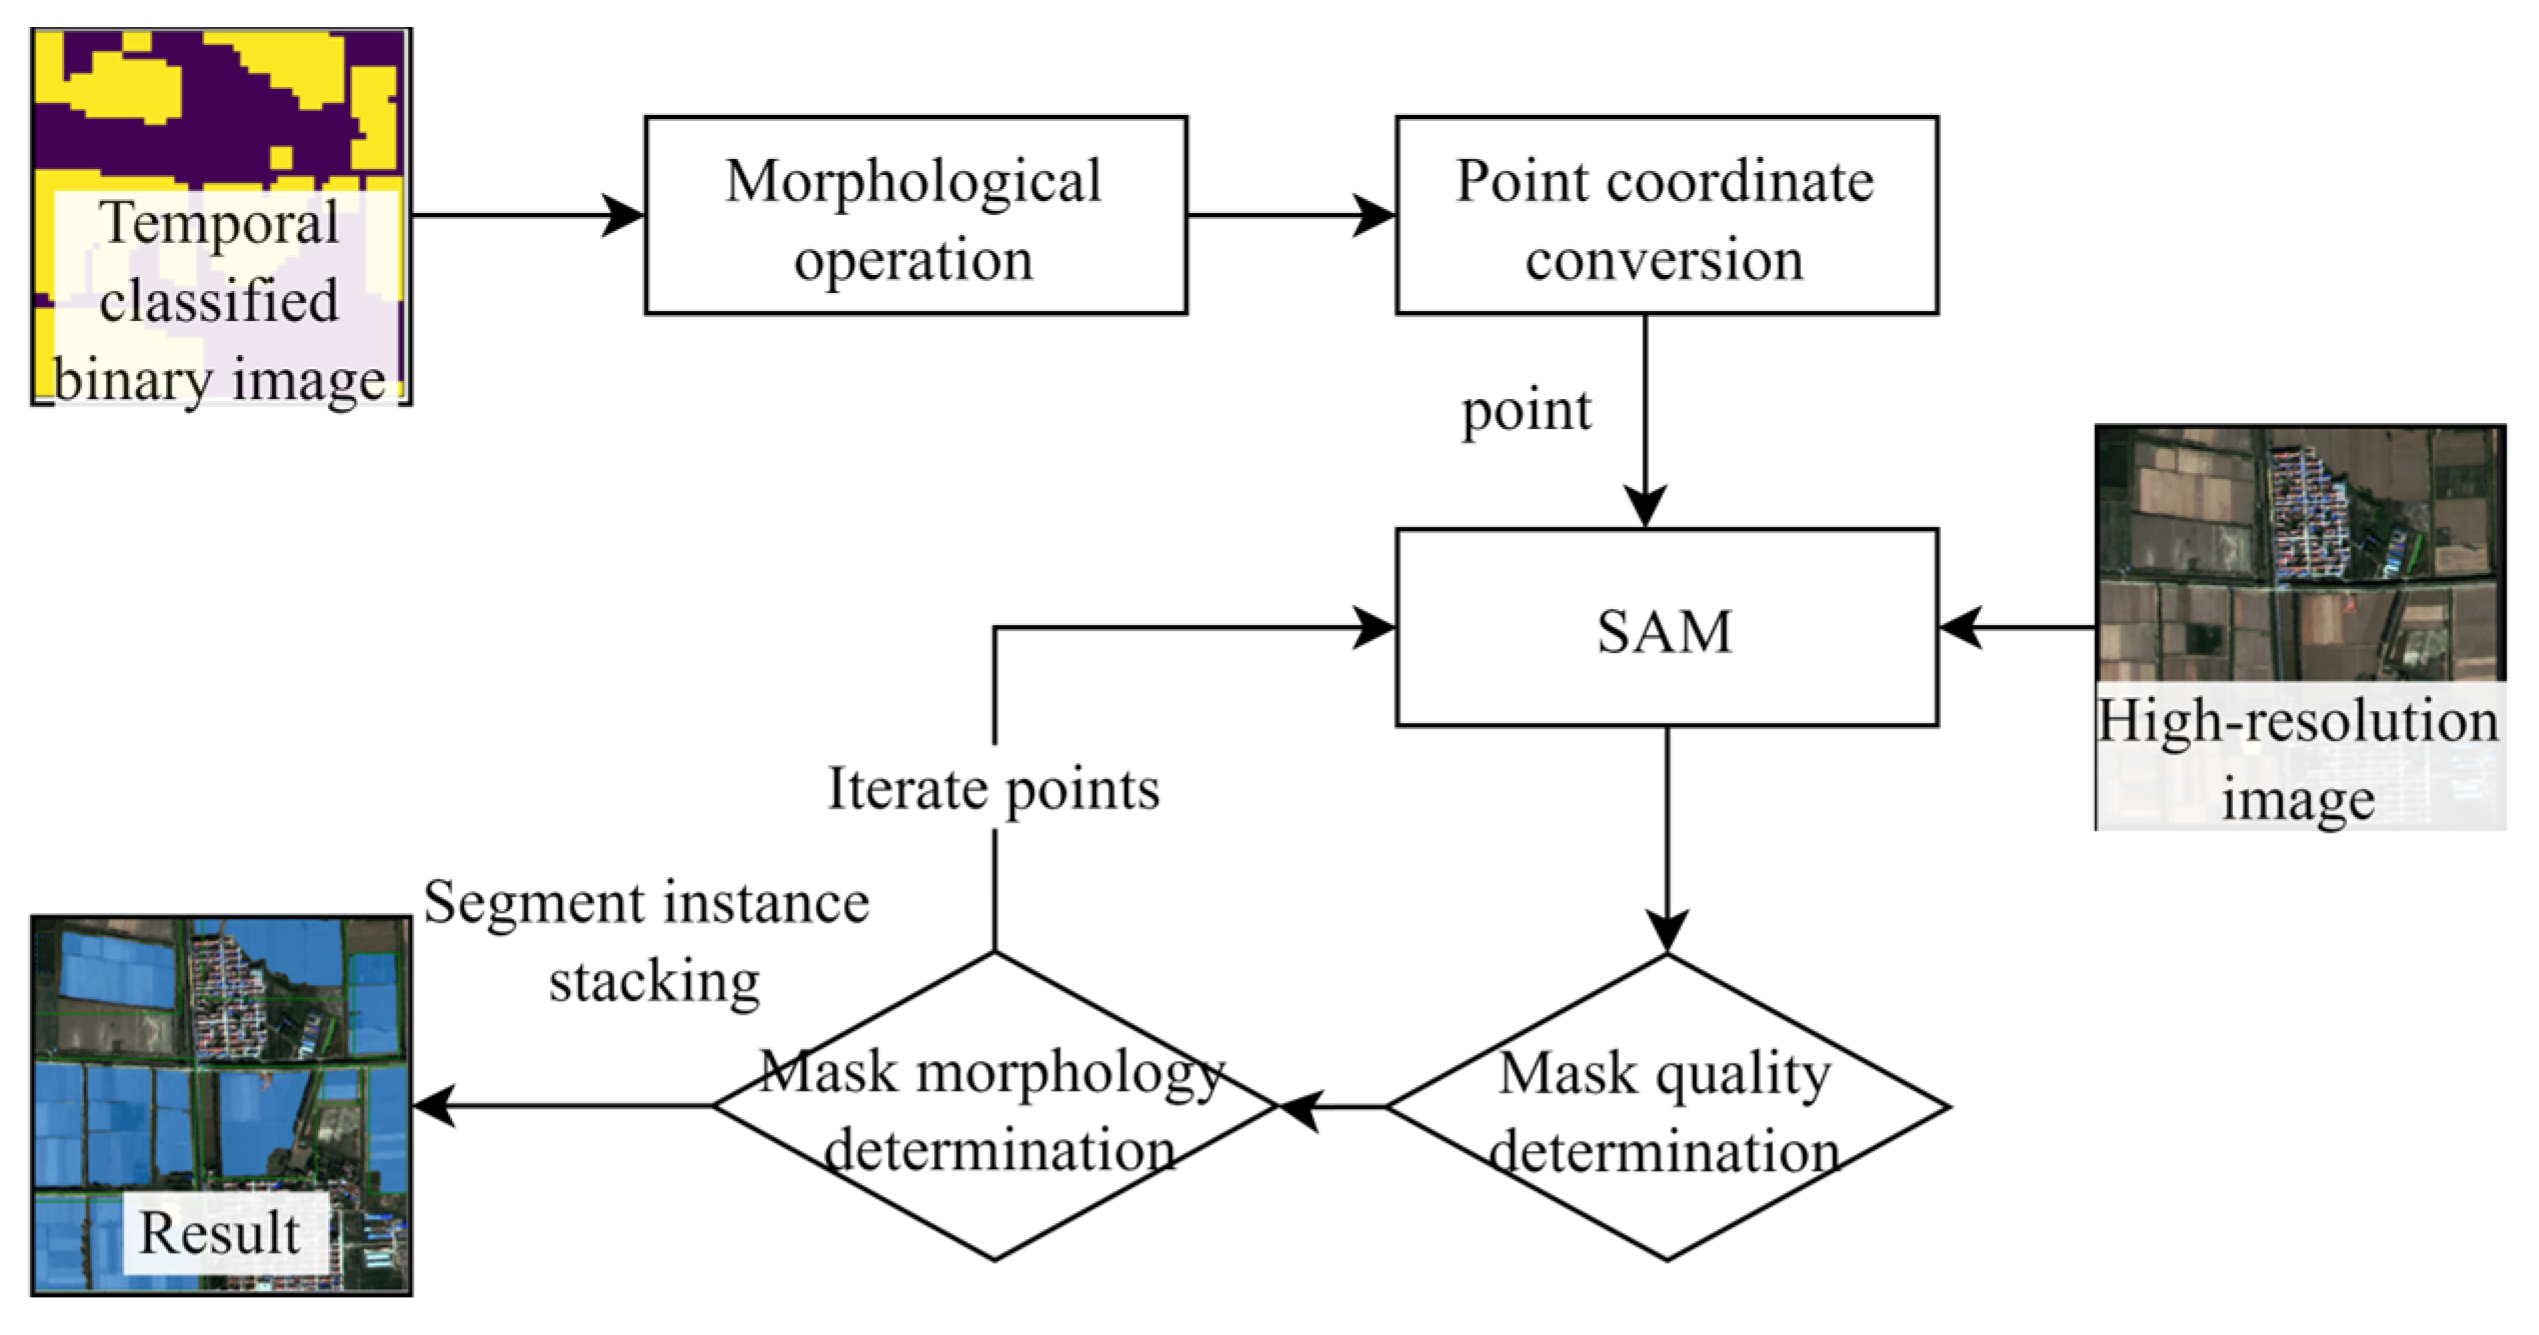
2.3.3. Auto Prompt Generation Module

The “segment everything” mode of the SAM automatically generates a grid of evenly spaced prompt points, using each as a prompt to segment all potential objects within an image. During the extraction of objects from remote sensing imagery, these evenly spaced grid points lead the SAM to extract ground objects of all types, which is not ideal for single-class extraction tasks like cropland mapping. In this study, we have adjusted the “segment everything” function of the SAM and named it the Auto Prompt Generation Module (Auto module), which replaces non-semantic grid prompts with potential cropland points derived from preliminary binary classification images. Specifically, this module extracts cropland pixels from the binary image and projects coordinates into the coordinate system of high-resolution imagery. After iterating all the prompt points and predicting their correspond cropland parcels, the qualified cropland parcel instances are overlaid. The flowchart of the Auto module is shown in Figure 5.
Morphological operations serve three primary purposes: the elimination of salt-and-pepper noise in binary classified images; the mitigation of the effects of geographical misregistration; and the bolstering of the differentiation between distinct parcels. In detail, noise present in binary classified images degrades the quality of the SAM’s prompt extraction, while opening operations are effective in mitigating this noise. Furthermore, the boundaries of cropland parcels in binary images are frequently indistinct, and erosion operations have been shown to facilitate the isolation of these parcels, thereby enhancing their differentiation. Experimental results demonstrate that applying two erosion operations followed by one dilation (3 × 3 kernel) effectively removes noise, while preserving cropland area integrity.
Since binary images (10 m/pixel) and high-resolution images (1 m/pixel) differ in their spatial resolutions, the point prompts derived from binary images require additional coordinate transformation to properly guide the cropland extraction from high-resolution imagery. During the process of point coordinate conversion, cropland points are selected, and their coordinates are projected into the coordinate system of high-resolution imagery. The coordinate conversion formula is as follows:
M = R b / R r
x r = M / 2 + M × x b
y r = M / 2 + M × y b
In the formula, M is the spatial resolution multiplier of the high-resolution image of the binary image; R b and R r are the spatial resolutions of the binary image and the high-resolution image, respectively; and x b , y b , x r , y r are the coordinates of the pixel points in the binary image and the high-resolution image, respectively. For example, the binary image has a spatial resolution of 10 m and a size of 100 × 100 pixels, and the corresponding high-resolution image has a spatial resolution of 1 m and a size of 1000 × 1000 pixels. The pixel (0, 0) in the first row and column of the binary image is converted to the high-resolution image coordinate system with coordinates (5, 5).
The transformed point coordinate serves as a point prompt to guide the SAM to extract a cropland parcel instance containing a mask, a prediction intersection over union (IoU) score, and the minimum outer rectangle from the high-resolution imagery. These parameters will be used as the foundation for morphological filtering and quality filtering to achieve high-quality cropland land extraction.
Morphological filtering was designed to select complete masks, which are more likely to be cropland. An additional criterion for morphological filtering was the proportion of mask area to the area of the smallest external rectangle (set to 0.2), which was designed to filter out long, narrow bare fields, ridges, or other fragmented masks between cropland parcels.
Quality filtering metrics employed included the IoU, the stability score, and the non-maximal suppression (NMS) metric. The IoU metric serves to filter out masks that exceed a specified threshold, while also removing masks that exhibit low scores and low confidence in the predicted instances. These instances tend to be relatively fragmented and characterized by fuzzy boundaries. The stability indicator measures the IoU of the masks generated by the same prompt under different numerical thresholds. NMS calculates the IoU of the smallest outer rectangle of the two masks, and if it exceeds the set threshold then the box with the highest score is screened out, which can reduce the overlap of the extracted cropland parcels. According to our experiment, the model segmentation performs optimally when each parameter is set as follows: the IoU threshold is 0.82, the stability threshold is 0.88, and the NMS threshold is 0.8.

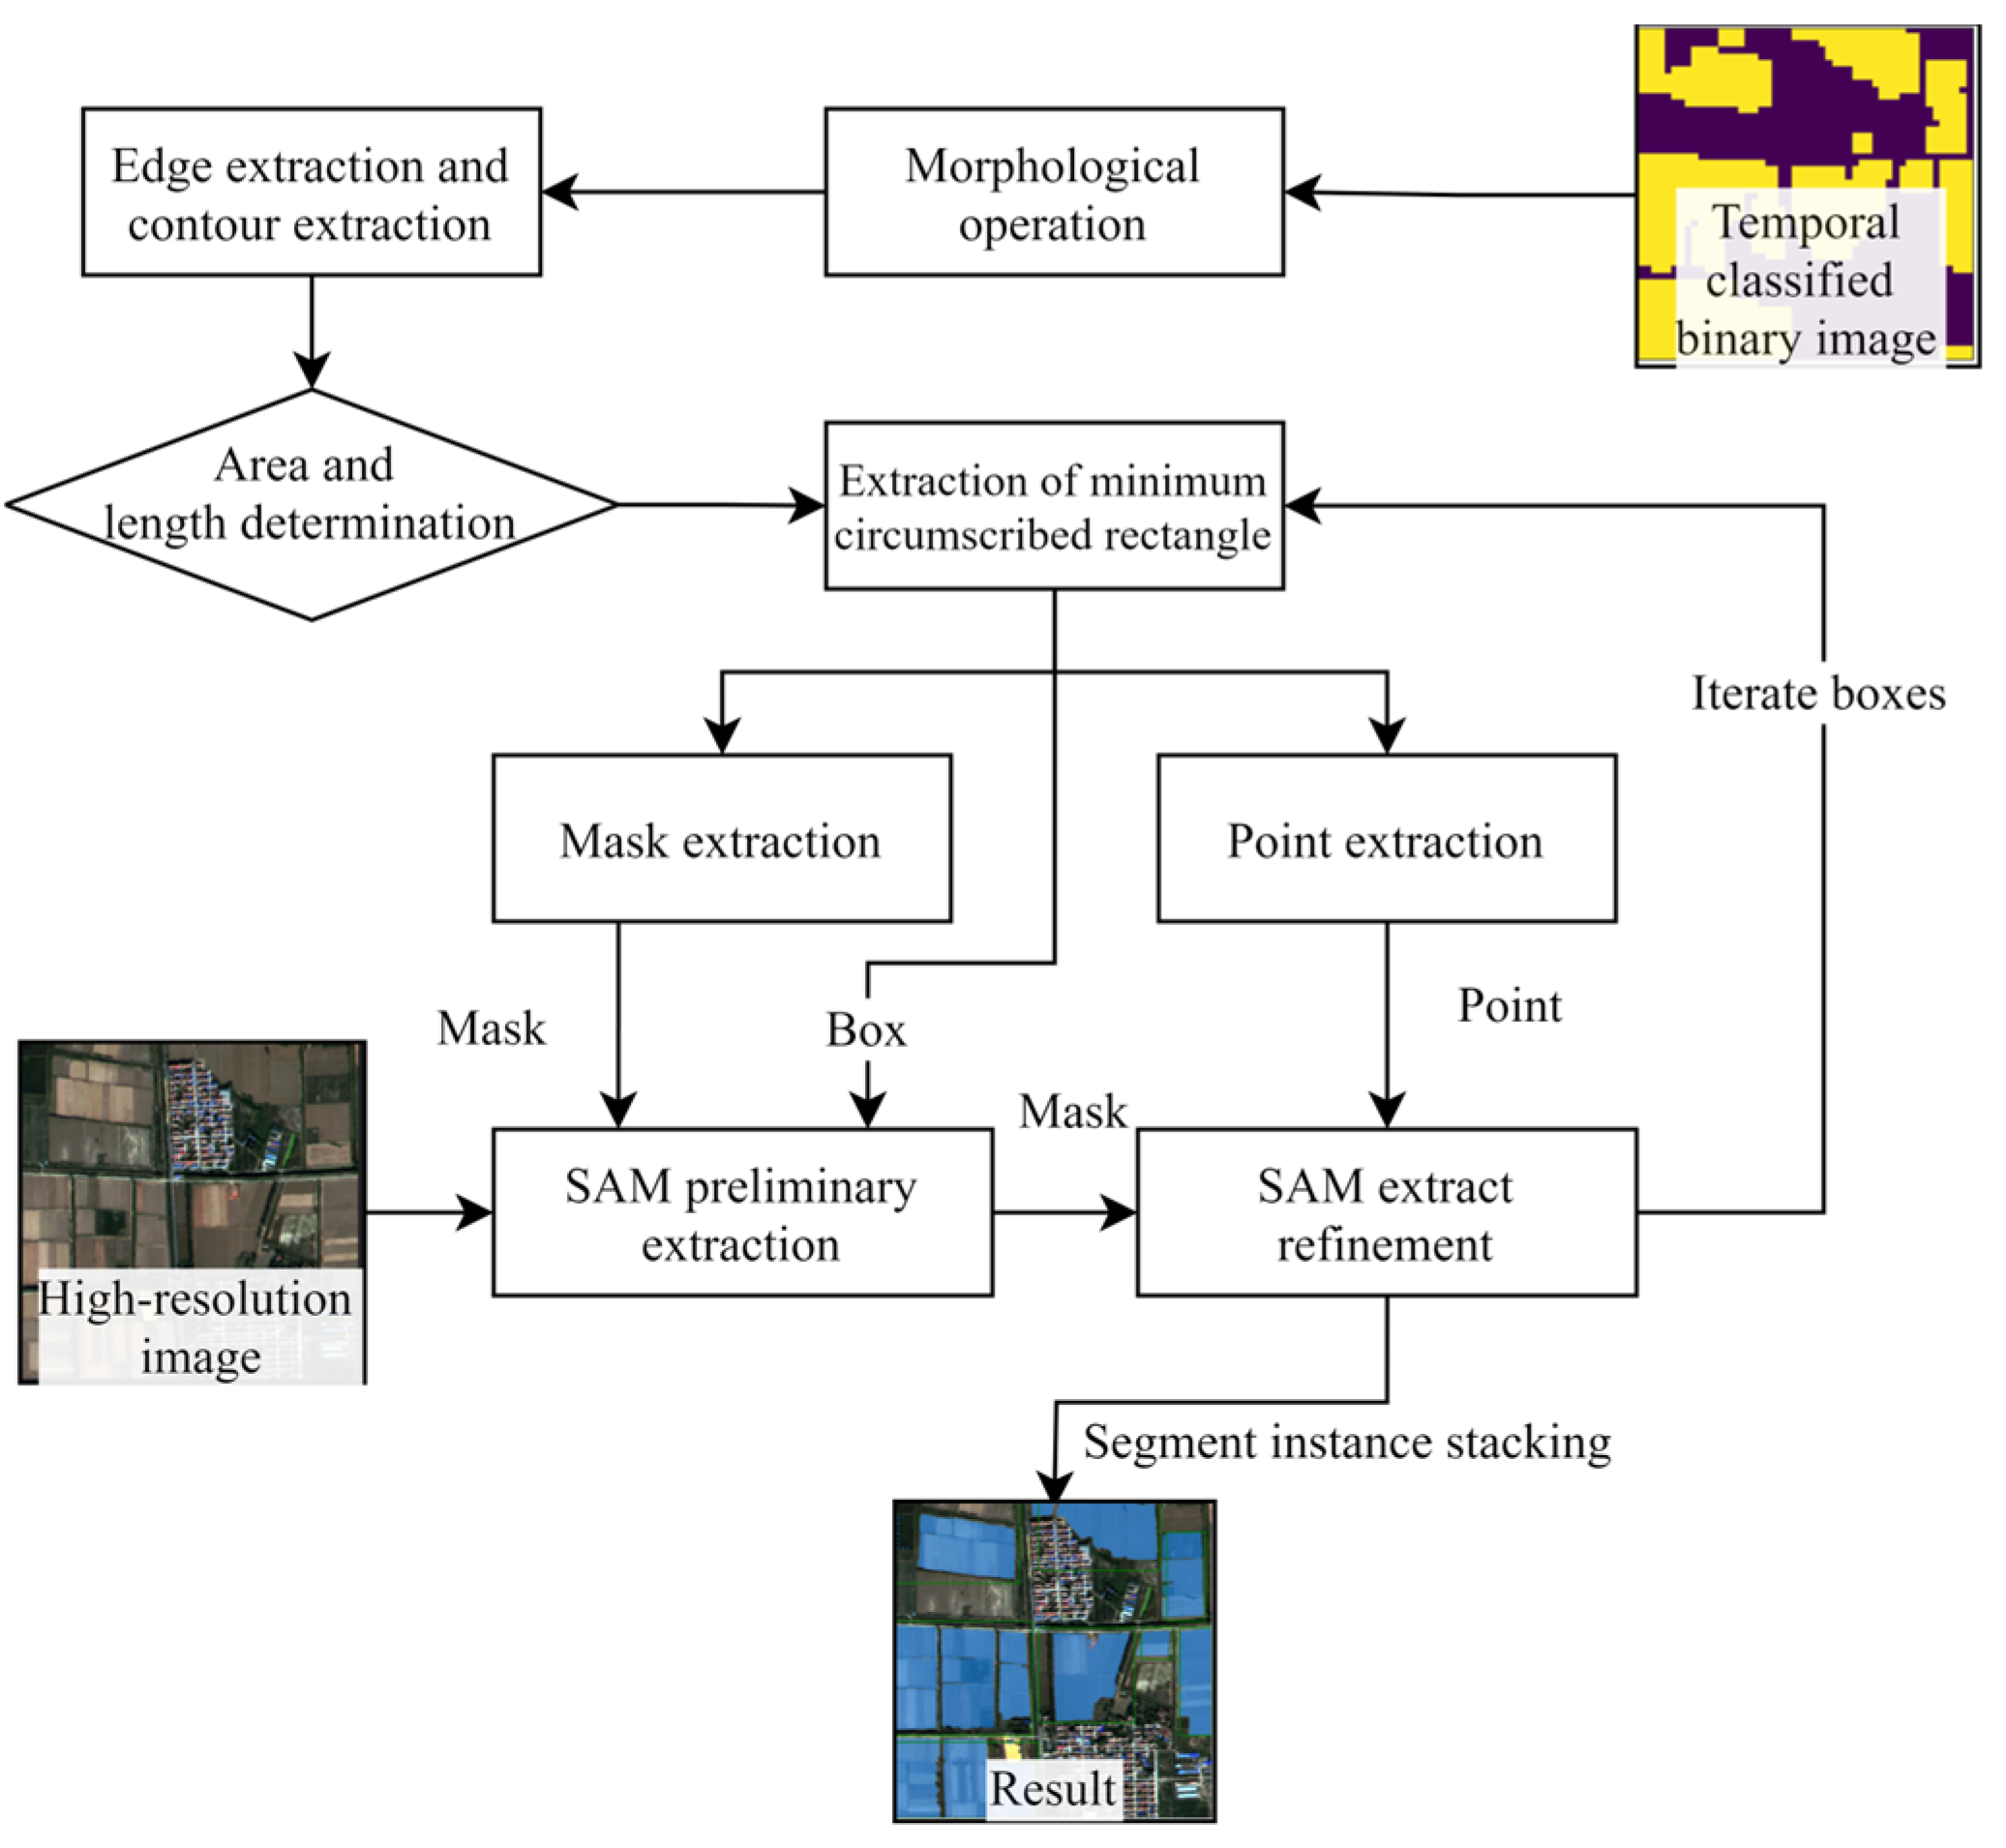
2.3.4. Box Prompt Generation Module

The SAM supports three types of prompts: box, mask, and point prompts, whereas the above Auto module only utilizes point prompts, although the extraction process is relatively simple. However, the roles of the dense prompt mask and box prompts is ignored. The proposed Box Prompt Generation Module (Box module) employs all three prompts to extract the cropland hierarchically. In the first stage, the SAM performs preliminary cropland extraction under point and mask prompts, while in the second stage, point prompts support the SAM’s refining of the results from the first stage. The flowchart of the Box module is shown in Figure 6.
The process and purpose of morphological operations in the Box module are the same as those in the Auto module, as described in the previous section. Edge extraction and contour extraction are the prerequisites for the Box module to achieve conversion of binary images to SAM prompts. In this study, the Canny edge extraction operator [34], which is widely used in computer vision, was initially used for binary image edge extraction. The main principle of the Canny operator is gradient computation and non-extremely large value suppression, and edge extraction of single pixel width is achieved by these two techniques. However, this method presents boundary interruptions in regions with complex image changes during extraction of the edges of low-resolution binary images, which, in turn, fails to achieve the establishment of contour objects. It can be observed that the boundary continuity extracted using the four-neighborhood pixel value detection method is significantly improved over that achieved with the Canny edge extraction operator (Figure 7). After building the outermost contour object of the edge pixels, we deleted the contours with too short a perimeter or too small an area, which typically do not correspond to cropland. The minimum area and perimeter thresholds were set to 15 pixels and 10 pixels, respectively, during processing (the size of binary images was 100 × 100).
Contour objects are capable of extracting bounding rectangles and converting them to box prompts for the SAM. Specifically, the smallest outer rectangle extracted by the qualified contour records the vertex coordinates, as well as length and width information. The box prompts are obtained directly from the rectangular vertices after coordinate transformation (see Equations (1)–(3)). Both point and mask prompts originate from points within the rectangle. Point prompts require coordinate transformation, while mask prompts use background values to fill the outer area of the rectangle before resampling the image to 256 × 256 pixels (the SAM’s mask prompt size).
The final cropland extraction requires multiple prompts and the strategy of hierarchical extraction. In the preliminary stage, box prompts, mask prompts, and high-resolution images are concurrently input into the SAM. However, the cropland boundaries extracted at this stage contain errors and necessitate further optimization. The preliminary extraction results are resampled to 256 × 256 as mask prompts, and, together with the point prompts and the high-resolution images, are input into the SAM again to optimize and adjust the previously predicted cropland contours, and generate more accurate and complete cropland instances. Following the traversal of all box tips and the completion of the prediction of cropland instances, the cropland instance masks are superimposed in order to complete the extraction of cropland parcels from the entire high-resolution image.

2.4. Implementation and Experimental Setup

2.4.1. Comparison of Semantic Segmentation Models

In this study, three semantic segmentation models—U-Net, Deeplabv3+, Segformer, and the proposed improved SAM—were selected for comparison.
U-Net [16], a classical semantic segmentation model, has been found to demonstrate limited performance in many segmentation tasks. Its successor, Deeplabv3+ [17], introduces features such as null convolution and multi-scale learning based on its encoder–decoder, and has been found to perform well in many CNN models. Segformer [35] is a transformer framework semantic segmentation model, which is based on ViT [36]. This model demonstrates improvements in computational efficiency, embedding generation, and multi-scale capability.
All of the aforementioned comparison models utilized small-parameter versions (Segfomer_b0, Deeplabv3+_r18), employing the AdamW [37] optimizer with a learning rate of 0.0006 and a batch size of 1. Sixty sheets from the cropland dataset were selected as the training set, and the remaining twenty sheets were used for testing. These were then compared with the SAM integrating the Box module and the Auto module, in order to facilitate a performance comparison.

2.4.2. Box Module Ablation Test

The purpose of this ablation experiment was to investigate the following two issues: the impact of the three types of prompts (point, mask, and box) on the prediction results, and the advantage of multi-stage predictions over simple instance prediction. Two ablation strategies were designed: Strategy 1: Replace box prompts with point prompts during the initial instance prediction, omitting the second prediction stage; Strategy 2: Adopt the instance predicted from the initial stage, omitting the second prediction stage.

2.4.3. Investigation of Improved SAM’s Best Performance

In scenarios where the number of samples with a single spectral feature is limited, the pixel classifiers for medium-resolution time series images possess bias and variance. The former can be detected in the test set and reduced through model optimization, while the latter will almost inevitably cause local misclassifications in the binary image and have a detrimental effect on the performance of the SAM. In order to completely eliminate the interference of error prompts and explore the model’s theoretical optimal performance, in this study, the labeled masks of the high-resolution image test set of the cropland dataset were used as the prompt data source (designed to simulate completely accurate pixel classification results) and resampled to the binary image size (100 × 100), and then fed into the SAM prompt generation module to generate completely correct prompts. Furthermore, the maximum parameter versions of Segfomer_b5 and Deeplabv3+_r101 were utilized for comparison with the SAM, with the objective of investigating whether the enhanced SAM could fully surpass the prevalent semantic segmentation models under optimal conditions.

2.4.4. Performance Assessment

Five quantitative metrics were selected to evaluate the model performance: overall accuracy (OA), the intersection and merger ratio (IoU), the class-averaged intersection and merger ratio (mIoU), the F1 score, and the kappa. OA calculates pixel accuracy, while the IoU calculates the ratio of correctly predicted regions to the concatenated set of predicted and actual regions, and the mIoU is the mean value of the IoU for each category. The F1 score is a complement to OA, and is an effective measure of the recall and precision of the prediction. The kappa coefficient is used to evaluate the consistency of pixel classification. The expressions of the five evaluation indicators are displayed in Equations (4)–(8).
O A = T P T P + T N + F P + F N
I o U = T P T P + F P + F N
m I o U = 1 / N c l a s s i I o U i
F 1 = 2 T P 2 T P + F P + F N
k a p p a = O A i ( n i × T P i ) n × n 1 i ( n i × T P i ) n × n
where T P denotes that both the predicted and true values of the pixel category are positive; T N denotes that both the predicted and true values of the pixel category are negative; F P denotes that both the predicted and true values of the pixel category are positive; F N denotes that both the predicted and true values of the pixel category are negative; n i denotes the total number of pixels belonging to class i ; and n is the total number of pixels.

3. Results

3.1. Sentinel-2 Time Series Data Pixel Classification

Table 1 shows the performance of each pixel classification model on the test set and in cross-validation after finding the optimal hyperparameters through grid-searching. RF obtained the highest OA in both the test set and cross-validation, with 96.9% and 91.2%, respectively, 2–5% higher than that of the other methods. Therefore, the subsequent study used RF’s preliminary pixel classification (Figure 8) as the prompt data source for the prompt generation modules.

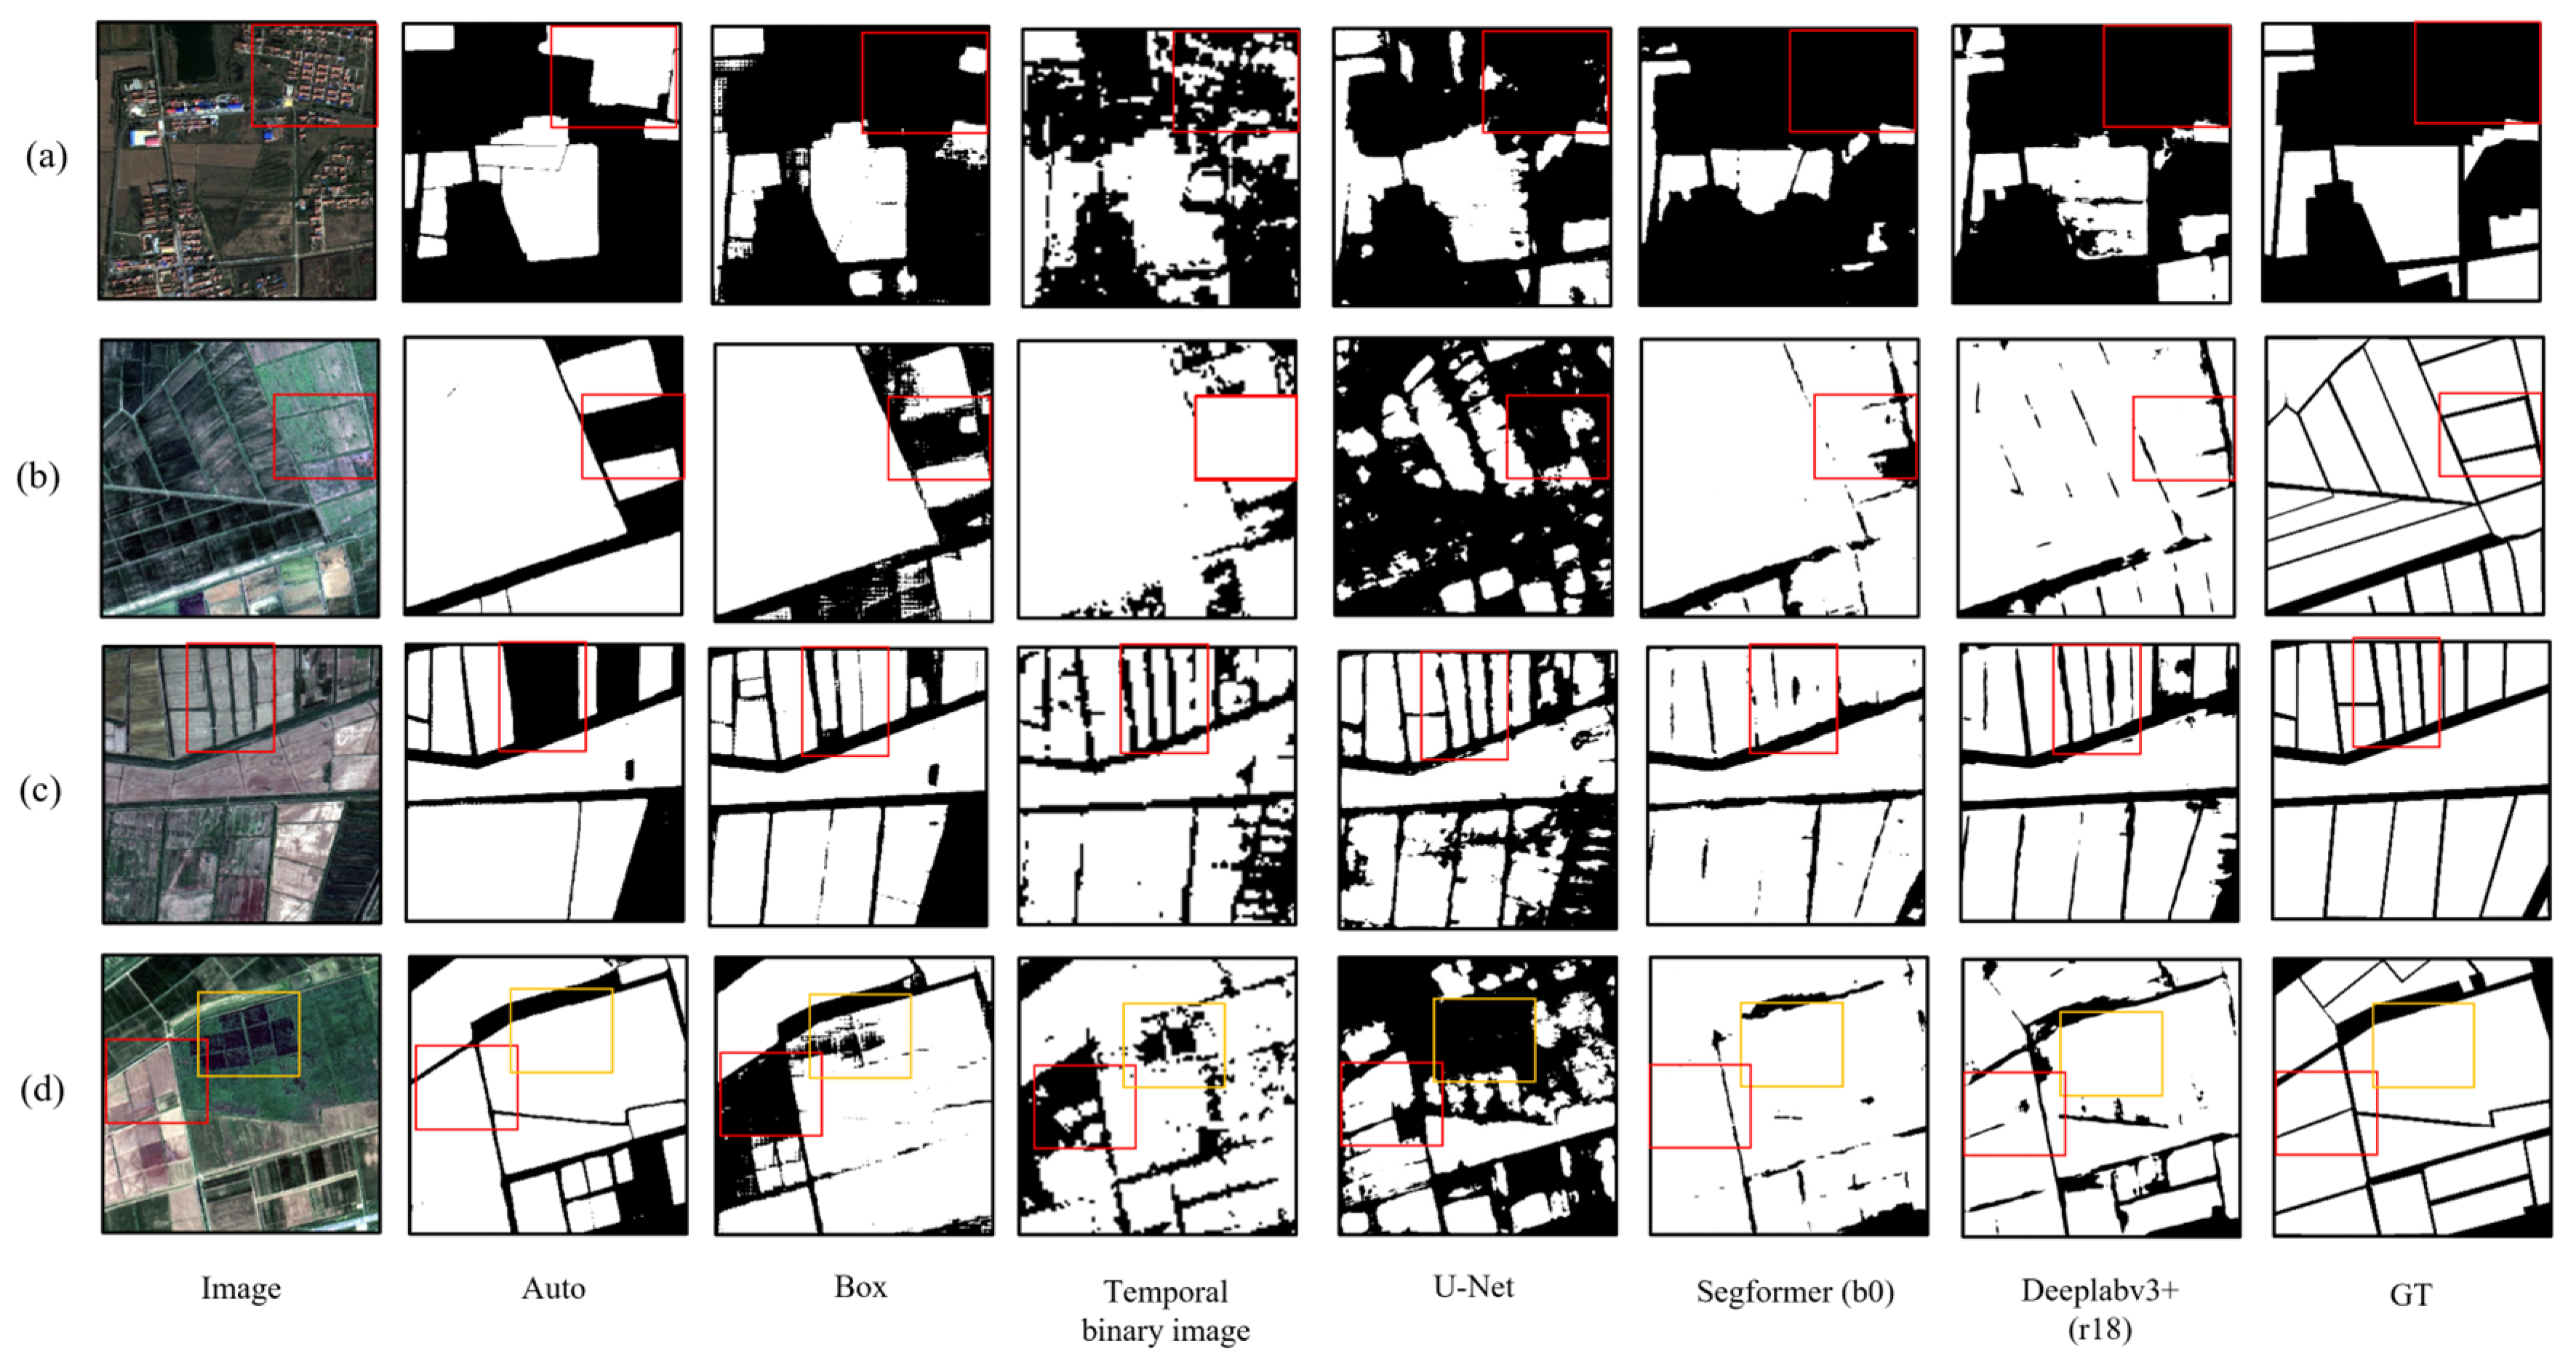
3.2. Comparison of Cropland Extraction Results

The comparative experiment results of the test set cropland extraction are shown in Table 2. The mIoU of the Auto module SAM is 0.679, while the OA is 0.81. The mIoU of the Box module SAM is 0.711, and the OA is 0.83. The performance of the latter model is slightly ahead of that of the former, with the mIoU leading by approximately 0.04, the OA leading by approximately 2%, and the difference in kappa coefficients reaching approximately 0.05. This suggests that the Box module SAM demonstrates higher stability in terms of pixel classification accuracy. Both the Auto module SAM and Box module SAM outperform U-Net in all indicators, with the mIoU, OA, and F1 score improved by more than 0.15, 0.1, and 0.1, respectively, compared to U-Net. Deeplabv3+ demonstrates similar performance to the Box module SAM, with a deviation of less than 0.01 for the mIoU and OA. Segformer has a slight lead over the Box module SAM in all indicators, with no discrepancy over 0.01. Despite the imperfectly accurate prompts, the Box module SAM shows comparable cropland segmentation accuracy to the small-parameter versions Deeplabv3+ and Segformer.
Figure 9 shows the results of cropland extraction by different models for the four test slices. The Auto module SAM predicts the highest mask quality, with smooth and intact unbroken boundaries, and the roads between the parcels can be effectively detected. However, in slice (a) and (b), disturbed by the misleading prompt generated from the binary image, incorrect prediction occurs in the red box area. In slice (c), the prediction of the red box area is still incorrect, even with the correct prompt. The Box module SAM’s anti-interference ability to prevent incorrect prompts is improved compared to that of the Auto module SAM, with only a small range of incorrect predictions in slice (a). However, in the red box and yellow box regions of slice (b) and (d), the Box module SAM predicts the mask with poor integrity under the misleading prompts, and misses some cropland. U-Net demonstrates instability in its performance when confronted with cropland plots of varying types, characterized by blurred boundaries. The extracted cropland exhibits deficiencies in completeness and accuracy. As Segformer and Deeplabv3+ do not rely on prompts, their predictions do not display evident errors in the red and yellow boxes. The ability of Deeplabv3+ to distinguish roads between cropland parcels is slightly better than that of Segformer. However, in some areas, the quality of the cropland masks that it extracts is poor, with internal holes and unsmooth edges. In general, the Box module SAM can achieve more stable and accurate cropland extraction results based on an existing prompt source with limited accuracy. The cropland extraction results of the study area are shown in Figure 10.

3.3. Ablation Experiment Results

The results of cropland extraction in the ablation experiment of the Box module SAM are presented in Table 3. Regardless of whether the box prompt or the point prompt is removed, the Box module SAM shows a significant drop in values across all aspects. Specifically, after removing the box prompt, the mIoU, OA and kappa of the model decline by 0.171, 0.119, and 0.256, respectively, compared to those of the original model. When the point prompt is removed, the mIoU, OA, and kappa of the model decrease by 0.076, 0.054, and 0.106, respectively, in comparison with the original model, and the range of decrease is slightly smaller than that of the module with the box prompt removed. Evidently, the box prompt plays a more crucial role in cropland extraction.
Models with a lack of prompts exhibit significant wrong predictions (see Figure 11). The cropland extracted by the model without point prompts is closer to that of the original model, and both models show similar problems when confronted with misleading prompts. In the colored box regions of different slices, the model without point prompts has missing cropland extraction, which is more evident in slice (b) and slice (d). The cropland masks extracted by the model without box prompts are fragmented, with significant errors.

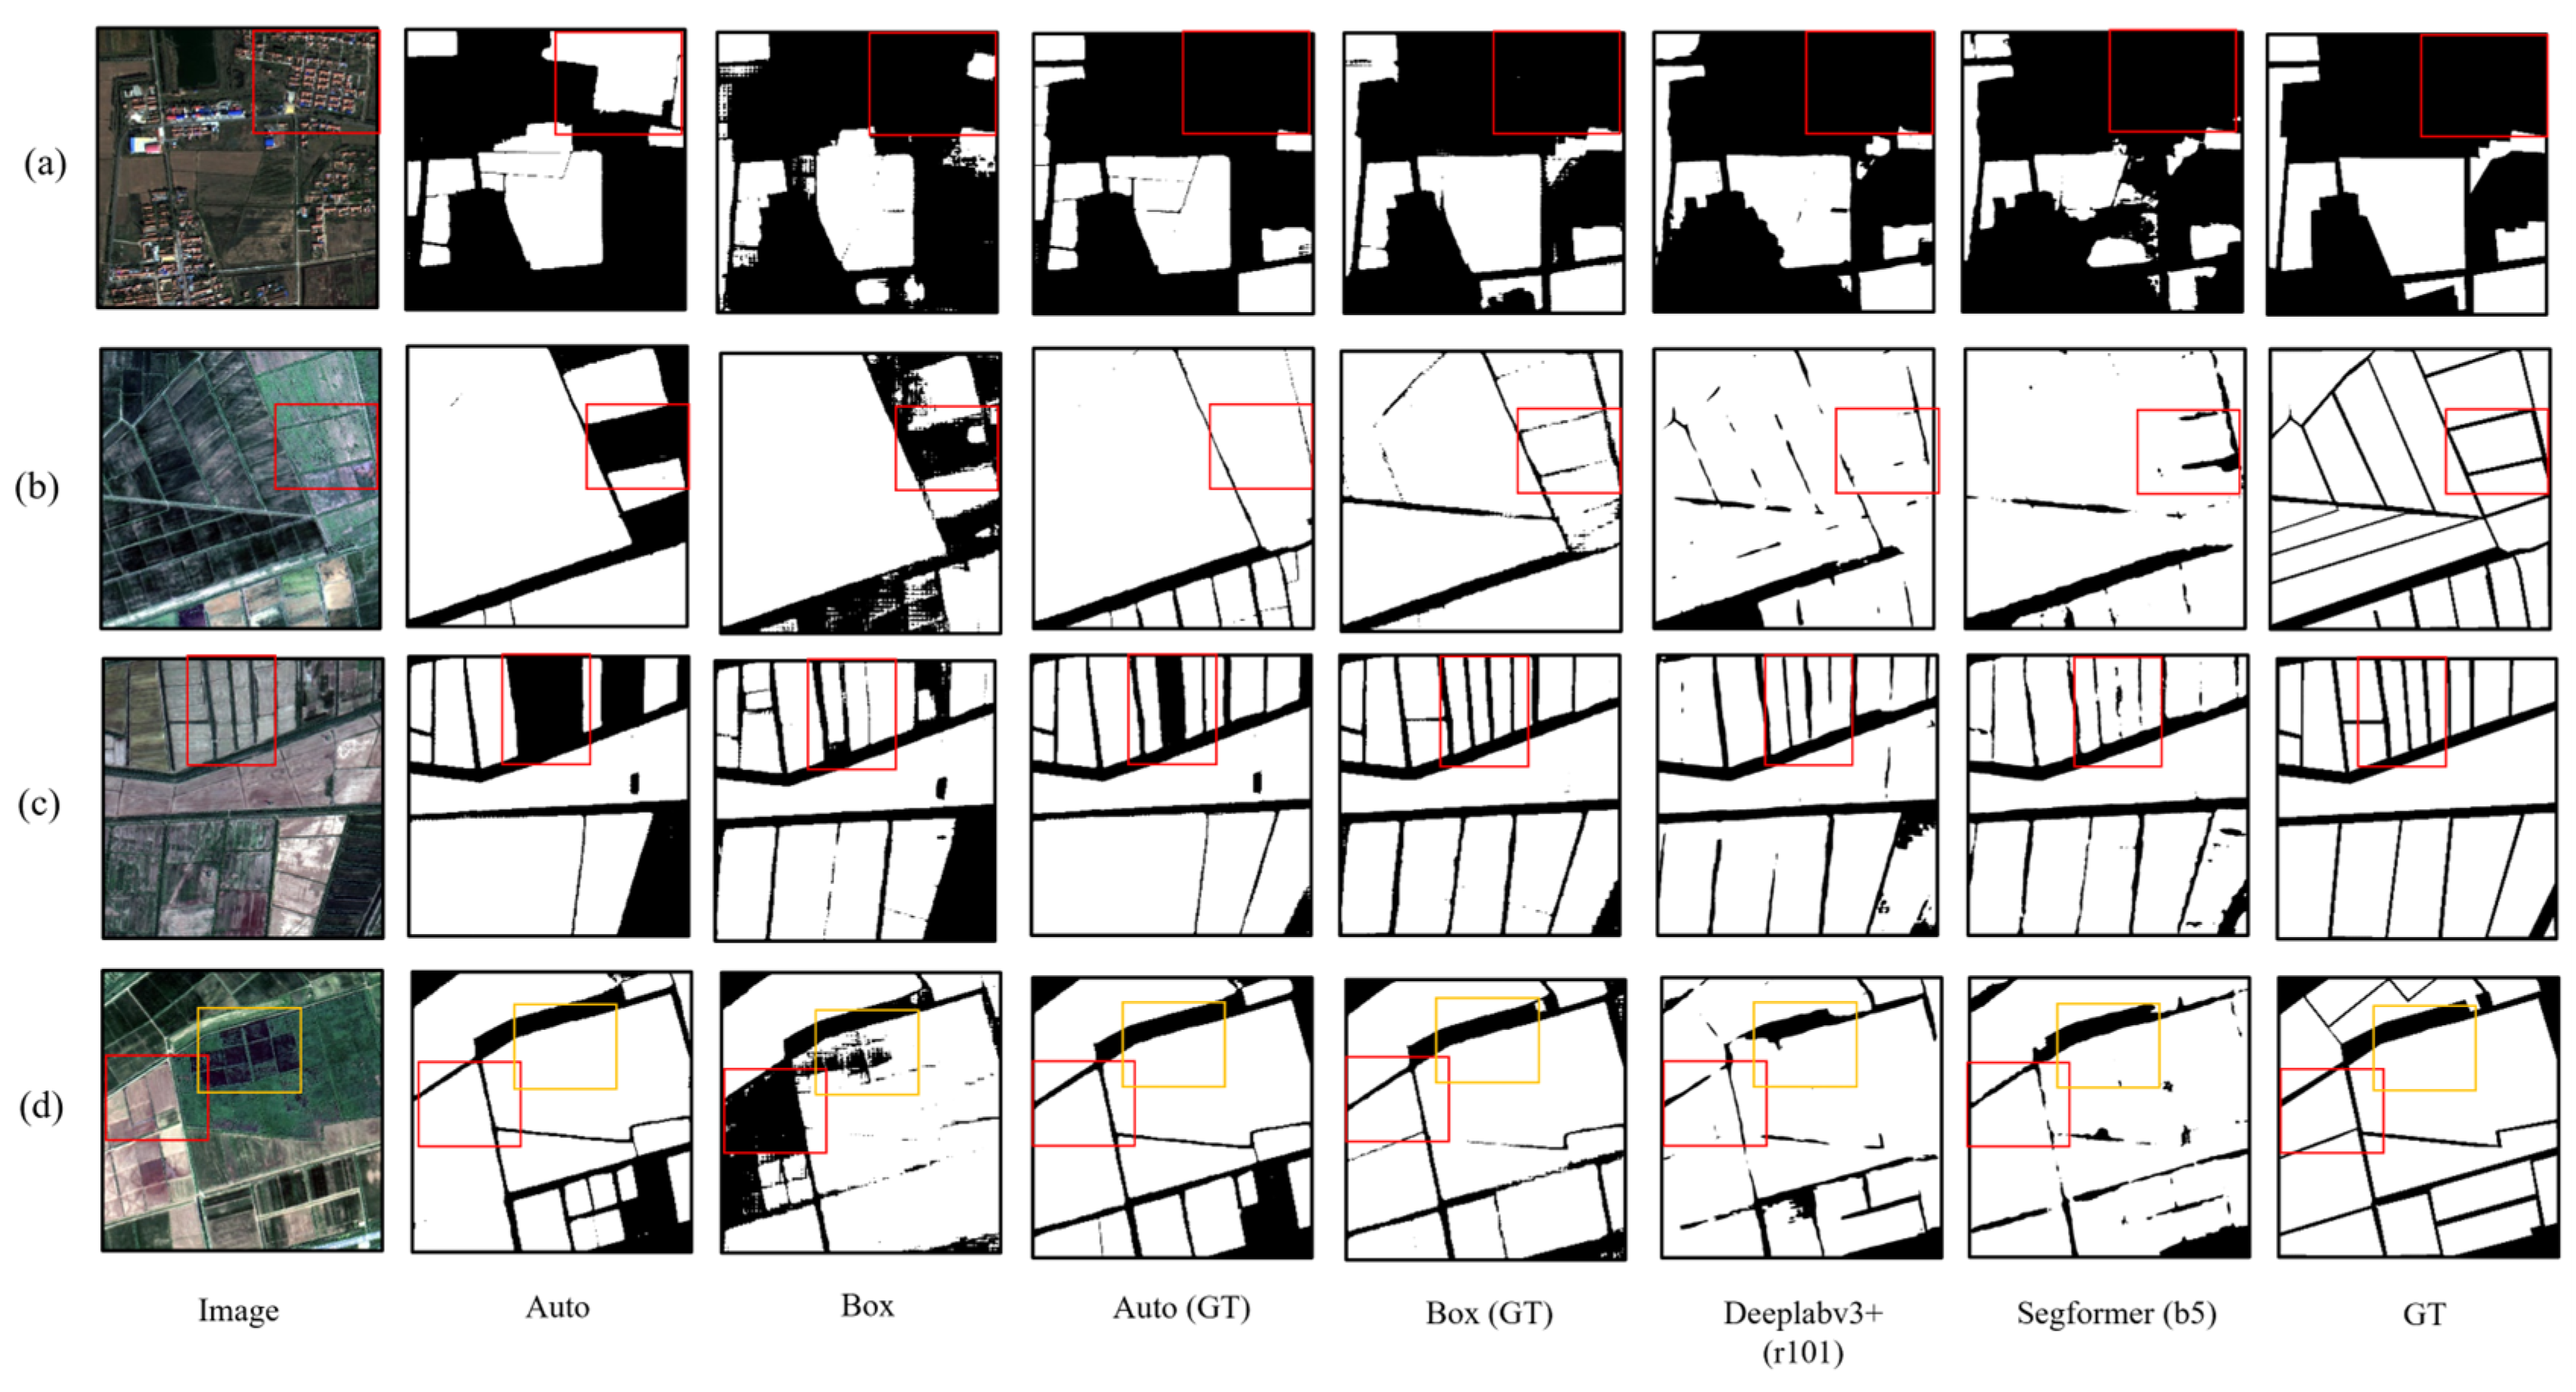
3.4. Improved SAM’s Best Performance

The accuracy of cropland extraction by the SAM and semantic segmentation models under different prompt data is shown in Table 4. After introducing the ground truth as the prompt data source, the Box module SAM achieved the greatest improvement in each index, exhibiting optimal performance. Its mIoU, OA, and kappa were 0.922, and 0.916, respectively, with improvements of 0.209, 0.127, and 0.254, respectively, compared to the original model (the model using prompts obtained from binary images). The mIoU and OA of the Auto module SAM showed an improvement of about 10% compared to the original model. The performance of both models exceeded that of large versions of Segformer and Deeplabv3+. The Box module SAM demonstrated superior performance, with an enhancement of approximately 0.15 in mIoU and around 0.1 in OA compared to Segformer and Deeplabv3+.
Both the Auto and Box module SAMs performed better than the original model when using ground truth as prompts, although the former still exhibited missing cropland prediction (see Figure 12 slice (a)). The quality and accuracy of the cropland mask extracted by the Box module SAM were significantly enhanced compared with those of the mask extracted by the original model. The capacity of Segformer and Deeplabv3+ to differentiate roads between cropland parcels lagged behind that of the SAMs.

4. Discussion

4.1. Advantages of Improved SAM

Current cropland extraction models using semantic segmentation rely on single-phase imagery and require finely annotated training data [21]. While recent research on SAM improvement has integrated deep learning modules to utilize its efficient encoder for end-to-end tasks, they remain constrained by the following: (1) dependence on large annotated datasets; and (2) costly data re-annotation and fine-tuning for new tasks [33]. In contrast, our improved SAM skips the laborious mask annotation and model training processes, and can be easily applied to other tasks. With the introduction of the prompt generation module, the SAM can effectively utilize the binary images from pixel classification of medium-resolution temporal images to automatically extract cropland from high-resolution images. The experiment on test slices demonstrates that the differences between the mIoU and OA of the Box module SAM and Deeplabv3+, as well as Segformer, are all within 1%.
In the visual comparison of cropland extraction, the Auto module SAM had an advantage in that the cropland masks it extracted featured high integrity without internal holes. Nevertheless, the model still exhibited erroneous or missing predictions for entire cropland parcels. In contrast, the Box module SAM demonstrated a more stable model performance. Both models share common strengths: good integrity of the extracted masks and a strong ability to distinguish roads between cropland parcels. Traditional instance segmentation models fail to effectively separate nearby objects when it comes to densely distributed cropland parcels [38]. The morphological operations on binary images in the prompt generation module strengthen the model’s capacity to tell apart different cropland parcels (see Figure 13); thus, the improved SAM, which adopts the instance superposition prediction method, extracts cropland parcels with high integrity and exhibits an excellent ability to distinguish roads.
Furthermore, the improved SAM reduces the time and computational expense associated with model training, and also avoids the problem of a decline in model performance caused by a difference in data distribution between the training set and the test set. The accuracy of cropland extraction is only related to the accuracy of the prompt data, and is independent of characteristics such as the type and texture of the cropland.
The primary limitations of Segformer and Deeplabv3+ are their inability to differentiate between roads and cropland, the incomplete delineation of extracted cropland parcels, and the presence of holes within cropland masks. These phenomena have also been observed in other research on semantic segmentation-based cropland extraction [39].
The underlying causes of these shortcomings can be attributed to two primary factors. Firstly, semantic segmentation models relying on single-phase, true-color image data demonstrate deficiencies in detecting blurred ground object boundaries [4], particularly for cropland exhibiting similar texture and spectral characteristics [40]. Secondly, the heterogeneity present within different cropland parcels, in conjunction with inconsistent data distribution between the training and test sets, results in small-parameter models failing to fully capture all sample features [40]. As a result, in regions with complex textures, the cropland masks extracted by these models may be fragmented and have holes. To address the issue of cropland parcel boundaries, additional boundary enhancement modules or a multi-task approach can effectively boost the quality of the extracted boundaries [24,41]; however, this will unavoidably hike up the computational cost.
In general, the SAM that integrates multi-source remote sensing images and is based on instance extraction can effectively address the issues of blurred parcel boundaries in remote sensing images and variations in cropland. However, its efficacy is subject to the accuracy of prompts generated from multi-temporal pixel classification.

4.2. Comparative Analysis of Box Module and Auto Module

The different processing procedures of the Box module and the Auto module lead to variances in model performance and the quality of cropland mask extraction. In the mask quality control step of the Auto module, even under correct prompts, some cropland parcels with relatively intricate textures received lower IoU scores and stability scores, and were ultimately wrongly removed, since they fell below the established score threshold. If a lower IoU score and stability score threshold are adopted to solve this issue, while the occurrence of missing cropland will be lessened, non-cropland objects will be wrongly extracted, and the model’s ability to distinguish roads between cropland parcels will be weakened. Meanwhile, raising the threshold will bring about the extraction of fewer non-cropland objects, but more cases of missing cropland (see Figure 14). Different images behave differently under various thresholds, so there is no one-size-fits-all optimal threshold. Furthermore, we conducted a sensitivity analysis by evaluating multiple threshold values and their impact on model performance using the mIoU metric (Table 5). The experimental results indicate that while the threshold selection influenced the Auto module’s segmentation accuracy, its effect was relatively minor compared to the variations observed in visual analysis.
The primary differences between the Box module SAM and the Auto module SAM are the quality control method and the final prediction strategy. Compared with the Auto module SAM’s quality control method based on threshold-based mask deletion in the final prediction phase, the Box module SAM selects contour objects according to their shape and size in the prompt generation phase. The results of the ablation experiment of the Box module indicate that extra prompts and a hierarchical extraction strategy significantly improve model performance. Through visual analysis, it was found that the cropland masks retrieved by the model lacking box prompts suffered from considerable defects in connectivity and integrity, and the model failed to accurately distinguish roads between cropland parcels. Thus, box prompts can delimit the prediction area and boost the quality of the prediction mask. Although the approach of limiting the prediction area cannot handle aggregated incorrect prompts perfectly, it can effectively shrink the scope of the wrongly predicted area (see Figure 9 slice (a)). When point prompts are absent, the model fails to extract cropland in regions with sparse prompts. Hence, point prompts can reinforce the stability of the model in such regions. When pixel classification accuracy is limited, the two SAM prompt modules each have their merits. The Auto module SAM can extract high-quality cropland masks, but has insufficient accuracy, while the Box module SAM presents higher accuracy in cropland extraction.
In the extreme-performance investigation of the model, after adopting a completely accurate prompt data source (ground truth annotation data), it was found that the performance of the two SAM prompt modules, along with the quality of the extracted cropland masks, significantly outperformed those of Deeplabv3+ and Segformer with the largest parameters. The accuracy improvement margin of the Auto module SAM was smaller than that of the Box module SAM. Moreover, in the visual analysis, there were still cases where the model failed to recognize the entire cropland parcel under the correct prompt. This further confirms the problem with threshold setting in the mask quality control step. Therefore, when the accuracy of the prompt data source is high, the Box module SAM has obvious advantages over the Auto module SAM, with higher quality and accuracy in cropland extraction.

4.3. Prospect

The improved SAM segmentation process proposed in this study is more concise than traditional semantic segmentation models, as it can spare the mask annotation and model training processes. In future designs, breakthroughs can be sought in the following aspects:
(1)
Increase the accuracy and reduce the variance of the prompt data source (temporal image pixel classification), without increasing the computational resources.
(2)
Optimize the extraction of cropland in large areas to address the boundary errors caused by block-based computing, and increase the computation efficiency.
(3)
Improve the stability of the prompt generation module so that it can effectively generate prompts and extract cropland, even when dealing with prompt data sources with certain bias and variance.

5. Conclusions

In this study, we combined the strengths of deep learning image interpretation and multi-temporal remote sensing analysis to make improvements to a basic image segmentation model, SAM. Two automatic prompt generation modules, the Box module and the Auto module, were proposed. Based on the GF-2 and Sentinel-2 images of Dongying District and Kenli District in Dongying City, Shandong Province, we created a cropland dataset for the study area, with annotated point samples from Sentinel-2 imagery and masks from GF-2 imagery, which were used for comparative model training and testing. The research conclusions are as follows:
(1)
For the Auto module SAM, the mIoU is 0.679 and the OA is 0.810. As for the Box module SAM, its mIoU is 0.711 and its OA is 0.831. The performance of the Box module SAM is on a par with that of the small-parameter versions of Segformer and Deeplabv3+. Through visual analysis, it was found that the two SAMs, equipped with the introduced prompt modules, can generate cropland masks of higher quality and effectively distinguish roads between cropland parcels. The performance of the Auto module SAM is slightly weaker than that of the Box module SAM, yet it can produce cropland masks of even higher quality. The accuracy of cropland extraction for both SAM modules is affected by the precision of the prompt source data.
(2)
The accuracy of cropland extraction via the Auto module SAM is influenced by both the prompt accuracy and the IoU threshold, as well as by the stability threshold during the mask quality control process. A higher threshold can reduce the extraction of non-cropland features, yet it will correspondingly increase the cases of missing cropland prediction. A lower threshold has the opposite effect. The results of the ablation test analysis indicate that, compared with the single-stage prediction approach, the accuracy of cropland extraction in the multi-stage prediction approach of the Box module SAM is significantly enhanced. While point prompts can compensate for missing predictions in areas with scarce prompts, box prompts can roughly define the prediction area and boost the quality of the prediction mask.
(3)
The utilization of ground truth annotations as the prompt data source has been proven to enhance the performance of the SAMs based on the two prompt modules, with their segmentation accuracy surpassing that of the largest-parameter versions of Segformer and Deeplabv3+. Specifically, the mIoU of the Box module SAM is 0.920, and the OA is 0.958.
The improved SAM can effectively leverage high-resolution images and temporal image data, and achieve precise cropland extraction. In addition, the automatic prompt generation module simplifies the extraction by saving labor for annotation and costs for computational resources, compared to the mask annotation and model training in semantic segmentation models. Future research can focus on improving computational efficiency and also enhancing the model’s stability when handling local anomalies in the prompt data source.

Author Contributions

K.T.: methodology, writing—original draft preparation, writing—review and editing. H.L.: conceptualization, writing—review and editing. C.H.: project administration, supervision. Q.L.: resources, writing—review and editing. J.Z.: data curation, writing—review and editing. R.D.: resources, writing—review and editing. All authors have read and agreed to the published version of the manuscript.

Funding

This research was funded by the National Key R&D Program of China (Grant No. 2023YFD1900300&2023YFD1900100), and the Key and Youth Project of Innovation LREIS (KPI001&YPI004).

Data Availability Statement

The dataset is available on request from the authors.

Conflicts of Interest

The authors declare no conflicts of interest.

References

  1. See, L.; Fritz, S.; You, L.; Ramankutty, N.; Herrero, M.; Justice, C.; Becker-Reshef, I.; Thornton, P.; Erb, K.; Gong, P.; et al. Improved Global Cropland Data as an Essential Ingredient for Food Security. Glob. Food Secur. 2015, 4, 37–45. [Google Scholar] [CrossRef]
  2. Valjarević, A.; Morar, C.; Brasanac-Bosanac, L.; Cirkovic-Mitrovic, T.; Djekic, T.; Mihajlović, M.; Milevski, I.; Culafic, G.; Luković, M.; Niemets, L.; et al. Sustainable Land Use in Moldova: GIS & Remote Sensing of Forests and Crops. Land Use Policy 2025, 152, 107515. [Google Scholar] [CrossRef]
  3. Yan, L.; Roy, D.P. Conterminous United States Crop Field Size Quantification from Multi-Temporal Landsat Data. Remote Sens. Environ. 2016, 172, 67–86. [Google Scholar] [CrossRef]
  4. Persello, C.; Tolpekin, V.A.; Bergado, J.R.; de By, R.A. Delineation of Agricultural Fields in Smallholder Farms from Satellite Images Using Fully Convolutional Networks and Combinatorial Grouping. Remote Sens. Environ. 2019, 231, 111253. [Google Scholar] [CrossRef]
  5. Xu, L.; Yang, P.; Yu, J.; Peng, F.; Xu, J.; Song, S.; Wu, Y. Extraction of Cropland Field Parcels with High Resolution Remote Sensing Using Multi-Task Learning. Eur. J. Remote Sens. 2023, 56, 2181874. [Google Scholar] [CrossRef]
  6. Rydberg, A.; Borgefors, G. Integrated Method for Boundary Delineation of Agricultural Fields in Multispectral Satellite Images. IEEE Trans. Geosci. Remote Sens. 2001, 39, 2514–2520. [Google Scholar] [CrossRef]
  7. Zhong, L.; Hu, L.; Zhou, H. Deep Learning Based Multi-Temporal Crop Classification. Remote Sens. Environ. 2019, 221, 430–443. [Google Scholar] [CrossRef]
  8. Xia, J.; Ghamisi, P.; Yokoya, N.; Iwasaki, A. Random Forest Ensembles and Extended Multiextinction Profiles for Hyperspectral Image Classification. IEEE Trans. Geosci. Remote Sens. 2018, 56, 202–216. [Google Scholar] [CrossRef]
  9. Yoon, H.; Kim, S. Detecting Abandoned Farmland Using Harmonic Analysis and Machine Learning. ISPRS J. Photogramm. Remote Sens. 2020, 166, 201–212. [Google Scholar] [CrossRef]
  10. Wang, X.; Shu, L.; Han, R.; Yang, F.; Gordon, T.; Wang, X.; Xu, H. A Survey of Farmland Boundary Extraction Technology Based on Remote Sensing Images. Electronics 2023, 12, 1156. [Google Scholar] [CrossRef]
  11. Xu, L.; Ming, D.; Du, T.; Chen, Y.; Dong, D.; Zhou, C. Delineation of Cultivated Land Parcels Based on Deep Convolutional Networks and Geographical Thematic Scene Division of Remotely Sensed Images. Comput. Electron. Agric. 2022, 192, 106611. [Google Scholar] [CrossRef]
  12. Lecun, Y.; Bottou, L.; Bengio, Y.; Haffner, P. Gradient-Based Learning Applied to Document Recognition. Proc. IEEE 1998, 86, 2278–2324. [Google Scholar] [CrossRef]
  13. Cao, X.; Zhou, F.; Xu, L.; Meng, D.; Xu, Z.; Paisley, J. Hyperspectral Image Classification With Markov Random Fields and a Convolutional Neural Network. IEEE Trans. Image Process. 2018, 27, 2354–2367. [Google Scholar] [CrossRef]
  14. Jeon, M.; Jeong, Y.-S. Compact and Accurate Scene Text Detector. Appl. Sci. 2020, 10, 2096. [Google Scholar] [CrossRef]
  15. Long, J.; Shelhamer, E.; Darrell, T. Fully Convolutional Networks for Semantic Segmentation. arXiv 2015, arXiv:1411.4038. [Google Scholar]
  16. Ronneberger, O.; Fischer, P.; Brox, T. U-Net: Convolutional Networks for Biomedical Image Segmentation. In Proceedings of the Medical Image Computing and Computer-Assisted Intervention—MICCAI 2015, Munich, Germany, 5–9 October 2015; Navab, N., Hornegger, J., Wells, W.M., Frangi, A.F., Eds.; Springer International Publishing: Cham, Switzerland, 2015; pp. 234–241. [Google Scholar]
  17. Chen, L.-C.; Zhu, Y.; Papandreou, G.; Schroff, F.; Adam, H. Encoder-Decoder with Atrous Separable Convolution for Semantic Image Segmentation. In Proceedings of the Computer Vision—ECCV 2018, Munich, Germany, 8–14 September 2018; Ferrari, V., Hebert, M., Sminchisescu, C., Weiss, Y., Eds.; Springer International Publishing: Cham, Switzerland, 2018; pp. 833–851. [Google Scholar]
  18. Zhao, H.; Shi, J.; Qi, X.; Wang, X.; Jia, J. Pyramid Scene Parsing Network. In Proceedings of the 2017 IEEE Conference on Computer Vision and Pattern Recognition (CVPR), Honolulu, HI, USA, 21–26 July 2017; pp. 6230–6239. [Google Scholar]
  19. Jadhav, J.K.; Singh, R.P. Automatic Semantic Segmentation and Classification of Remote Sensing Data for Agriculture. Math. Models Eng. 2018, 4, 112–137. [Google Scholar] [CrossRef]
  20. Masoud, K.M.; Persello, C.; Tolpekin, V.A. Delineation of Agricultural Field Boundaries from Sentinel-2 Images Using a Novel Super-Resolution Contour Detector Based on Fully Convolutional Networks. Remote Sens. 2020, 12, 59. [Google Scholar] [CrossRef]
  21. Du, Z.; Yang, J.; Ou, C.; Zhang, T. Smallholder Crop Area Mapped with a Semantic Segmentation Deep Learning Method. Remote Sens. 2019, 11, 888. [Google Scholar] [CrossRef]
  22. Rußwurm, M.; Körner, M. Self-Attention for Raw Optical Satellite Time Series Classification. ISPRS J. Photogramm. Remote Sens. 2020, 169, 421–435. [Google Scholar] [CrossRef]
  23. Kiranyaz, S.; Avci, O.; Abdeljaber, O.; Ince, T.; Gabbouj, M.; Inman, D.J. 1D Convolutional Neural Networks and Applications: A Survey. Mech. Syst. Signal Process. 2021, 151, 107398. [Google Scholar] [CrossRef]
  24. Cai, Z.; Hu, Q.; Zhang, X.; Yang, J.; Wei, H.; Wang, J.; Zeng, Y.; Yin, G.; Li, W.; You, L.; et al. Improving Agricultural Field Parcel Delineation with a Dual Branch Spatiotemporal Fusion Network by Integrating Multimodal Satellite Data. ISPRS J. Photogramm. Remote Sens. 2023, 205, 34–49. [Google Scholar] [CrossRef]
  25. Hu, Y.; Hu, Q.; Li, J. CMINet: A Unified Cross-Modal Integration Framework for Crop Classification From Satellite Image Time Series. IEEE Trans. Geosci. Remote Sens. 2025, 63, 4402213. [Google Scholar] [CrossRef]
  26. Cui, B.; Yang, Q.; Yang, Z.; Zhang, K. Evaluating the Ecological Performance of Wetland Restoration in the Yellow River Delta, China. Ecol. Eng. 2009, 35, 1090–1103. [Google Scholar] [CrossRef]
  27. Sun, Y.; Chen, X.; Luo, Y.; Cao, D.; Feng, H.; Zhang, X.; Yao, R. Agricultural Water Quality Assessment and Application in the Yellow River Delta. Agronomy 2023, 13, 1495. [Google Scholar] [CrossRef]
  28. Ren, K.; Sun, W.; Meng, X.; Yang, G.; Du, Q. Fusing China GF-5 Hyperspectral Data with GF-1, GF-2 and Sentinel-2A Multispectral Data: Which Methods Should Be Used? Remote Sens. 2020, 12, 882. [Google Scholar] [CrossRef]
  29. Breiman, L. Random Forests. Mach. Learn. 2001, 45, 5–32. [Google Scholar] [CrossRef]
  30. Chen, T.; Guestrin, C. XGBoost: A Scalable Tree Boosting System. In Proceedings of the 22nd ACM SIGKDD International Conference on Knowledge Discovery and Data Mining, San Francisco, CA, USA, 13–17 August 2016; Association for Computing Machinery: New York, NY, USA, 2016; pp. 785–794. [Google Scholar]
  31. Taunk, K.; De, S.; Verma, S.; Swetapadma, A. A Brief Review of Nearest Neighbor Algorithm for Learning and Classification. In Proceedings of the 2019 International Conference on Intelligent Computing and Control Systems (ICCS), Madurai, India, 15–17 May 2019; pp. 1255–1260. [Google Scholar]
  32. Kirillov, A.; Mintun, E.; Ravi, N.; Mao, H.; Rolland, C.; Gustafson, L.; Xiao, T.; Whitehead, S.; Berg, A.C.; Lo, W.-Y.; et al. Segment Anything. arXiv 2023, arXiv:2304.02643. [Google Scholar]
  33. Chen, K.; Liu, C.; Chen, H.; Zhang, H.; Li, W.; Zou, Z.; Shi, Z. RSPrompter: Learning to Prompt for Remote Sensing Instance Segmentation Based on Visual Foundation Model. IEEE Trans. Geosci. Remote Sens. 2024, 62, 4701117. [Google Scholar] [CrossRef]
  34. Canny, J. A Computational Approach to Edge Detection. IEEE Trans. Pattern Anal. Mach. Intell. 1986, PAMI-8, 679–698. [Google Scholar] [CrossRef]
  35. Xie, E.; Wang, W.; Yu, Z.; Anandkumar, A.; Alvarez, J.M.; Luo, P. SegFormer: Simple and Efficient Design for Semantic Segmentation with Transformers. arXiv 2021, arXiv:2105.15203. [Google Scholar]
  36. Dosovitskiy, A.; Beyer, L.; Kolesnikov, A.; Weissenborn, D.; Zhai, X.; Unterthiner, T.; Dehghani, M.; Minderer, M.; Heigold, G.; Gelly, S.; et al. An Image Is Worth 16 × 16 Words: Transformers for Image Recognition at Scale. arXiv 2021, arXiv:2010.11929. [Google Scholar]
  37. Loshchilov, I.; Hutter, F. Decoupled Weight Decay Regularization. arXiv 2019, arXiv:1711.05101. [Google Scholar]
  38. Ma, A.; Chen, D.; Zhong, Y.; Zheng, Z.; Zhang, L. National-Scale Greenhouse Mapping for High Spatial Resolution Remote Sensing Imagery Using a Dense Object Dual-Task Deep Learning Framework: A Case Study of China. ISPRS J. Photogramm. Remote Sens. 2021, 181, 279–294. [Google Scholar] [CrossRef]
  39. Li, Z.; Chen, S.; Meng, X.; Zhu, R.; Lu, J.; Cao, L.; Lu, P. Full Convolution Neural Network Combined with Contextual Feature Representation for Cropland Extraction from High-Resolution Remote Sensing Images. Remote Sens. 2022, 14, 2157. [Google Scholar] [CrossRef]
  40. Mei, W.; Wang, H.; Fouhey, D.; Zhou, W.; Hinks, I.; Gray, J.M.; Van Berkel, D.; Jain, M. Using Deep Learning and Very-High-Resolution Imagery to Map Smallholder Field Boundaries. Remote Sens. 2022, 14, 3046. [Google Scholar] [CrossRef]
  41. Lu, R.; Zhang, Y.; Huang, Q.; Zeng, P.; Shi, Z.; Ye, S. A Refined Edge-Aware Convolutional Neural Networks for Agricultural Parcel Delineation. Int. J. Appl. Earth Obs. Geoinf. 2024, 133, 104084. [Google Scholar] [CrossRef]
Figure 1. The distribution of the study area (the background of the study area is GF-2 imagery, and the colored points represent the point sample annotations of Sentinel-2 time series images).
Agronomy 15 01139 g001
Figure 2. Remote sensing image label and original image.
Agronomy 15 01139 g002
Figure 3. Flowchart of extracting cropland parcels based on adapted SAM.
Agronomy 15 01139 g003
Figure 4. The architecture of the SAM.
Agronomy 15 01139 g004
Figure 5. Flowchart of Auto Prompt Generation Module.
Agronomy 15 01139 g005
Figure 6. Flowchart of Box Prompt Generation Module.
Agronomy 15 01139 g006
Figure 7. Comparison of edge extraction methods (the left is four-neighborhood edge extraction, and the right is the Canny edge extraction operator. The yellow pixel field value is 1, which is the edge pixel, and the black pixel field value is 0, which is the non-edge pixel.).
Agronomy 15 01139 g007
Figure 8. Preliminary pixel classification of cropland from RF.
Agronomy 15 01139 g008
Figure 9. Comparison of the cropland extraction results of different models for the test slices (the temporal binary images reflect the accuracy of the generated prompts, and GT represents ground truth labels). (ad) show the cropland extraction results of four test slices, the white region represents “cropland” while the black represents “background”.
Agronomy 15 01139 g009
Figure 10. The Box module SAM cropland extraction results. (a) presents the extracted cropland parcel in the study area. (b,c) show spatial details of the extracted cropland parcel.
Agronomy 15 01139 g010
Figure 11. Comparison of the cropland extraction results of different models in the ablation experiment. (ad) show the cropland extraction results of four test slices.
Agronomy 15 01139 g011
Figure 12. Comparison of the cropland extraction results of models under different prompts. (ad) show the cropland extraction results of four test slices.
Agronomy 15 01139 g012
Figure 13. The influence of morphological operations on the Box module SAM’s cropland extraction (the left figure does not use morphological operations; the right figure uses two erosion operations and one dilation operation, in turn).
Agronomy 15 01139 g013
Figure 14. The cropland extraction results of the Auto module SAM with different thresholds (the IoU and stability thresholds of the model in the left figure are 0.84 and 0.88, respectively, and those of the model in the right figure are 0.82 and 0.86, respectively).
Agronomy 15 01139 g014
Table 1. Evaluation results of cropland pixel classification with different models.
Test Set OACross-Validation OATest Set OA
LSTM0.947-
RF0.9690.912
XGBoost0.9500.908
KNN0.9350.898
Table 2. Evaluation results of cropland extracted by different models.
mIoUOAF1 (Cropland)F1 (Background)Kappa
Auto0.6790.8100.8240.7940.618
Box0.7110.8310.8390.8230.662
U-Net0.5160.6800.7040.6270.335
Deeplabv3+ (r18)0.7080.8300.8470.8110.659
Segformer (b0)0.7160.8350.8390.8290.669
Table 3. Evaluation results of cropland extracted by different models in the ablation experiment.
mIoUOAF1 (Cropland)F1 (Background)Kappa
Box0.7110.8310.8390.8230.662
Box (point, mask)0.5400.7120.7620.6340.416
Box (box, mask)0.6350.7770.7690.7850.556
Table 4. Evaluation results of cropland extracted by models under different prompts.
mIoUOAF1 (Cropland)F1 (Background)Kappa
Auto0.6790.8100.8240.7940.618
Box0.7110.8310.8390.8230.662
Deeplabv3 (r101)0.7650.8670.8780.8550.734
Segformer (b5)0.7530.8600.8640.8550.719
Auto (GT)0.8150.8980.9030.8930.796
Box (GT)0.9200.9580.9590.9570.916
Table 5. Evaluation results of the mIoU of cropland extracted by the Auto module SAM under different threshold groups. (Stability and IoU stand for the stability score threshold and the IoU threshold, respectively).
Stability0.860.880.90
IoU
0.80.6850.6750.680
0.820.6850.6790.675
0.840.6800.6680.676
Disclaimer/Publisher’s Note: The statements, opinions and data contained in all publications are solely those of the individual author(s) and contributor(s) and not of MDPI and/or the editor(s). MDPI and/or the editor(s) disclaim responsibility for any injury to people or property resulting from any ideas, methods, instructions or products referred to in the content.

