Two-Level Distributed Multi-Source Information Fusion Model for Aphid Monitoring and Forecasting in the Greenhouse

 ,
,
Abstract
1. Introduction
- (1)
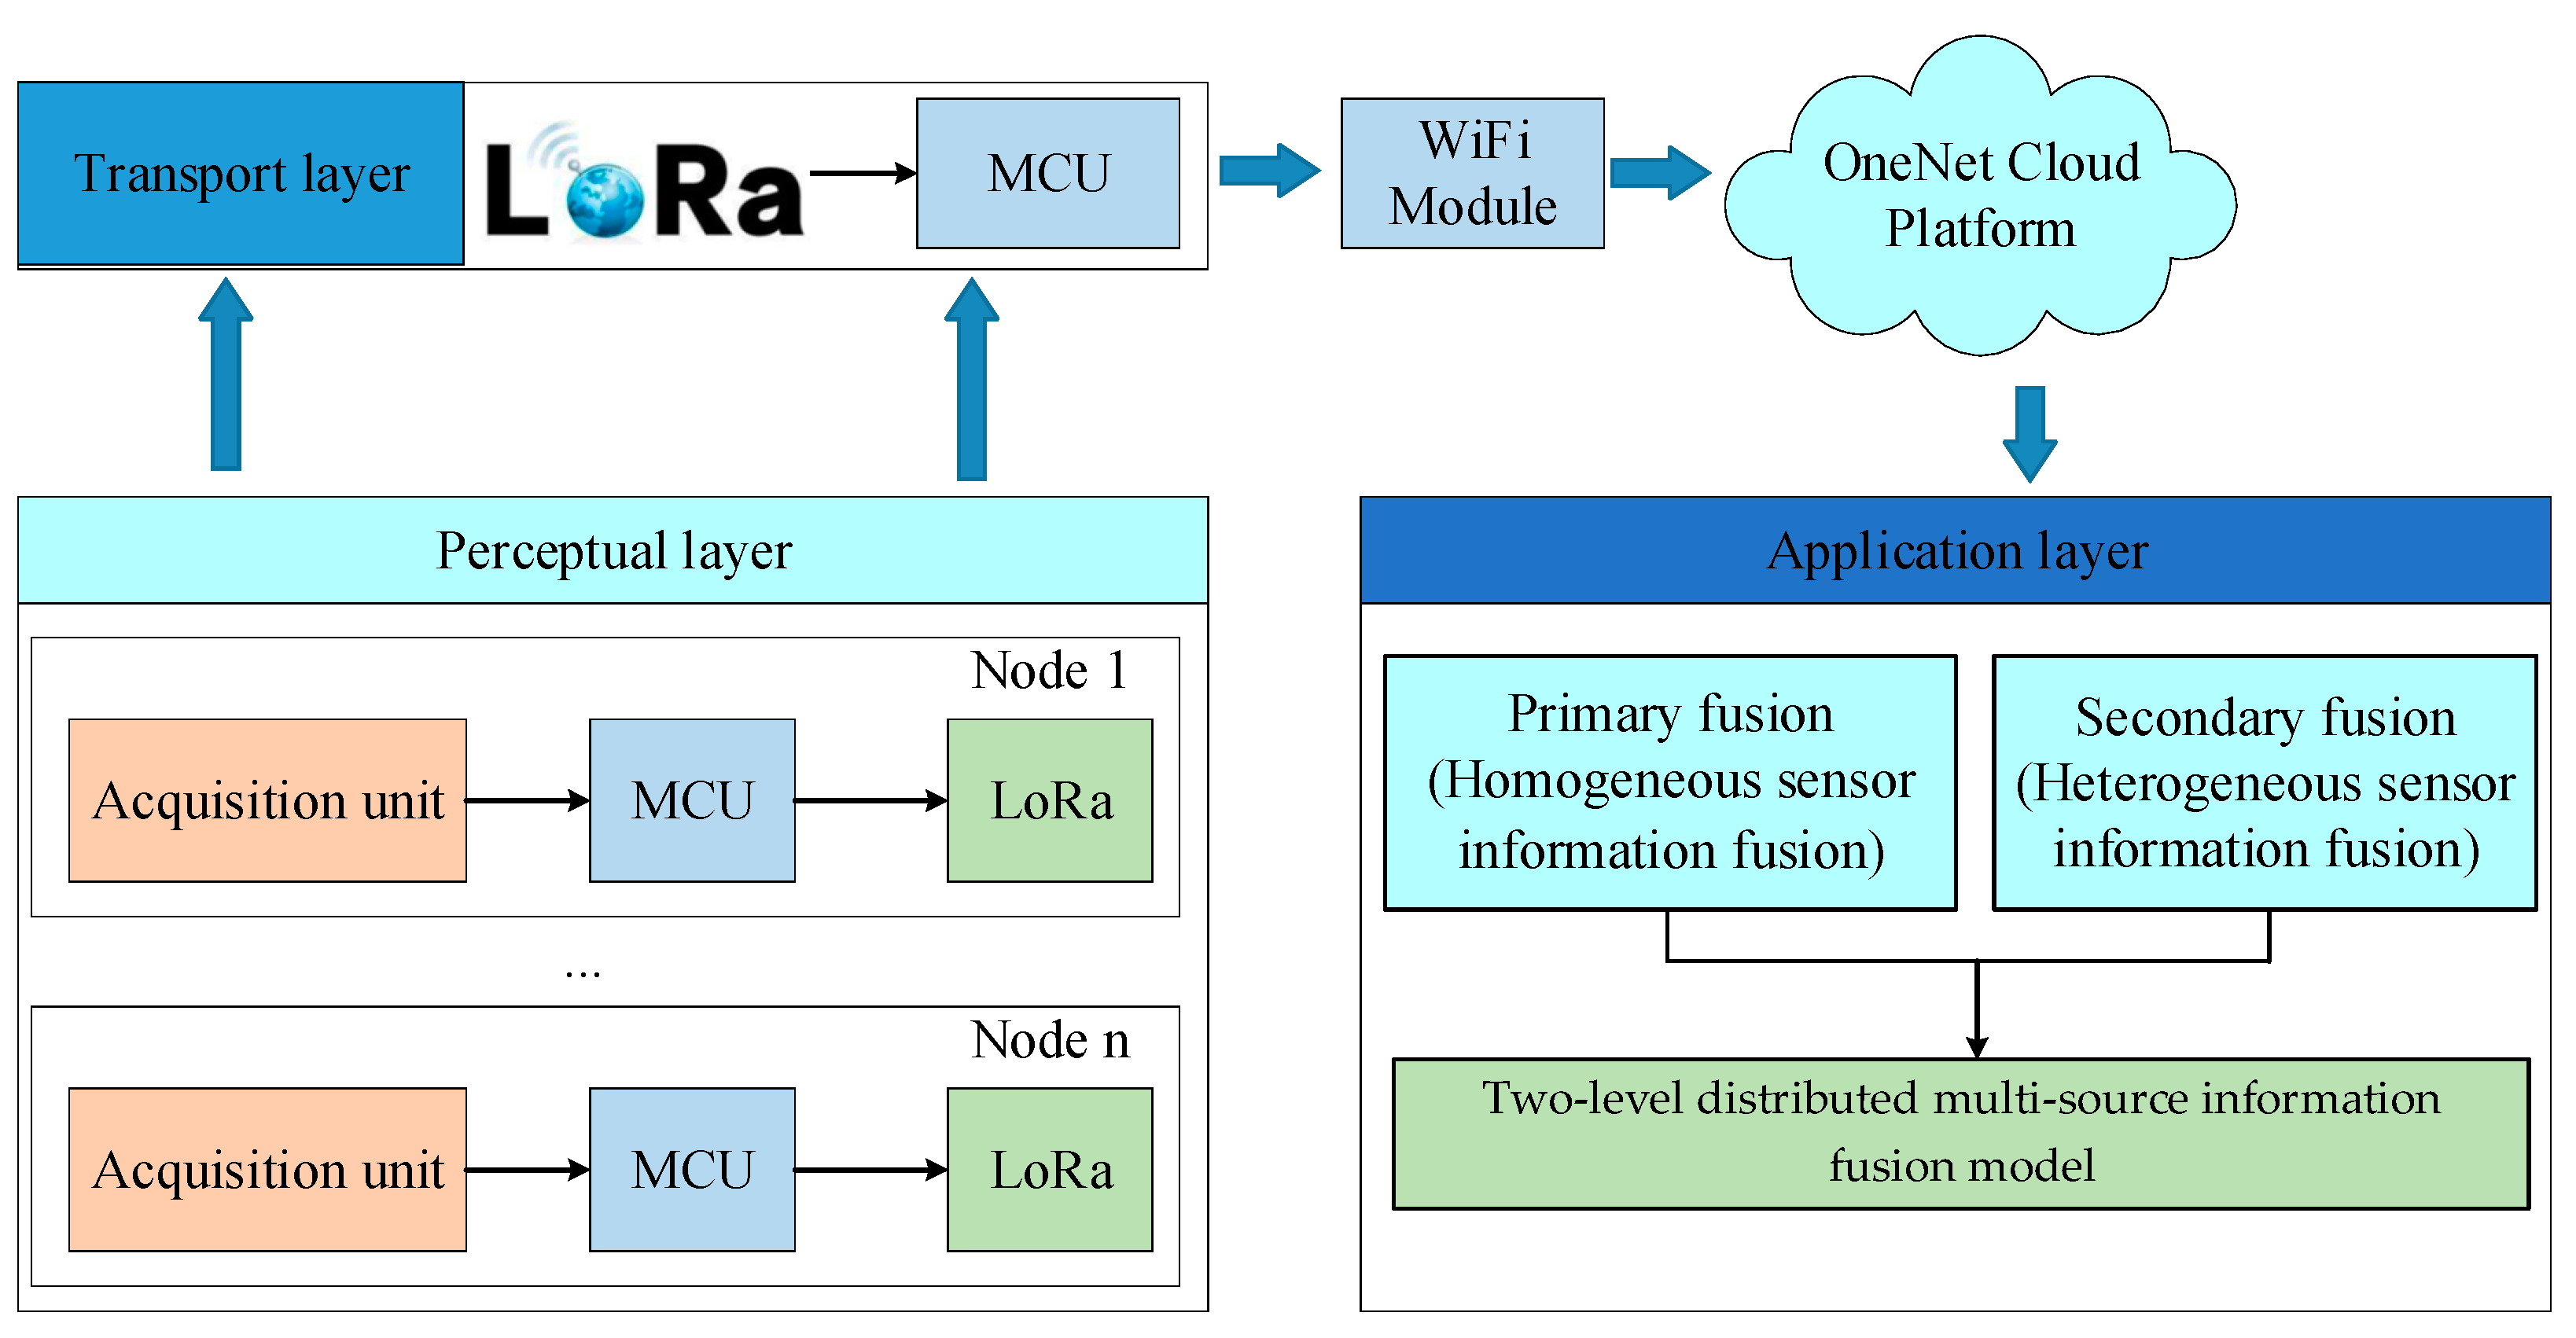
- We propose a two-level distributed multi-source information fusion framework that combines the 1D CNN with LSTM. To enhance the accuracy of regional environmental parameters, a weighted average algorithm employs environmental sensor data in the first level of fusion. The second fusion level, a heterogeneous sensor fusion algorithm, allows for the integration of multi-source data to model the connection between environmental factors and aphid dynamics.
- (2)
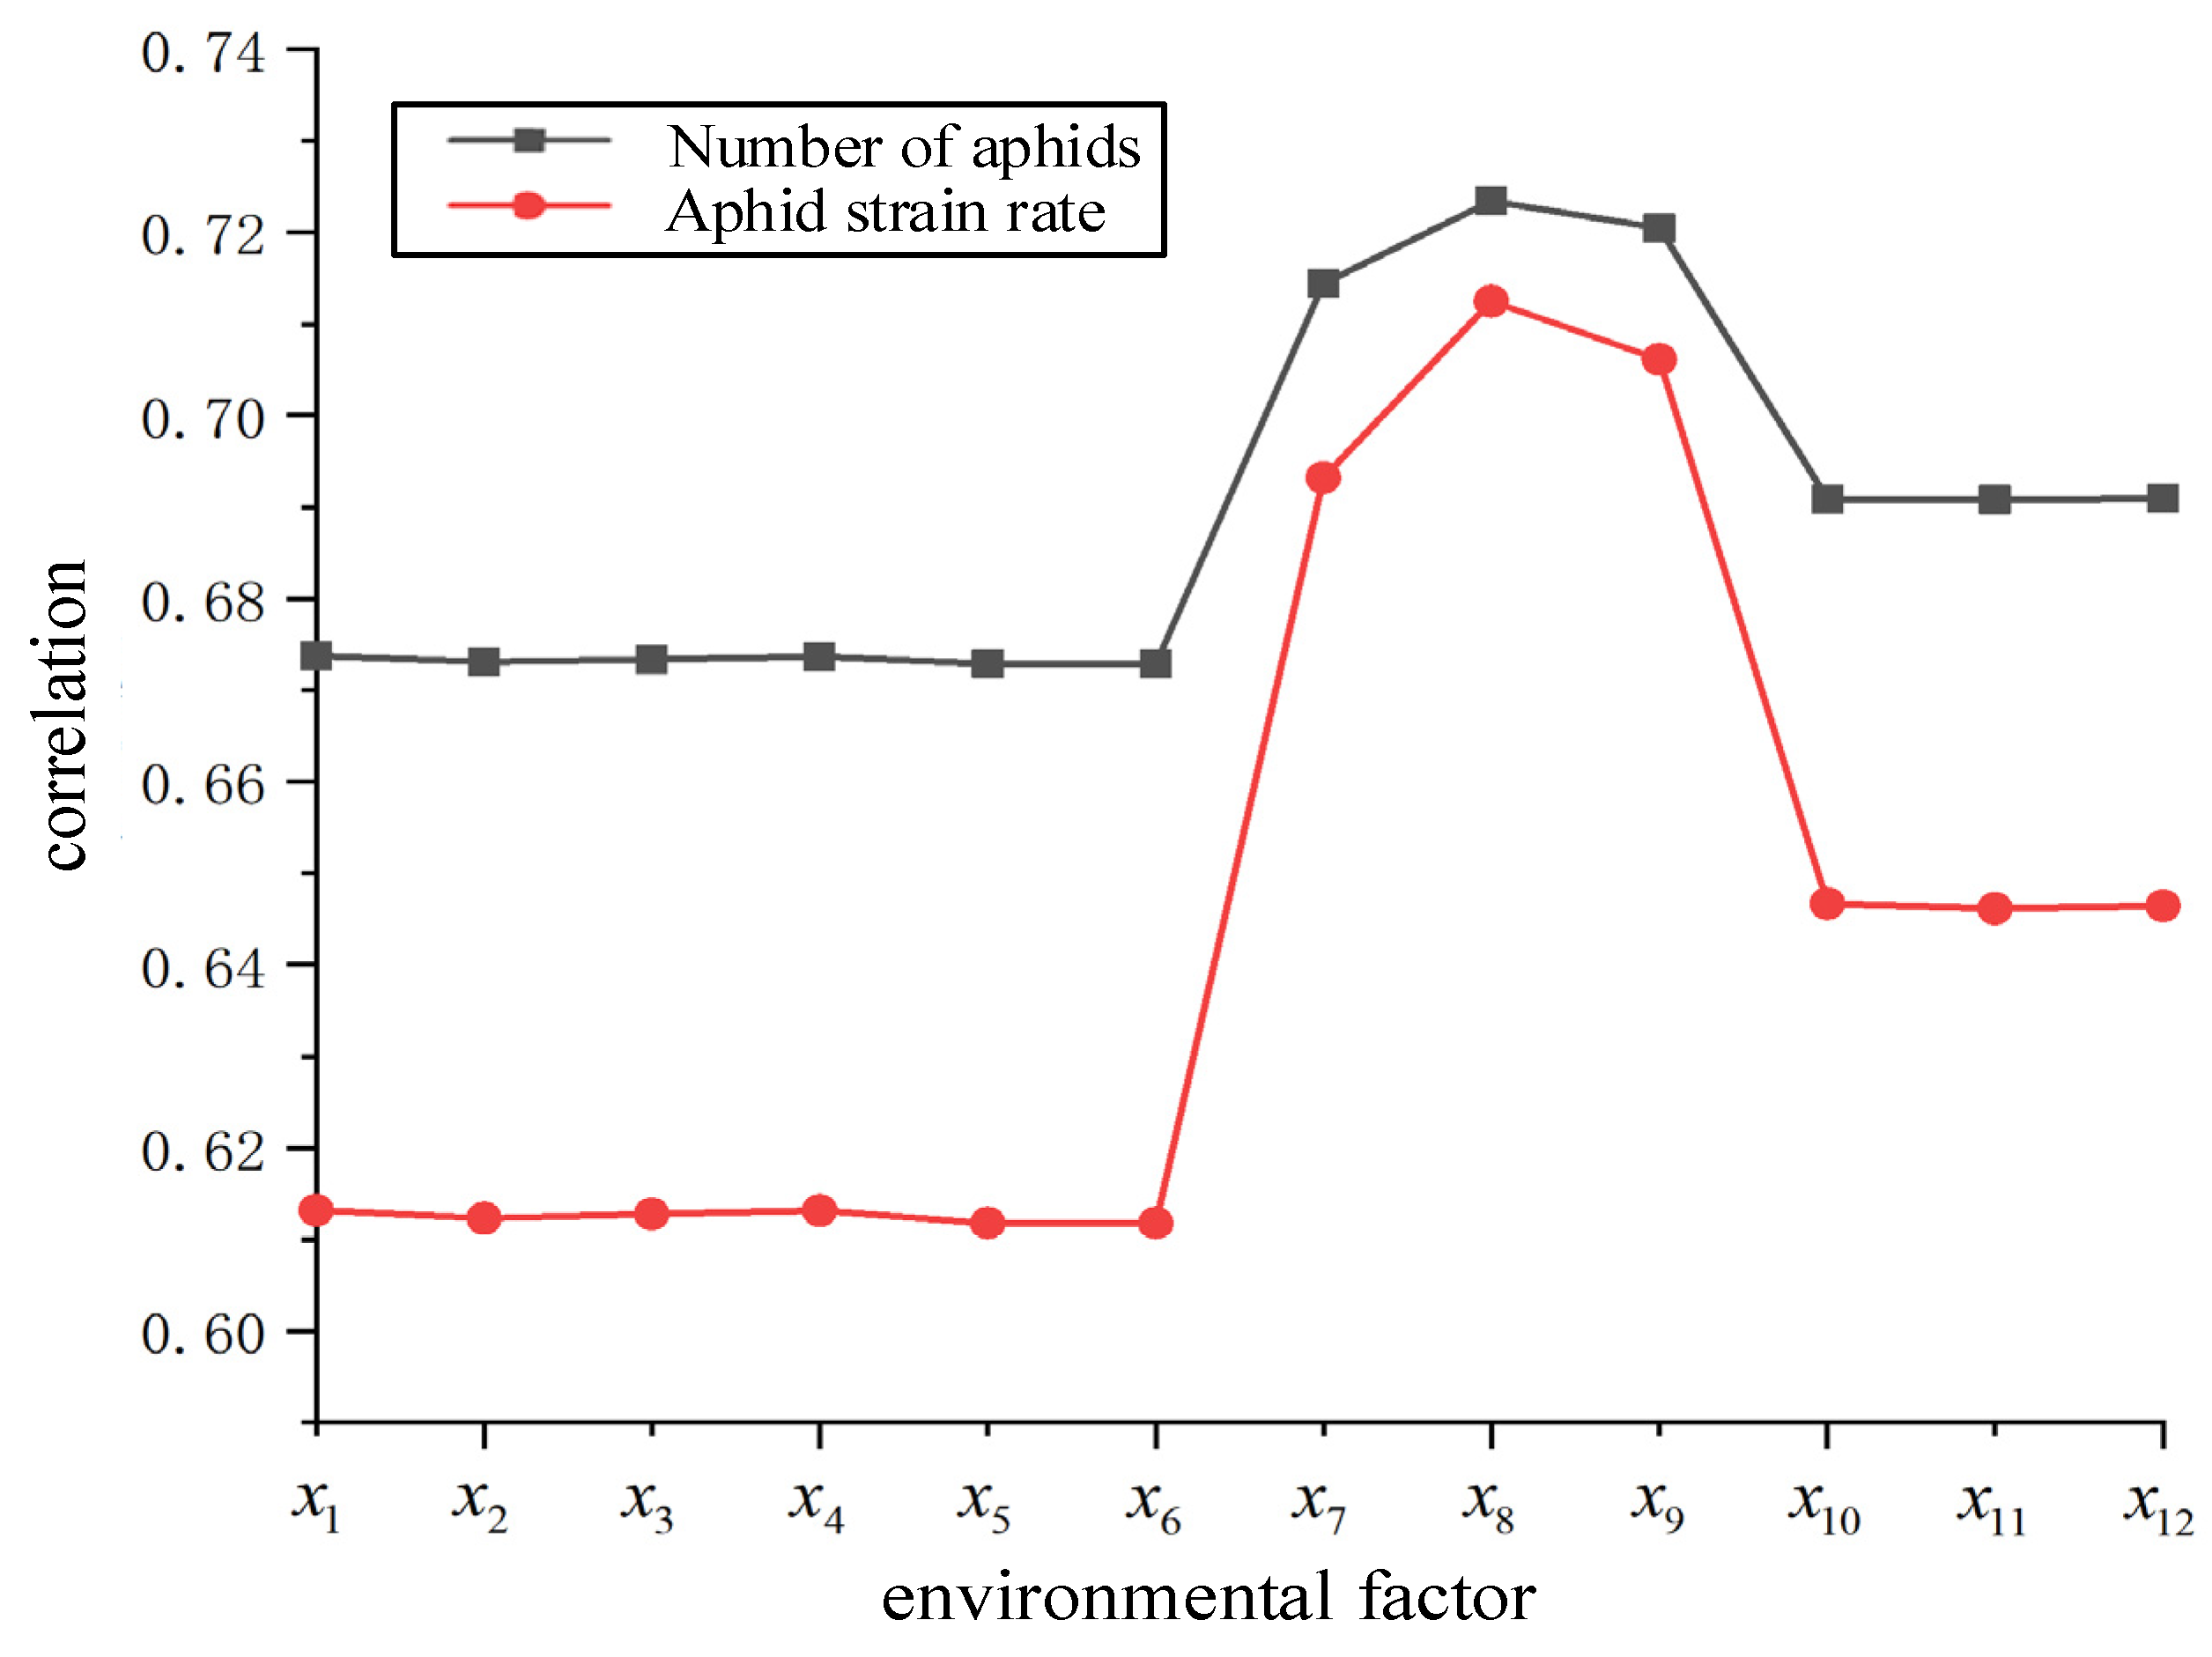
- We employ grey correlation analysis to identify the correlation between environmental factors and aphids and the degree of correlation, indicating that the light intensity is most closely related to the number of aphids and the aphid strain rate.
- (3)
- We conduct multi-source information fusion experiments and compare the proposed model with existing network models such as 1D CNN, LSTM, and BP. The results show that the proposed model has obvious advantages for predicting the aphid number and strain rate.
- (4)
- The outline of the paper is organized as follows: In Section 2, the two-level distributed multi-source information fusion framework is described. The dataset acquisition and the proposed approach are devised in this section. In Section 3, fusion experiments are conducted to investigate the prediction performance of the model. The discussion evaluates the two-level distributed multi-source information fusion model in Section 4. Finally, the conclusion is presented in Section 5.
2. Materials and Methods
2.1. Two-Level Distributed Multi-Source Information Fusion Framework
2.2. Data Acquisition
2.3. Two-Level Distributed Multi-Source Information Fusion Model
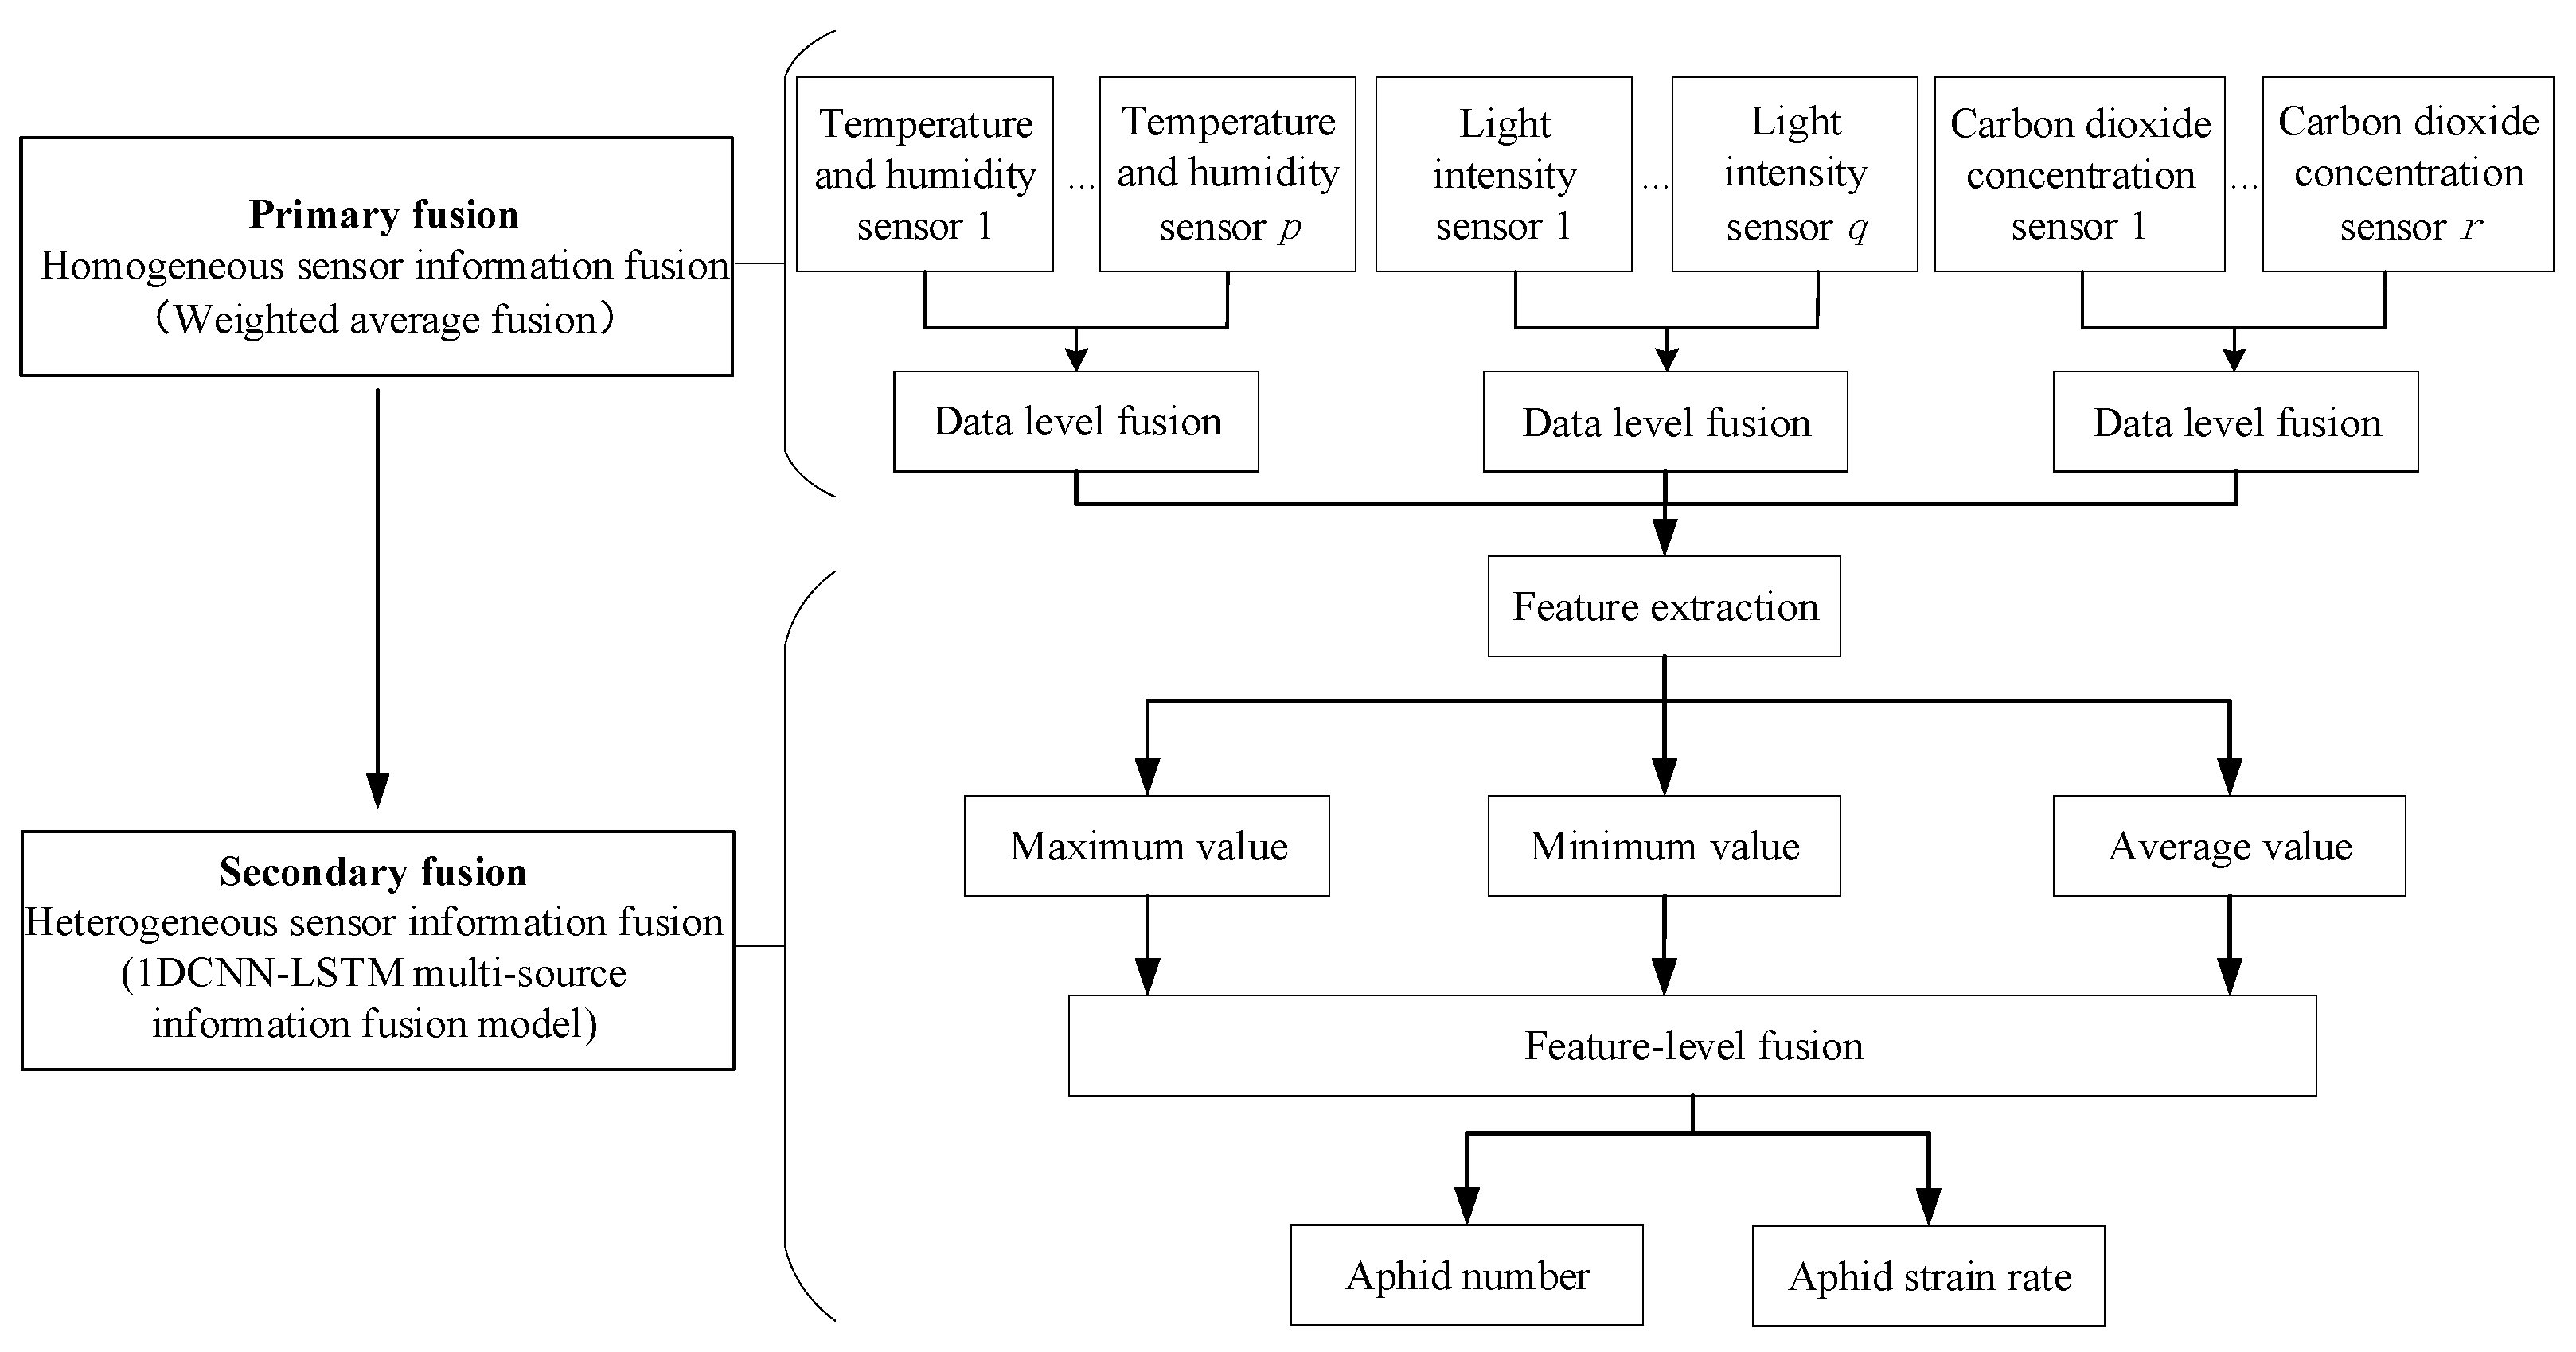
2.3.1. Primary Fusion
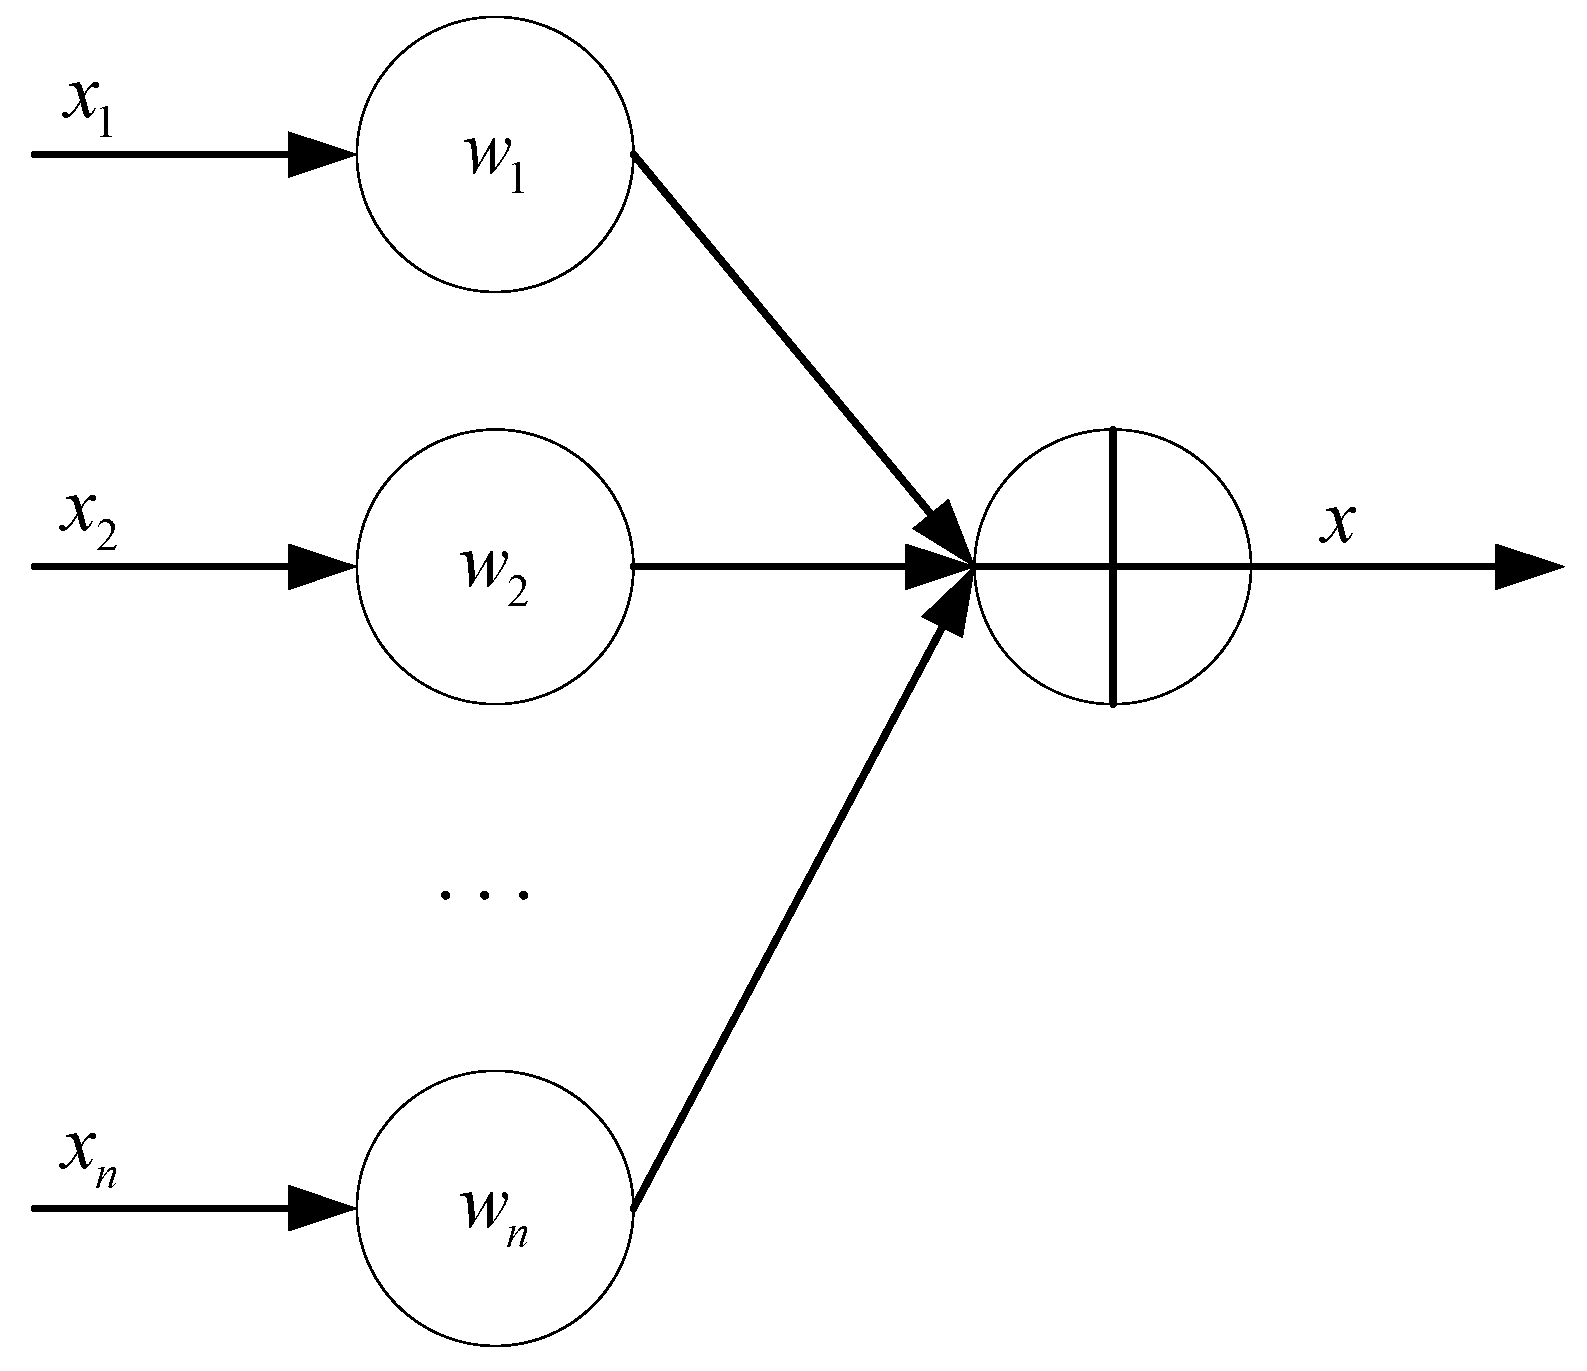
Weighted-Average Fusion Algorithm
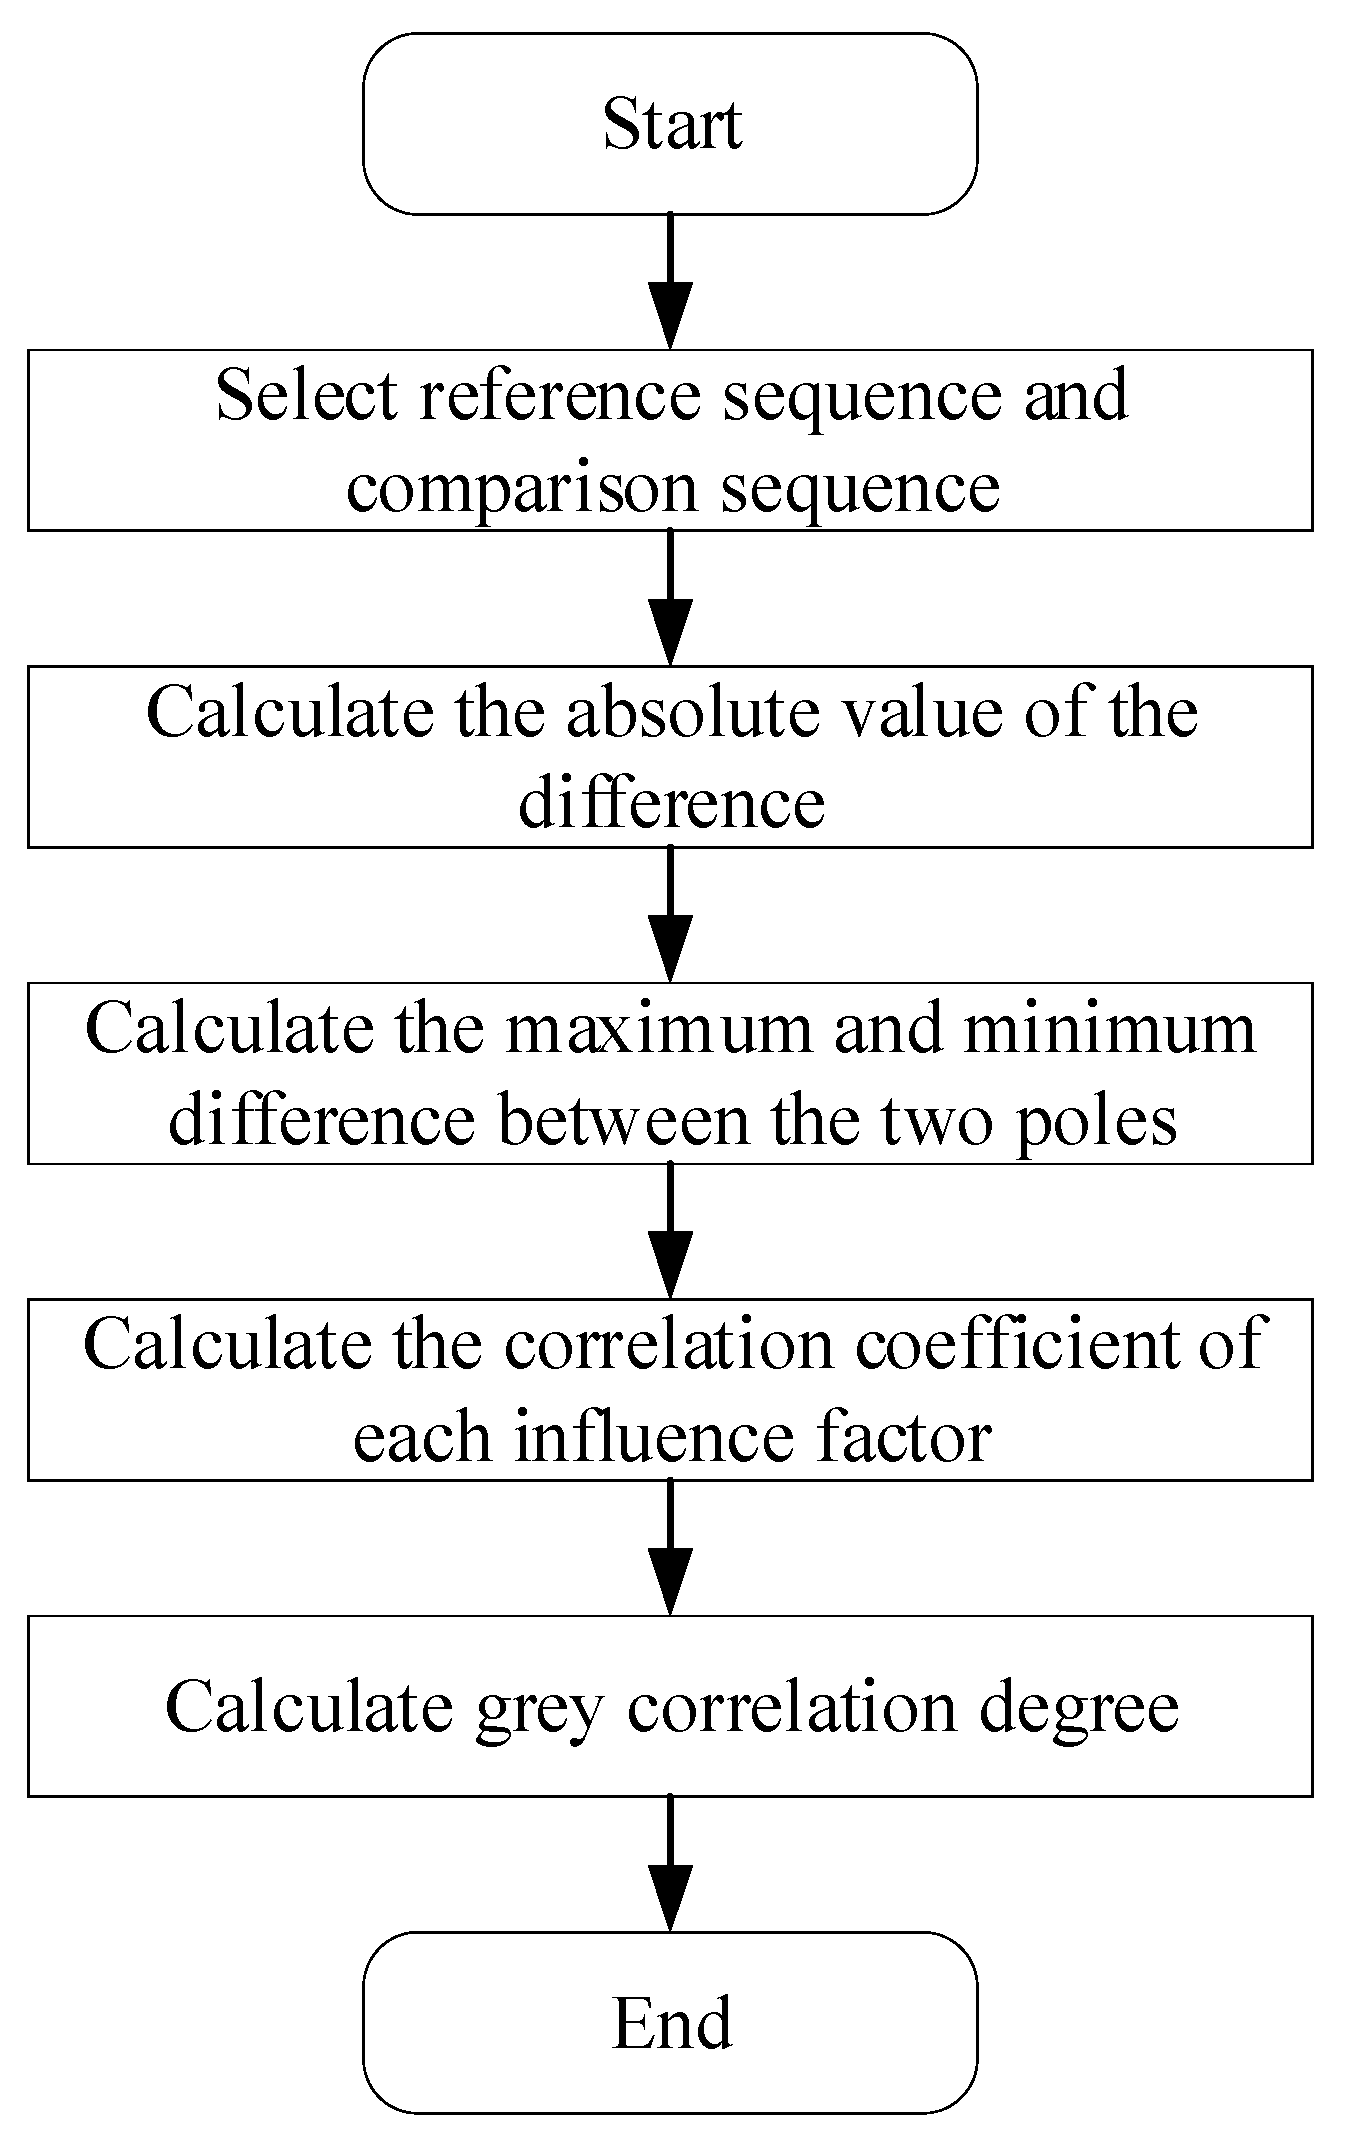
Analysis of Influencing Factors of Aphids Based on Grey Correlation Degree
2.3.2. Secondary Fusion
1D CNN
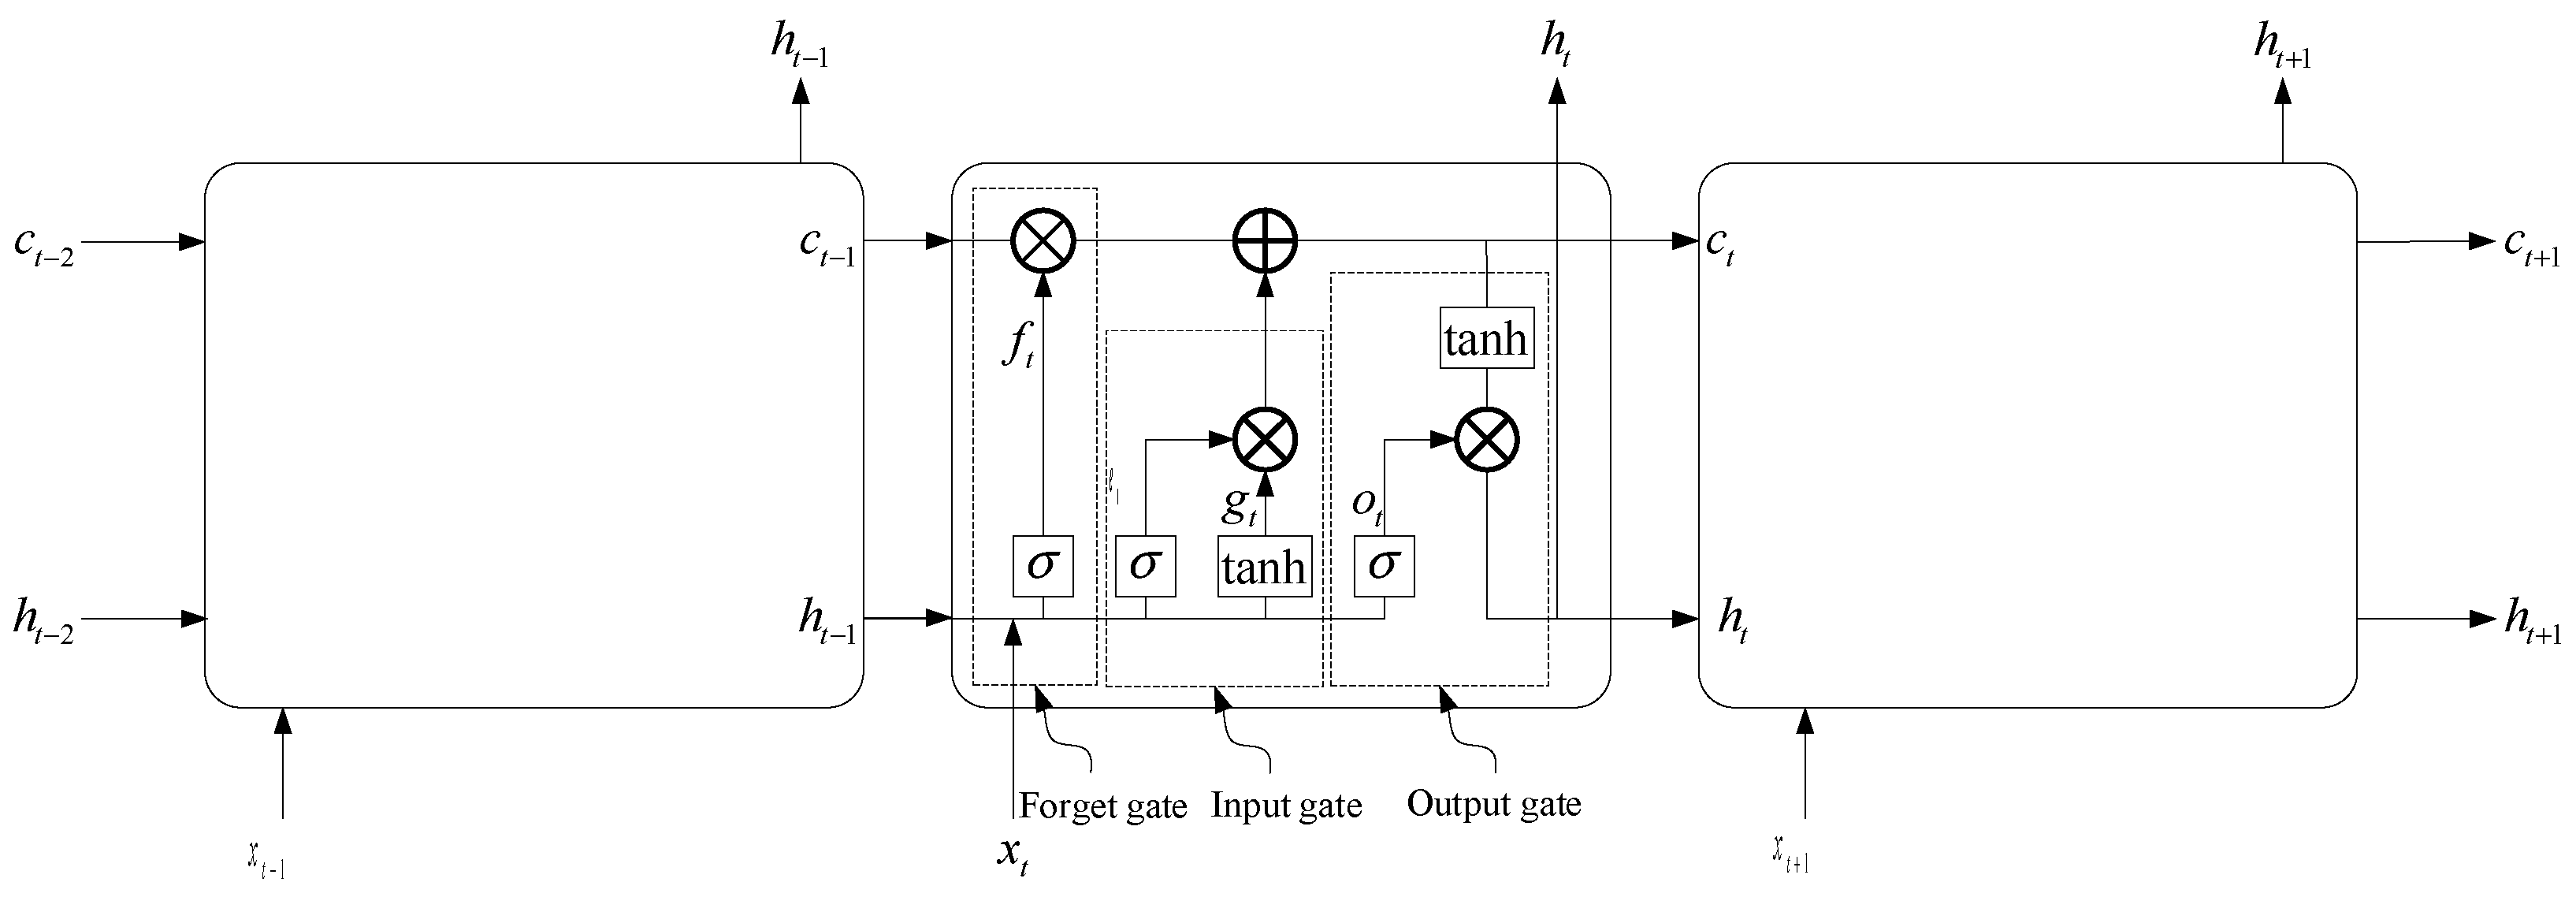
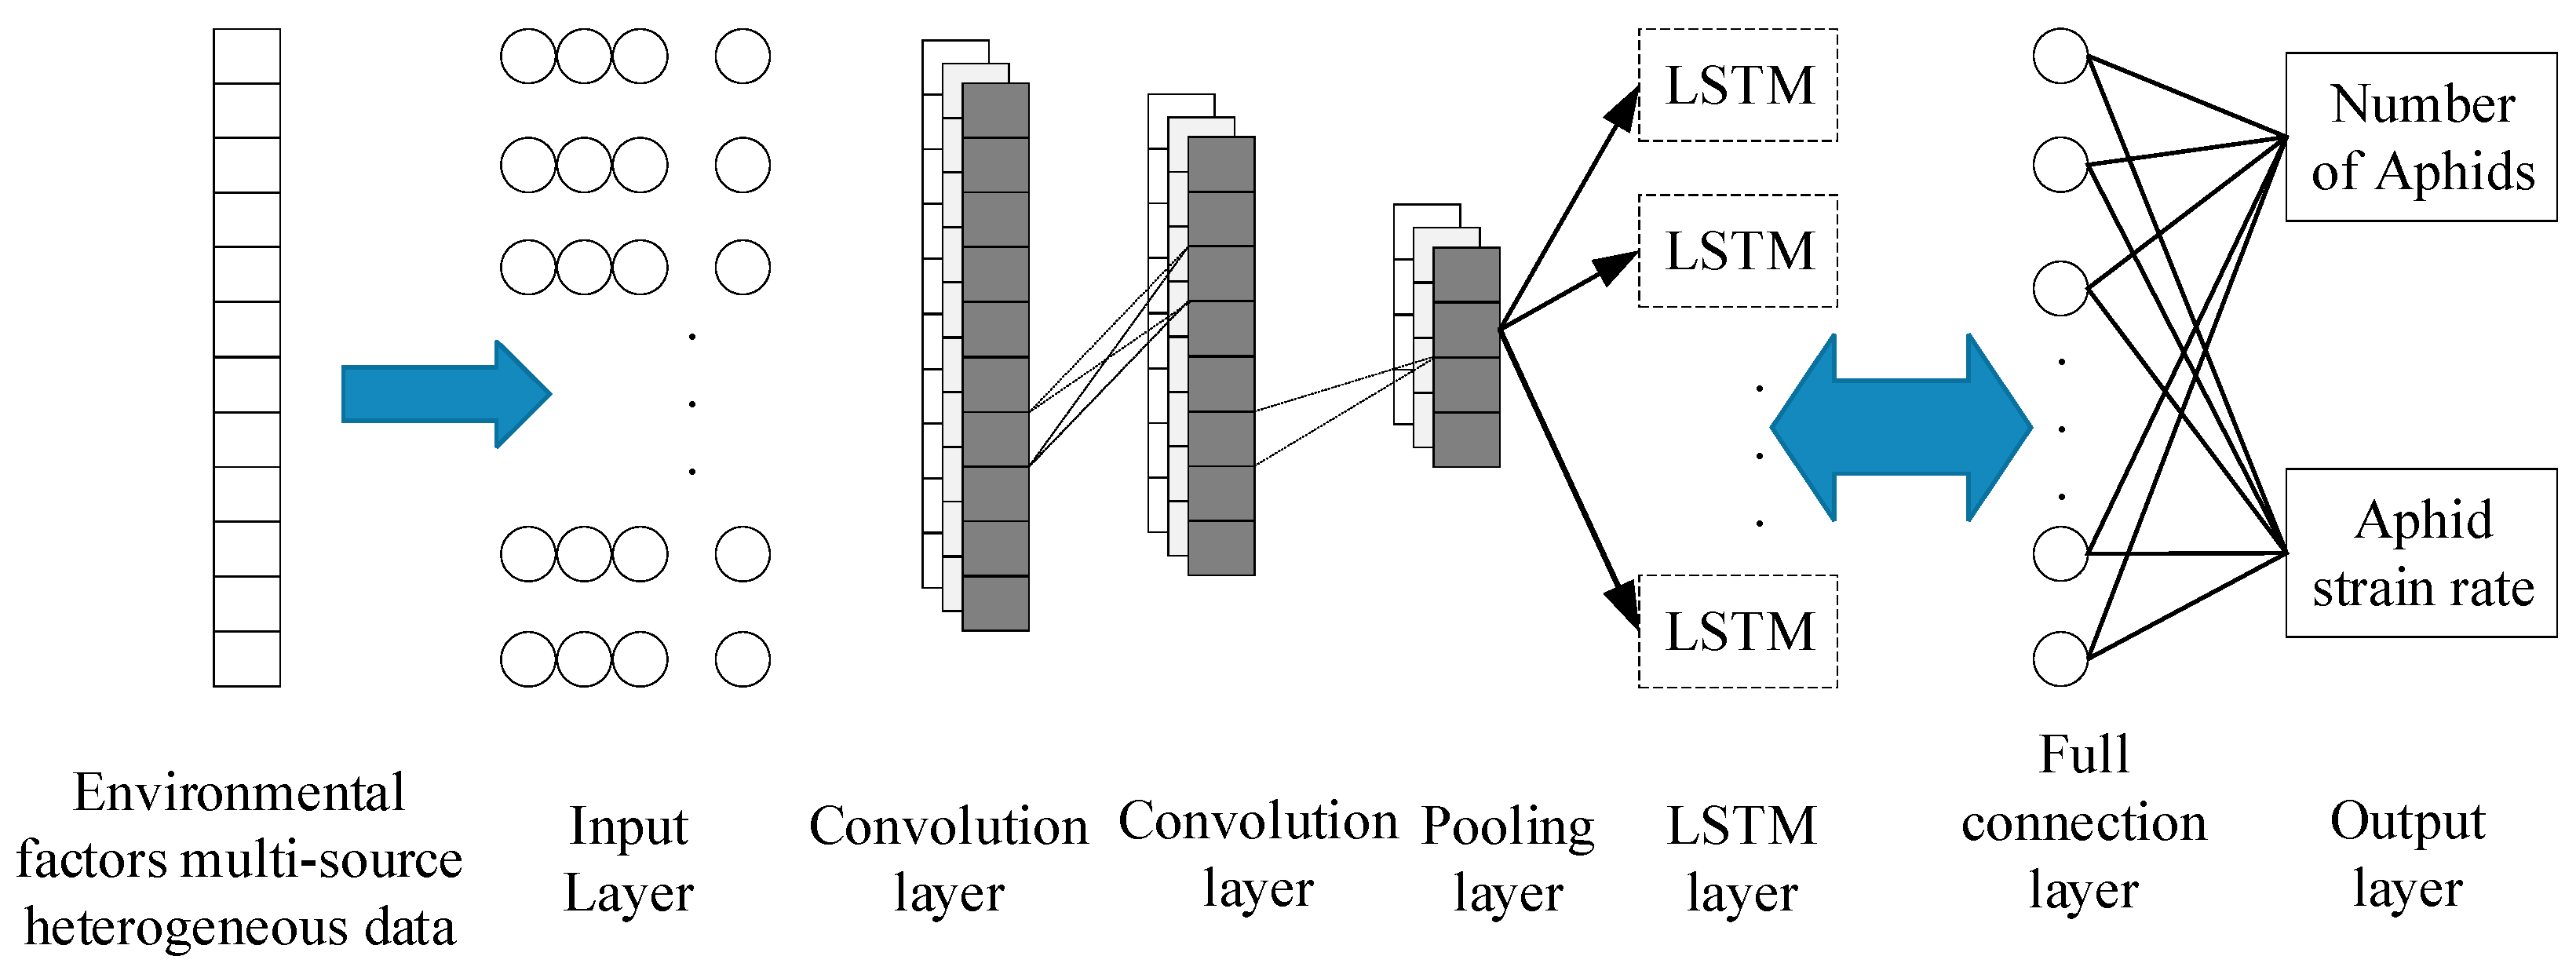
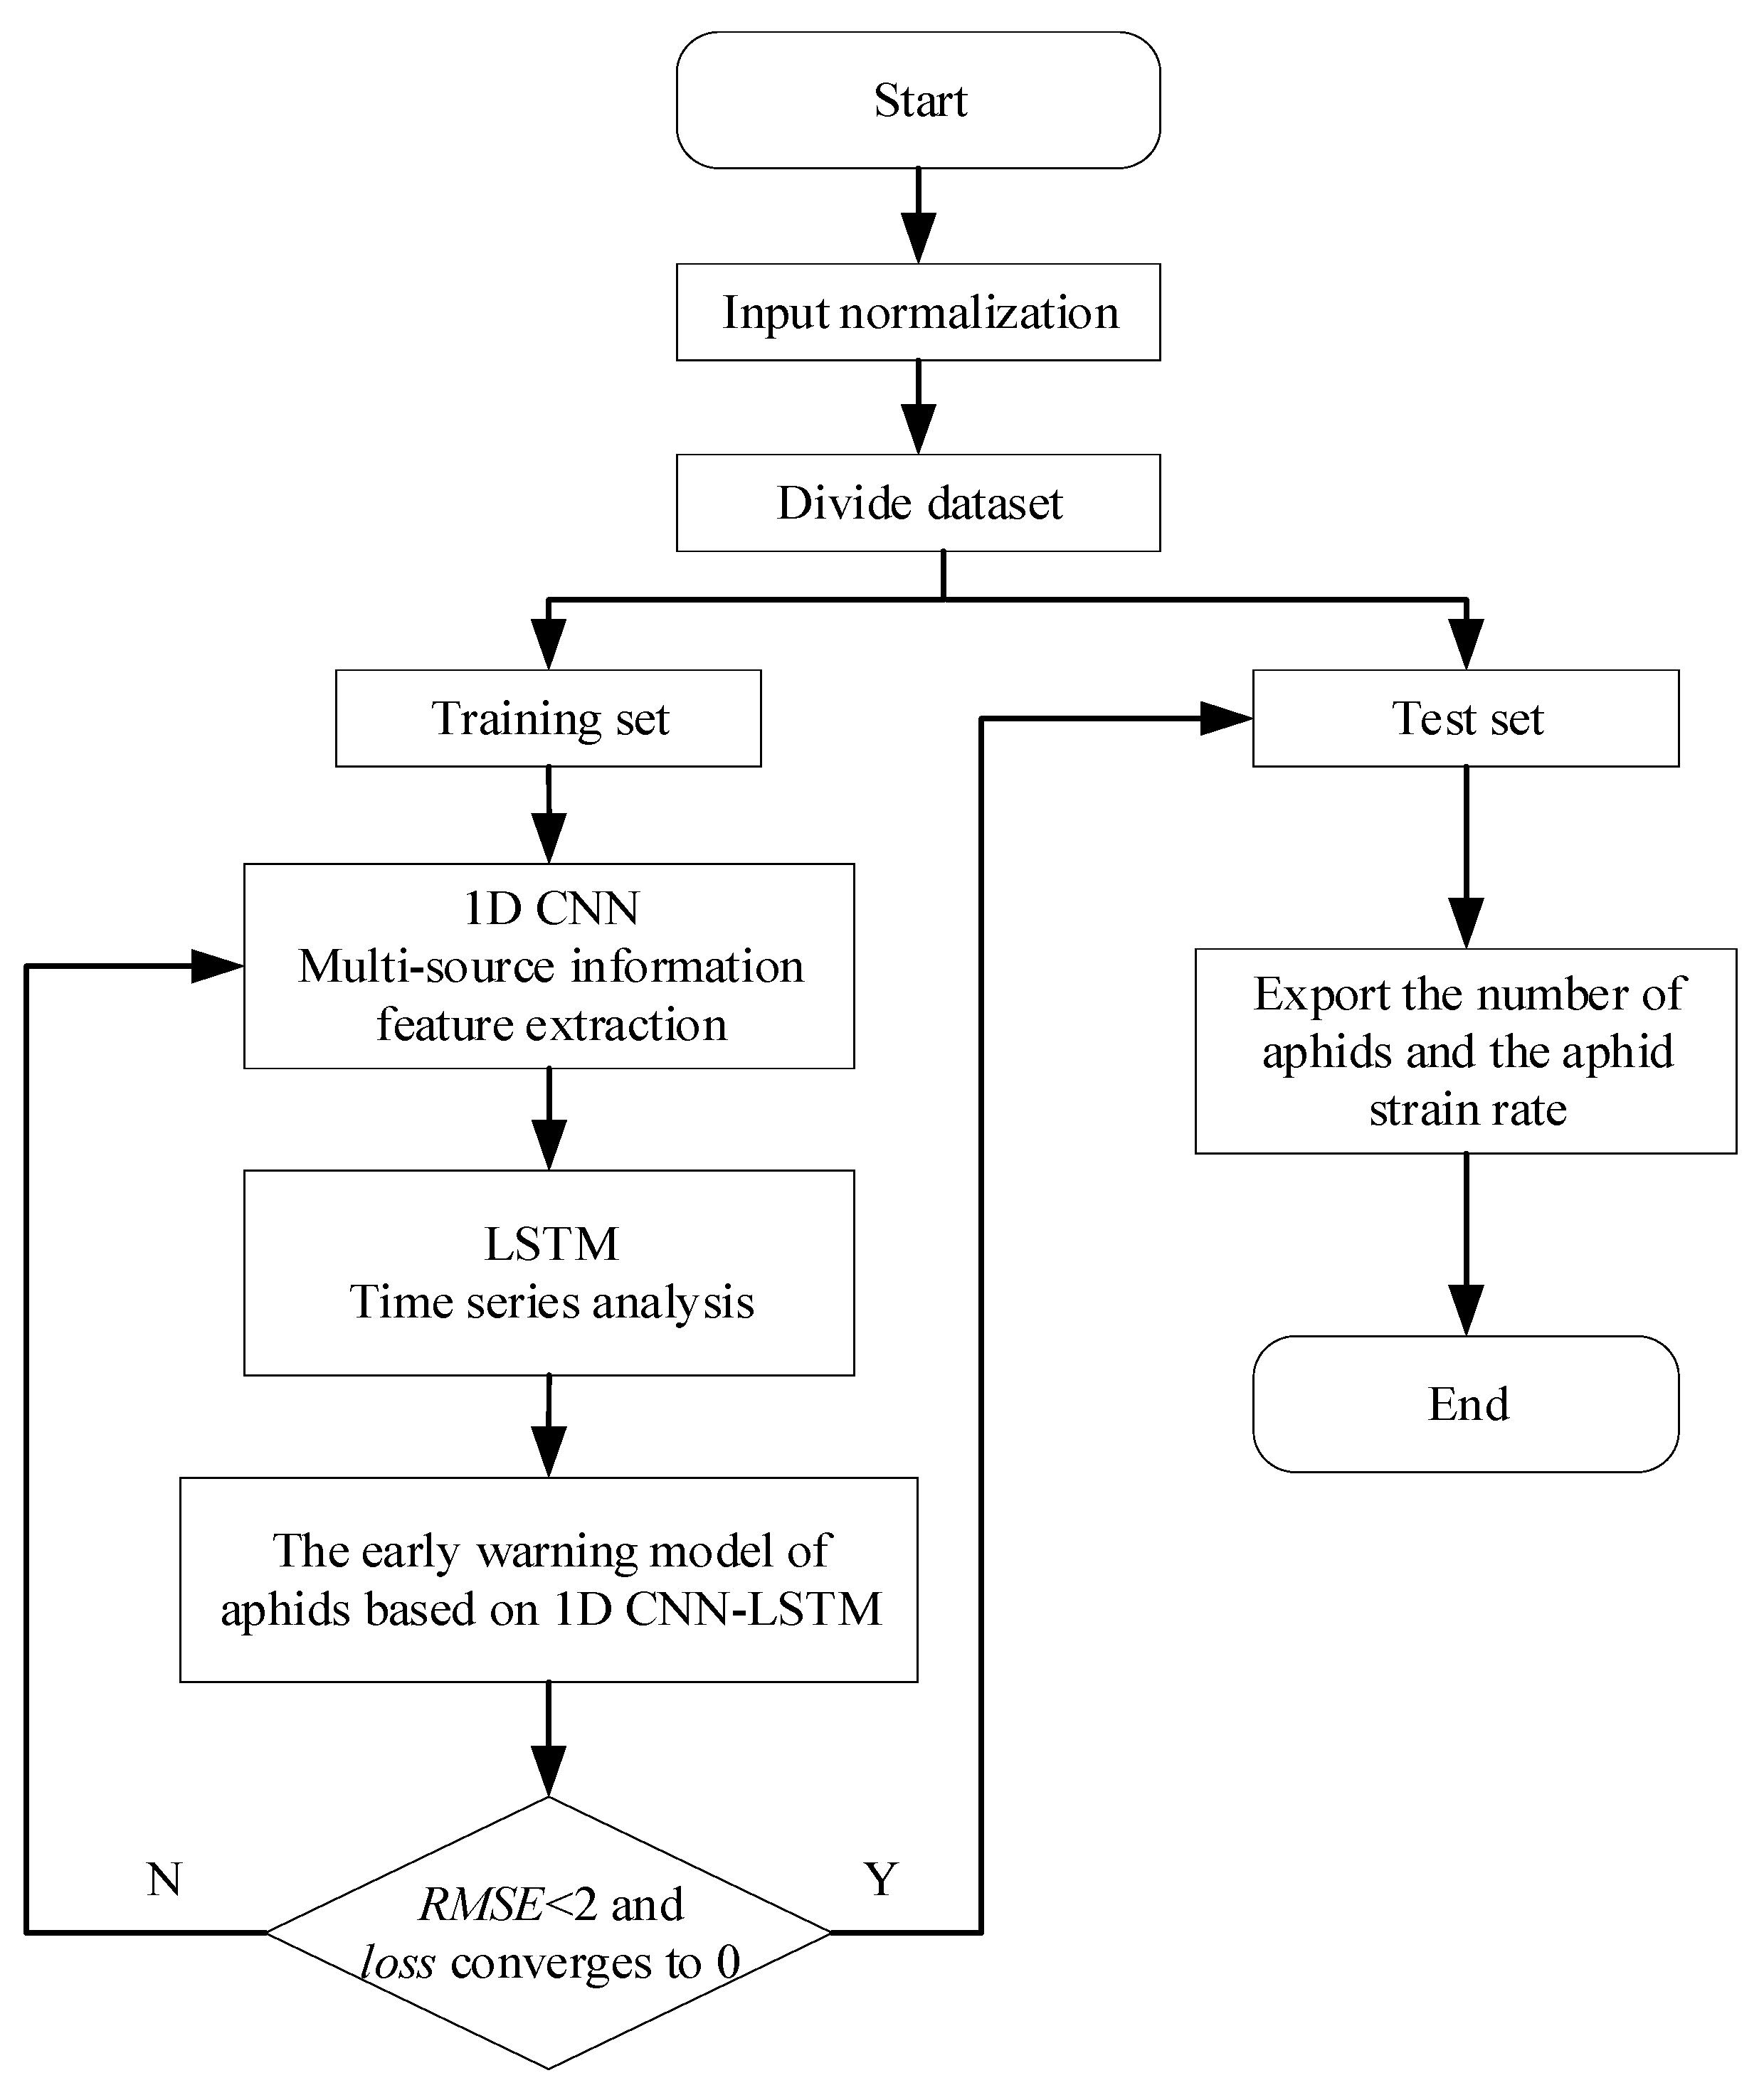
Aphid Monitoring Model Based on 1D CNN-LSTM
2.4. Experimental Setting
3. Results
3.1. Analysis of Primary Fusion Experiments
3.2. Analysis of Secondary Fusion Experiments
4. Discussion
5. Conclusions
Author Contributions
Funding
Data Availability Statement
Conflicts of Interest
References
- Chen, Q.; Liang, X.; Wu, C. Trait inheritance in pepper (Capsicum spp.) cultivars identified as resistant to green peach aphid (Myzus persicae). Plant Breed. 2020, 139, 996–1002. [Google Scholar] [CrossRef]
- Sun, M.; Voorrips, R.E.; Steenhuis-Broers, G.; van’t Westende, W.; Vosman, B. Reduced phloem uptake of Myzus persicae on an aphid resistant pepper accession. BMC Plant Biol. 2018, 18, 138. [Google Scholar] [CrossRef] [PubMed]
- Calicioglu, O.; Flammini, A.; Bracco, S.; Bellu, L.; Sims, R. The Future Challenges of Food and Agriculture: An Integrated Analysis of Trends and Solutions. Sustainability 2019, 11, 222. [Google Scholar] [CrossRef]
- Arcanjo, L.d.P.; da Silva, E.M.; de Araujo, T.A.; Barreto Crespo, A.L.; Santana Junior, P.A.; Oliveira Gomes, G.B.; Picanco, M.C. Decision-making systems for management of the invasive pest Neoleucinodes elegantalis (Guenee) (Lepidoptera: Crambidae) in commercial tomato crops according to insecticide spray method and plant stage. Crop Prot. 2021, 140, 105408. [Google Scholar] [CrossRef]
- Helps, J.C.; van den Bosch, F.; Paveley, N.; Jorgensen, L.N.; Holst, N.; Milne, A.E. A framework for evaluating the value of agricultural pest management decision support systems. Eur. J. Plant Pathol. 2024, 169, 887–902. [Google Scholar] [CrossRef]
- Soubeyrand, S.; Estoup, A.; Cruaud, A.; Malembic-Maher, S.; Meynard, C.; Ravigne, V.; Barbier, M.; Barres, B.; Berthier, K.; Boitard, S.; et al. Building integrated plant health surveillance: A proactive research agenda for anticipating and mitigating disease and pest emergence. CABI Agric. Biosci. 2024, 5, 72. [Google Scholar] [CrossRef]
- Rustia, D.J.A.; Lin, C.E.; Chung, J.-Y.; Zhuang, Y.-J.; Hsu, J.-C.; Lin, T.-T. Application of an image and environmental sensor network for automated greenhouse insect pest monitoring. J. Asia-Pac. Entomol. 2020, 23, 17–28. [Google Scholar] [CrossRef]
- Jha, P.K.; Zhang, N.; Rijal, J.P.; Parker, L.E.; Ostoja, S.; Pathak, T.B. Climate change impacts on insect pests for high value specialty crops in California. Sci. Total Environ. 2024, 906, 167605. [Google Scholar] [CrossRef]
- Tonnang, H.E.; Sokame, B.M.; Abdel-Rahman, E.M.; Dubois, T. Measuring and modelling crop yield losses due to invasive insect pests under climate change. Curr. Opin. Insect Sci. 2022, 50, 100873. [Google Scholar] [CrossRef]
- Bairwa, B.; Singh, P.S.; Meena, R.S. Impact of weather factors on population abundance of major insect pest on mungbean vigna radiata (l.) Wilczek in gangetic plains. J. Exp. Zool. India 2016, 19, 285–288. [Google Scholar]
- Machekano, H.; Mutamiswa, R.; Mvumi, B.M.; Nyabako, T.; Shaw, S.; Nyamukondiwa, C. Disentangling factors limiting diamondback moth, Plutella xylostella (L.), spatio-temporal population abundance: A tool for pest forecasting. J. Appl. Entomol. 2019, 143, 670–682. [Google Scholar] [CrossRef]
- Levi-Mourao, A.; Madeira, F.; Meseguer, R.; Garcia, A.; Pons, X. Effects of Temperature and Relative Humidity on the Embryonic Development of Hypera postica Gyllenhal (Col.: Curculionidae). Insects 2021, 12, 250. [Google Scholar] [CrossRef] [PubMed]
- Barton, M.; Parry, H.; Ward, S.; Hoffmann, A.A.; Umina, P.A.; van Helden, M.; Macfadyen, S. Forecasting impacts of biological control under future climates: Mechanistic modelling of an aphid pest and a parasitic wasp. Ecol. Model. 2021, 457, 109679. [Google Scholar] [CrossRef]
- Eigenbrode, S.D.; Adhikari, S. Climate change and managing insect pests and beneficials in agricultural systems. Agron. J. 2023, 115, 2194–2215. [Google Scholar] [CrossRef]
- Li, C.; Zhong, H.; Ning, W.; Hu, G.; Wu, M.; Liu, Y.; Yan, B.; Ren, H.; Sonne, C. Integrating climate-pest interactions into crop projections for sustainable agriculture. Nat. Food 2024, 5, 447–450. [Google Scholar] [CrossRef]
- Ma, G.; Ma, C.-S. Potential distribution of invasive crop pests under climate change: Incorporating mitigation responses of insects into models. Curr. Opin. Insect Sci. 2022, 49, 15–21. [Google Scholar] [CrossRef] [PubMed]
- Seidel, P. Climate Change as a New Challenge for Plant and Pest Modeling—A Critical Review. Gesunde Pflanz. 2017, 69, 1–14. [Google Scholar]
- Skendzic, S.; Zovko, M.; Zivkovic, I.P.; Lesic, V.; Lemic, D. The Impact of Climate Change on Agricultural Insect Pests. Insects 2021, 12, 440. [Google Scholar] [CrossRef]
- Cai, J.; Xiao, D.; Lv, L.; Ye, Y. An early warning model for vegetable pests based on multidimensional data. Comput. Electron. Agric. 2019, 156, 217–226. [Google Scholar] [CrossRef]
- Campos, J.C.; Manrique-Silupú, J.; Dorneanu, B.; Ipanaqué, W.; Arellano-García, H. A smart decision framework for the prediction of thrips incidence in organic banana crops. Ecol. Model. 2022, 473, 110147. [Google Scholar] [CrossRef]
- Ibrahim, E.A.; Salifu, D.; Mwalili, S.; Dubois, T.; Collins, R.; Tonnang, H.E.Z. An expert system for insect pest population dynamics prediction. Comput. Electron. Agric. 2022, 198, 107124. [Google Scholar] [CrossRef]
- Tay, A.; Lafont, F.; Balmat, J.-F. Forecasting pest risk level in roses greenhouse: Adaptive neuro-fuzzy inference system vs artificial neural networks. Inf. Process. Agric. 2021, 8, 386–397. [Google Scholar] [CrossRef]
- Yang, L.-n.; Peng, L.; Zhang, L.-m.; Zhang, L.-l.; Yang, S.-s. A prediction model for population occurrence of paddy stem borer (Scirpophaga incertulas), based on Back Propagation Artificial Neural Network and Principal Components Analysis. Comput. Electron. Agric. 2009, 68, 200–206. [Google Scholar] [CrossRef]
- Wahyono, T.; Heryadi, Y.; Soeparno, H.; Abbas, B.S. Enhanced LSTM Multivariate Time Series Forecasting for Crop Pest prediction. ICIC Express Lett. 2020, 14, 943–949. [Google Scholar]
- Wang, J.; Zhang, D. Intelligent pest forecasting with meteorological data: An explainable deep learning approach. Expert Syst. Appl. 2024, 252, 124137. [Google Scholar] [CrossRef]
- Zhang, H.; He, B.; Xing, J.; Lu, M. Deep spatial and temporal graph convolutional network for rice planthopper population dynamic forecasting. Comput. Electron. Agric. 2023, 210, 107868. [Google Scholar] [CrossRef]
- Chen, C.-J.; Li, Y.-S.; Tai, C.-Y.; Chen, Y.-C.; Huang, Y.-M. Pest incidence forecasting based on Internet of Things and Long Short-Term Memory Network. Appl. Soft Comput. 2022, 124, 108895. [Google Scholar] [CrossRef]


| Author(s) | Year | Method Type | Key Contributions | Key Findings |
|---|---|---|---|---|
| Zhang et al. [8] | 2024 | Expert Observation | Analyzed climate change effects on pest dynamics. | Climate change significantly influences pest populations and life cycles. |
| Sokame et al. [9] | 2022 | Expert Observation | Studied temperature and CO2 effects on pests. | Increased temperature and CO2 accelerate pest metabolism and increase populations. |
| Singh et al. [10] | 2016 | Expert Observation | Investigated weather impacts on mung bean pests. | Highest temperature positively correlated, while lowest temperature and wind negatively correlated. |
| Mutamiswa et al. [11] | 2019 | Expert Observation | Analyzed environmental factors affecting moth populations. | Positive correlation with average and highest temperatures; negative with humidity. |
| Madeira et al. [12] | 2021 | Expert Observation | Combined lab and field methods to study the weevil’s response to temperature and humidity. | High temperature and low humidity reduce survival and growth rates. |
| Xiao et al. [19] | 2019 | Machine Learning | Developed pest recognition model with BP neural network. | Enhanced multidimensional data collection for pest forecasting. |
| Manrique-Silupú et al. [20] | 2022 | Machine Learning | Created a framework using SVR for pest incidence prediction. | SVR demonstrated strong performance in predicting pest occurrences in organic banana crops. |
| Ibrahim et al. [21] | 2022 | Machine Learning | Used fuzzy neural networks to model fruit fly dynamics. | Climatic variables significantly affect pest population dynamics. |
| Lafont et al. [22] | 2021 | Machine Learning | Studied ANNs and ANFIS for pest risk forecasting in greenhouses. | Internal temperature and humidity are critical for pest risk levels. |
| Yang et al. [23] | 2009 | Machine Learning | Developed an ANN model for predicting paddy stem borer populations. | Non-linear relationships were identified between meteorological factors and pest populations. |
| Heryadi et al. [24] | 2020 | Deep Learning | Addressed pest attack forecasting using a Bidirectional LSTM model. | Effective forecasting of crop pest attacks with time-series weather data. |
| Wang and Zhang [25] | 2024 | Deep Learning | Proposed ALIC model to extract relationships between outbreaks and meteorological variables. | Validated the model’s effectiveness in pest forecasting. |
| He et al. [26] | 2023 | Deep Learning | Used attention-based LSTM for rice plant hopper population dynamics. | Significant meteorological impacts observed in pest populations. |
| Chen et al. [27] | 2022 | Deep Learning | Established LSTM and ML models to study pest–environment correlations. | Found significant correlations between pest dynamics and environmental factors. |
| Parameter | Value |
|---|---|
| Iterations | 100 |
| Batch size | 128 |
| Learning rate | 0.001 |
| Number of LSTM neurons | 128 |
| No. | Given Value | A1 | A2 | A3 | A4 | A5 | A6 | A7 |
|---|---|---|---|---|---|---|---|---|
| 1 | 25.6 | 24.7 | 25.3 | 25.4 | 20.4 | 25.6 | 25.8 | 26.3 |
| 2 | 27.5 | 26.6 | 26.9 | 27.5 | 21.2 | 27.9 | 27.5 | 27.8 |
| 3 | 28.8 | 28.3 | 28.4 | 28.7 | 35.3 | 28.9 | 28.9 | 28.7 |
| 4 | 29.2 | 29.5 | 28.9 | 29.1 | 18.1 | 30.2 | 29.2 | 29.5 |
| 5 | 29.9 | 29.3 | 29.7 | 29.7 | 19.9 | 30.1 | 30.6 | 29.7 |
| 6 | 32.4 | 31.8 | 32.2 | 32.3 | 42.4 | 32.6 | 32.5 | 32.3 |
| 7 | 34.9 | 33.9 | 34.6 | 34.8 | 23.1 | 35.1 | 35.5 | 35.3 |
| 8 | 36.7 | 36.0 | 36.4 | 36.5 | 27.5 | 36.9 | 37.2 | 36.6 |
| No. | G1 | G2 | G3 | G4 | G5 | G6 | G7 |
|---|---|---|---|---|---|---|---|
| 1 | 0.046 | 0.279 | 0.333 | 2.375 | 0.441 | 0.549 | 0.820 |
| 2 | 0.052 | 0.188 | 0.461 | 2.402 | 0.643 | 0.461 | 0.597 |
| 3 | 0.556 | 0.514 | 0.385 | 2.439 | 0.300 | 0.300 | 0.385 |
| 4 | 0.431 | 0.280 | 0.331 | 2.438 | 0.608 | 0.356 | 0.431 |
| 5 | 0.249 | 0.363 | 0.363 | 2.435 | 0.477 | 0.620 | 0.363 |
| 6 | 0.544 | 0.431 | 0.403 | 2.444 | 0.318 | 0.346 | 0.403 |
| 7 | 0.172 | 0.341 | 0.389 | 2.433 | 0.462 | 0.558 | 0.510 |
| 8 | 0.219 | 0.339 | 0.370 | 2.437 | 0.494 | 0.588 | 0.401 |
| Nodes | ||
|---|---|---|
| A1 | 3.7365 | 0.1681 |
| A2 | 3.8135 | 0.1647 |
| A3 | 3.7527 | 0.1674 |
| A5 | 3.7560 | 0.1672 |
| A6 | 3.9272 | 0.1600 |
| A7 | 3.6390 | 0.1726 |
| No. | Given Value | Fused Value | Absolute Error |
|---|---|---|---|
| 1 | 25.6 | 25.5 | 0.1 |
| 2 | 27.5 | 27.4 | 0.1 |
| 3 | 28.8 | 28.7 | 0.1 |
| 4 | 29.2 | 29.3 | 0.1 |
| 5 | 29.9 | 29.9 | 0 |
| 6 | 32.4 | 32.3 | 0.1 |
| 7 | 34.9 | 34.9 | 0 |
| 8 | 36.7 | 36.6 | 0.1 |
| Variable | 1 | 2 | 3 | 4 | 5 | ... | k − 1 | k |
|---|---|---|---|---|---|---|---|---|
| y1 | 14 | 39 | 87 | 103 | 119 | ... | 408 | 537 |
| y2 | 2.7 | 5.3 | 10.0 | 15.7 | 18.3 | ... | 39.0 | 45.3 |
| x1 | 35.8 | 15.3 | 20.4 | 23.3 | 25.9 | ... | 27.3 | 29.5 |
| x2 | 30.3 | 13.9 | 16.4 | 17.1 | 17.3 | ... | 26.1 | 27.6 |
| x3 | 32.5 | 16.4 | 17.8 | 18.5 | 19.1 | ... | 27.0 | 28.1 |
| x4 | 64.3 | 32.1 | 34.6 | 38.2 | 42.3 | ... | 49.7 | 55.3 |
| x5 | 60.2 | 26.8 | 31.2 | 33.9 | 36.5 | ... | 47.2 | 47.3 |
| x6 | 63.2 | 29.1 | 33.1 | 34.7 | 37.2 | ... | 46.0 | 49.9 |
| x7 | 4923 | 7410 | 9980 | 13,255 | 15,653 | ... | 18,760 | 19,030 |
| x8 | 3785 | 6300 | 8030 | 12,925 | 13,092 | ... | 17,523 | 17,400 |
| x9 | 4200 | 7037 | 8541 | 13,010 | 14,322 | ... | 18,440 | 18,535 |
| x10 | 251 | 338 | 343 | 330 | 405 | ... | 386 | 459 |
| x11 | 220 | 278 | 291 | 283 | 378 | ... | 349 | 415 |
| x12 | 233 | 293 | 326 | 305 | 394 | ... | 356 | 436 |
| Activation Function | RMSE | Loss |
|---|---|---|
| LeakyReLu | 2.042 | 2.085 |
| clippedReLu | 1.547 | 1.197 |
| swish | 1.627 | 1.324 |
| ReLu | 1.503 | 1.130 |
| Model | RMSE |
|---|---|
| 1D CNN-LSTM | 1.503 |
| 1D CNN | 8.394 |
| LSTM | 9.016 |
| BP | 35.483 |
| Number of Aphids | Aphid Strain Rate | |||||
|---|---|---|---|---|---|---|
| Model | RMSE | MAE | ||||
| 1D CNN-LSTM | 1.378 | 0.900 | 0.999 | 0.337 | 0.260 | 0.999 |
| 1D CNN | 7.155 | 5.800 | 0.994 | 3.367 | 2.650 | 0.931 |
| LSTM | 11.631 | 8.700 | 0.993 | 2.543 | 1.960 | 0.961 |
| BP | 22.576 | 17.900 | 0.979 | 10.915 | 8.30 | 0.1745 |
Disclaimer/Publisher’s Note: The statements, opinions and data contained in all publications are solely those of the individual author(s) and contributor(s) and not of MDPI and/or the editor(s). MDPI and/or the editor(s) disclaim responsibility for any injury to people or property resulting from any ideas, methods, instructions or products referred to in the content. |
© 2025 by the authors. Licensee MDPI, Basel, Switzerland. This article is an open access article distributed under the terms and conditions of the Creative Commons Attribution (CC BY) license (https://creativecommons.org/licenses/by/4.0/).
Share and Cite
Li, X.; Wang, L.; Dai, M.; Zhang, Y.; Su, W.; Wang, M.; Miao, H. Two-Level Distributed Multi-Source Information Fusion Model for Aphid Monitoring and Forecasting in the Greenhouse. Agronomy 2025, 15, 1044. https://doi.org/10.3390/agronomy15051044
Li X, Wang L, Dai M, Zhang Y, Su W, Wang M, Miao H. Two-Level Distributed Multi-Source Information Fusion Model for Aphid Monitoring and Forecasting in the Greenhouse. Agronomy. 2025; 15(5):1044. https://doi.org/10.3390/agronomy15051044
Chicago/Turabian StyleLi, Xiaoyin, Lixing Wang, Min Dai, Yongji Zhang, Wei Su, Mingyou Wang, and Hong Miao. 2025. "Two-Level Distributed Multi-Source Information Fusion Model for Aphid Monitoring and Forecasting in the Greenhouse" Agronomy 15, no. 5: 1044. https://doi.org/10.3390/agronomy15051044
APA StyleLi, X., Wang, L., Dai, M., Zhang, Y., Su, W., Wang, M., & Miao, H. (2025). Two-Level Distributed Multi-Source Information Fusion Model for Aphid Monitoring and Forecasting in the Greenhouse. Agronomy, 15(5), 1044. https://doi.org/10.3390/agronomy15051044