Article

System Design and Reliability Improvement of Wireless Sensor Network in Plant Factory Scenario

1
College of Electronic Engineering (College of Artificial Intelligence), South China Agricultural University, Guangzhou 510642, China
2
School of Agriculture and Biology, Shanghai Jiao Tong University, Shanghai 200240, China
3
Shanghai Xinghui Vegetable Co., Ltd., Shanghai 201419, China
*
Author to whom correspondence should be addressed.
Agronomy 2025, 15(3), 751; https://doi.org/10.3390/agronomy15030751
Submission received: 2 February 2025 / Revised: 2 March 2025 / Accepted: 18 March 2025 / Published: 20 March 2025
(This article belongs to the Section Precision and Digital Agriculture)

Abstract

:
Creating a suitable growing environment is necessary to ensure good plant growth in a plant factory, which requires wireless sensor networks (WSNs) to monitor the environment in real time. However, existing WSN clustered routing methods hardly take into account the network unreliability caused by varying link quality among nodes, resulting in reduced stability and accuracy of environmental monitoring. This study proposes a wireless sensor network system strategy for improving network reliability in large-scale reliable wireless sensor networks suitable for plant factory scenarios. Firstly, a hybrid wireless sensor network was designed and built based on Wi-Fi and ZigBee communication protocols. Secondly, a nonlinear link quality prediction model for plant factory scenarios was developed using a function fitting method, taking into account the interference and attenuation caused by the dense concentration of agricultural facilities and plants in plant factories on the wireless signal propagation. Finally, a network coverage optimization scheme was designed by combining a particle swarm optimization (PSO) algorithm and link quality prediction model, and a reliable cluster routing protocol was designed by combining K-means algorithm. The results indicated that the coefficient of determination (R2) for the prediction model was 0.9962. The impact of agricultural facilities and vegetation on link quality was most significant when the node height was 0.7 m. Under the optimal node deployment, the number of nodes was 33, and the network coverage rate (CR) reached 97.512%. Compared with the traditional clustered routing method, the wireless sensor network designed in this study is more applicable to the field of plant factories; it further enhances data transmission effectiveness and link quality, improves the reliability of the network, and realizes the load balancing of the internal transmission of the network, which in turn ensures the accuracy of environmental monitoring and the stability of the system.

1. Introduction

According to the Food and Agriculture Organization of the United Nations (FAO), the global population is expected to reach about 10 billion by 2050, which will require the steady growth of agricultural production to meet food needs [1]. A revolutionary approach to solving this problem is the establishment of plant factories, which are efficient but resource-intensive plant production systems that are able to regulate environmental parameters to ensure that crops achieve uninterrupted production throughout the year [2,3]. Large greenhouse systems such as plant factories are complex time-varying systems. In order to ensure that plants grow in an optimal environment, environmental parameters must be monitored and managed in real time [1], which requires the support of wireless sensor networks. However, unstable wireless sensor networks can lead to packet loss and communication delays, which in turn reduce the overall measurement accuracy of the environmental monitoring system [4]. Therefore, it is important to design a reliable large-scale wireless sensor network to enhance the perception of the environmental status of plant factories and improve the authenticity of environmental data collection.
In wireless sensor networks, link quality has a significant impact on data transmission. When data are transmitted over a poor-quality link, data transmission failures with high packet loss rates occur more easily, leading to excessive retransmission [5]. The accuracy of link quality estimation can have a significant impact on the efficiency of network protocols [6]. It is crucial to perform accurate link quality assessment in order to assist the upper-layer protocols in selecting better links for data transmission, thereby improving network efficiency [7]. However, traditional methods for link quality prediction have demonstrated limitations in achieving accurate results [8,9]. In agricultural applications, such as plant factories and other large-scale greenhouses, wireless signals propagate through the channel with unique challenges. First, the signals experience gradual attenuation due to the increase in transmission distance. Additionally, multipath effects arise from phenomena such as reflection, scattering, absorption, and signal overlap. These effects occur when the signals pass through dense crops and agricultural facilities within the plant factory. Consequently, the communication link may become unreliable [10]. Therefore, when deploying wireless sensor networks, it is important to consider the impact of complex environmental factors on link quality. To address this problem, Jawad et al. [11] modeled the path loss based on exponential and polynomial functions in the scenario of dense crops planted in farmland, and implanted a particle swarm algorithm for the optimization with R2 of 0.8307 in polynomial function fit and R2 of 0.9392 in exponential function fit. Raheemah et al. [12] examined the effect of the height of individual fruit trees on link path loss by placing transceivers on fruit trees at different heights and constructed a linear regression fitting model of path loss at the height of the transceiver, where the vegetation’s effect is maximum. By using accurate and effective link quality prediction models to select high-quality links for communication, it not only ensures the reliability of data transmission [13,14], but also assists routing protocols in selecting the next hop during data transmission, thus guaranteeing overall transmission efficiency [10].
In the field of environmental monitoring in plant factories, accurately reflecting the sensing status of the monitored area through a wireless sensor network is essential. Ensuring that the network nodes achieve maximum coverage of the monitored area is the core requirement for improving sensing accuracy [15]. However, the randomly deployed nodes exhibit a non-uniform distribution, which results in a reduced network coverage area. Consequently, coverage holes and overlapping sensing regions are likely to occur in such case. These issues adversely affect the network’s stability and quality of service, as noted in previous studies [16,17]. In addition, the high density of nodes in some areas generates a large number of redundant messages, leading to unbalanced network loads, which in turn leads to channel conflicts and reduces transmission efficiency. In order to ensure the stability of wireless sensor networks and provide high-quality services [18], realizing effective coverage within the monitoring area has become one of the core problems to be solved [19]. Network coverage optimization aims to maximize the network coverage area while minimizing the number of nodes used. In recent years, the coverage problem of wireless sensor networks has attracted attention in research. Genetic algorithms (GAs) [20], particle swarm optimization (PSO) [21], the artificial bee colony algorithm (ABC) [22], and the simulated annealing algorithm (SA) [23] are the most popular methods applied. These optimization methods exhibit strong adaptability and are largely independent of the mathematical characteristics of the problem [24].
In addition to inaccurate link quality estimation and uneven node deployment, the network topology also greatly affects the efficiency of the routing protocols, leading to unreliable networks [25]. Based on the classification of network topology, wireless sensor networks can be categorized into single-layer network structures and multi-layer network structures. In a single-layer network design, there is only one sink node, and all the nodes directly send data to the common sink node through single-hop communication. Such design usually causes network congestion and overload in practical application, which leads to serious information loss problems and ultimately reduces throughput and transmission efficiency [26]. In addition, the single-hop communication method has limited network coverage, a characteristic that makes it ideal for building small networks but less suitable when dealing with large networks [26]. Liao et al. [27] designed an IoT system with a single-layer network topology based on the ZigBee protocol, where each node uploaded data to only one gateway through single-hop communication for environmental monitoring such as temperature, humidity, and light in greenhouses. This system had limitations in large greenhouse scenarios due to its susceptibility to gateway failure, which could result in complete network breakdown. Additionally, the heavy traffic directed toward a single gateway increased the risk of congestion, further compromising the reliability and robustness of the network. Compared to single-layer networks, multi-layer networks have improvements in terms of network reliability and scalability. In multi-layer network design, the system is divided into clusters by using a cluster routing algorithm. Each cluster has a cluster head responsible for collecting data from other nodes within the cluster. In a large-scale network, data can be sent to the cluster heads through intermediate nodes, creating multiple communication paths. This redundancy significantly enhances fault tolerance, as the failure of a single node or cluster head does not result in the collapse of the entire network. Additionally, the hierarchical structure distributes network traffic more evenly, reducing the likelihood of congestion and ensuring stable and reliable communication in large-scale applications. Xia et al. [28] designed a three-layer wireless sensor network for temperature acquisition and hierarchical data fusion for the problem of uneven temperature distribution in large greenhouses. Singh et al. [29] designed a hybrid wireless sensor network based on the Wi-Fi and Lora protocols for long-range communication in large greenhouses. Clustering is a key technology for organizing networks and forming routing protocols; an efficient cluster routing protocol can effectively avoid network congestion, improve network stability, and enhance the effectiveness of data transmission.
As large-scale greenhouse systems, plant factories cover extensive areas, making the construction of a stable and reliable large-scale network a critical challenge. One of the most important requirements in designing routing protocols is to avoid excessive retransmission of data over low-quality links [6]. However, many current studies on network coverage optimization and routing protocols often overlook the evaluation of wireless link communication quality [10]. In most cases, links are assumed to be ideal during the design or simulation of routing protocols [30]. Moreover, constructing a large-scale and reliable wireless sensor network tailored for plant factory scenarios is essential to ensure the stable operation of an environmental monitoring system. This reliability directly affects the accuracy of environmental monitoring, which is crucial for maintaining optimal conditions for plant growth. However, research on improving the reliability of wireless sensor networks in plant factory scenarios is still relatively scarce. Therefore, this study focuses on developing a wireless sensor network system strategy to improve network reliability in plant factories with the following objectives:
  • Developing a nonlinear link quality prediction model suitable for plant factory scenarios based on function fitting methods;
  • Designing a reliable network coverage optimization scheme by integrating the particle swarm optimization (PSO) algorithm with the link quality prediction model;
  • Proposing a reliable clustering routing protocol by combining the network coverage optimization scheme with the K-means algorithm.

2. Materials and Methods

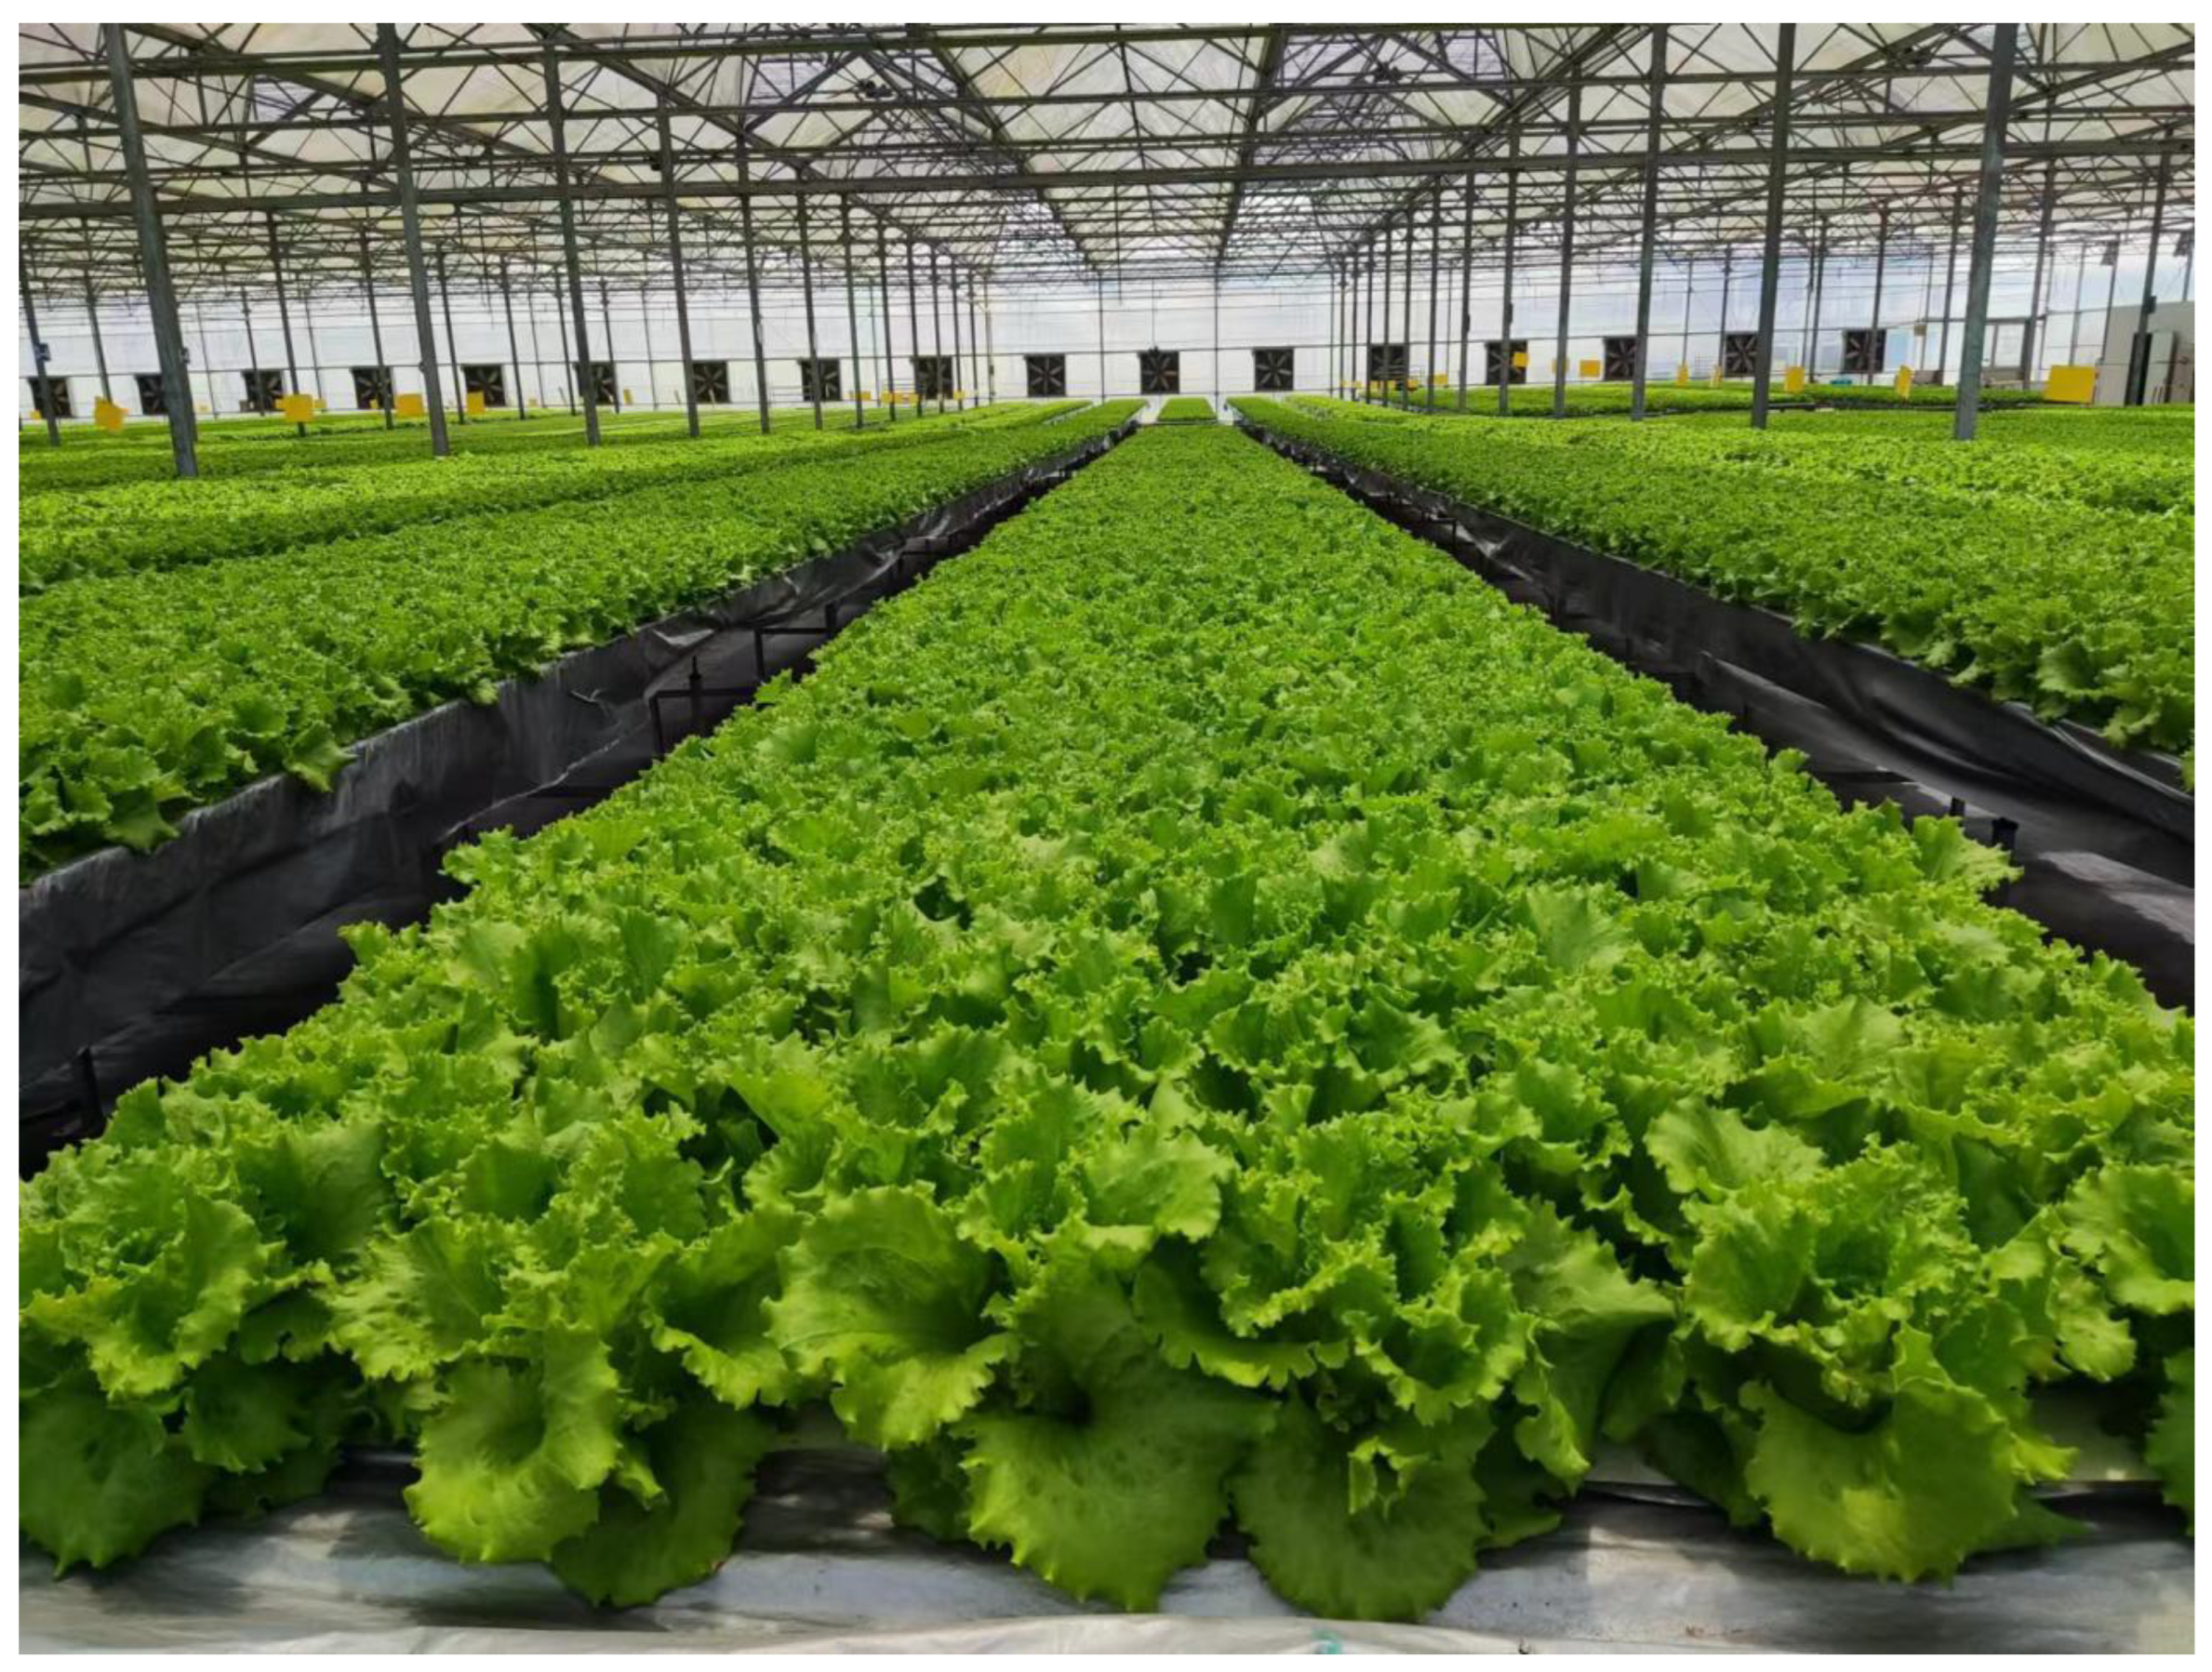
2.1. Experimental Site Description

The experiment was carried out in a plant factory in Shanghai, China, an 8064 m2 Venlo-type plastic greenhouse equipped with internal and external shading nets. The nutrient film technique (NFT) system was applied for lettuce cultivation. Cultivation beds were densely arranged in a uniform distribution, with a spacing of 0.5 m and a height of 0.7 m, as shown in Figure 1. Experimental data were collected between 22 July and 28 July 2024.

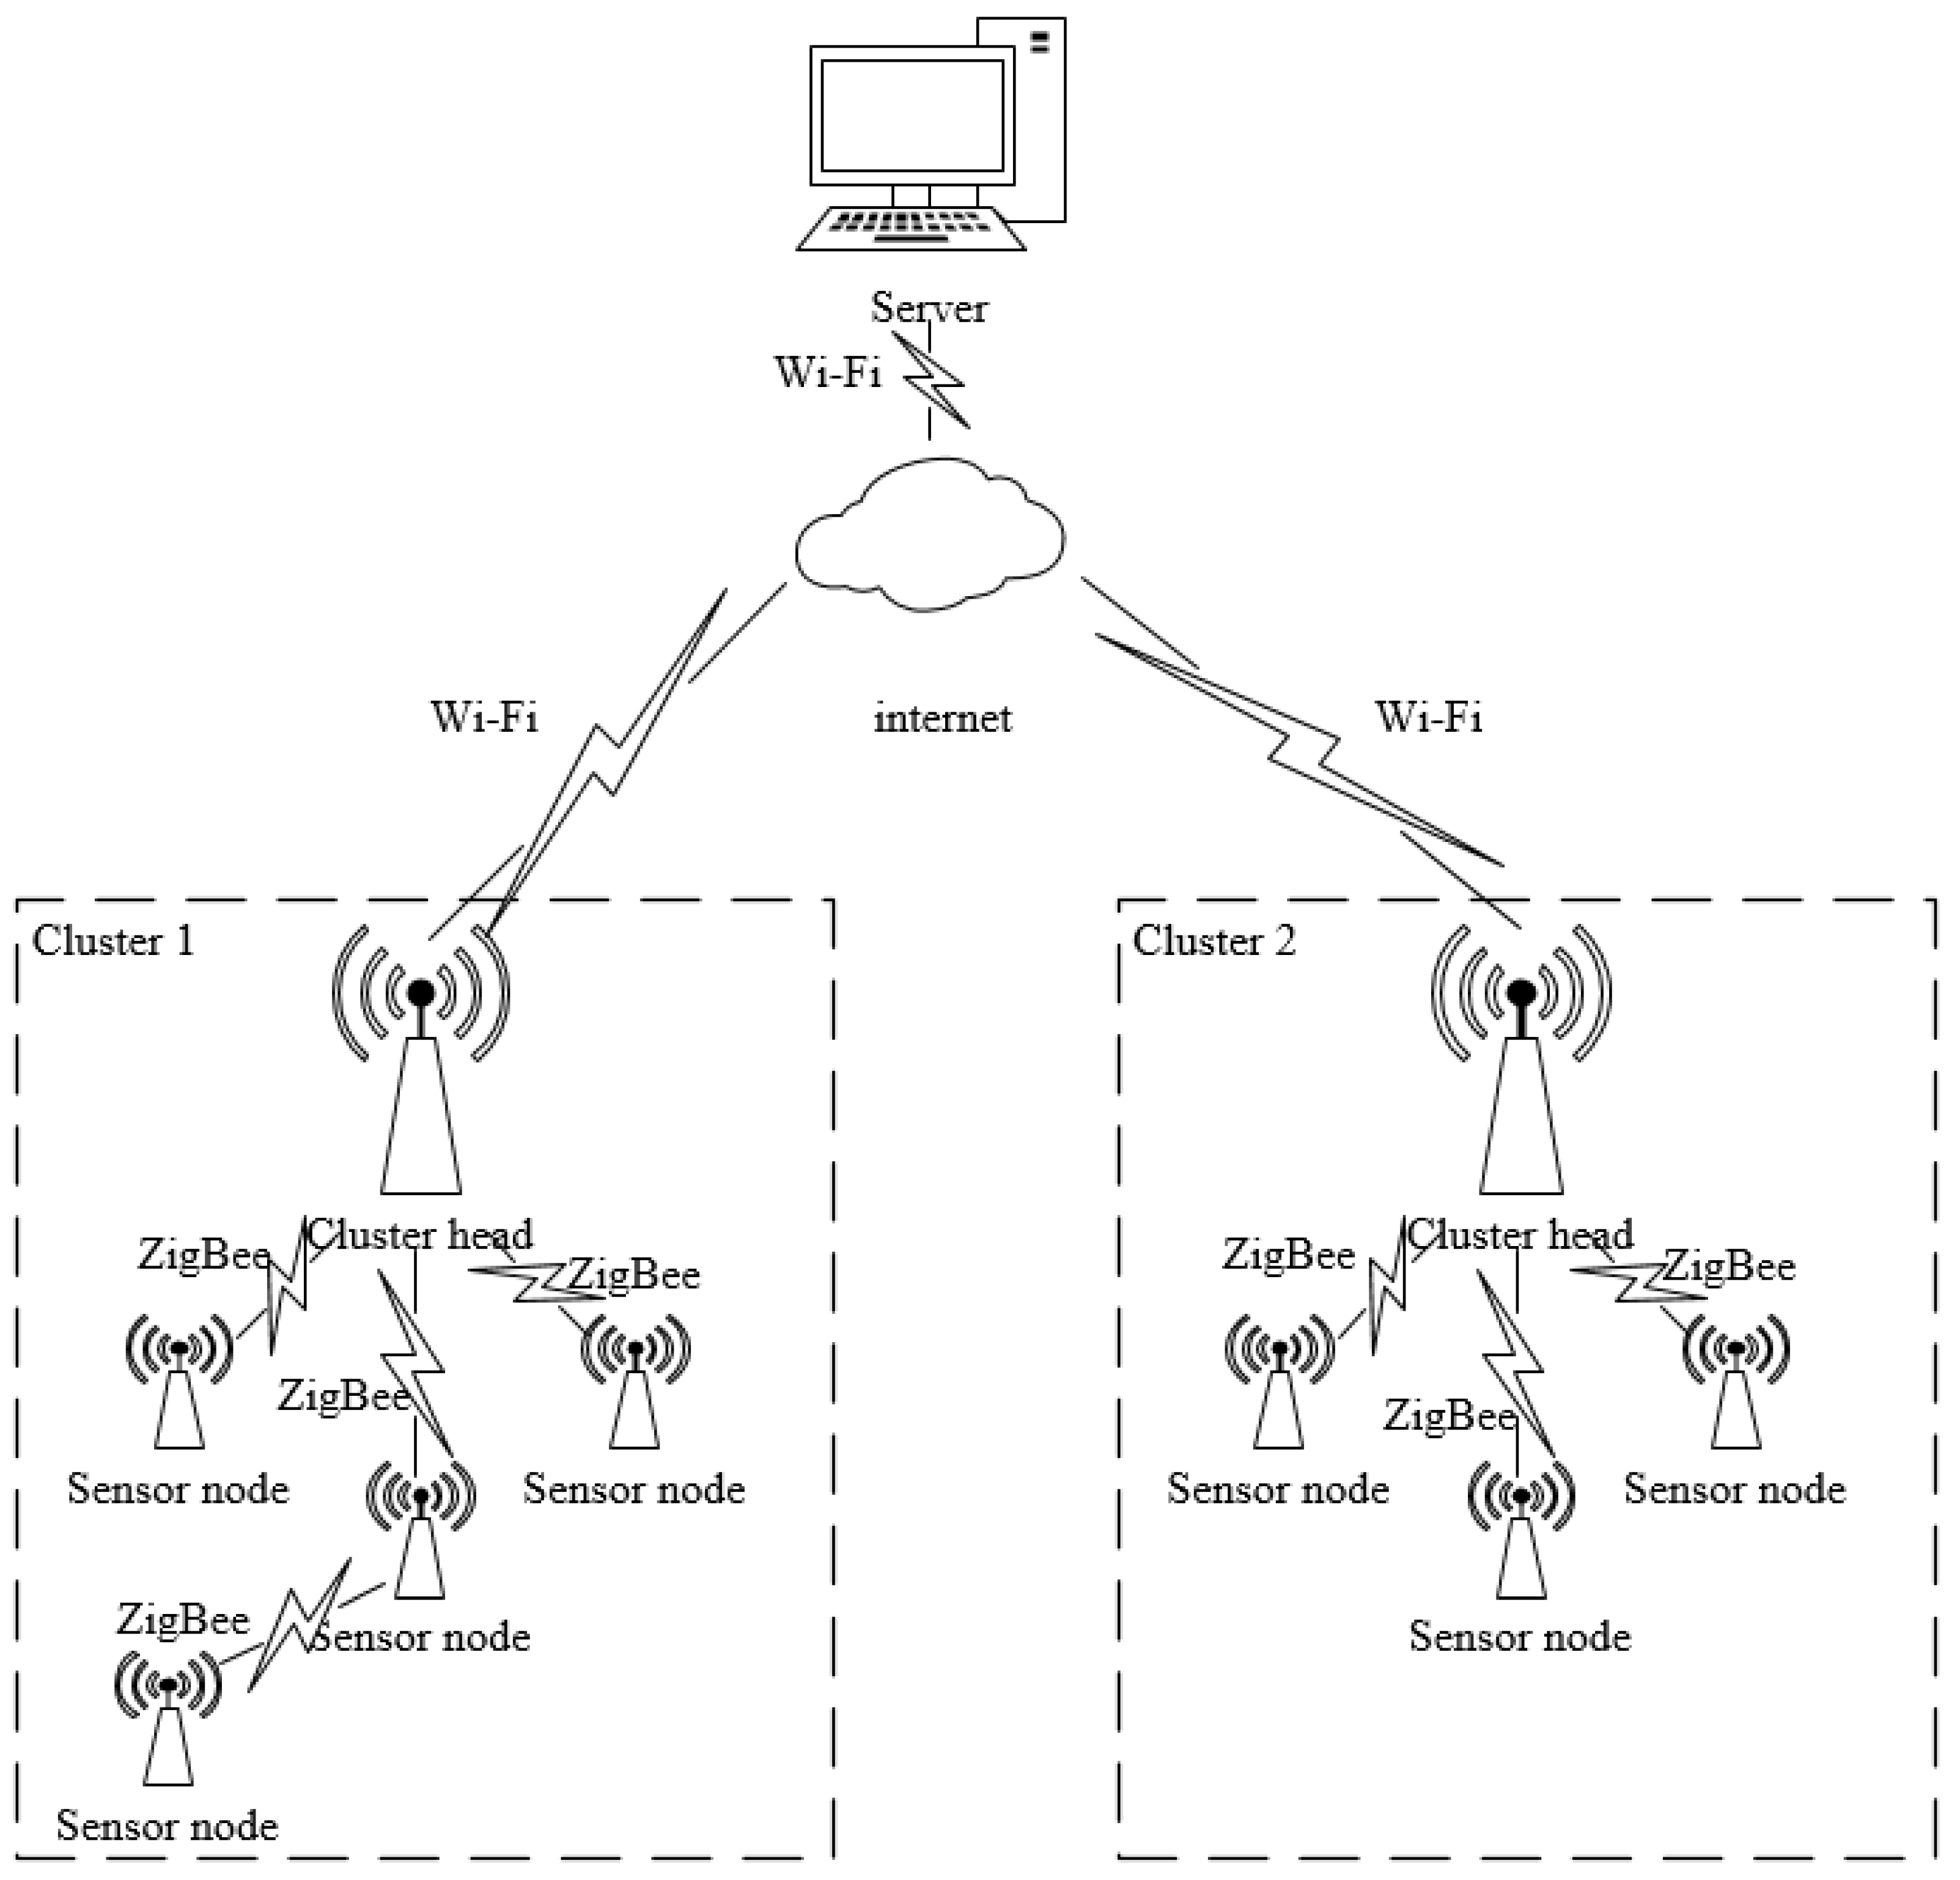
2.2. Wireless Sensor Network System Design

With the gradual expansion of greenhouse scale, large-scale greenhouses impose higher demands on wireless sensor network-based environmental monitoring systems. These requirements include improved data accuracy, enhanced network coverage, and increased network reliability. In large-scale greenhouses, the deployment of more extensive wireless sensor networks becomes necessary. However, as the network scale expands, the network structure becomes increasingly complex [2]. In this context, hybrid networks are able to provide a more flexible and scalable network connection and are therefore more suitable for environmental monitoring in large greenhouses such as plant factories [2].
The selection of wireless communication protocols is a critical factor in optimizing the performance of large-scale greenhouse wireless sensor networks. Among various wireless technologies, Wi-Fi, with its high bandwidth and long-range transmission capabilities, meets the demands of large-volume data transmission. In contrast, ZigBee, characterized by low power consumption and multi-hop mesh networking, ensures the reliable communication of low-data-rate sensor nodes, effectively mitigating signal attenuation and interference in complex greenhouse environments. Compared to these, LoRa and NB-IoT suffer from low data rates and high latency, making them unsuitable for high-frequency monitoring applications. Additionally, Bluetooth and Bluetooth Mesh have limited coverage, restricting their applicability in large-scale greenhouse network architectures. Therefore, a Wi-Fi and ZigBee hybrid network solution, with its superior adaptability, reliability, and transmission efficiency, emerges as the optimal choice for greenhouse wireless monitoring systems. This study proposes a hybrid wireless sensor network architecture based on the ZigBee and Wi-Fi communication protocols (Figure 2). This hybrid wireless sensor network consists of multiple clusters, and each cluster consists of a cluster head and multiple sensor nodes. These sensor nodes are responsible for collecting environment data and link quality indicators and executing control commands issued by the cluster head. In addition, the sensor nodes also function as relays within the network. The cluster head is responsible for aggregating the data uploaded by all sensor nodes within the cluster, and transmits these data to the server via the Internet and relays control commands issued by the server back to the sensor nodes. The cluster heads and sensor nodes within each cluster transmit data and commands to each other through the ZigBee communication protocol. Data and commands are exchanged between the cluster head and the server through the Wi-Fi communication protocol.

2.3. Link Quality Prediction Model Development

2.3.1. Link Quality Estimator Selection

In the link layer metrics, packet reception rate (PRR) is one of the key indicators for assessing the quality of network links and can directly reflect the current status of the link. However, it is less flexible due to the long time required to obtain the PRR, which makes it impossible to estimate the link quality quickly [7]. The physical layer metric, the received signal strength indicator (RSSI), cannot distinguish between links with moderate and poor quality but is capable of quickly and accurately identifying high-quality links [31]. In order to quickly obtain the communication radius of nodes with good link quality, this study uses RSSI as a link quality estimator.
Signal attenuation occurs during wireless signal propagation in the channel due to increasing transmission distance and the presence of obstacles in practical scenarios. This signal attenuation affects the received power at the receiver, so the total path loss power PLtotal can be expressed as the sum of the transmitted power Ptx, transmitter antenna gain Gtx, and receiver antenna gain Gtx, less the received power Prx, as shown in Equation (1).
P L t o t a l = ( P t x + G t x + G r x ) P r x
When the transmit power Ptx is 0 dB, the total path loss power PLtotal is defined as the negative of the received signal strength indicator (RSSI), as shown in Equation (2).
P L t o t a l = R S S I

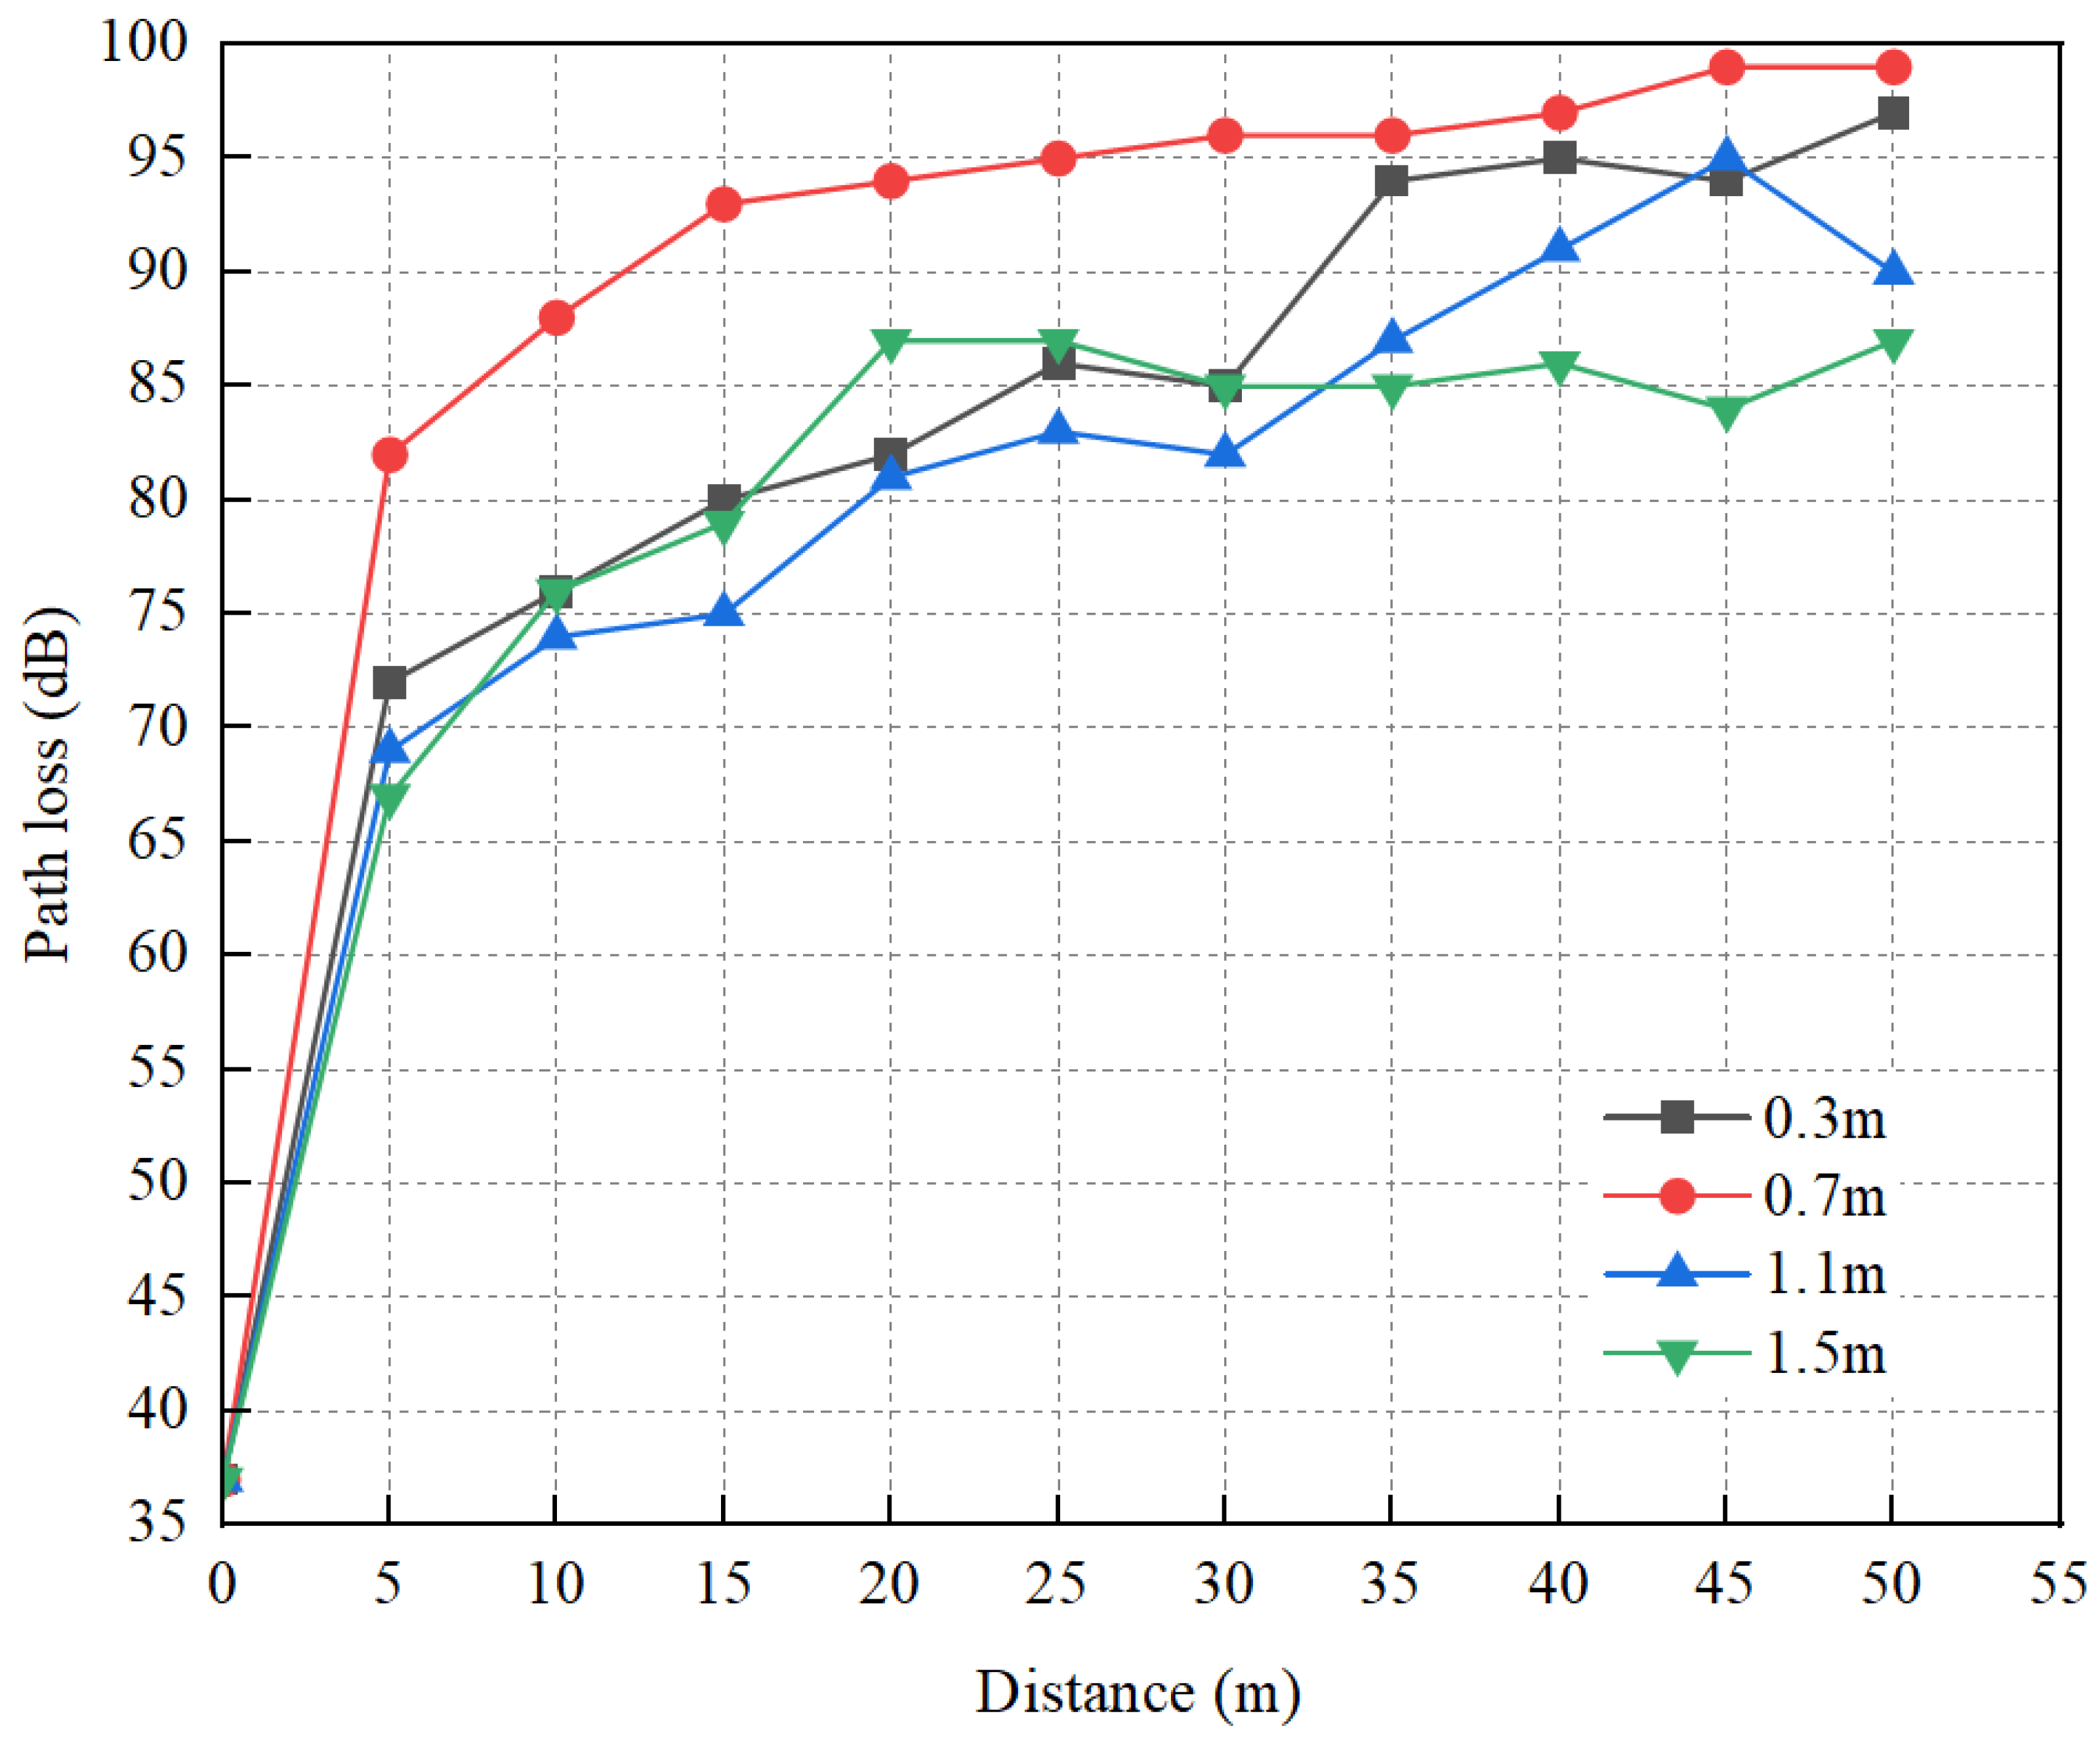
2.3.2. Link Quality Data Acquisition

One set of four nodes was placed as receivers at 5 m intervals from 0 m to 50 m horizontally, and the height of the receivers from the ground was 0.3 m, 0.7 m, 1.1 m, and 1.5 m, respectively. One set of four nodes was placed at the 0 m position horizontally to serve as transmitters, with respective heights of 0.3 m, 0.7 m, 1.1 m, and 1.5 m above the ground. RSSI measurements were performed by using the CC2530, a low-power wireless communication chip developed by Texas Instruments (Dallas, TX, USA), which used the ZigBee wireless communication protocol based on the IEEE 802.15.4 standard. The RSSI value for each node was recorded 20 times, and the average value was used to calculate the path loss according to Equations (1) and (2). The main hardware parameters of the experiment were set as shown in Table 1.

2.3.3. Accuracy Test of Link Quality Prediction Model

To evaluate the accuracy of the link quality prediction model, the coefficient of determination (R2) was calculated to assess the explanatory power of the independent variable of inter-node distance on the dependent variable of path loss. Nonlinear curve fitting was performed using OriginPro software (version 2022, OriginLab Corporation, Northampton, MA, USA). The expression for R2 was calculated as
R 2 = 1 i = 1 n y i y i 2 i = 1 n y i y 2
where y i is the actual measurement of the path loss of the dependent variable, y i is the predicted value of the model, y is the mean value of the path loss of the dependent variable, and n is the sample size.

2.4. Network Coverage Optimization Model Development

2.4.1. PSO Algorithm

Coverage optimization in WSN is a critical issue that directly influences network performance. Among various optimization approaches, heuristic algorithms have attracted significant attention due to their effectiveness in addressing complex, high-dimensional, and nonlinear problems. In this study, the particle swarm optimization (PSO) algorithm was chosen, as it exploits the collaborative and competitive behaviors observed in biological swarms to identify optimal solutions through iterative evolution, thereby achieving global optimization objectives [32]. Compared with heuristic optimization algorithms such as ant colony optimization (ACO), the genetic algorithm (GA), and differential evolution (DE), the particle swarm optimization (PSO) algorithm incorporates fewer stochastic components during the iterative evolution process. Consequently, it exhibits superior memory performance, faster convergence to optimal solutions, and advantages such as a simpler structure and higher convergence speed.
When N particles solve the D dimensional problem, the swarm can be described as
x i = ( x i 1 , x i 2 , , x i D ) , i = 1 , 2 , , N v i = ( v i 1 , v i 2 , , v i D ) , i = 1 , 2 , , N P b e s t = ( P b e s t 1 , P b e s t 2 , , P b e s t D ) G b e s t = ( G b e s t 1 , G b e s t 2 , , G b e s t D )
where i denotes the number of the particle, D is the dimension of the solution problem, vi = [vi1, vi2, …, viD] denotes the velocity vector of each particle, and xi = [xi1, xi2, …, xiD] denotes the position vector of each particle. The algorithm also requires that each particle maintains a historical optimal position solution for the population to which it belongs, denoted by Pbest. In addition, all populations jointly maintain a globally optimal solution, denoted by Gbest. The steps of the PSO algorithm are described as follows:
Step 1: It Initializes the velocities and positions of all particles and sets the individual’s historical optimal solution Pbest as the current position and the individual of the population optimal solution as the current Gbest.
Step 2: In each generation of evolution, it calculates the fitness function value for each particle.
Step 3: If the current fitness function value of the particle is better than its historical optimal solution, then the historical optimal solution is replaced by the current position.
Step 4: If the historical optimal solution of the particle is better than the global optimal solution, then the global optimal solution is replaced by the historical optimal solution of the particle.
Step 5: The velocity and position in the Dth dimension of each particle i is updated as
x i D ( k + 1 ) = x i D ( k ) + v i D ( k + 1 ) v i D ( k + 1 ) = ω × v i D ( k + 1 ) + c 1 × r 1 × ( P b e s t D ( k ) x i D ( k ) ) + c 2 × r 2 × ( G b e s t D ( k ) x i D ( k ) )
where ω is the inertia weight; k is the number of iterations; c1 and c2 represent the acceleration coefficients for the individual and the population, respectively; r1 and r2 are two random numbers on the interval [0,1]; and xiD(k) and viD(k) represent the position and velocity of the particle i in the D dimension in the kth iteration, respectively.
In addition, PSO requires the use of a constant Vmax to limit the velocity range of particles so that v i D V max , V max .
Step 6: If the termination condition is satisfied, it outputs Gbest and ends the process. Otherwise, it repeats steps 2–5.
Table 2 lists the parameter settings of the PSO algorithm for network coverage optimization.

2.4.2. Model Evaluation Indicators

In the network coverage optimization model, the area to be monitored can be considered as consisting of countless grid points (xi,yi). The coverage ratio (CR) represents the ratio of the total number of grid points within the node’s sensing range to the total number of grid points within the area to be monitored, calculated as Equation (6). A larger CR indicates a larger percentage of the area monitored by the wireless sensor network.
C R = i = 1 n ( x i , y i ) i = 1 m ( x i , y i ) × 100 %
where (xi,yi) is the grid point coordinates, n is the total number of grid points within the sensing range of the node, and m is the total number of grid points in the area to be monitored.
The overlap rate (OR) indicates the ratio of the total number of grid points in the overlapping area of the node’s sensing range to the total number of grid points in the area to be monitored, calculated as Equation (7). A smaller OR indicates a more even distribution of nodes, less redundancy, and fewer wasted nodes.
O R = i = 1 k ( x i , y i ) i = 1 m ( x i , y i ) × 100 %
where (xi,yi) is the grid point coordinates, k is the total number of grid points within the overlapping area of the node sensing range, and m is the total number of grid points within the area to be monitored.

2.5. Design of Reliable Cluster Routing Protocols

2.5.1. K-Means Algorithm

Clustering is a critical technique for enhancing the performance of a WSN. Among various clustering algorithms, the K-means algorithm is widely recognized for its simplicity, computational efficiency, and effectiveness in partitioning sensor nodes into optimal clusters. The K-means algorithm is an unsupervised machine learning algorithm for cluster analysis [33]. The K-means clustering algorithm divides n points into artificially specified K clusters according to the magnitude of the Euclidean distance between each point to the K centers of mass, and each point belongs to the cluster corresponding to the center of mass with the closest Euclidean distance. The Euclidean distance is calculated as
d = ( x i x j ) 2 + ( y i y j ) 2
where (xi,yi) is the coordinates of the ith sensor node and (xi,yi) is the coordinates of the jth center of mass, i.e., cluster head.
For the K-means clustering algorithm’s process, K points were randomly selected as the initial centers of mass and the Euclidean distances from the points to each center of mass were compared. When each point was classified to the center of mass with the closest Euclidean distance, the initial K clusters were formed at this point. The Euclidean distance from each point to each center of mass was computed and the points were reassigned to the cluster with the closest distance, and the center of mass of each cluster was re-selected based on the existing points in the cluster. The process was repeated until some termination condition was satisfied, which could be any of the following:
(1)
No points were reassigned to different clusters;
(2)
No center of mass changed again;
(3)
The sum of squared errors was minimized locally.

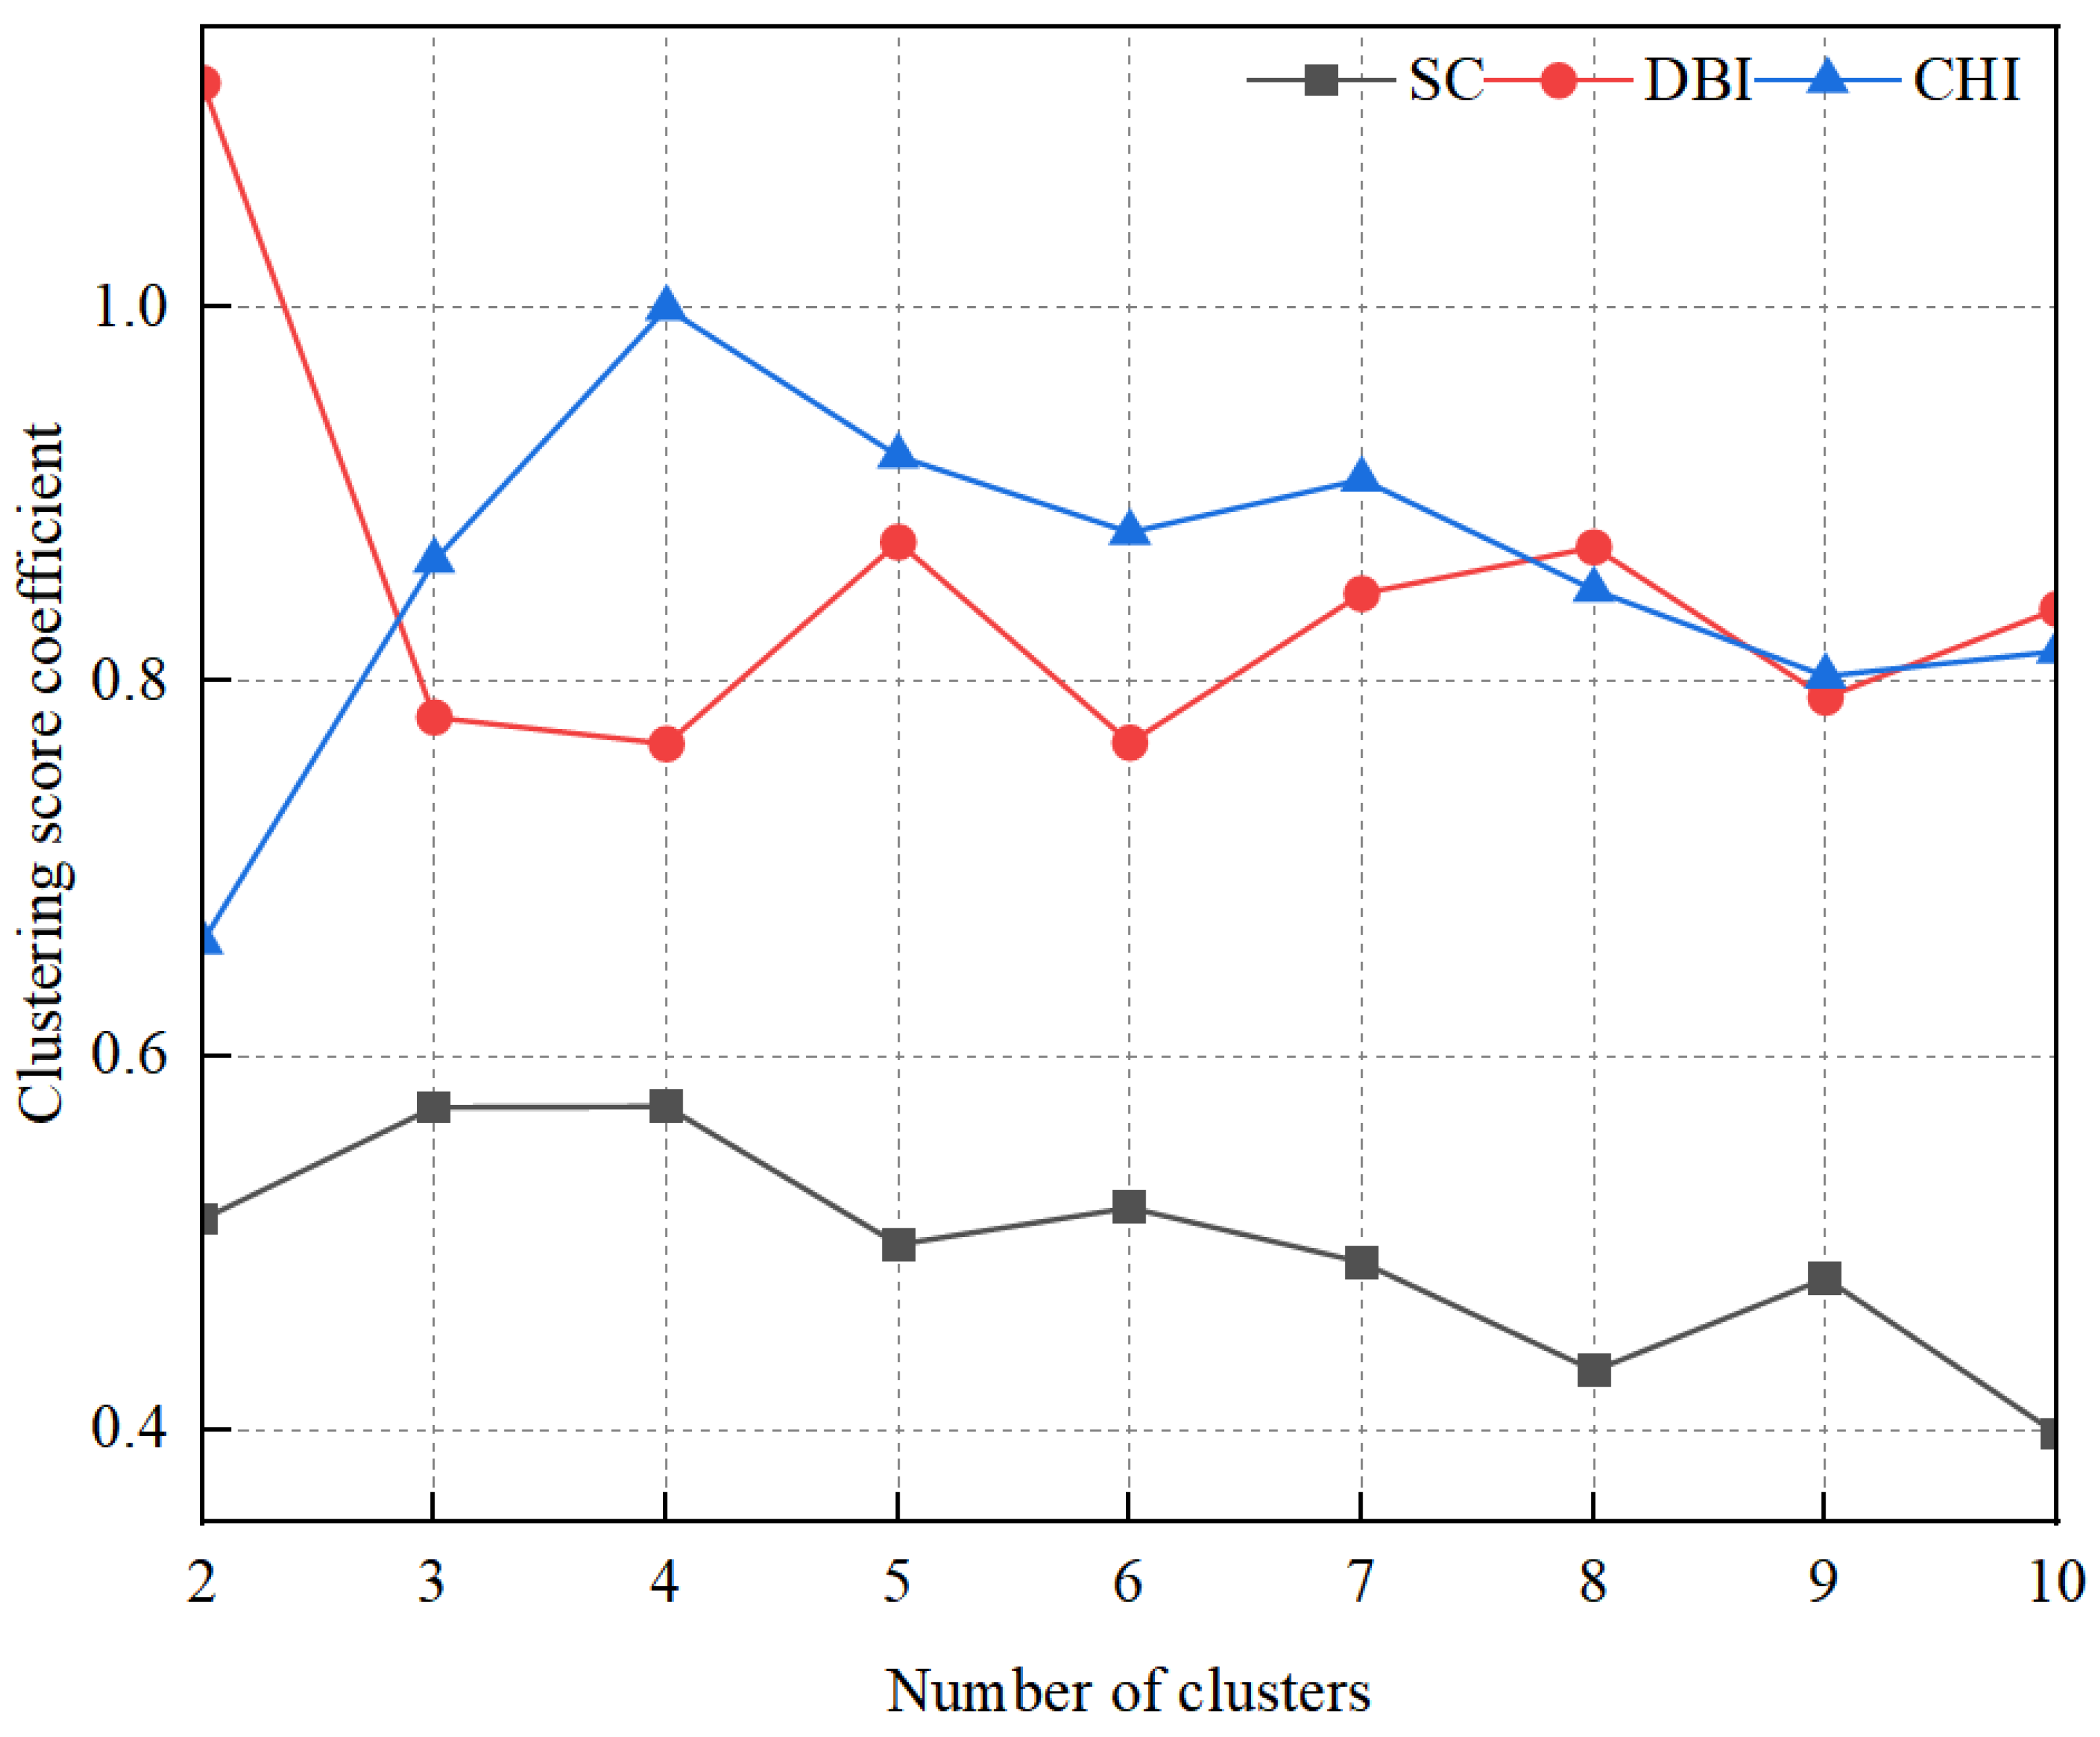
2.5.2. Evaluation Indicators

In order to obtain the optimal number of clusters, the quality of the clustering results was comprehensively assessed by using three evaluation metrics: the Davies–Bouldin Index (DBI), Calinski–Harabasz Index (CHI), and Silhouette Coefficient (SC). Calculations for the DBI, CHI, and SC are shown as Equations (9)–(11).
D B I = 1 k i = 1 k m a x j i S i + S j d i j
where k is the total number of clusters, Si is the average distance between points in the ith cluster and its center of mass, Sj is the average distance between points in the jth cluster and its center of mass, and dij is the Euclidean distance between the center of mass in the ith cluster and the center of mass in the jth cluster. The smaller the DBI is, the better the clustering effect.
C H I = i = 1 k C i × c i c 2 i = 1 k x C i x c i 2 × N k k 1
where k is the total number of clusters, N is the total number of samples, C i is the number of samples in cluster i, ci is the center of mass of cluster i, c is the center of mass of the total samples, and c i c 2 is the squared Euclidean distance between the center of mass of cluster i and the center of mass of the total samples. The larger the CHI, the better the clustering performance.
S C = b a m a x ( a , b )
where a is the average distance from sample i to all other samples in its cluster, and b is the average distance from sample i to all samples in the other cluster closest to it. The value of SC ranges [−1,1], and the closer SC is to 1, the better the clustering effect.
The operating platform for the simulation experiments comprised an Intel(R) Core(TM) i7-8550 CPU, 16 GB of RAM, and a Windows 10 system with source code running on MATLAB (R2022b, MathWorks, Natick, MA, USA).

3. Results and Discussions

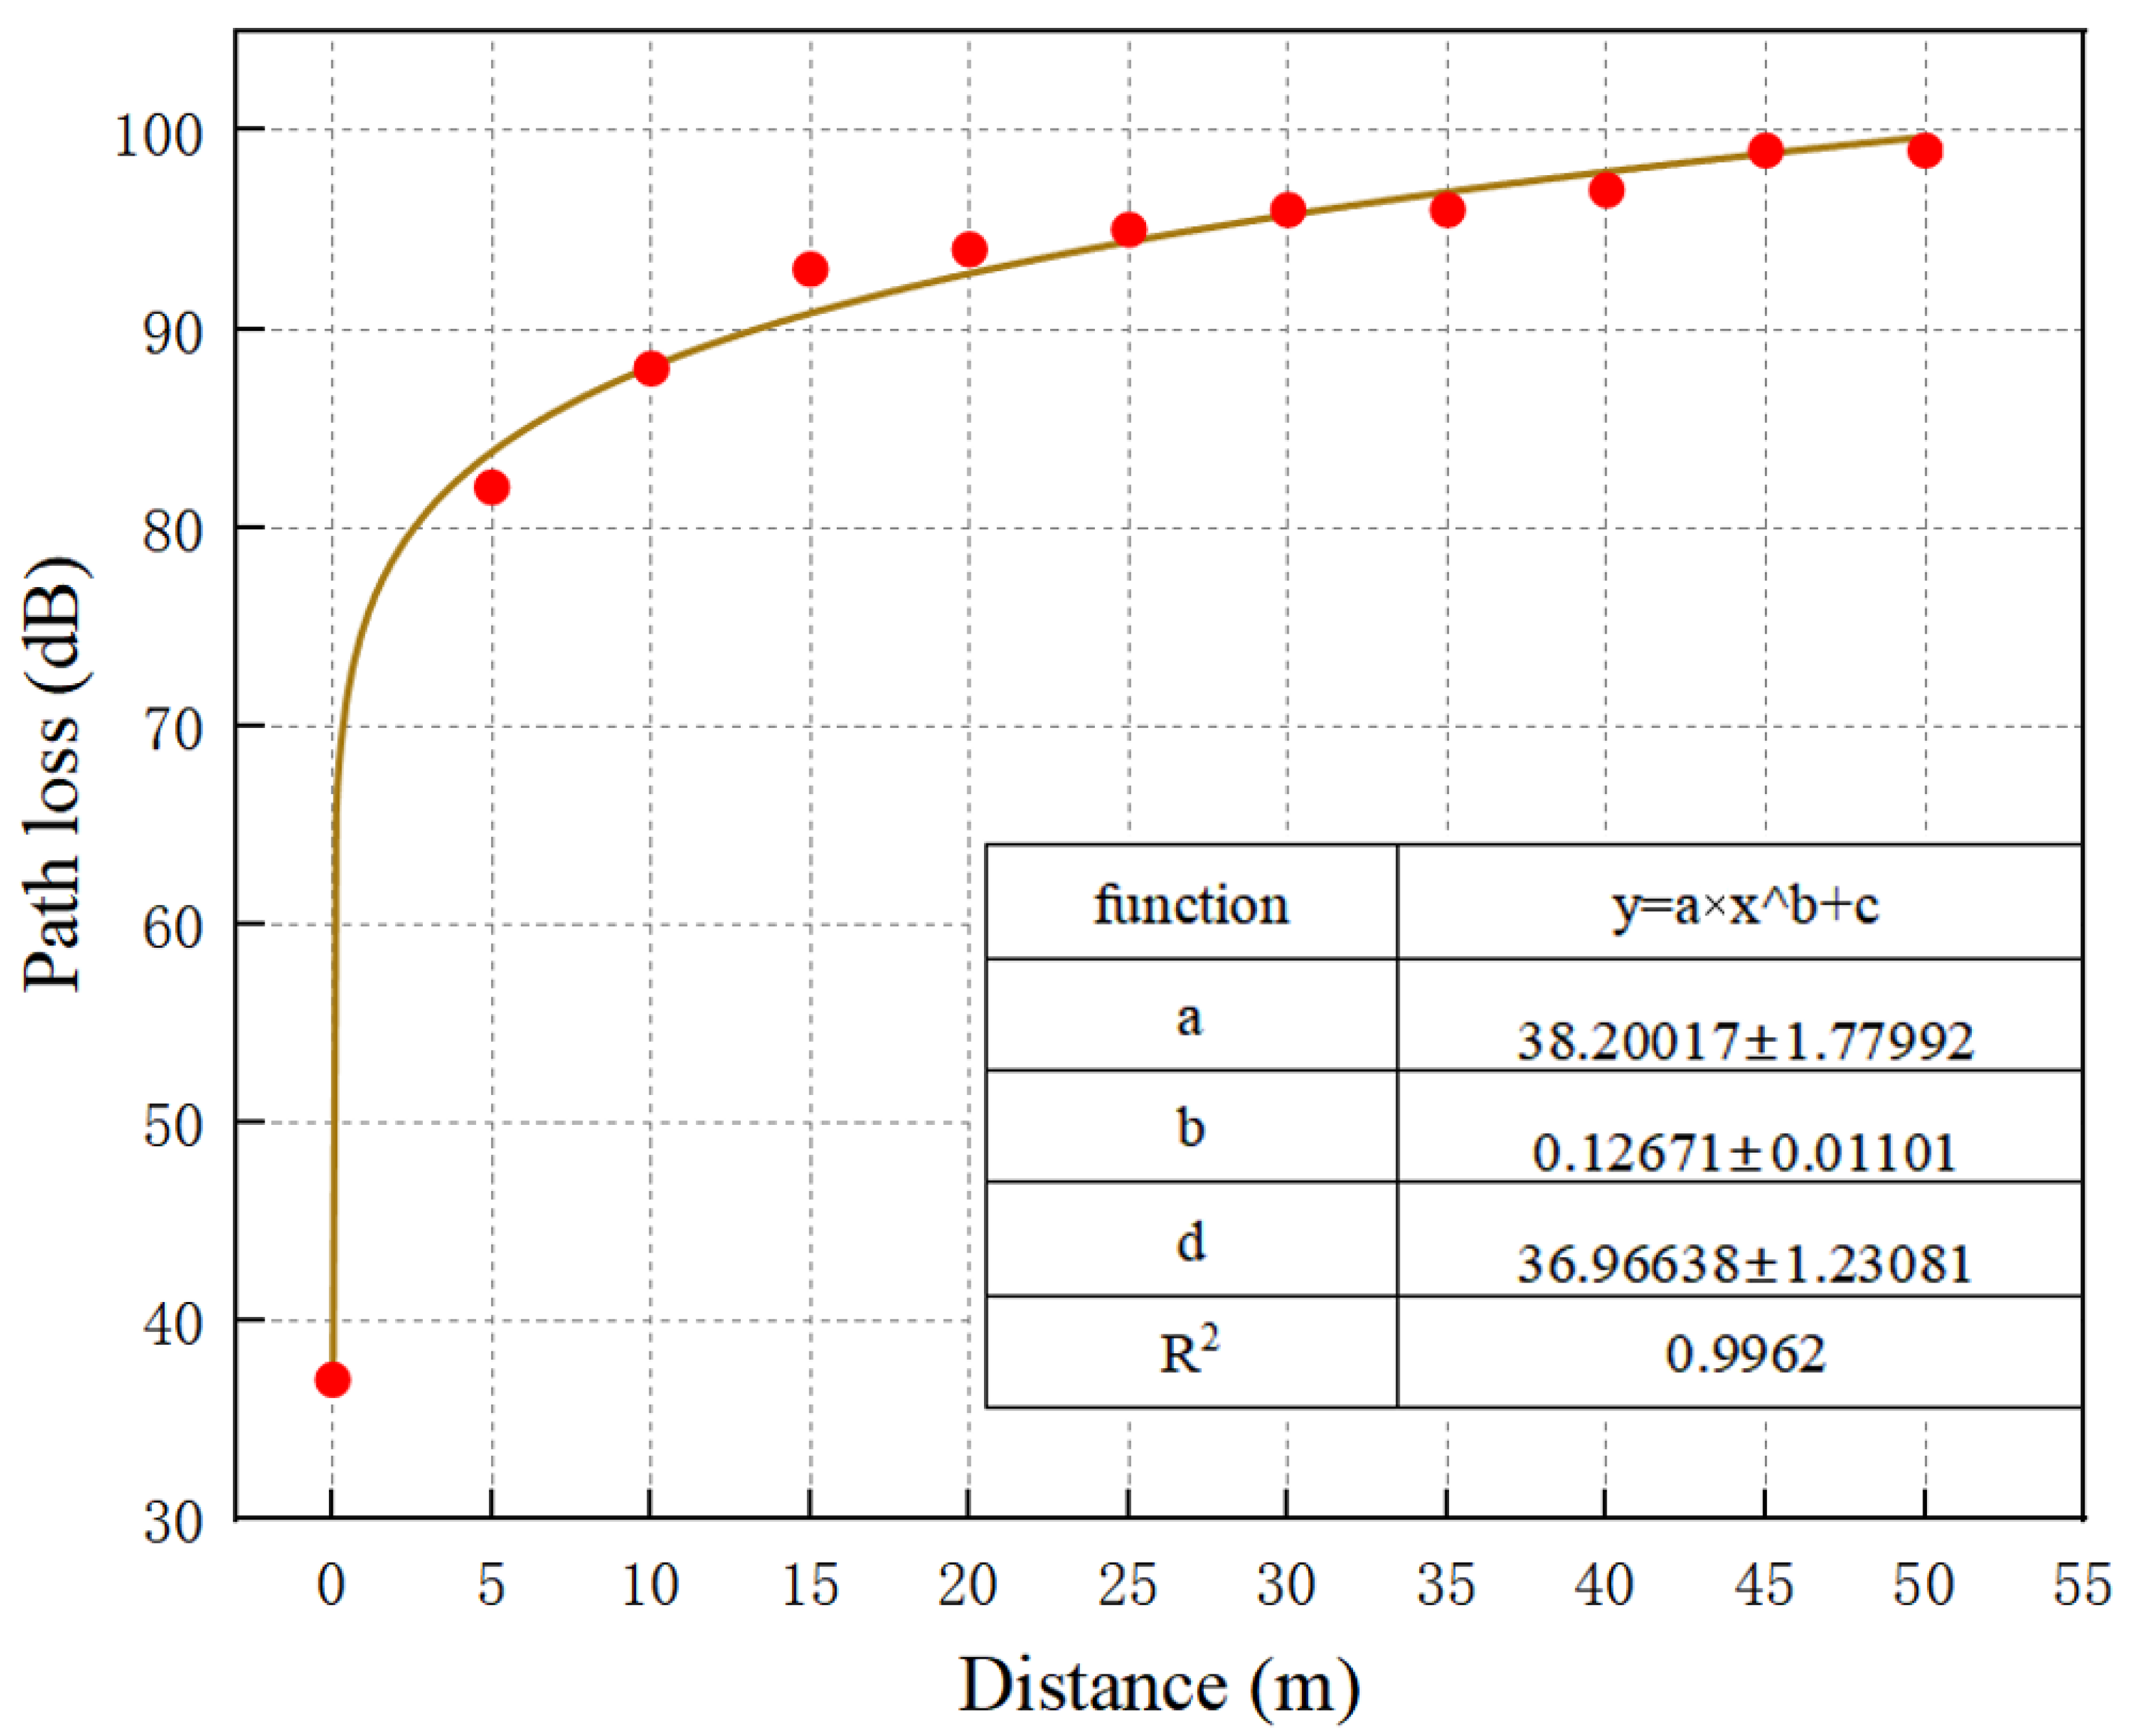
3.1. Analysis of Link Quality Prediction Model Results

From the link quality tests at different heights, as the distance increased, the path loss increased (Figure 3). Among these four heights, 0.7 m had the greatest impact on link quality, which was likely due to the interference from agricultural facilities and vegetation, as the height of cultivation beds was 0.7 m. Within the first 15 m, path loss increased relatively rapidly from 37 dB to 93 dB (151% increase) compared to the path loss increase from 93 dB to 99 dB (6% increase) as the distance increasing from 15 m to 50 m. To ensure the reliability of the wireless sensor network (WSN) strategy, this study focused on optimizing the system’s configuration. A node height of 0.7 m was selected as the appropriate setup. This configuration aimed to ensure that environmental monitoring data accurately reflect the current growth status and environmental conditions of the plants. Based on this setup, the reliability of the WSN in the plant factory was thoroughly studied and analyzed.
Generic functional form was applied to fit the correlation between path loss and distance, and the functional expression of the link quality prediction model is y = ( 38.20017 ) x 0.12671 + 36.96638 , as shown in Figure 4. The coefficient of determination (R2) is 0.9962, indicating that the proposed link quality prediction model can accurately predict the path loss based on inter-node distance. This model can be effectively applied to subsequent network coverage optimization strategies and the design of clustering-based routing protocols.
The study on the statistical analysis of link quality metrics conducted by Xu et al. [31] demonstrated that the physical layer metric RSSI was able to effectively identify high-quality links. The findings indicated that the average RSSI value of high-quality links had an at least 80% probability of being less than −88 dB, whereas the average RSSI values of medium- and poor-quality links were all greater than −88 dB. Therefore, the link quality prediction model developed in this study considered the inter-node communication distance with path loss less than 88 dB as a good quality link. Communication links with a distance of less than 10 m between nodes were considered to be of good quality based on the link quality prediction model.

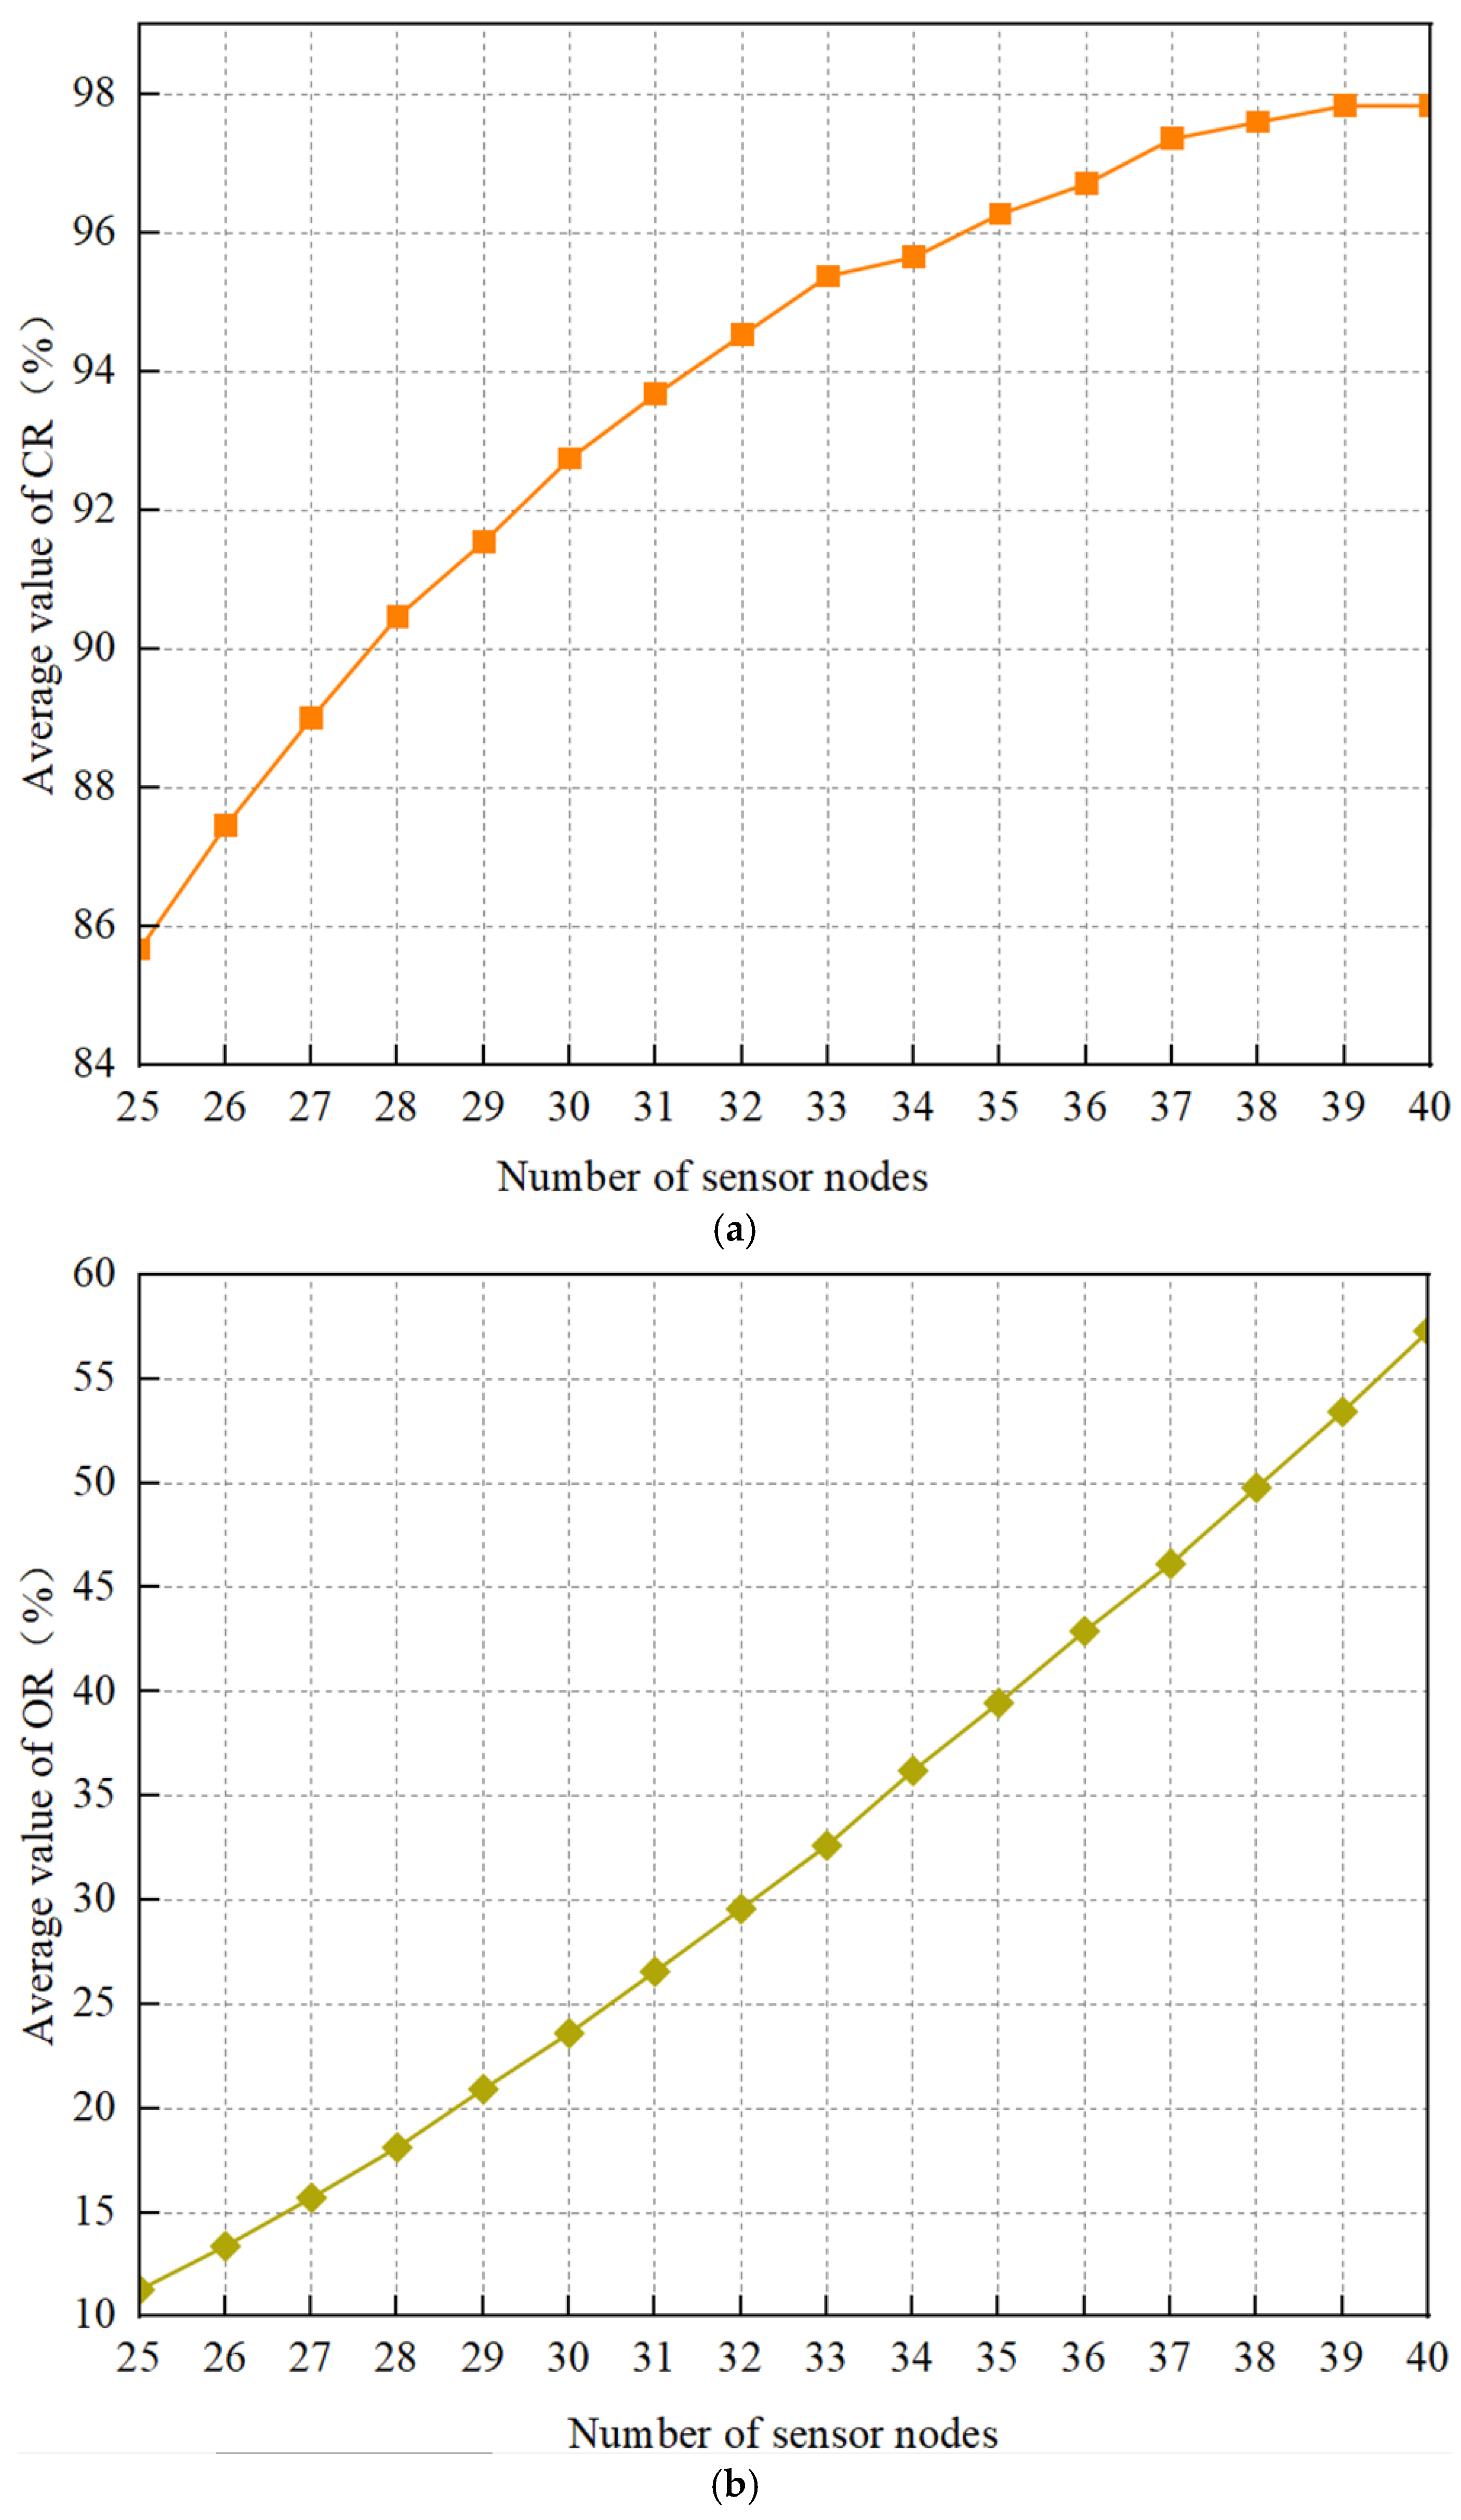
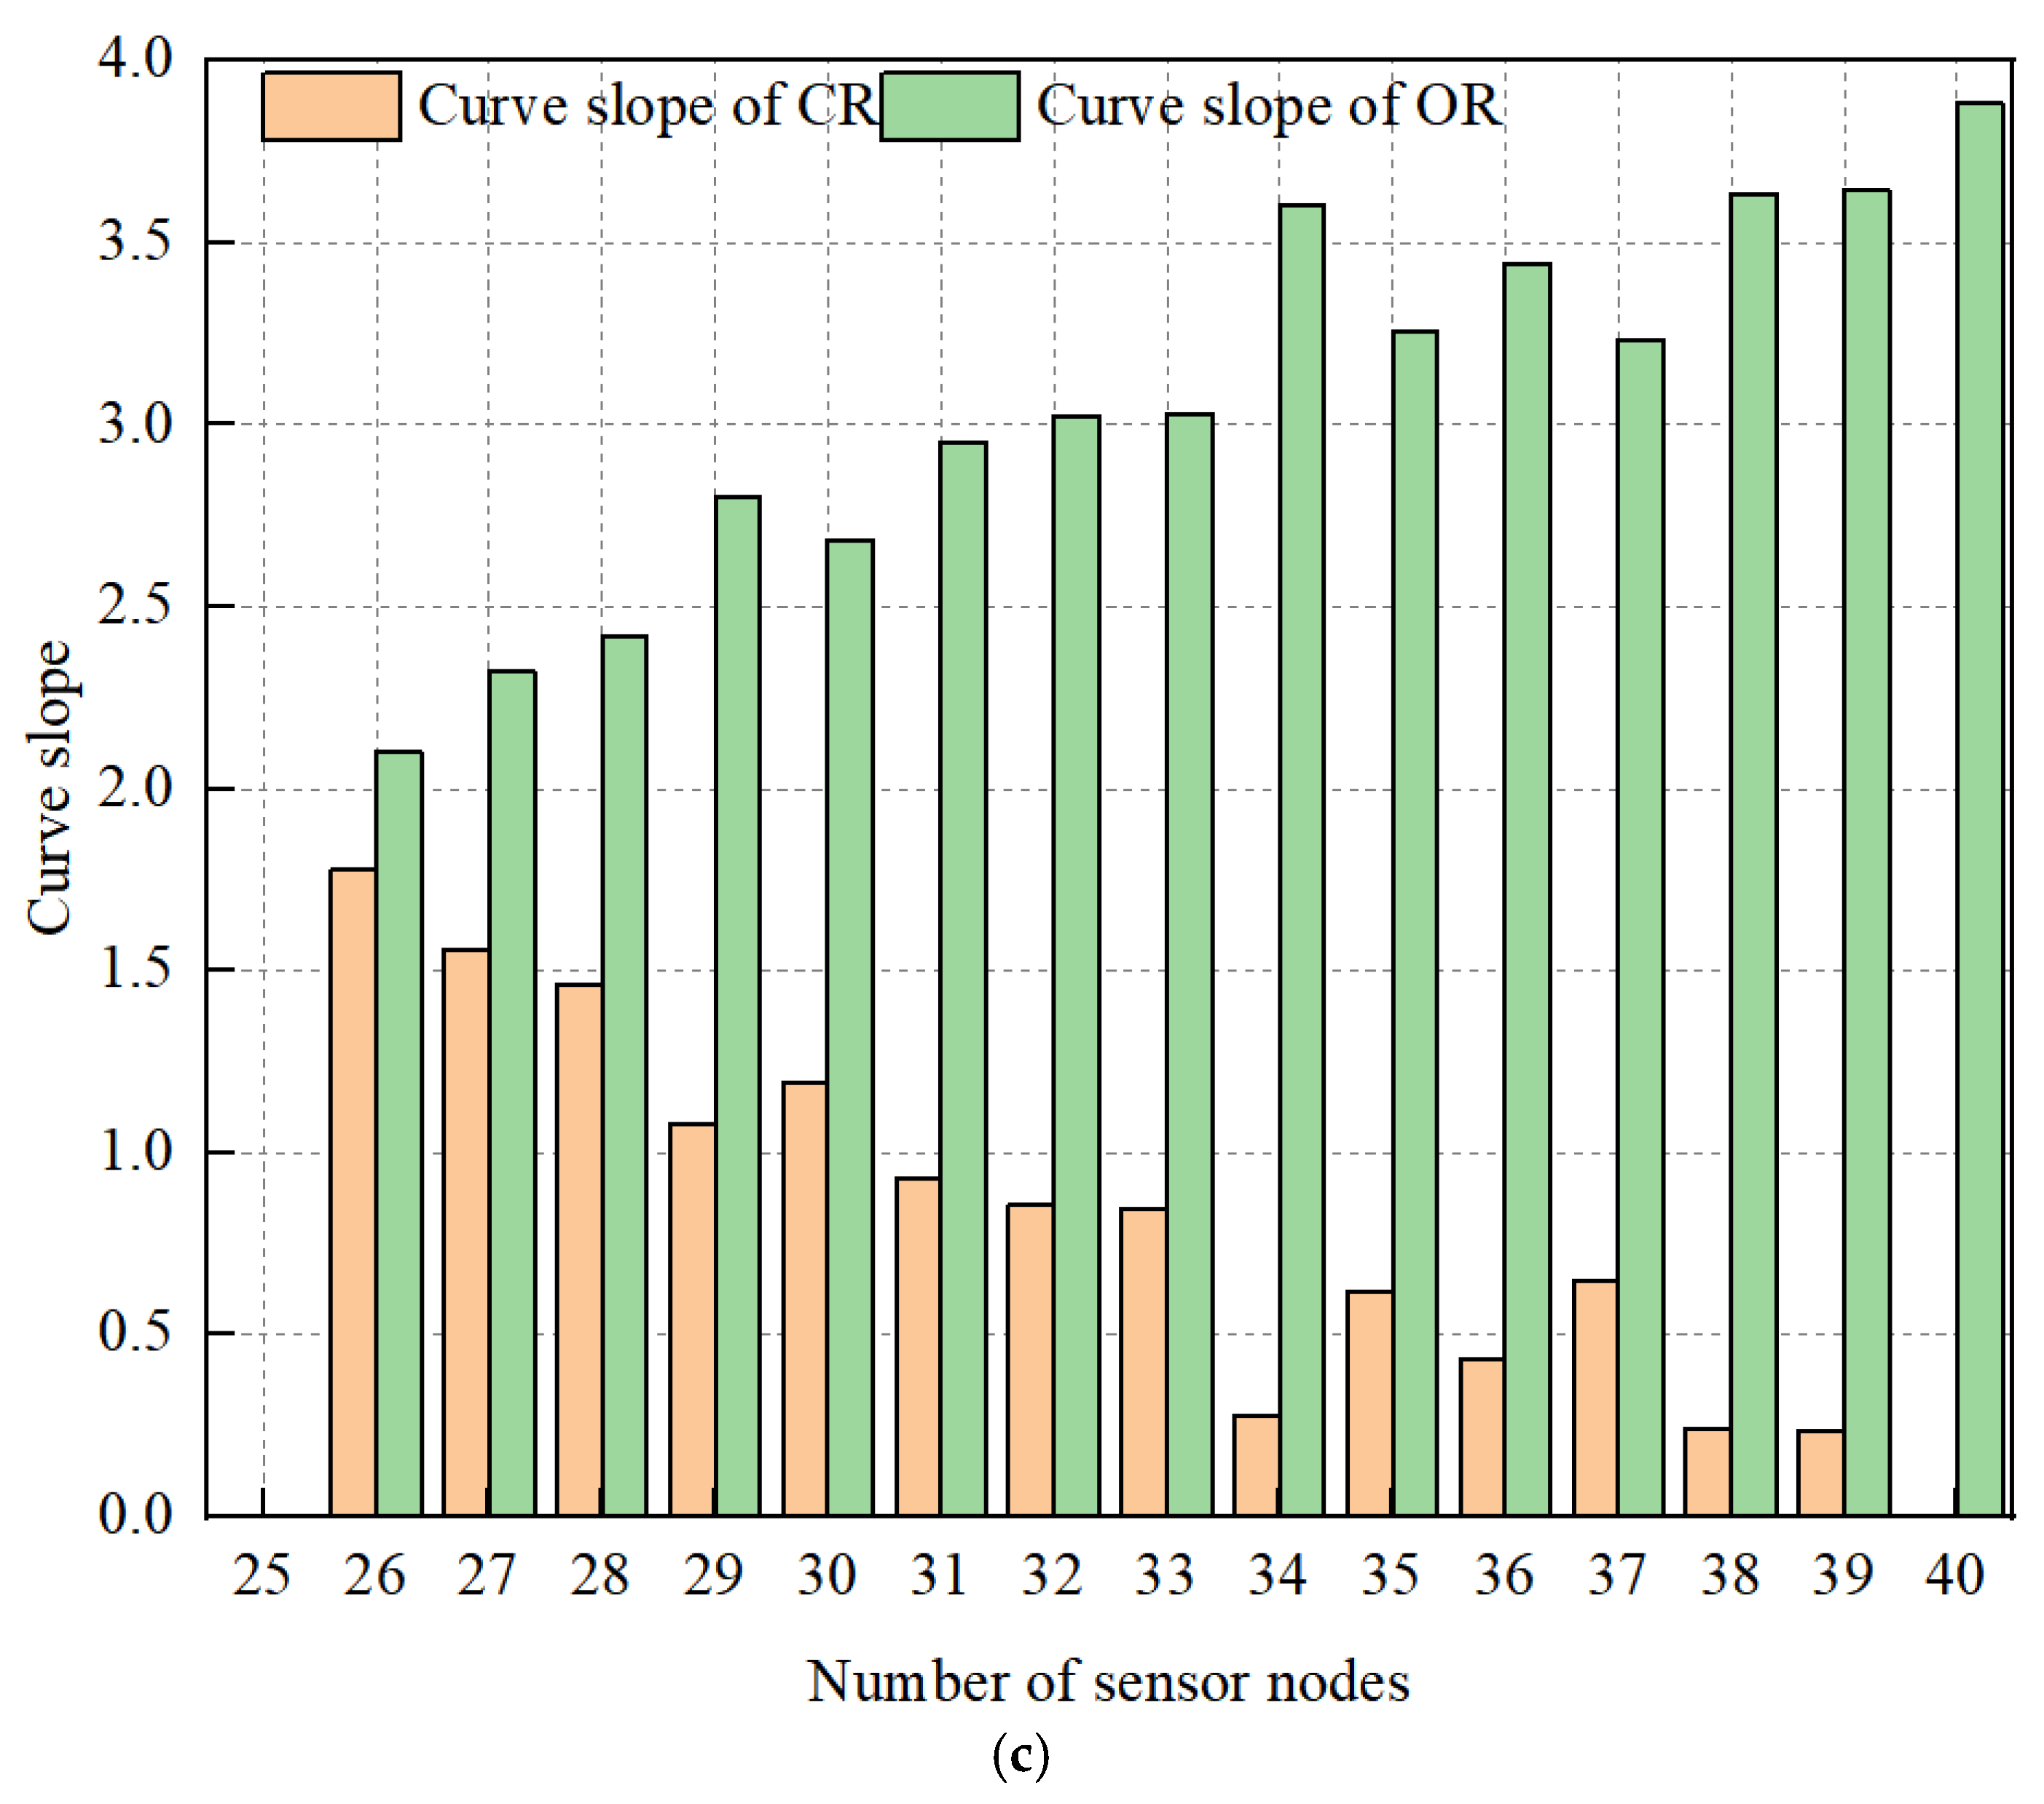
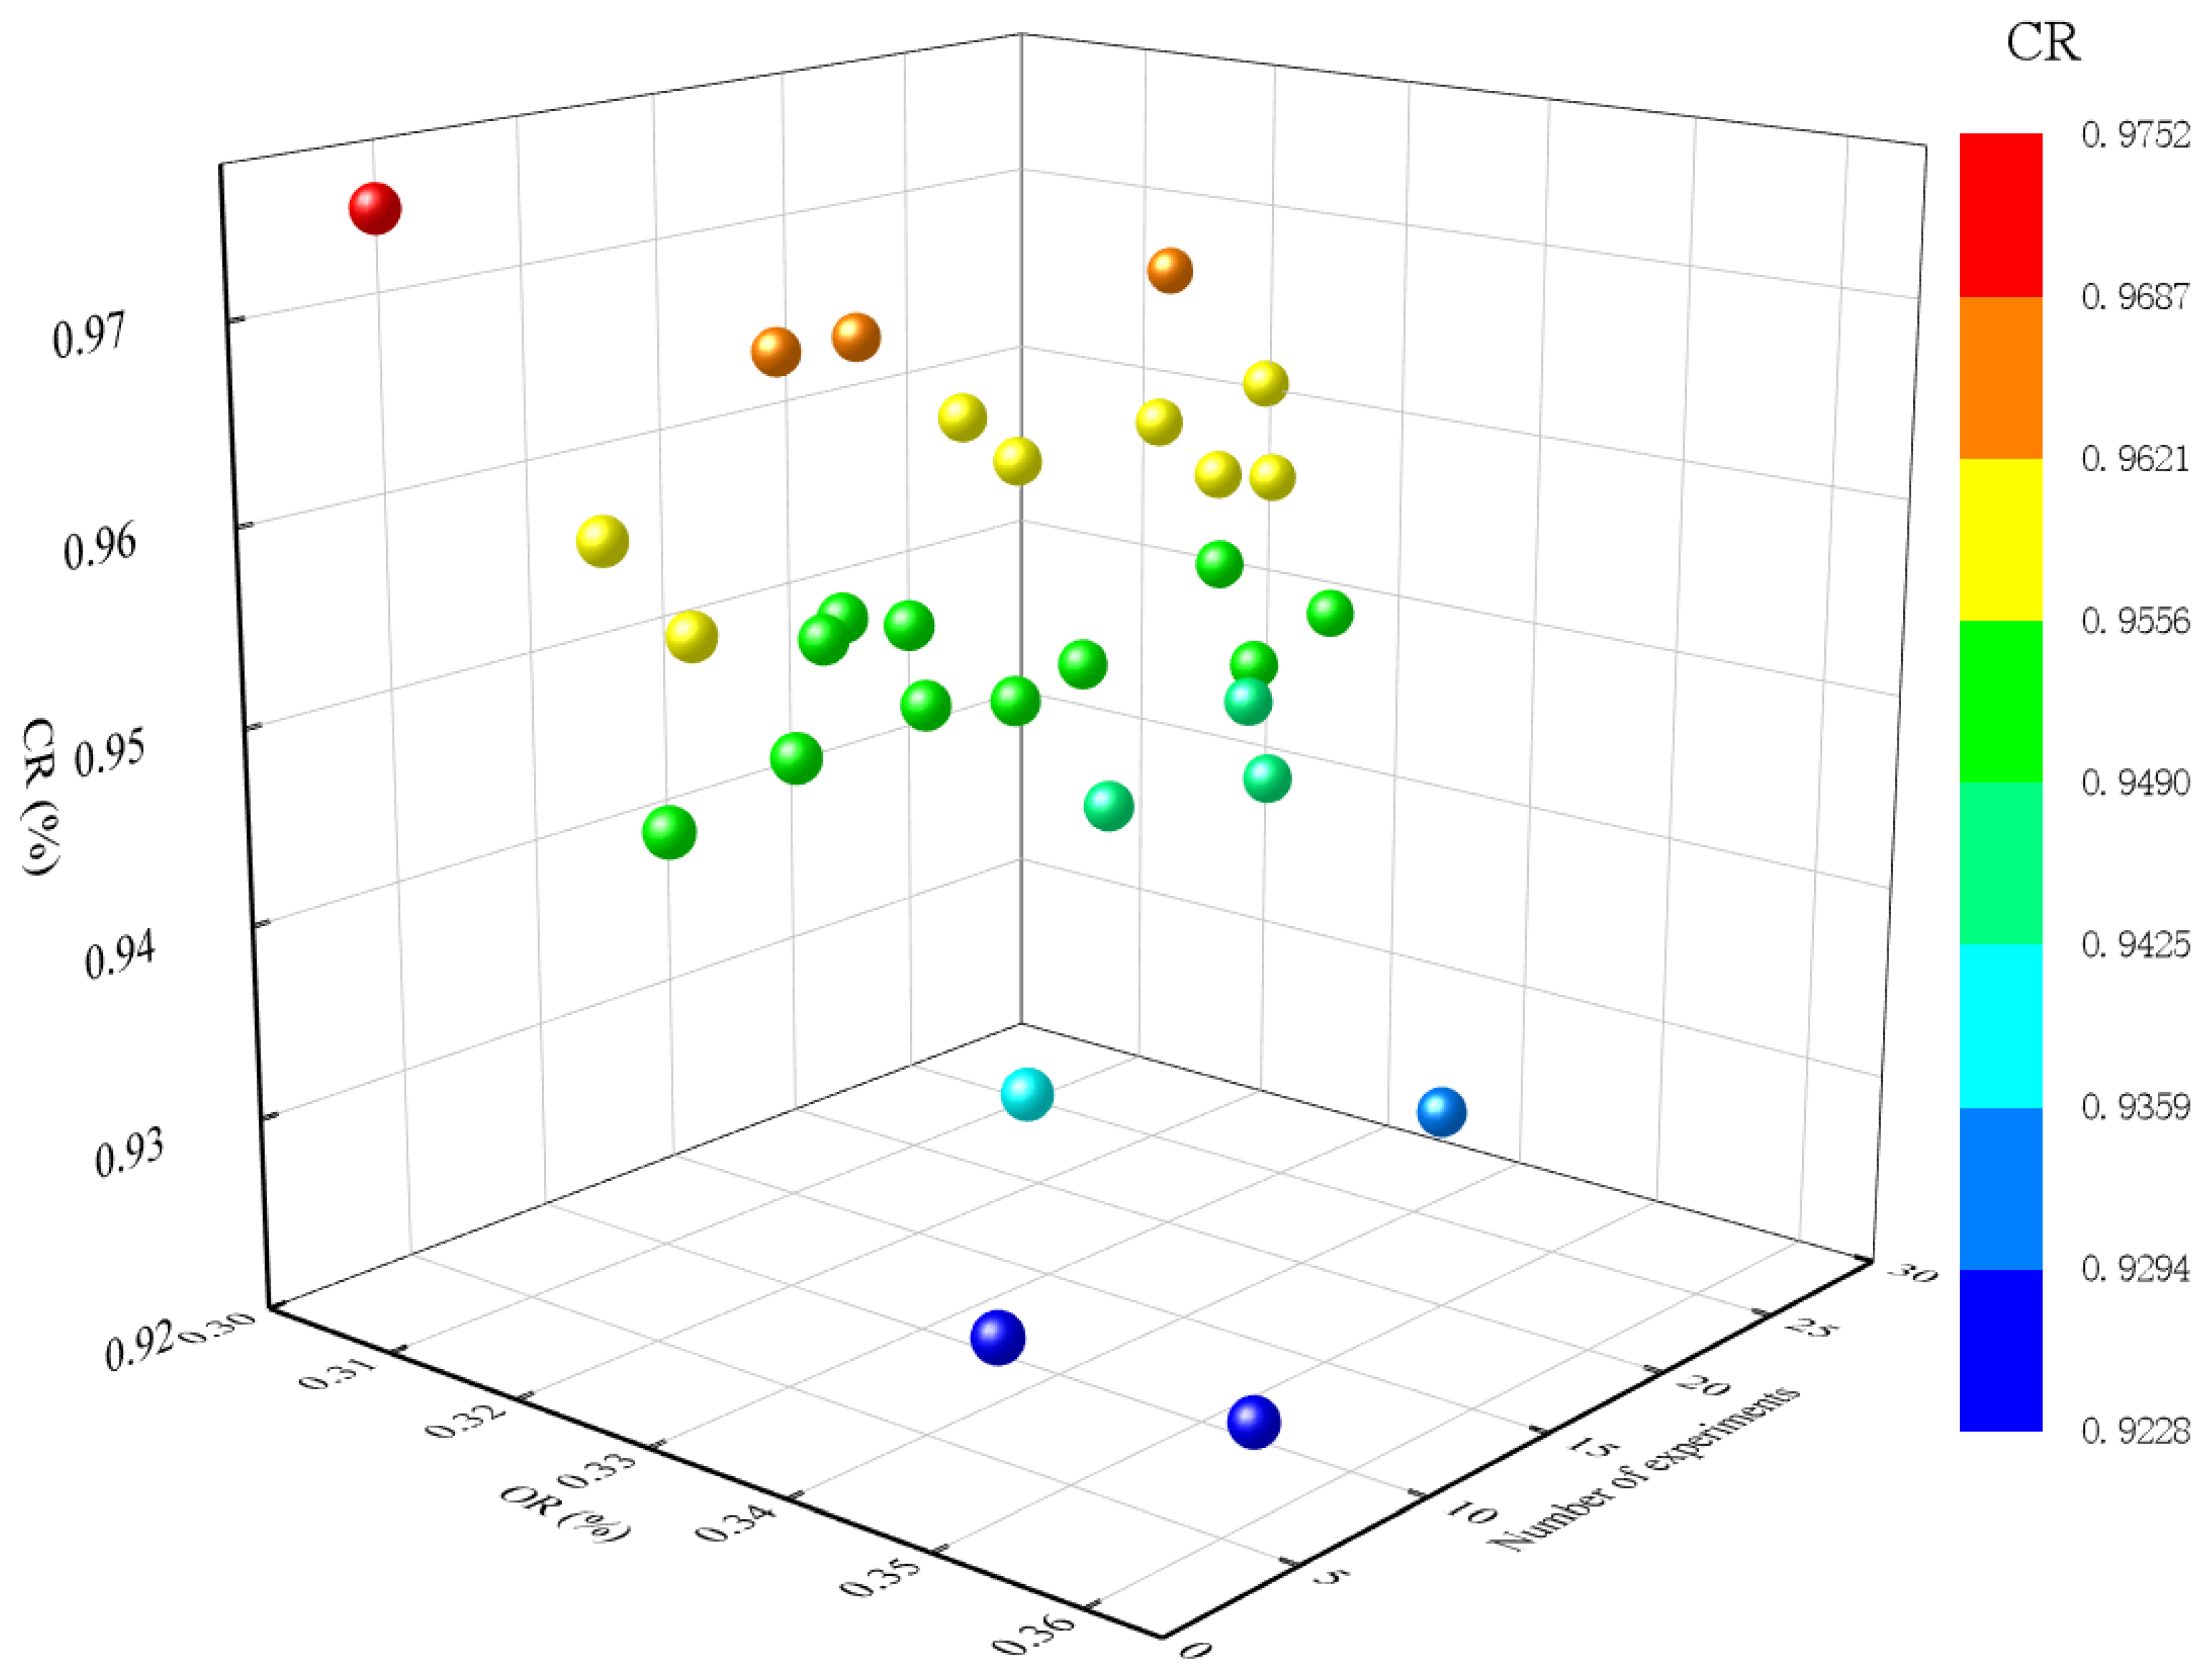
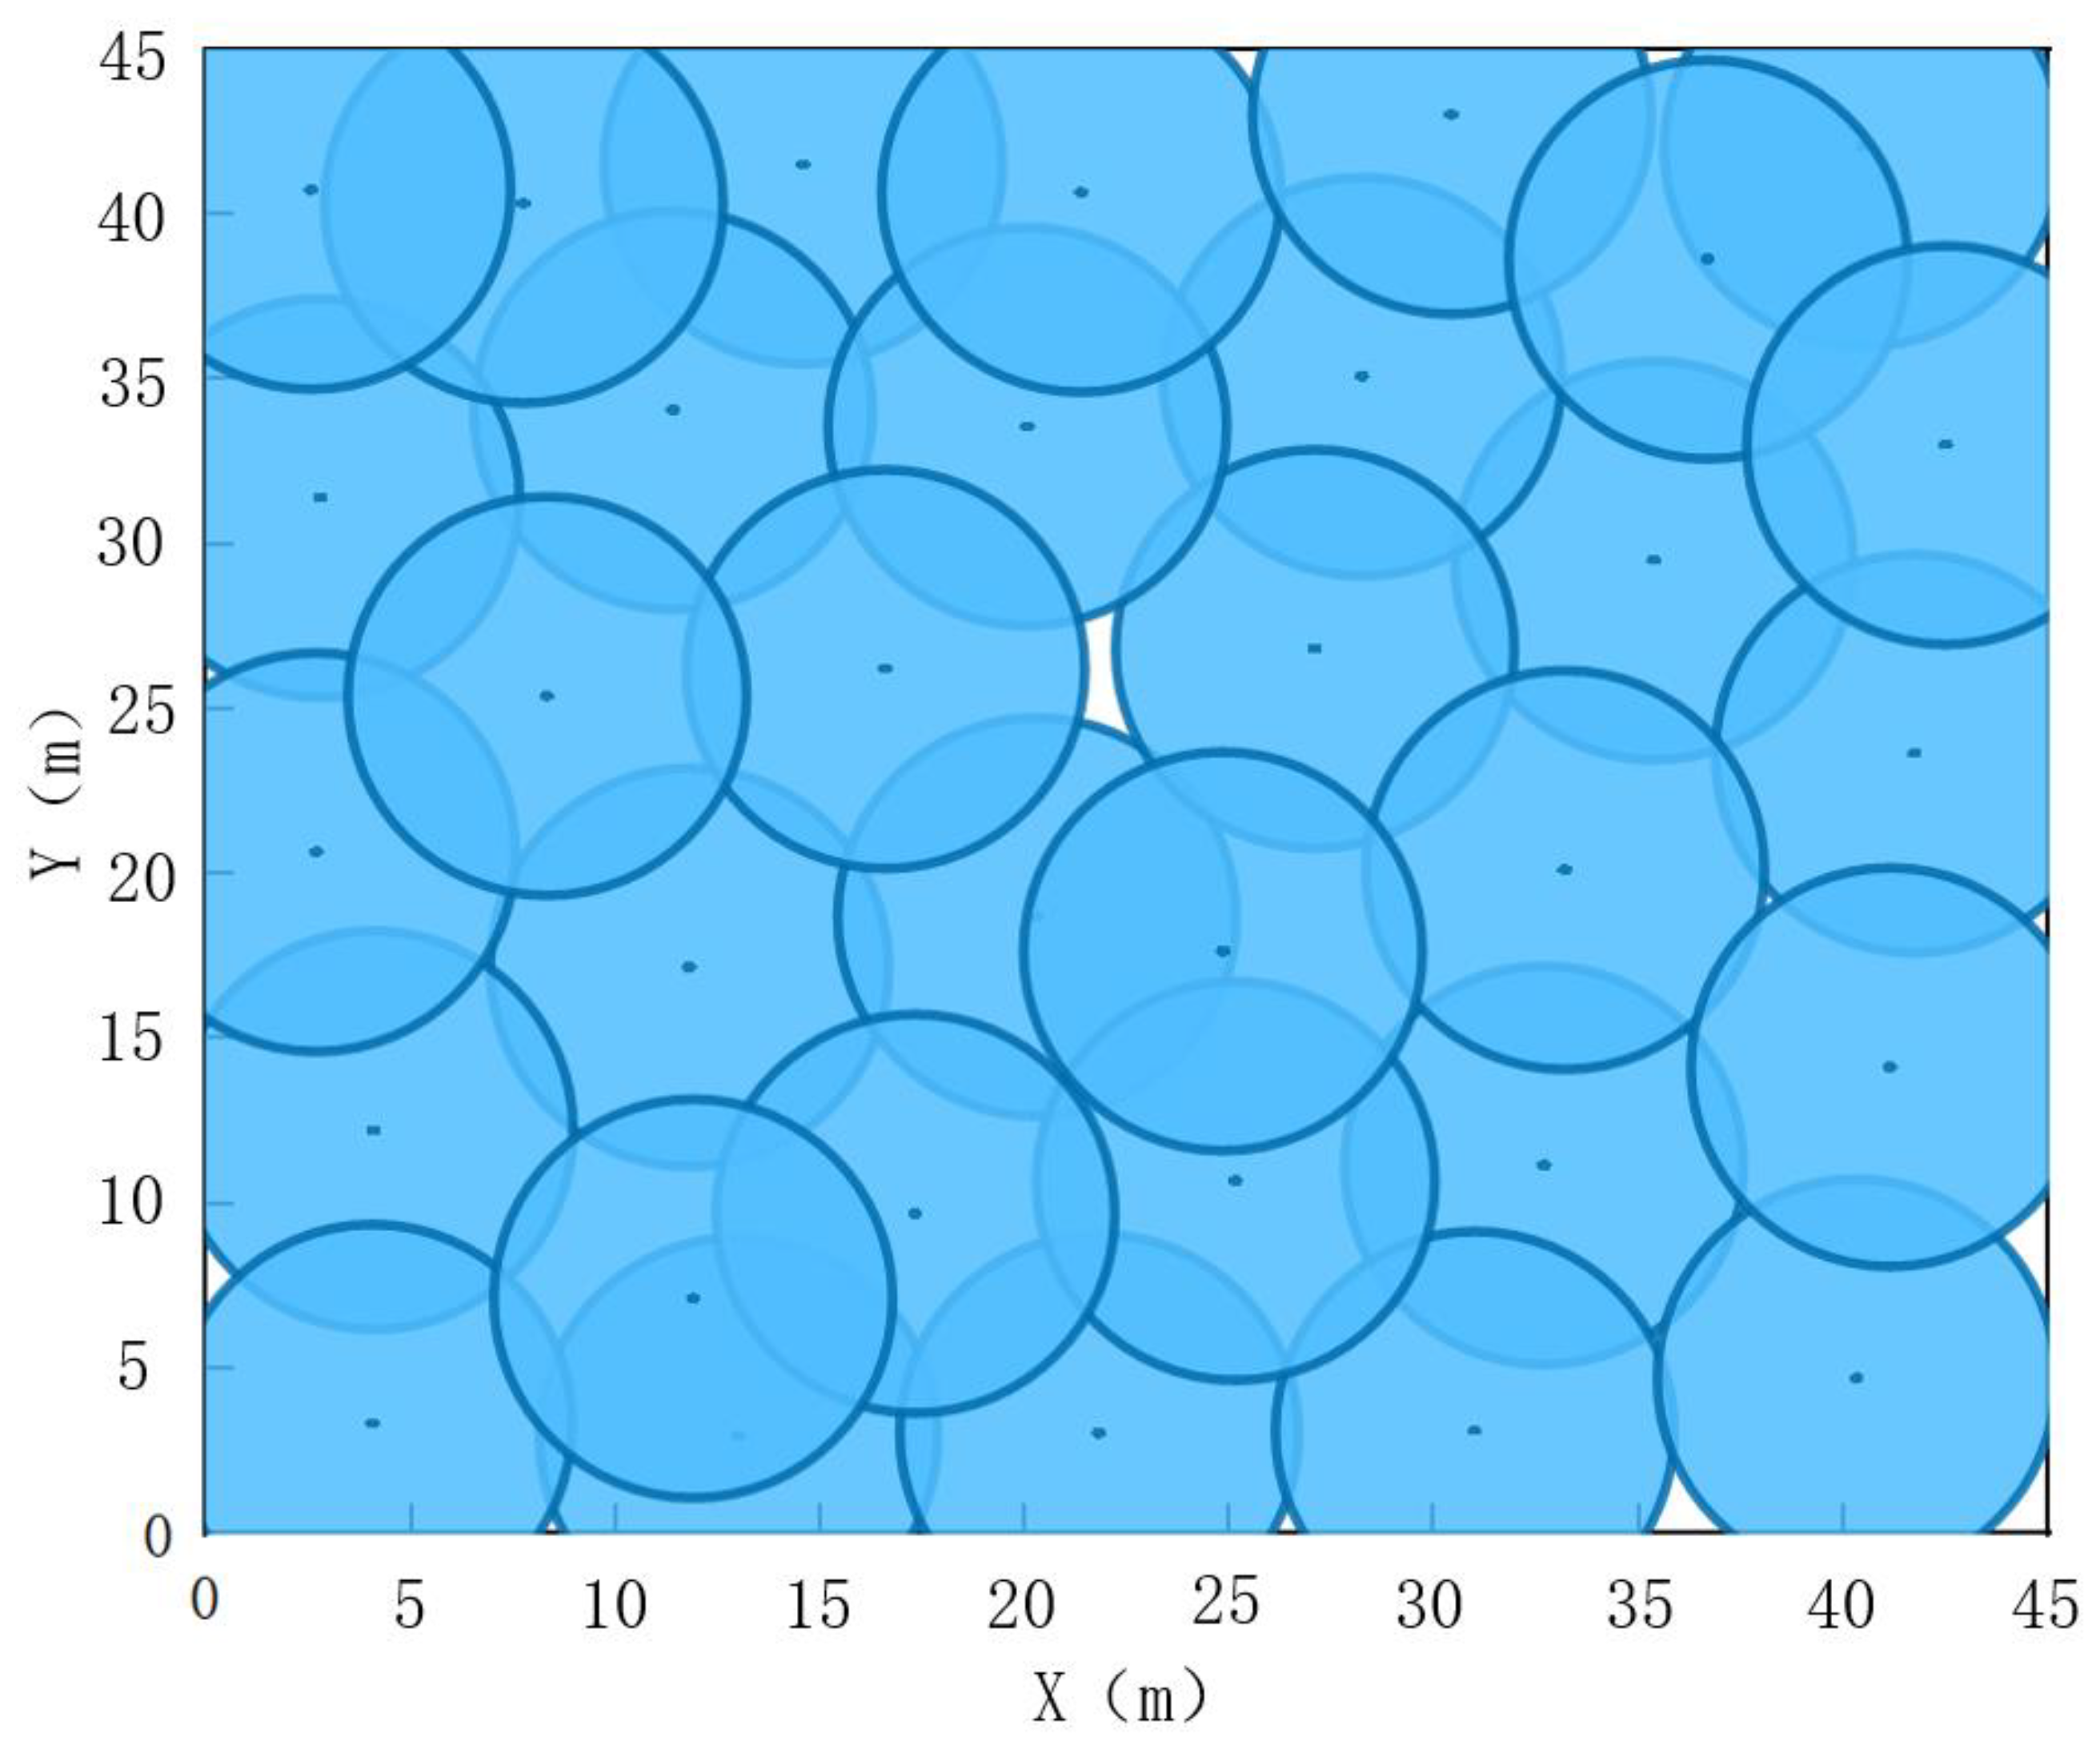
3.2. Evaluation of Network Coverage Optimization Model

To ensure the reliability of the network coverage optimization scheme, it is essential to minimize packet loss caused by data transmission over low-quality links. To determine the optimal number of sensor nodes, network coverage optimization simulations were conducted with 25, 26, 27, 28, 29, 30, 31, 32, 33, 34, 35, 36, 38, 39, and 40 sensor nodes, respectively. The evaluation metrics CR and OR were employed to comprehensively assess the deployment of sensor nodes in the monitoring area, as illustrated in Figure 5. To mitigate the effect of randomness, the PSO algorithm was repeated for 50 trials at each number of sensor nodes and the averaged value was accessed.
As the number of sensor nodes increased sequentially from 25 to 40, the CR increased from 85.68% to 97.83% and the OR increased from 11.29% to 57.31% (Figure 5a,b). As illustrated in Figure 5c, when the number of sensor nodes within the monitored area was less than 33, the curve slope of CR was relatively steep, ranging from 0.846 to 1.778. As the number of sensor nodes exceeded 33, the curve slope of CR decreased significantly, falling within the range of 0.002 to 0.664. Conversely, when the number of sensor nodes was less than 33, the curve slope of OR was relatively small, ranging from 2.101 to 3.032. Once the number of sensor nodes surpassed 33, the curve slope of OR increased markedly, ranging from 3.602 to 3.881. It could be concluded that when there were less than 33 sensor nodes, the increase in the number of nodes had a significant effect on the increase in CR and a relatively small effect on the increase in OR, while when there were more than 33 sensor nodes, the increase in the number of nodes had a significantly lower effect on the increase in CR and a significantly higher effect on the increase in OR. In order to monitor the largest possible area using the smallest number of nodes, the optimal number of sensor nodes in a 45 m × 45 m area was recommended as 33 in this study.
In order to obtain the optimal deployment location of 33 sensor nodes, 30 rounds of network coverage optimization experiments were conducted by applying the particle swarm optimization algorithm. Each round was iterated 500 times, and the obtained CR and OR are shown in Figure 6. The value of CR was between 92.296% and 97.512%. The optimal deployment of the 33 sensor node locations with the largest CR (97.512%) and the smallest OR (30.479%) was selected and illustrated in Figure 7.
The results, as shown in Figure 6, indicate that the PSO algorithm effectively enhanced network coverage by iteratively optimizing sensor node positions. The high CR (maximum of 97.512%) suggests a robust deployment configuration with near-complete coverage of the monitored area, which is critical for applications requiring comprehensive data acquisition. The relatively low OR (minimum of 30.479%) further highlights the efficiency of the selected configuration in minimizing redundant sensing areas, thereby reducing energy consumption and potential data overlap.
The observed variation in CR values across the 30 experiment rounds reflects the stochastic nature of the PSO algorithm, of which performance depends on the initial distribution of particles and the exploration–exploitation balance achieved during optimization. This variability underscores the importance of multiple trials to identify the best configuration for ensuring reliable and optimal deployment.
The combination of high CR and low OR in the selected deployment demonstrates the potential of PSO in balancing coverage and efficiency. This balance is particularly important in resource-constrained environments, where maximizing sensing performance and minimizing redundancy directly impact the network’s operational longevity and cost-effectiveness. Future work could explore the incorporation of additional constraints, such as obstacle avoidance or dynamic environmental changes, to further enhance the practicality and adaptability of the optimization approach.

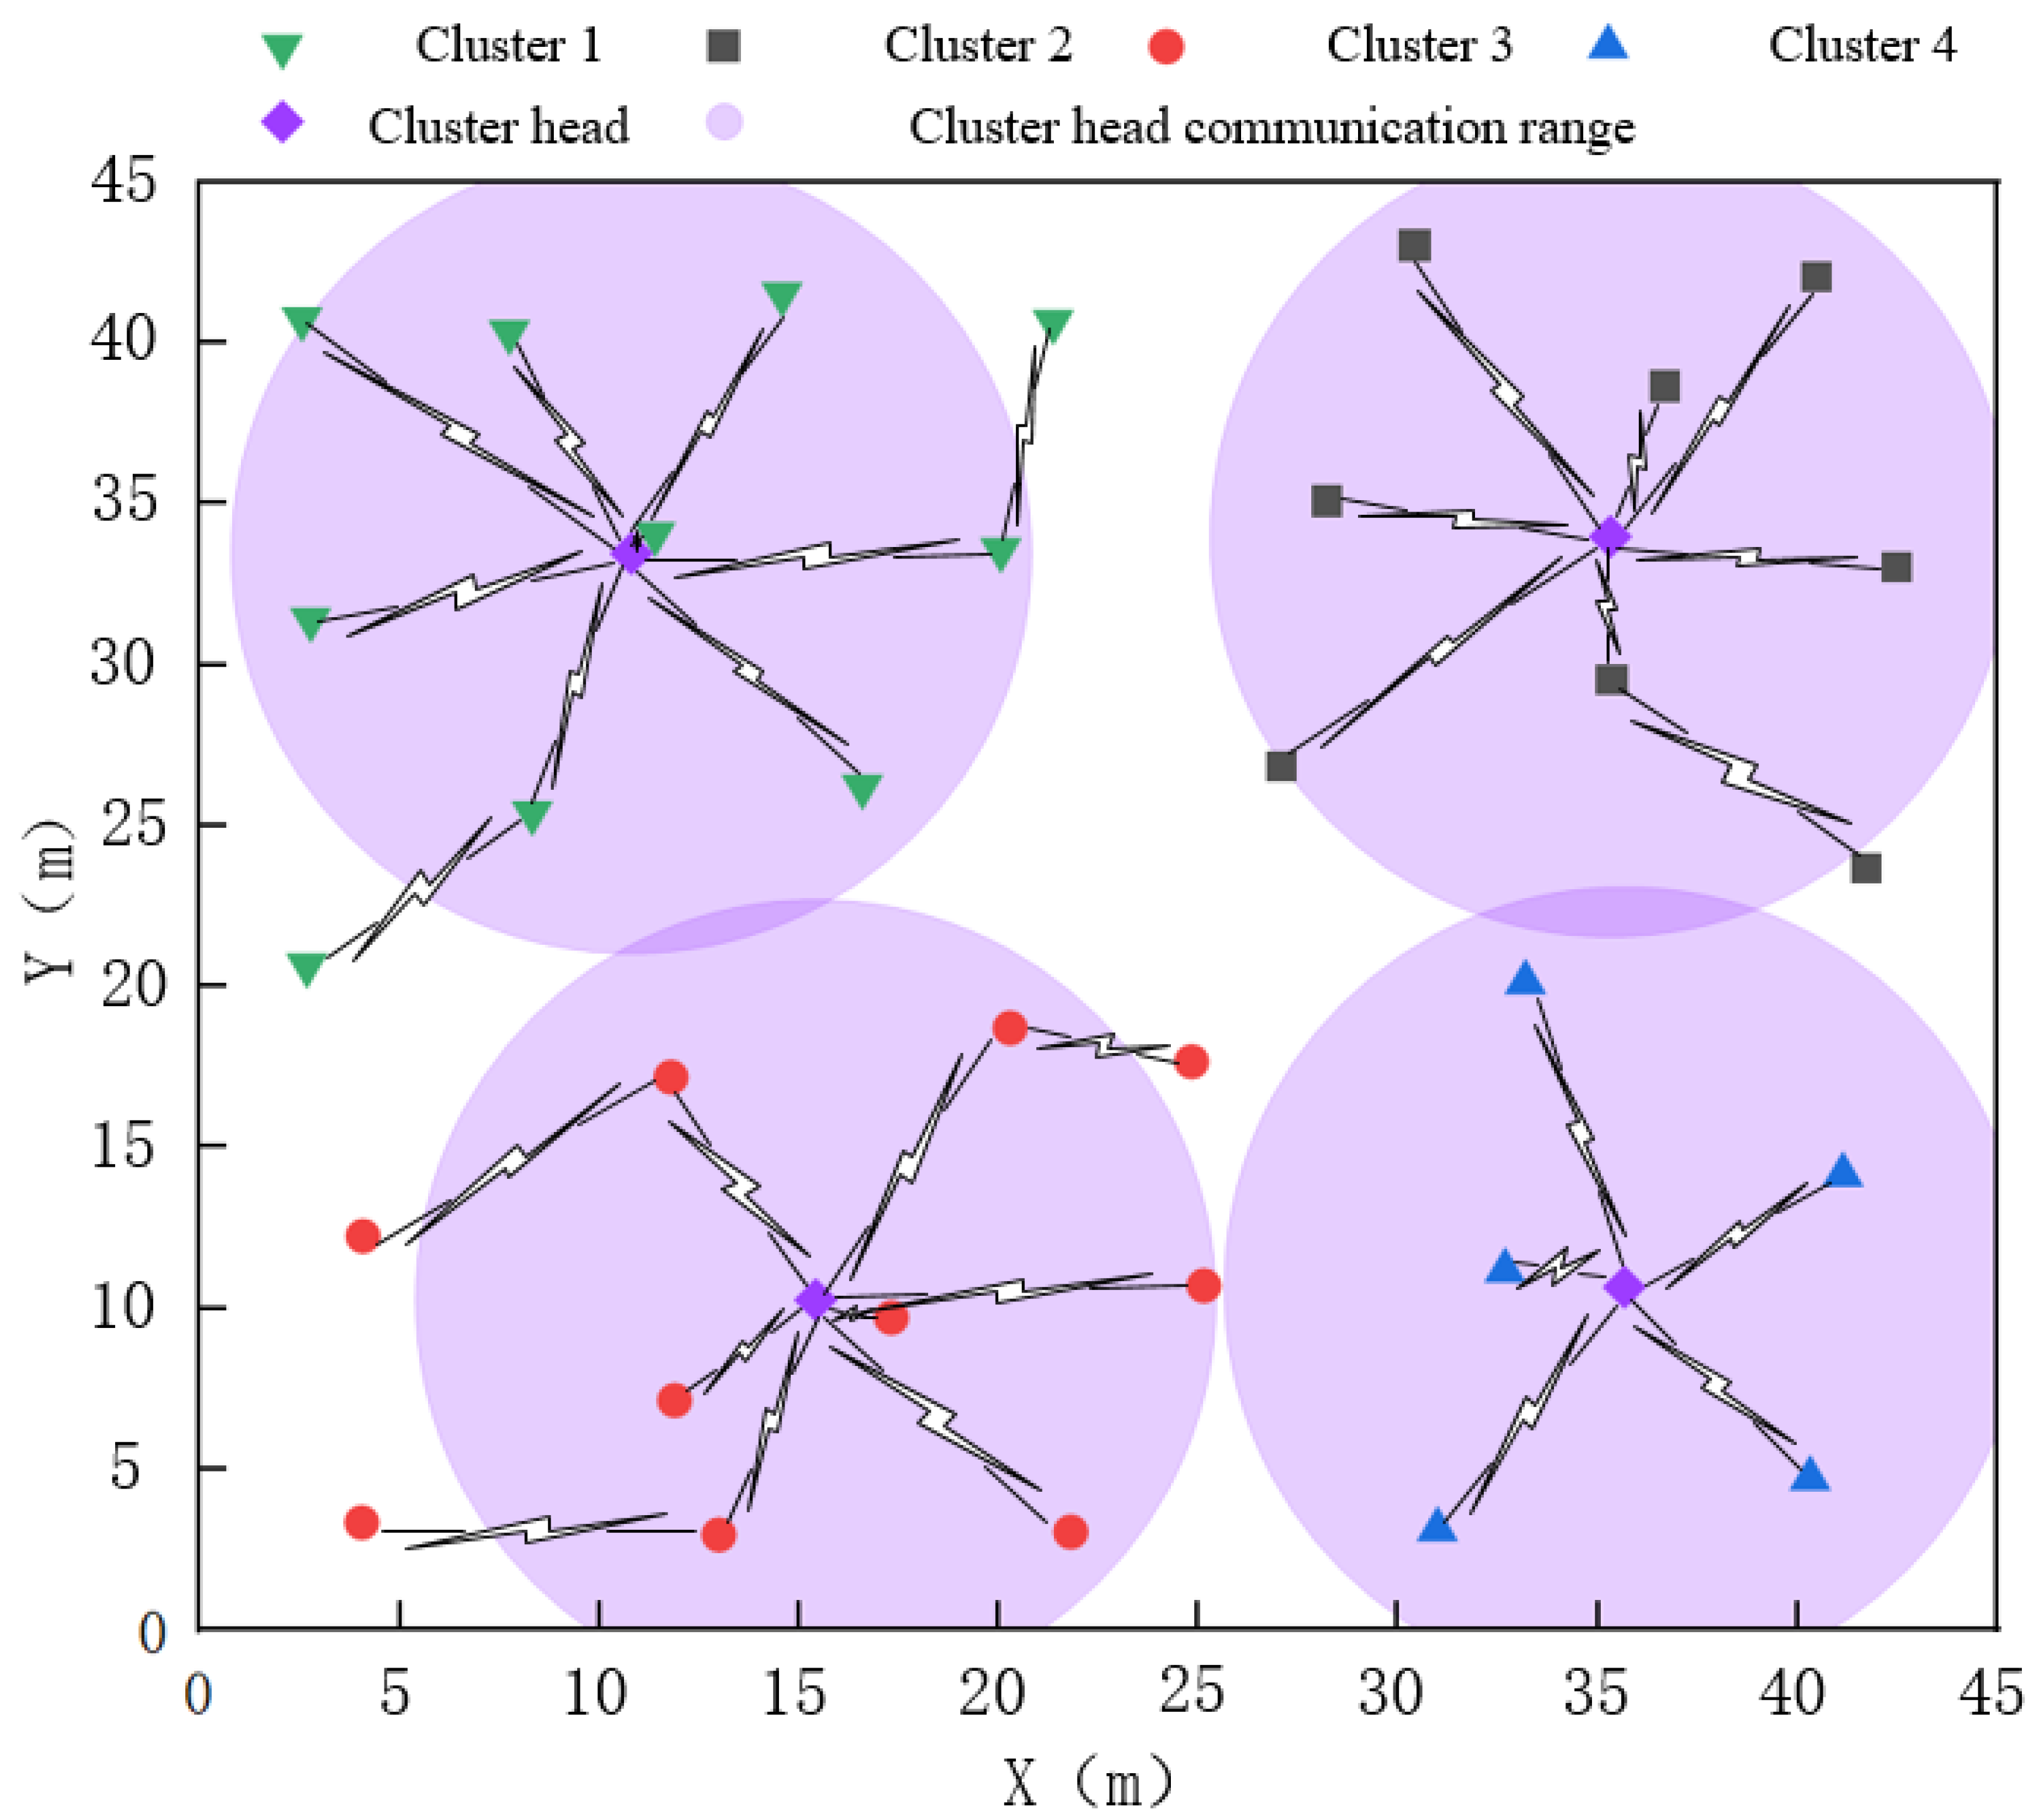
3.3. Assessment of Clustered Routing Protocols

The clustering and cluster head deployment of 33 predefined sensor nodes were performed using the K-means algorithm. The quality of the clustering was comprehensively evaluated by three metrics, DBI, CHI, and SC (Figure 8), which were used to determine the optimal number of clusters. The results showed that when the number of clusters was set to 4, the DBI reached the minimum value, while the CHI and SC reached their maximum values. Therefore, the optimal number of clusters was determined to be 4 in this study.
To ensure the reliability of the clustering routing protocol, a communication radius of 10 m was designated for cluster heads based on the output of the link quality prediction model. The structure of the multi-hop clustering network model is illustrated in Figure 9. Sensor nodes within the communication range of a cluster head established predefined data transmission paths directly with the cluster head. For sensor nodes located outside the communication range, predefined data transmission paths were established based on the sensor node with the shortest Euclidean distance within the same cluster. These nodes transmitted data to the cluster head using a multi-hop mechanism. During the experimental process, the size of the network and the quality of communication were considered, and both the clustering algorithm and cluster head selection had a significant impact on the system’s performance. The K-means clustering algorithm effectively assigned nodes to appropriate clusters, reducing communication delays in the network. However, the selection of appropriate cluster heads is crucial for the stability and efficiency of the entire network. By using the link quality prediction model to assess the communication quality of the cluster heads, the influence of low-quality links was avoided, thus enhancing the reliability of data transmission and the overall performance of the system.
In future research, efforts should focus not only on enhancing the reliability of wireless sensor networks to ensure accurate environmental monitoring but also on integrating advanced algorithms such as data fusion. Such algorithms can reduce the discrepancies between sensor data and the actual environmental conditions within plant factories. Additionally, addressing environmental noise and system disturbances from multiple perspectives is necessary to improve the quality of data acquisition and enhance the authenticity of collected data. These advancements will contribute to the development of more robust and reliable monitoring systems, ultimately optimizing greenhouse management and crop production.

4. Conclusions

The implementation of precise and effective environmental monitoring strategies is essential for understanding the dynamic variations of environmental factors within greenhouses. In this study, a wireless sensor network system strategy was proposed for improving the reliability of wireless sensor networks for environmental monitoring in plant factories. Firstly, this study proposed a hybrid wireless sensor network architecture based on multi-hop clustering. Building on this architecture, a link quality prediction model tailored for plant factory scenarios was developed and evaluated, achieving high prediction accuracy with an R2 of 0.9962. Additionally, it was observed that the influence of agricultural facilities and vegetation on link quality was most significant when the node height was 0.7 m. Finally, based on the output of the link quality prediction model, a reliable network coverage optimization model and a clustered routing protocol were designed and evaluated. The evaluation results demonstrated that under optimal deployment conditions, the required number of nodes was 33, achieving a CR of 97.512%.
The approach proposed in this study offers several key advantages, providing a robust and scalable solution for ensuring reliable communication in wireless sensor networks deployed within plant factories. By utilizing a hybrid WSN architecture that combines Wi-Fi and ZigBee communication protocols, this strategy effectively mitigates the challenges posed by varying link quality, which is a common issue in such environments. The nonlinear link quality prediction model developed in this study significantly enhances the accuracy of environmental monitoring by considering the interference and signal attenuation caused by dense crops and agricultural structures, which are typical in plant factory scenarios. Moreover, the integration of a particle swarm optimization (PSO) algorithm for network coverage optimization, coupled with a reliable cluster routing protocol based on the K-means algorithm, contributes to improved data transmission efficiency and network load balancing. Looking ahead, this strategy holds considerable potential for adaptation and extension to other agricultural applications where wireless communication is essential. For instance, large-scale greenhouses, agricultural farms, and smart city environments can benefit from the proposed approach, with necessary adjustments to communication protocols and routing algorithms to suit specific environmental conditions. Additionally, although the proposed approach offers a more reliable strategy for wireless sensor network systems, the link quality prediction model can be further improved to adapt to environmental factors such as climate variations and interference from other wireless devices, thereby enhancing its applicability and performance in dynamic environments. Overall, this research provides valuable insights and a solid foundation for the development of reliable large-scale wireless sensor networks in plant factory environments. By improving network reliability, the strategy supports the stable operation of environmental monitoring systems, ultimately contributing to the optimization of plant growth conditions. The methodology proposed in this study can serve as a basis for future advancements in wireless sensor networks, paving the way for their deployment in agricultural and environmental monitoring applications at a larger scale.

Author Contributions

Methodology, Y.Z. and J.Z.; Software, Y.Z. and X.Z.; Validation, W.L. and Y.Z.; Formal analysis, W.L.; Investigation, W.L., Y.Z., X.Z. and Q.W.; Resources, X.Z. and W.C.; Data curation, W.L.; Writing—original draft, W.L.; Writing—review & editing, L.Z. and W.C.; Visualization, L.Z.; Supervision, J.Z.; Project administration, Q.W. and J.Z.; Funding acquisition, J.Z. All authors have read and agreed to the published version of the manuscript.

Funding

This work was supported in part by the National Natural Science Foundation of China (Project No. 32171890 and 32401686) and the Science and Technology Commission of Shanghai Municipality (Project No. 23N21900300). Any opinions, findings, conclusions, or recommendations expressed in this publication are those of the authors and do not necessarily reflect the view of the National Natural Science Foundation of China or the Science and Technology Commission of Shanghai Municipality.

Data Availability Statement

The data presented in this study are available on request from the corresponding author. The data are not publicly available due to the privacy policy of the organization.

Acknowledgments

We acknowledge Associate Professor Daozong Sun from South China Agricultural University for his valuable guidance and support. We also appreciate Sanhong Guo from Shanghai Xinghui Vegetable Co., Ltd., (Shanghai, China) for providing the experimental site.

Conflicts of Interest

The authors declare no conflicts of interest. Authors Weicheng Cai and Qing Wang were employed by the company Shanghai Xinghui Vegetable Co., Ltd. The remaining authors declare that the research was conducted in the absence of any commercial or financial relationships that could be construed as a potential conflict of interest.

References

  1. Zhang, Z.; Zhu, Z.; Gao, G.; Qu, D.; Zhong, J.; Jia, D.; Du, X.; Yang, X.; Pan, S. Design and Research of Digital Twin System for Multi-Environmental Variable Mapping in Plant Factory. Comput. Electron. Agric. 2023, 213, 108243. [Google Scholar] [CrossRef]
  2. Wang, H.; Meng, X.; Chen, Z.; Zhang, X.; Cheng, R.; Zhang, Y.; Li, W.; Song, W.; Zhang, Y. A Feedback Control Method for Plant Factory Environment Based on Photosynthetic Rate Prediction Model. Comput. Electron. Agric. 2023, 211, 108007. [Google Scholar] [CrossRef]
  3. Lanoue, J.; St. Louis, S.; Little, C.; Hao, X. Continuous Lighting Can Improve Yield and Reduce Energy Costs While Increasing or Maintaining Nutritional Contents of Microgreens. Front. Plant Sci. 2022, 13, 983222. [Google Scholar] [CrossRef] [PubMed]
  4. Bai, X.; Wang, Z.; Zou, L.; Alsaadi, F.E. Collaborative Fusion Estimation over Wireless Sensor Networks for Monitoring CO2 Concentration in a Greenhouse. Inf. Fusion 2018, 42, 119–126. [Google Scholar] [CrossRef]
  5. Aruchamy, P.; Balraj, L.; Sowndarya, K.K.D. An Energy-Aware Link Fault Detection and Recovery Scheme for QoS Enhancement in Internet of Things-Enabled Wireless Sensor Network. Comput. Electr. Eng. 2025, 123, 110092. [Google Scholar] [CrossRef]
  6. Baccour, N.; Koubâa, A.; Ben Jamâa, M.; Do Rosário, D.; Youssef, H.; Alves, M.; Becker, L.B. RadiaLE: A Framework for Designing and Assessing Link Quality Estimators in Wireless Sensor Networks. Ad Hoc Netw. 2011, 9, 1165–1185. [Google Scholar] [CrossRef]
  7. Xu, J.; Xia, Y.; Xie, J.; Liu, W.; Luo, R.; Hu, S.; Huang, D. Faster or Slower: Convergence of Link Quality Metrics in Wireless Sensor Networks. In Proceedings of the 2020 IEEE 6th International Conference on Computer and Communications (ICCC), Chengdu, China, 11–14 December 2020; IEEE: Piscataway, NJ, USA, 2020; pp. 357–362. [Google Scholar]
  8. Amorim, R.; Mogensen, P.; Sorensen, T.; Kovacs, I.Z.; Wigard, J. Pathloss Measurements and Modeling for UAVs Connected to Cellular Networks. In Proceedings of the 2017 IEEE 85th Vehicular Technology Conference (VTC Spring), Sydney, NSW, Australia, 4–7 June 2017; IEEE: Piscataway, NJ, USA, 2017; pp. 1–6. [Google Scholar]
  9. Bi, S.; Zeng, Y.; Zhang, R. Wireless Powered Communication Networks: An Overview. IEEE Wirel. Commun. 2016, 23, 10–18. [Google Scholar] [CrossRef]
  10. Hui, L.; LinLan, L. A Link Quality Estimation Method for Wireless Sensor Networks Based on the Ladder Network. In Proceedings of the 2021 IEEE 4th International Conference on Computer and Communication Engineering Technology (CCET), Beijing, China, 13–15 August 2021; IEEE: Piscataway, NJ, USA, 2021; pp. 341–344. [Google Scholar]
  11. Jawad, H.M.; Jawad, A.M.; Nordin, R.; Gharghan, S.K.; Abdullah, N.F.; Ismail, M.; Abu-AlShaeer, M.J. Accurate Empirical Path-Loss Model Based on Particle Swarm Optimization for Wireless Sensor Networks in Smart Agriculture. IEEE Sens. J. 2020, 20, 552–561. [Google Scholar] [CrossRef]
  12. Raheemah, A.; Sabri, N.; Salim, M.S.; Ehkan, P.; Ahmad, R.B. New Empirical Path Loss Model for Wireless Sensor Networks in Mango Greenhouses. Comput. Electron. Agric. 2016, 127, 553–560. [Google Scholar] [CrossRef]
  13. Laboratory RITM, ENSEM, Hassan II University of Casablanca, Casablanca, Morocco; Rais, A.; Bouragba, K.; Ouzzif, M. Optimal Routing and Clustering Technique for Wireless Sensor Networks. J. Commun. 2019, 14, 758–764. [Google Scholar] [CrossRef]
  14. Shao, X.; Wang, C.-X.; Rao, Y. Network Coding Aware QoS Routing for Wireless Sensor Network. J. Commun. 2015, 10, 24–32. [Google Scholar] [CrossRef]
  15. Yu, X.; Duan, Y.; Cai, Z.; Luo, W. An Adaptive Learning Grey Wolf Optimizer for Coverage Optimization in WSNs. Expert Syst. Appl. 2024, 238, 121917. [Google Scholar] [CrossRef]
  16. Wang, X.; Zhang, H.; Fan, S.; Gu, H. Coverage Control of Sensor Networks in IoT Based on RPSO. IEEE Internet Things J. 2018, 5, 3521–3532. [Google Scholar] [CrossRef]
  17. Zhou, Y.; Zhang, L.; Li, W. Partitioned Uneven Cluster Routing Algorithm Based on Gray Wolf Optimization in WSNs. Ad Hoc Netw. 2024, 163, 103564. [Google Scholar] [CrossRef]
  18. Xu, K.; Zhao, Z.; Luo, Y.; Hui, G.; Hu, L. An Energy-Efficient Clustering Routing Protocol Based on a High-QoS Node Deployment with an Inter-Cluster Routing Mechanism in WSNs. Sensors 2019, 19, 2752. [Google Scholar] [CrossRef]
  19. Li, Y.; Zhao, L.; Wang, Y.; Wen, Q. Improved Sand Cat Swarm Optimization Algorithm for Enhancing Coverage of Wireless Sensor Networks. Measurement 2024, 233, 114649. [Google Scholar] [CrossRef]
  20. Sakthipriya, S.; Naresh, R. Precision Agriculture Based on Convolutional Neural Network in Rice Production Nutrient Management Using Machine Learning Genetic Algorithm. Eng. Appl. Artif. Intell. 2024, 130, 107682. [Google Scholar] [CrossRef]
  21. Wang, J.; Cao, Y.; Li, B.; Kim, H.; Lee, S. Particle Swarm Optimization Based Clustering Algorithm with Mobile Sink for WSNs. Future Gener. Comput. Syst. 2017, 76, 452–457. [Google Scholar] [CrossRef]
  22. Zhou, X.; Wu, Y.; Zhong, M.; Wang, M. Artificial Bee Colony Algorithm Based on Adaptive Neighborhood Topologies. Inf. Sci. 2022, 610, 1078–1101. [Google Scholar] [CrossRef]
  23. Wu, L.; Yang, K.; Zhong, Y.; Lin, J. Population-Based Simulated Annealing Algorithm for the Min-Degree Constrained Minimum Spanning Tree Problem. Swarm Evol. Comput. 2025, 92, 101791. [Google Scholar] [CrossRef]
  24. Zhou, X.; Wu, Y.; Zhong, M.; Wang, M. Artificial Bee Colony Algorithm Based on Multiple Neighborhood Topologies. Appl. Soft Comput. 2021, 111, 107697. [Google Scholar] [CrossRef]
  25. Swathi, B.; Amanullah, D.M.; Kalaiselvan, S.A. Energy-Efficient and Fault-Tolerant Routing Mechanism for WSN Using Optimizer Based Deep Learning Model. Sustain. Comput. Inform. Syst. 2024, 44, 101044. [Google Scholar] [CrossRef]
  26. Singh, K.; Singh, K.; Son, L.H.; Aziz, A. Congestion Control in Wireless Sensor Networks by Hybrid Multi-Objective Optimization Algorithm. Comput. Netw. 2018, 138, 90–107. [Google Scholar] [CrossRef]
  27. Liao, M.-S.; Chen, S.-F.; Chou, C.-Y.; Chen, H.-Y.; Yeh, S.-H.; Chang, Y.-C.; Jiang, J.-A. On Precisely Relating the Growth of Phalaenopsis Leaves to Greenhouse Environmental Factors by Using an IoT-Based Monitoring System. Comput. Electron. Agric. 2017, 136, 125–139. [Google Scholar] [CrossRef]
  28. Xia, S.; Nan, X.; Cai, X.; Lu, X. Data Fusion Based Wireless Temperature Monitoring System Applied to Intelligent Greenhouse. Comput. Electron. Agric. 2022, 192, 106576. [Google Scholar] [CrossRef]
  29. Singh, R.; Aernouts, M.; De Meyer, M.; Weyn, M.; Berkvens, R. Leveraging LoRaWAN Technology for Precision Agriculture in Greenhouses. Sensors 2020, 20, 1827. [Google Scholar] [CrossRef]
  30. Ji, W.; Zheng, B.-Y. A Novel Cooperative MAC Protocol for WSN Based on NDMA. In Proceedings of the 2006 8th International Conference on Signal Processing, Guilin, China, 16–20 November 2006; IEEE: Piscataway, NJ, USA, 2006; p. 4129751. [Google Scholar]
  31. Xu, M.; Zhang, Q.; Zhao, Y.; Wang, W.; Xia, Y.; Liu, W.; Hu, S.; Huang, D. Statistical Characteristic of Link Quality Metrics in UAV Assisted Low Power Wireless Networks. In Proceedings of the 2022 IEEE International Conference on Unmanned Systems (ICUS), Guangzhou, China, 28–30 October 2022; IEEE: Piscataway, NJ, USA, 2022; pp. 333–339. [Google Scholar]
  32. Mo, W.; He, Z.; Xing, C.; Yu, Z. A Flexible Hinge FBG Accelerometer Based on PSO Algorithm. Opt. Fiber Technol. 2024, 87, 103905. [Google Scholar] [CrossRef]
  33. Wu, W.; Wang, W.; Jia, X.; Feng, X. Transformer Autoencoder for K-Means Efficient Clustering. Eng. Appl. Artif. Intell. 2024, 133, 108612. [Google Scholar] [CrossRef]
Figure 1. Experimental site.
Agronomy 15 00751 g001
Figure 2. Hybrid wireless sensor network architecture diagram.
Agronomy 15 00751 g002
Figure 3. Relationship between path loss and distance for four node heights.
Agronomy 15 00751 g003
Figure 4. Curve fitting between path loss and distance.
Agronomy 15 00751 g004
Figure 5. Correlation between coverage rate (CR), overlap rate (OR) of the wireless sensor network, and number of sensor nodes. (a) Average value of CR with different number of sensor nodes; (b) average value of OR with different number of sensor nodes; (c) curve slope of CR and OR.
Agronomy 15 00751 g005aAgronomy 15 00751 g005b
Figure 6. Scatterplot of network coverage and overlap. CR represents the coverage rate of the wireless sensor network, and OR denotes the overlap rate of the wireless sensor network.
Agronomy 15 00751 g006
Figure 7. Optimal deployment of sensor nodes.
Agronomy 15 00751 g007
Figure 8. Determination of the number of clusters. SC refers to the Silhouette Coefficient, DBI stands for the Davies–Bouldin Index, and CHI denotes the Calinski–Harabasz Index.
Agronomy 15 00751 g008
Figure 9. Cluster routing protocol.
Agronomy 15 00751 g009
Table 1. Experiment main hardware parameter settings.
Channel Number26
Transmit power0 dB
Frequency2.4 GHz
MAC protocolIEEE 802.15.4
Table 2. Parameters of PSO algorithm for network coverage optimization.
Monitoring Area45 m × 45 m
Sensor node sensing radius5 m
Maximum number of iterations500
Disclaimer/Publisher’s Note: The statements, opinions and data contained in all publications are solely those of the individual author(s) and contributor(s) and not of MDPI and/or the editor(s). MDPI and/or the editor(s) disclaim responsibility for any injury to people or property resulting from any ideas, methods, instructions or products referred to in the content.

