1. Introduction
As the world’s leading producer of table grapes and the third-largest grape grower, China faces significant challenges from leafhopper infestations, which threaten its grape industry [
1,
2]. These pests have spread widely across key grape-growing regions in China, including Ningxia, Xinjiang, Henan, Shaanxi, and Shandong provinces [
3,
4]. In the Turpan Basin of Xinjiang, infestations affect approximately 16,675 hectares annually, leading to substantial yield losses estimated at RMB 30 million in severe outbreaks [
4]. This pest poses a substantial threat to the sustainability of China’s grape industry. Traditional monitoring methods, such as visual inspection and yellow sticky traps [
5], are inadequate due to the leafhoppers’ cryptic morphology [
6] and high mobility, which causes critical detection delays. These delays further exacerbate crop losses and contribute to excessive pesticide use. Currently, there remains no effective pest monitoring method to guide the management of this pest.
In recent years, advanced computer vision technology, particularly deep learning methods, has shown potential in the detection and monitoring of plant pests and diseases [
7]. Originating in the 1950s and gaining momentum in the 1980s, deep learning has revolutionized the field of agricultural pest and disease diagnosis by automating and enhancing the accuracy and efficiency of detection processes.
Among deep learning models, convolutional neural networks (CNNs) have become foundational in target detection algorithms due to their robust feature extraction capabilities. For instance, Deepalakshmi et al. [
8] employed CNNs to achieve over 94.5% accuracy in distinguishing diseased leaves from healthy ones. Similarly, Kaya and Gürsoy [
9] proposed a deep learning-based method that fused RGB and segmented images to detect plant diseases with a precision of 98.16%. These advancements highlight the effectiveness of CNN-based algorithms in precise pest and disease detection.
The two primary categories of CNN-based target identification algorithms are single-stage detectors and two-stage detectors. Due to their high detection accuracy, two-stage detectors, such as Faster R-CNN [
10], have produced excellent results in real-time disease diagnosis. They typically employ an approach that combines fine classification and candidate region development. For instance, Bari et al. [
11] used Faster R-CNN to diagnose rice leaf disease with an accuracy of above 98%. However, due to its slower processing speed and more intricate detection method, its application in real-time scenarios is limited. On the other hand, one-stage detectors achieve faster detection by directly predicting bounding boxes on the feature map. These include YOLO (You Only Look Once) and SSD (Single-Shot MultiBox Detector) [
12]. The YOLO series of algorithms [
13,
14,
15,
16,
17] are particularly effective due to their high detection efficiency. In particular, the YOLO family demonstrates strong capabilities in pest and disease detection, benefiting from its high accuracy, low computational cost, and outstanding real-time performance. In recent years, researchers have developed various improved versions of YOLO specifically for grape pest and disease detection [
18,
19,
20,
21] with the aim of further enhancing detection performance and practical usability [
22,
23,
24,
25,
26]. Continuous advancements underscore YOLO’s strong suitability for this task, reinforcing its position as a preferred choice for large-scale deployment.
Despite these advancements, earlier versions, such as YOLOv3 [
14] and YOLOv4, still exhibit limitations in detecting small targets within complex backgrounds. Although YOLOv5 and YOLOv7 [
15] incorporate significant optimizations, they continue to suffer from speed bottlenecks and missed detections of small targets, restricting their effectiveness in real-time vineyard monitoring. While YOLOv8n [
16] improves detection accuracy, it struggles to differentiate visually similar damage levels and requires substantial computational resources, making real-time inference on mobile devices challenging.
Most existing studies primarily focus on binary detection—determining only the presence or absence of pests and diseases—without accurately quantifying infestation severity. However, in precision agriculture, assessing damage levels is crucial for targeted pest control and yield optimization. Therefore, this study aims to develop a lightweight model that automatically identifies grape leafhopper damage levels by balancing high detection accuracy with low computational complexity. The proposed model is designed to accurately distinguish between various damage levels in complex vineyard environments while meeting the demands of real-time inference on mobile devices, thereby providing robust technical support for pest and disease monitoring in precision agriculture. The main contributions of this work are as follows:
- (1)
A high-quality dataset for grape leafhopper damage classification was constructed, categorizing damage levels into five distinct levels to support model training and evaluation.
- (2)
A lightweight grape leafhopper damage detection model, CSF-YOLO, is proposed based on an improved YOLOv8n. This model significantly enhances feature extraction and detection accuracy while achieving a lightweight design through the integration of the FasterNet lightweight architecture, the CARAFE (Content-Aware ReAssembly of FEatures) upsampling module, and the SE (Squeeze-and-Excitation) attention mechanism.
- (3)
Ablation experiments, comparative experiments, and mobile deployment tests were conducted to verify the model’s robustness and practical usability.
2. Materials and Methods
2.1. Characteristics of Grape Leafhopper Infestation and Classification of Damage Levels
2.1.1. Characteristics of Grape Leafhopper Infestation
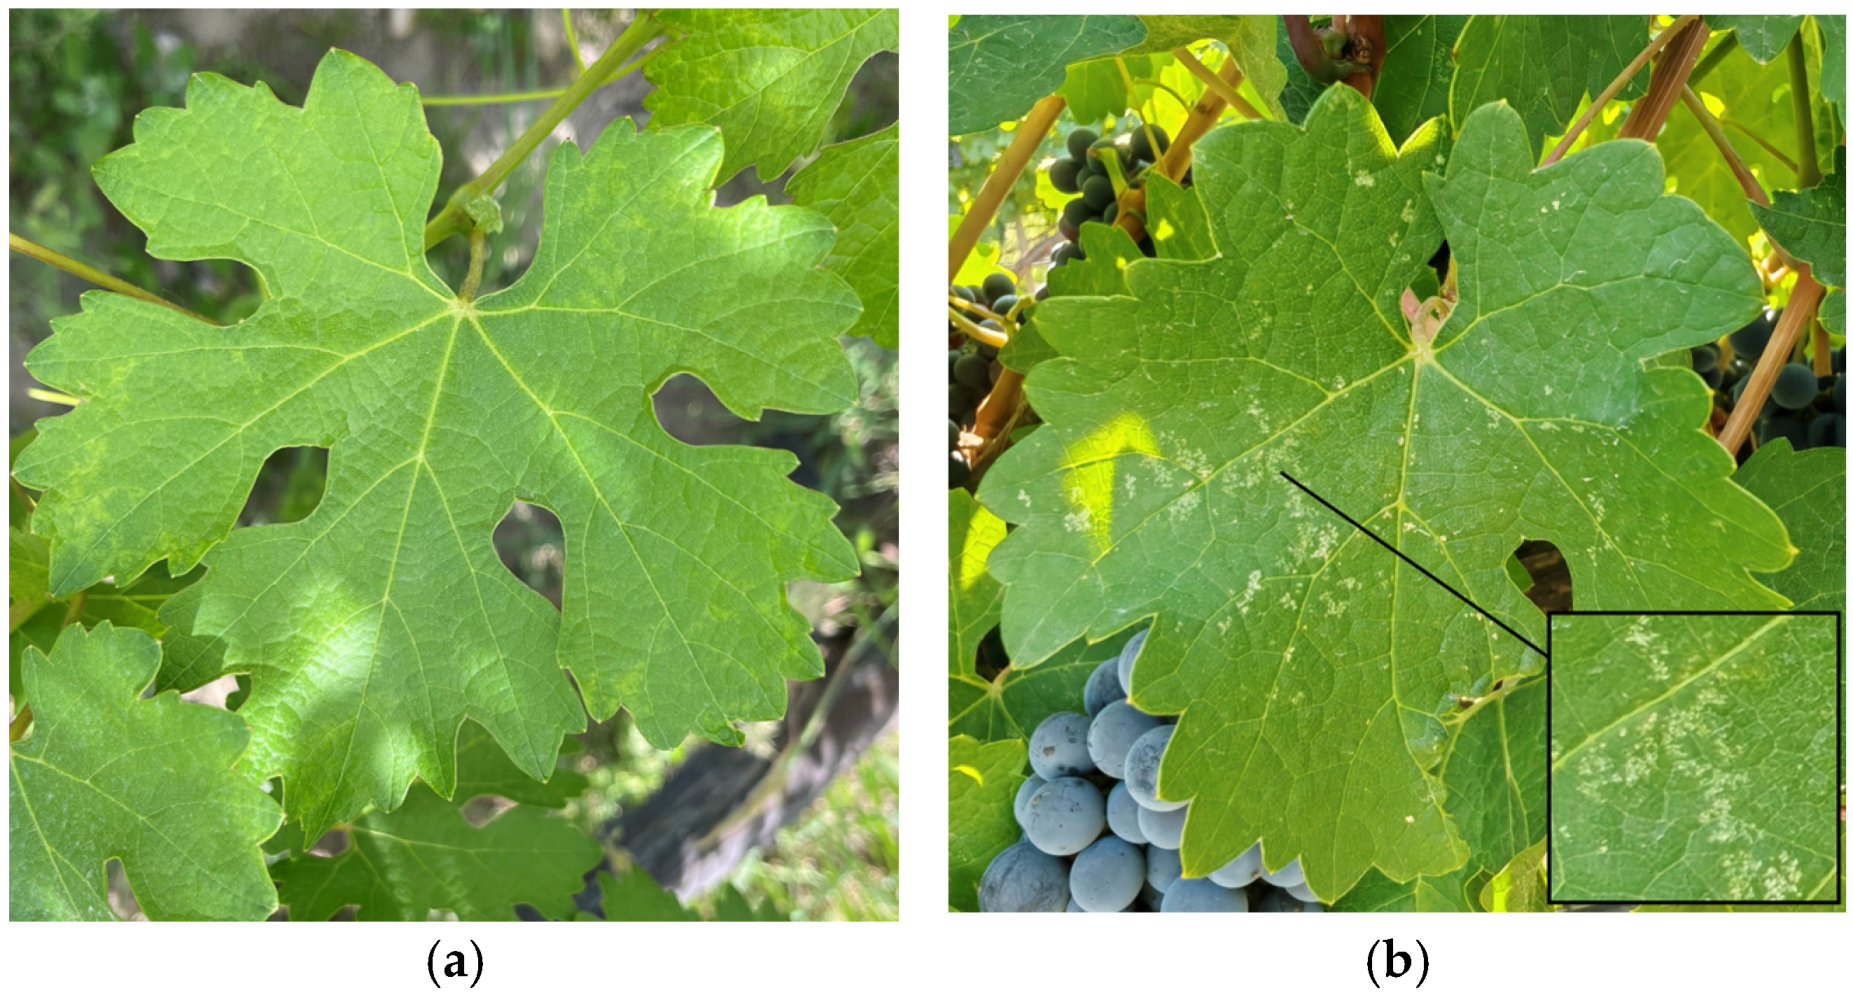
Leafhoppers (
Erythroneura spp.) represent significant pests on the grapes. In the adult stage, leafhoppers congregate on the undersides of grape foliage and pierce and extract sap from the leaves, which results in the emergence of small and grayish-white specks known as “stippling” on the leaves. These specks could progressively enlarge and become more pronounced as the leafhoppers persist in their feeding activities. On
Cabernet Sauvignon,
Figure 1 compares the leaves of healthy grape leaves with those infested by leafhoppers.
2.1.2. Grape Leafhopper Infestation Symptoms Classification
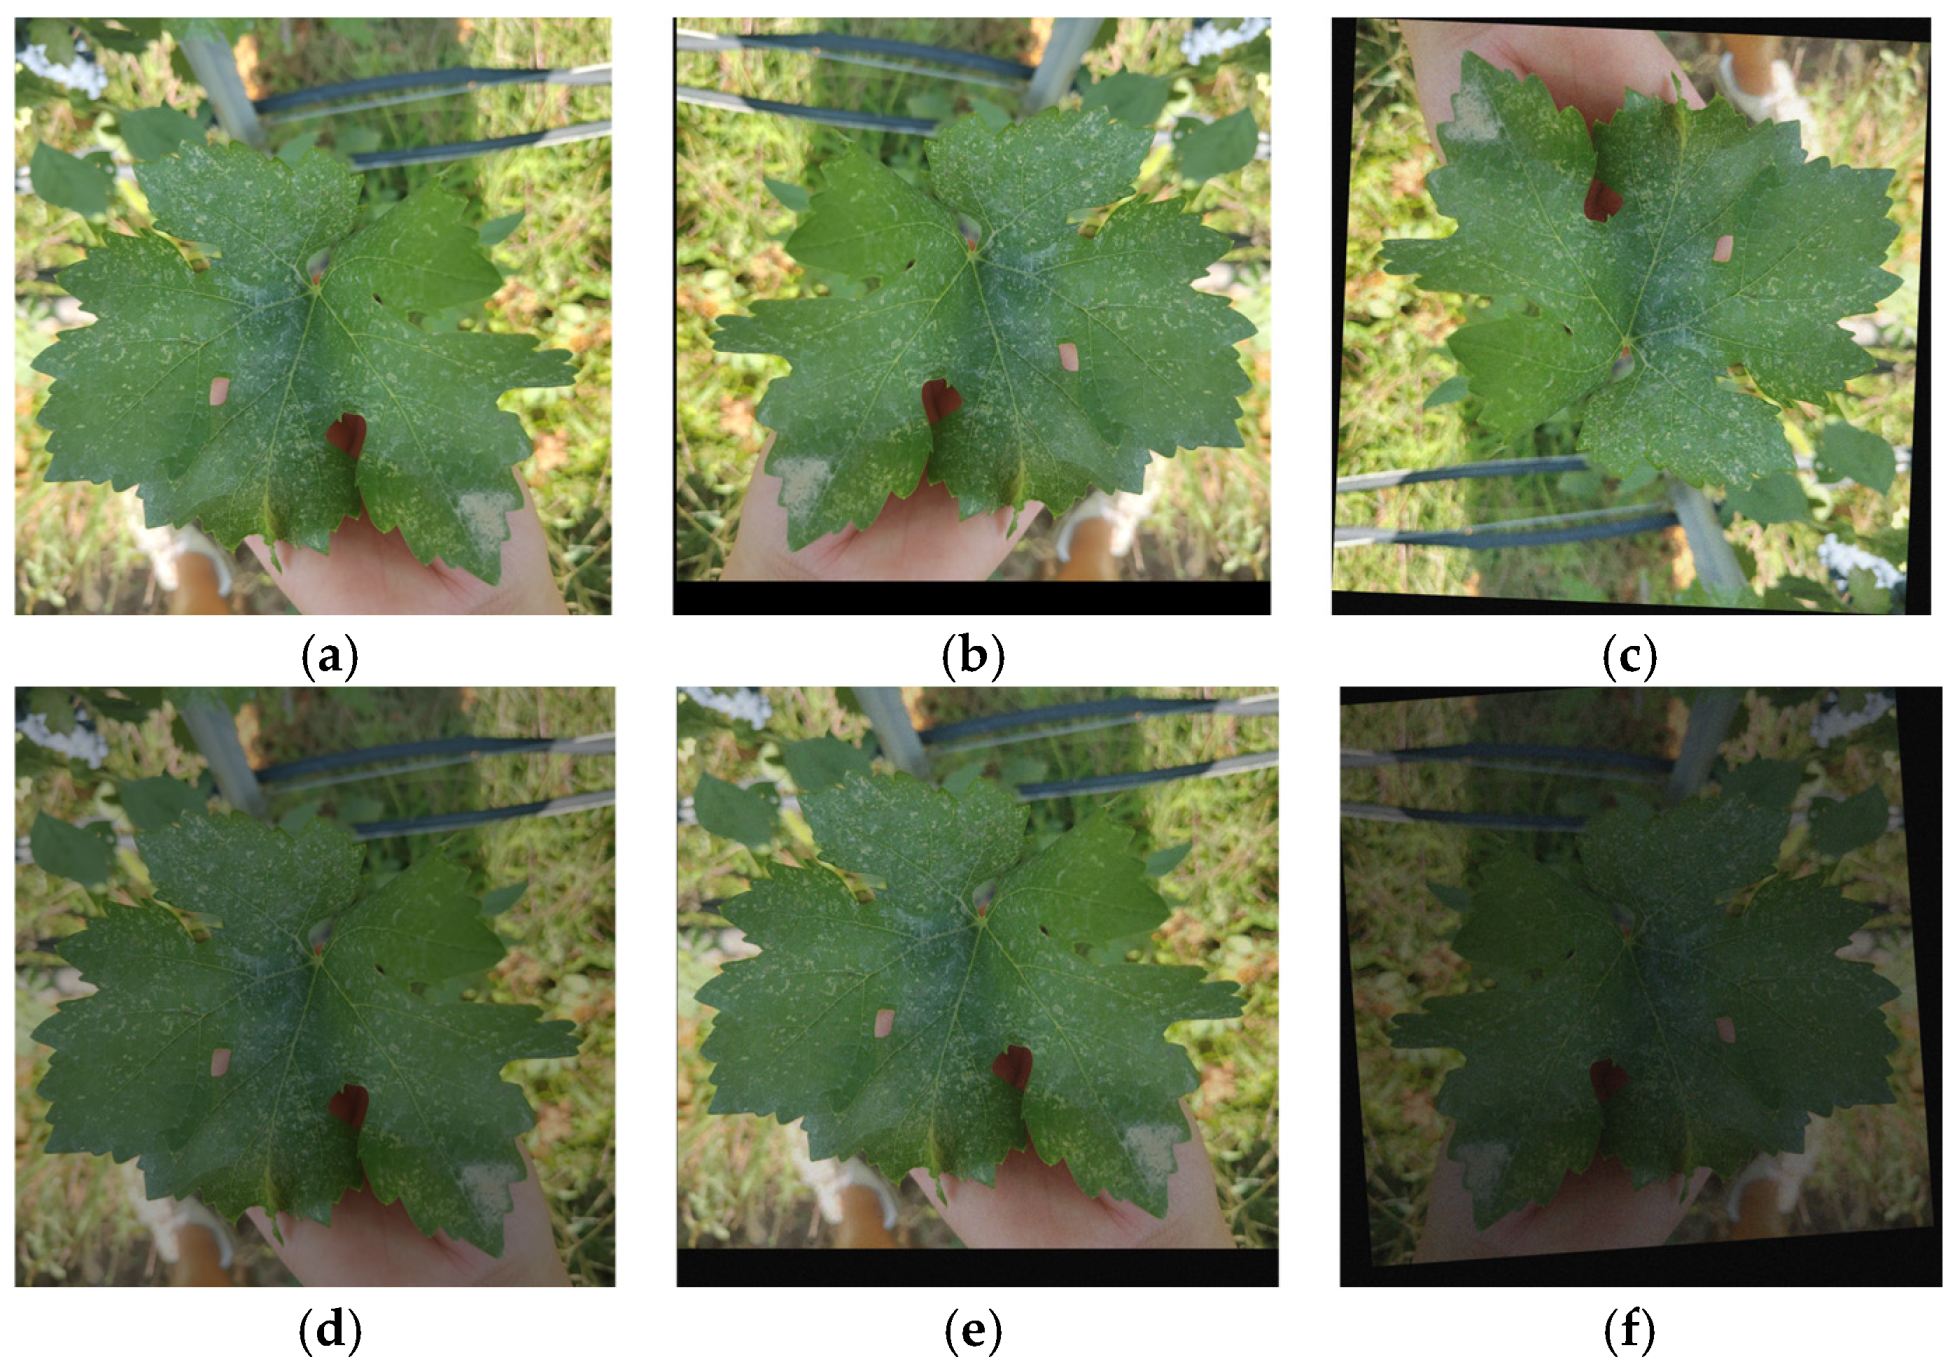
Grape leafhoppers inflict varying levels of damage on grape leaves, significantly reducing photosynthetic efficiency and overall plant health. To systematically evaluate and quantify infestation severity, this study categorizes grape leafhopper damage into five distinct levels based on long-term field observations. The classification is primarily determined by the proportion of damaged leaf area and the percentage of affected leaves. This standardized grading system ensures consistency in damage assessment and facilitates automated detection using deep learning models. The specific classification criteria are detailed in
Table 1, while
Figure 2 visually illustrates the characteristic symptoms associated with each damage level.
2.2. Data Acquisition and Pre-Processing
In this study, leaf image data of
Cabernet Sauvignon grapes were collected from Yuan’s Winery grape growing site in Yinchuan City, Ningxia (38.5° N, 106.04° E). To ensure the generalization of the dataset, a diversity of image sampling strategies was used. As shown in
Table 2, images from different periods, seasons, grape growth cycles, and weather conditions were included.
Figure 3 shows the images of grape leaves collected under different weather conditions. The acquisition capture device was an iPhone 13 (Apple Inc., Cupertino, CA, USA), and all images were saved in JPG format. During the acquisition process, the distance between the leaves and the camera was approximately 30 cm. After eliminating unnecessary and blurred images in the first step of the screening process, we obtained 2689 excellent images of grape leaves.
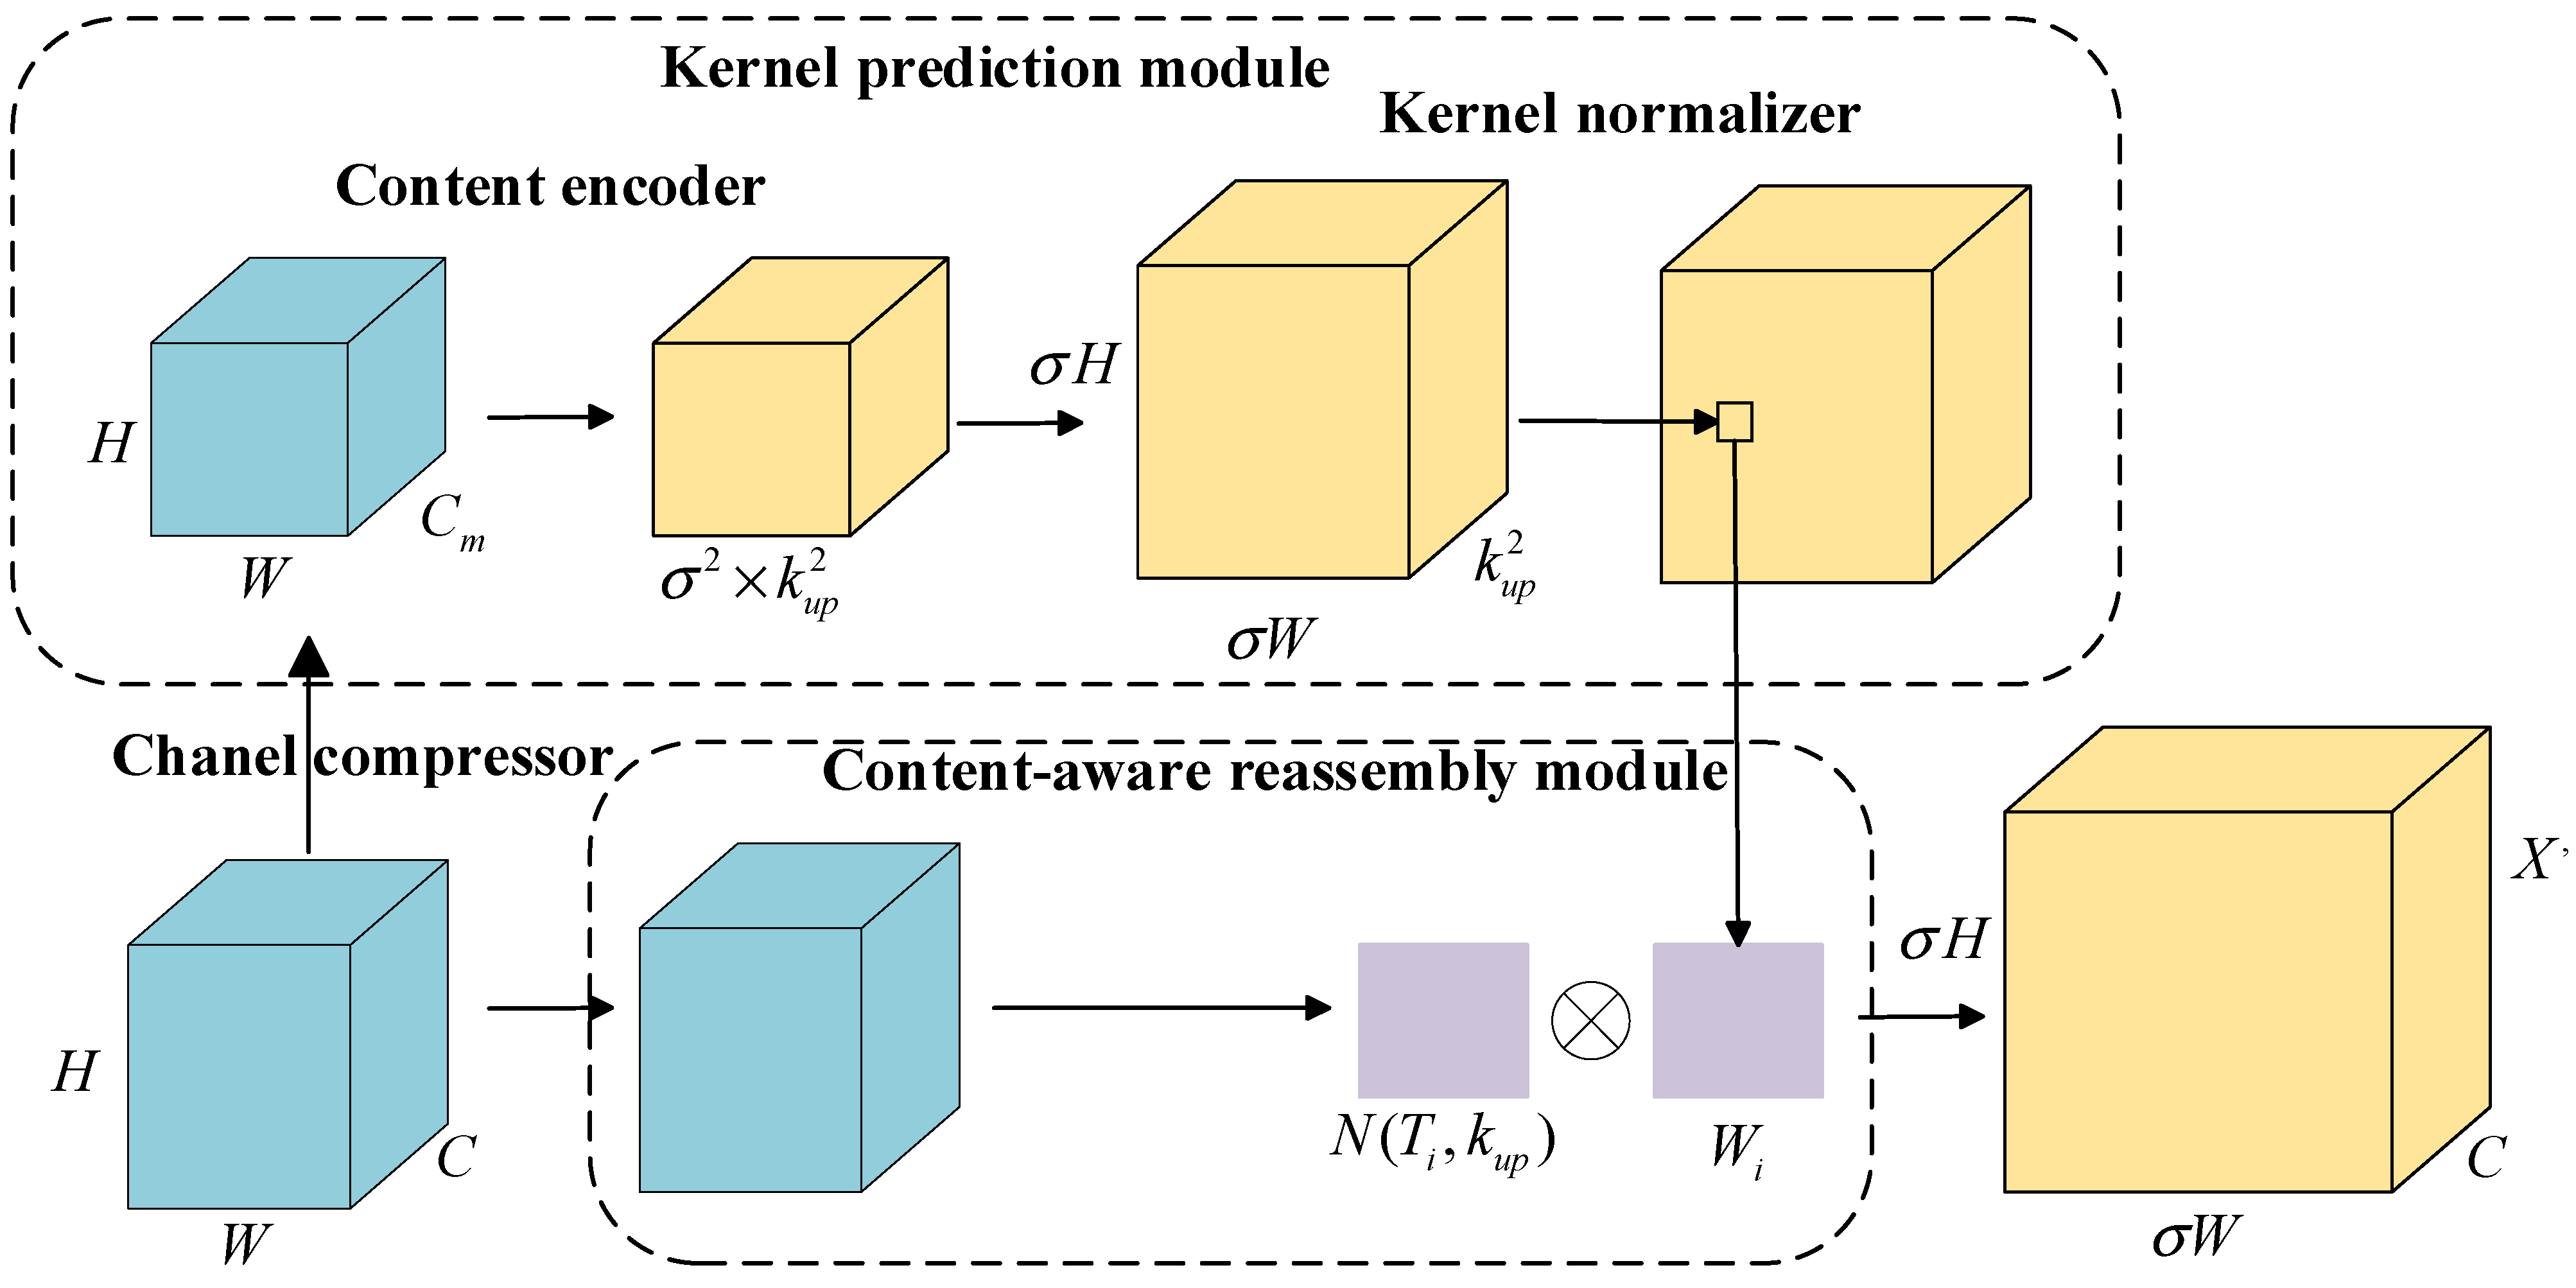
This study used the ImgAug library (version 0.4.0) to augment the original images, reducing the risk of neural network overfitting and simulating variations in vineyard images caused by differences in shooting angles, lighting conditions, and environmental interference. In particular, the panning operation was used to simulate changes in the leaves under different shooting positions; the rotation operation reflected how wind or changes in shooting angle caused the leaves to deviate from their orientation; the brightness adjustment simulated the color changes in the leaves under different lighting conditions; and the addition of noise was used to simulate the environmental disturbances and noises during the image acquisition process. After data augmentation, there were 7938 images.
Figure 4 shows the effect of data enhancement.
Following image preprocessing, we annotated the images using the LabelImg program (version 1.8.6), dividing them into six groups based on the condition of the leaves: uninfested leaf and Grades I–V leafhopper infestation. The annotation results were saved in XML format. To make sure the dataset has a good representation at every stage, we randomly divided the data according to a 7:2:1 ratio when building it. In the end, we acquired 5556 images for the training set, 1588 images for the validation set, and 794 images for the testing set.
2.3. Improved Strategy of YOLOv8 Model: CSF-YOLO
To overcome the limitations of the original YOLOv8n [
16] model, including interference from complex grape leaf backgrounds, overlapping leaves, insufficient detail extraction across damage levels, and the excessive computational demands that hinder both accuracy and mobile deployment, this study proposes CSF-YOLO, a lightweight and enhanced detection model. Specifically, CSF-YOLO replaces the CSPDarkNet53 backbone with the FasterNet architecture to reduce model parameters and computational complexity. Additionally, it integrates the CARAFE (Content-Aware ReAssembly of FEatures) upsampling module to enhance fine-grained feature representation and incorporates the SE (Squeeze-and-Excitation) attention mechanism to mitigate background interference, thereby improving detection precision. The architecture of CSF-YOLO is illustrated in
Figure 5.
2.3.1. FasterNet Lightweight Network
To enhance the model’s efficiency for grape leafhopper infestation level detection on mobile platforms, this study integrates the FasterNet lightweight network, proposed by Chen et al. [
27], replacing the CSPDarkNet53 backbone feature extraction network of the original YOLOv8n. FasterNet’s main innovation is its local convolution method, partial convolution (PConv).
Figure 6 illustrates its network’s structure. In contrast to traditional convolution, which treats all input channels equally, PConv dramatically reduces the overall computation while ensuring that crucial local information is properly captured by applying convolution filters to a subset of the input channels. Consequently, FasterNet lowers model parameters and FLOPs while maintaining the representation of characteristics that are necessary for accurate detection. The computational workload of PConv is expressed in terms of floating-point operations as follows in Equation (1):
When the channel count in the convolution process is reduced to one-fourth, the computational complexity of PConv is merely one-sixteenth that of traditional convolution. The quantity of floating-point operations for PConv is detailed in Equation (2):
When the number of channels utilized in the convolution operation is reduced to one-fourth, the memory access required is correspondingly only one-fourth that of traditional convolution methods. In Equations (1) and (2), , , and denote the height, width, and size of the convolution kernel of the feature map, respectively, while indicates the number of channels in conventional convolution. This efficient design enables FasterNet to significantly improve detection accuracy while being computationally suitable for deployment on mobile devices in real-time grape leafhopper infestation monitoring.
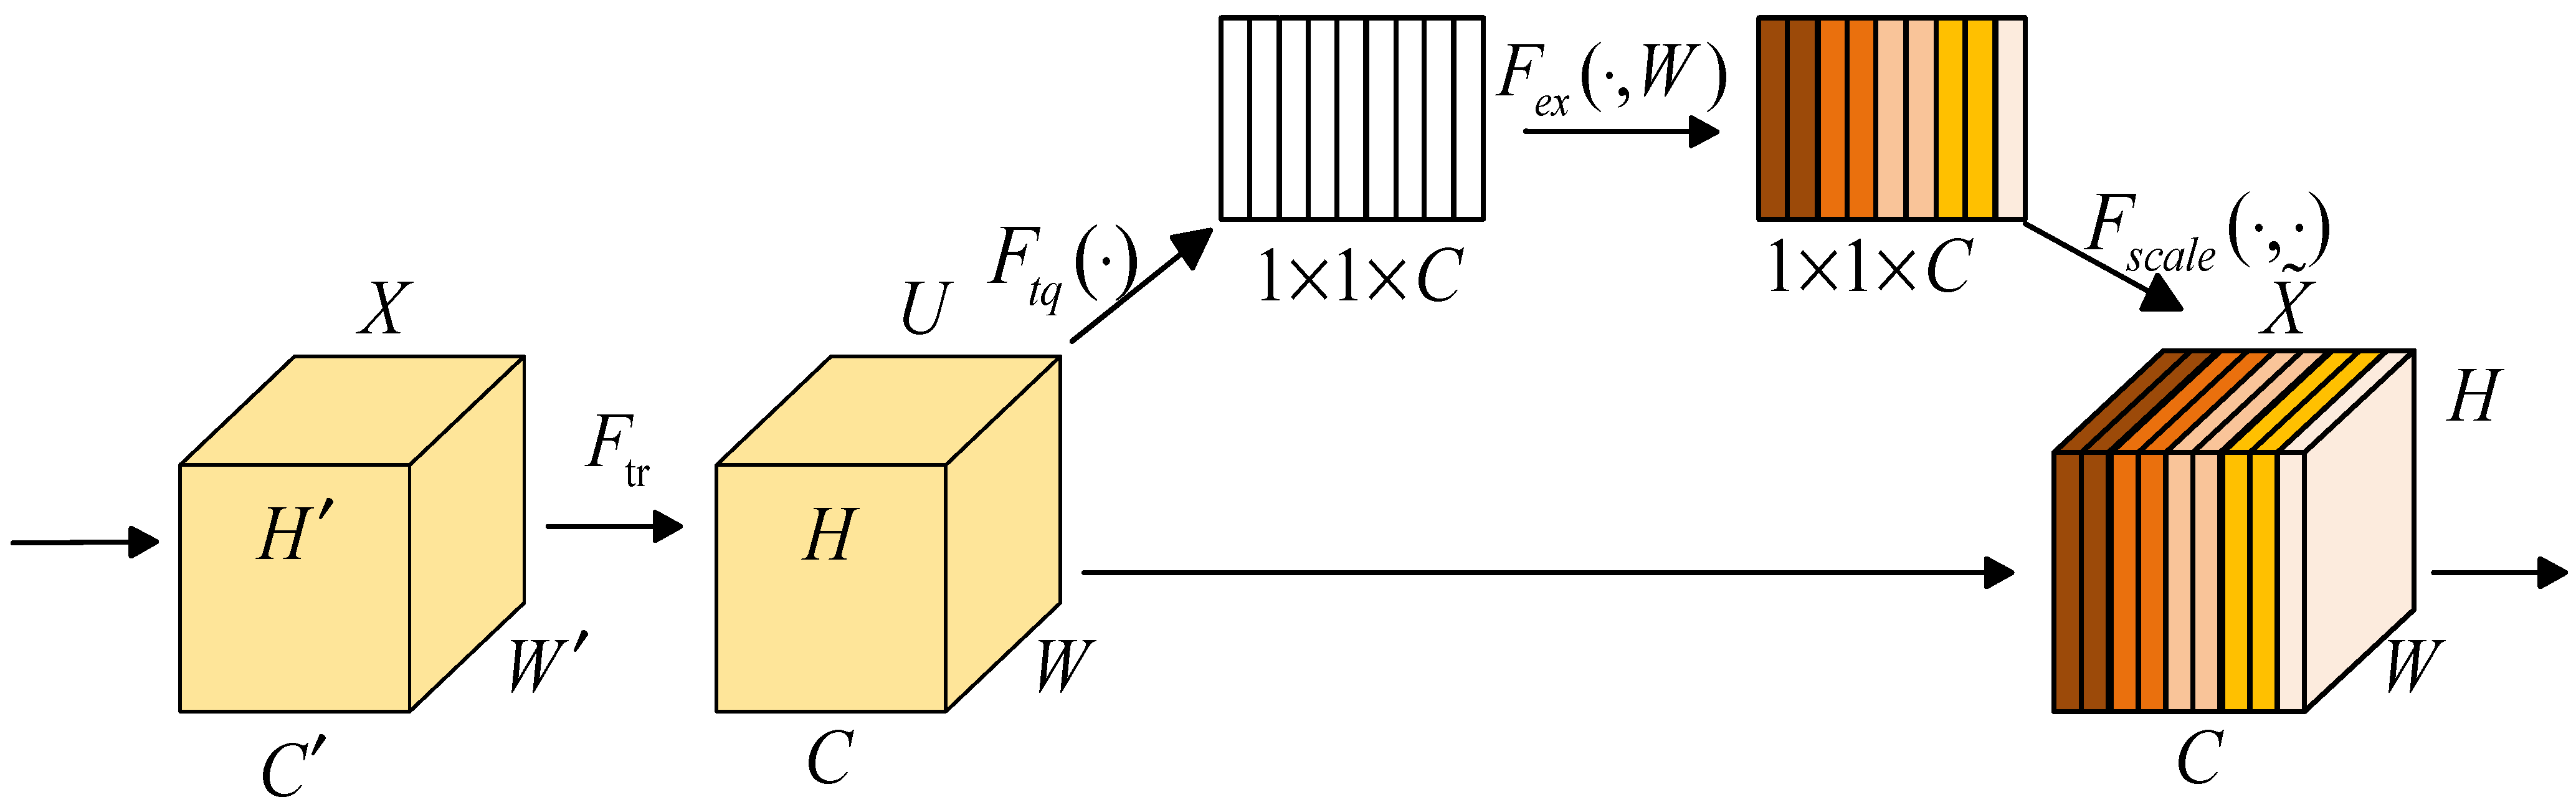
2.3.2. CARAFE Upsampling Module
In the original YOLOv8n architecture, the feature pyramid’s upsampling process employs nearest neighbor interpolation, which relies solely on pixel locations and neglects semantic context. This limitation restricts the perceptual domain, hindering the model’s ability to capture the fine details of different infestation levels of grape leafhoppers, particularly when dealing with small, subtle lesions. To address this issue, the present study integrates the CARAFE upsampling module [
28], significantly improving upsampling quality and enhancing the model’s ability to perceive varying infestation levels of grape leafhoppers.
The CARAFE module achieves high-quality upsampling through two key components: the kernel prediction module and the feature reorganization module. As shown in
Figure 7, the kernel prediction module generates diverse convolutional kernel parameter maps based on input features, enabling the adaptive capture of fine details in local regions of grape leaves. The feature reorganization module then applies these kernels to the input features, effectively enhancing the resolution of the upsampled feature map and preserving crucial details related to different infestation levels. In the grape leafhopper damage detection task, this method enables more precise identification of small lesions, improving the model’s accuracy in complex vineyard environments.
The CARAFE sampling process is delineated as follows: Initially, to mitigate computational complexity, the feature map of size is downsampled to using a 1 × 1 convolution, thereby reducing the number of channels of the input feature map to and generating a feature map of size . Subsequently, a convolution operation is performed to create the reconfiguration kernel, resulting in a feature map of size , where σ denotes the upsampling multiplicity and represents the predicted size of the upsampled kernel. The channel is then expanded into the spatial dimension and normalized using softmax to yield an upsampled kernel of size . Finally, the input feature map is processed through the feature reorganization module, where for each position in the output feature map, a region centered at that position is extracted, and a dot-product operation is conducted with the predicted up-sampling kernel to derive the output value for the corresponding position. Notably, different channels at the same position in the output feature map utilize the same upsampling kernel, ensuring efficient information utilization and parameter conservation. Following this processing, the resulting upsampled feature map attains dimensions .
2.3.3. SE Attention Mechanism
The intricate nature of the grape cultivation environment, coupled with the significant overlap of leaves, hampers the model’s ability to accurately identify individual grape leaves. In addition, multiple symptoms of diseases and pests often appear on grape leaves, which increases the risk of model misjudgment. To enhance the model’s performance and bolster its detection capabilities in complex backgrounds, this study incorporates the Squeeze-and-Excitation attention mechanism [
29] between the neck network and the detection head. Traditional convolutional neural networks (CNNs) typically process features across all channels using identical weights, which may lead to the model overlooking crucial information while incorporating irrelevant noise or redundant data into the decision-making process. The SE module addresses this limitation by adaptively modeling global information and dynamically adjusting the response strength of each channel. This mechanism effectively suppresses redundant data and background noise, allowing the model to maintain a stable focus on the target areas, even in complex environments. As a result, detection accuracy and robustness are significantly enhanced.
Figure 8 is referenced from Hu et al. [
29] to illustrate the structure of the SE attention module. Initially, an
operation is executed on the input feature map
to derive the feature map
. Following this, the
operation condenses the feature map into 1 × 1 ×
feature vectors through global average pooling. Subsequently, the
operation is employed for dimensionality reduction and recovery via two fully connected layers: the first layer compresses the 1 × 1 ×
feature vectors to lower dimensions to decrease computational load and learn inter-channel relationships, while the second layer restores the compressed feature vectors to the original channel count
, producing a weight vector that matches the number of channels. This weight vector is then normalized to a range between 0 and 1 using a sigmoid function. Ultimately, the
operation applies the derived attention weights to each channel feature, thereby amplifying relevant features and attenuating those that are extraneous. This improvement provides a practical solution to challenges such as leaf overlap and the interference caused by multiple pests and diseases in grape leafhopper infestation detection.
3. Results
3.1. Experimental Environment and Evaluation Indicators
3.1.1. Experimental Environment
The experimental environment of this paper is as follows. The operating system is Windows 11 (64-bit), the CPU is a 12th Gen Inter Core™ i9-12900k, the system memory is 32 GB, and the graphics card is an NVIDIA RTX A4000 (NVIDIA Corporation, Santa Clara, CA, USA). The PyTorch (version 2.0.1) deep learning framework is used, and the editor is PyCharm (version 2022.3.3) Network. The model is trained using the PyTorch deep learning framework, with the editor being PyCharm. The training parameters are as follows: the input images are resized to 640 × 640 pixels, the batch size is set to 16 for each training iteration, the optimizer used is SGD, and a total of 300 training epochs are performed. The initial learning rate is set to 0.01, with weight decay applied at a rate of 0.0005 after each epoch.
3.1.2. Evaluation Indicators
This study aims to thoroughly evaluate the model’s performance using multiple metrics, including accuracy (Precision, P), recall (Recall, R), average precision, mean average precision (mAP), Giga Floating-Point Operations Per Second (GFLOPs), and the number of parameters. The calculations for P, R, and mAP are derived from Equations (3)–(5).
where
represents the count of true positive instances correctly identified,
denotes the count of false positives, and
indicates the count of false negatives.
3.2. Model Training and Results
3.2.1. Ablation Experiment
To assess the influence of enhancement strategies on the model’s detection efficacy, this study employs YOLOv8n as a reference point. The research incorporates the FasterNet lightweight architecture, the CARAFE upsampling module, and the SE attention mechanism individually while also conducting a comprehensive analysis of the synergistic effects of these three enhancement strategies on model performance. The findings from the ablation experiments are presented in
Table 3.
Table 3 demonstrates that replacing the YOLOv8n backbone with FasterNet reduces the model’s parameter count and computational cost by 33.9% and 12.3%, respectively, resulting in a significant enhancement in computational efficiency. FasterNet employs partial convolution (PConv) to focus on specific input channels, optimizing resource allocation and mitigating early feature loss due to excessive downsampling in complex backgrounds. However, this lightweight approach leads to a 1.38% decrease in mAP, as it may compromise global feature aggregation, thereby impairing the representation of certain lesion areas.
The CARAFE module employs a content-aware upsampling mechanism, increasing mAP by 1.72%. In grape leafhopper detection, lesions are often small and irregular, and traditional nearest neighbor interpolation typically fails to capture these fine details, leading to missed lesions. CARAFE dynamically generates adaptive kernels based on local features, reconstructing high-resolution feature maps that preserve critical details. This allows the model to detect subtle differences between varying infestation levels, enhancing its ability to identify small lesions and improving overall accuracy.
The SE attention mechanism adaptively adjusts channel weights, improving mAP by 0.88%. In vineyard environments, severe leaf overlaps can cause the model to merge multiple leaves into a single entity, obscuring lesion boundaries or misclassifying healthy leaf edges as damaged. The SE module enhances the representation of target leaves while suppressing irrelevant background interference, thereby improving the model’s ability to distinguish individual leaves.
Integrating FasterNet with SE results in a 1.5% improvement in mAP, with SE compensating for FasterNet’s limitations in feature representation and maintaining high detection accuracy in complex backgrounds. Additionally, combining CARAFE with SE enhances mAP by 2.3%, significantly improving the detection of small lesions in intricate backgrounds. The fusion of CARAFE with FasterNet achieves a mAP of 88.72% (a 2.5% improvement over YOLOv8n) with 7.30 G and 2.66 million parameters, balancing computational efficiency with detection accuracy, especially for small lesions in complex environments.
Finally, integrating FasterNet, CARAFE, and SE leads to only a slight increase in computational complexity while boosting mAP by 2.9%. This configuration delivers the highest detection performance across all test scenarios while retaining the model’s lightweight nature. Therefore, CSF-YOLO efficiently and accurately classifies grape leafhopper damage in complex vineyard environments, effectively balancing computational efficiency and detection accuracy.
3.2.2. The Comparison Experiments of CSF-YOLO Other with State-of-the-Art Object Detection Models
To evaluate the performance of CSF-YOLO in pest and disease detection, we conducted comparative experiments using a range of mainstream object detection models, including SSD [
12], Faster R-CNN [
10], YOLOv5, YOLOv7 [
15], YOLOv8n [
16], YOLOv9 [
17], and YOLOv10. These models span traditional detection methods from state-of-the-art deep learning approaches and have demonstrated robust performance in pest and disease detection tasks. To ensure a fair and meaningful comparison, all models were trained and evaluated under consistent training environments, identical parameter settings, and with uniform input resolution (640 × 640).
The experimental results in
Table 4 demonstrate that CSF-YOLO outperforms other models in several key metrics. Specifically, CSF-YOLO achieves a mAP of 90.15%, which is an improvement of 24.66% over SSD (65.49%), 11.01% over Faster R-CNN (79.14%), 4.68% over YOLOv5 (85.47%), 5.62% over YOLOv7 (84.53%), 1.82% over YOLOv8n (88.33%), 2.19% over YOLOv9 (87.96%), and 2.06% over YOLOv10 (88.09%). As highlighted in rows 5 and 7 of
Table 4, these improvements indicate that CSF-YOLO exhibits superior overall recognition accuracy in detecting grape leafhopper damage. Additionally, its recall rate (83.99%) and precision (85.95%) surpass those of all the comparative models, as shown in rows 2, 4, and 6 of
Table 4, further validating the model’s robustness in complex vineyard scenarios.
In terms of computational efficiency, CSF-YOLO also demonstrates significant advantages. The model’s FLOPs are only 7.0 G, which is a reduction of 13.58% compared to YOLOv8n (8.1 G), as seen in row 5 of
Table 4. Furthermore, the number of parameters (2.59 M) is 13.95% lower than YOLOv8n (3.01 M). This optimization enables CSF-YOLO to maintain high performance while substantially reducing computational resource requirements, making it well-suited for deployment on resource-constrained mobile devices. In contrast, traditional models such as SSD (FLOPs = 122.4 G, Params = 4.35 M) and Faster R-CNN (FLOPs = 148.3 G, Params = 41.02 M) suffer from excessive computational complexity, which makes them unsuitable for real-time monitoring applications. Additionally, YOLOv5 (15.5 G) and YOLOv7 (74.8 G) still exhibit significantly higher computational costs compared to CSF-YOLO. Although YOLOv8n achieves competitive mAP performance, its FLOPs (8.1 G) and parameters (3.01 M) remain inadequate for extreme efficiency requirements.
In conclusion, the CSF-YOLO model not only excels in detecting grape leafhopper damage levels but also offers a lightweight solution that enables deployment on mobile devices, thereby providing a practical approach for real-time grape field monitoring.
To evaluate the performance of the CSF-YOLO model, we used a 5-fold cross-validation method to avoid the accidental nature of the model results.
Table 5 shows the experimental results. The average mAP value of the model is 89.90 ± 0.32, which is significantly better than YOLOv8n (87.78% ± 0.49). In addition, the paired
-test results of CSF-YOLO and the baseline model (t = 8.15,
p = 0.0012 < 0.005) show that the performance improvement is statistically significant. These results demonstrate the effectiveness of the CSF-YOLO model in identifying and classifying grape leafhopper damage.
3.2.3. Performance Comparison of CSF-YOLO and YOLOv8n
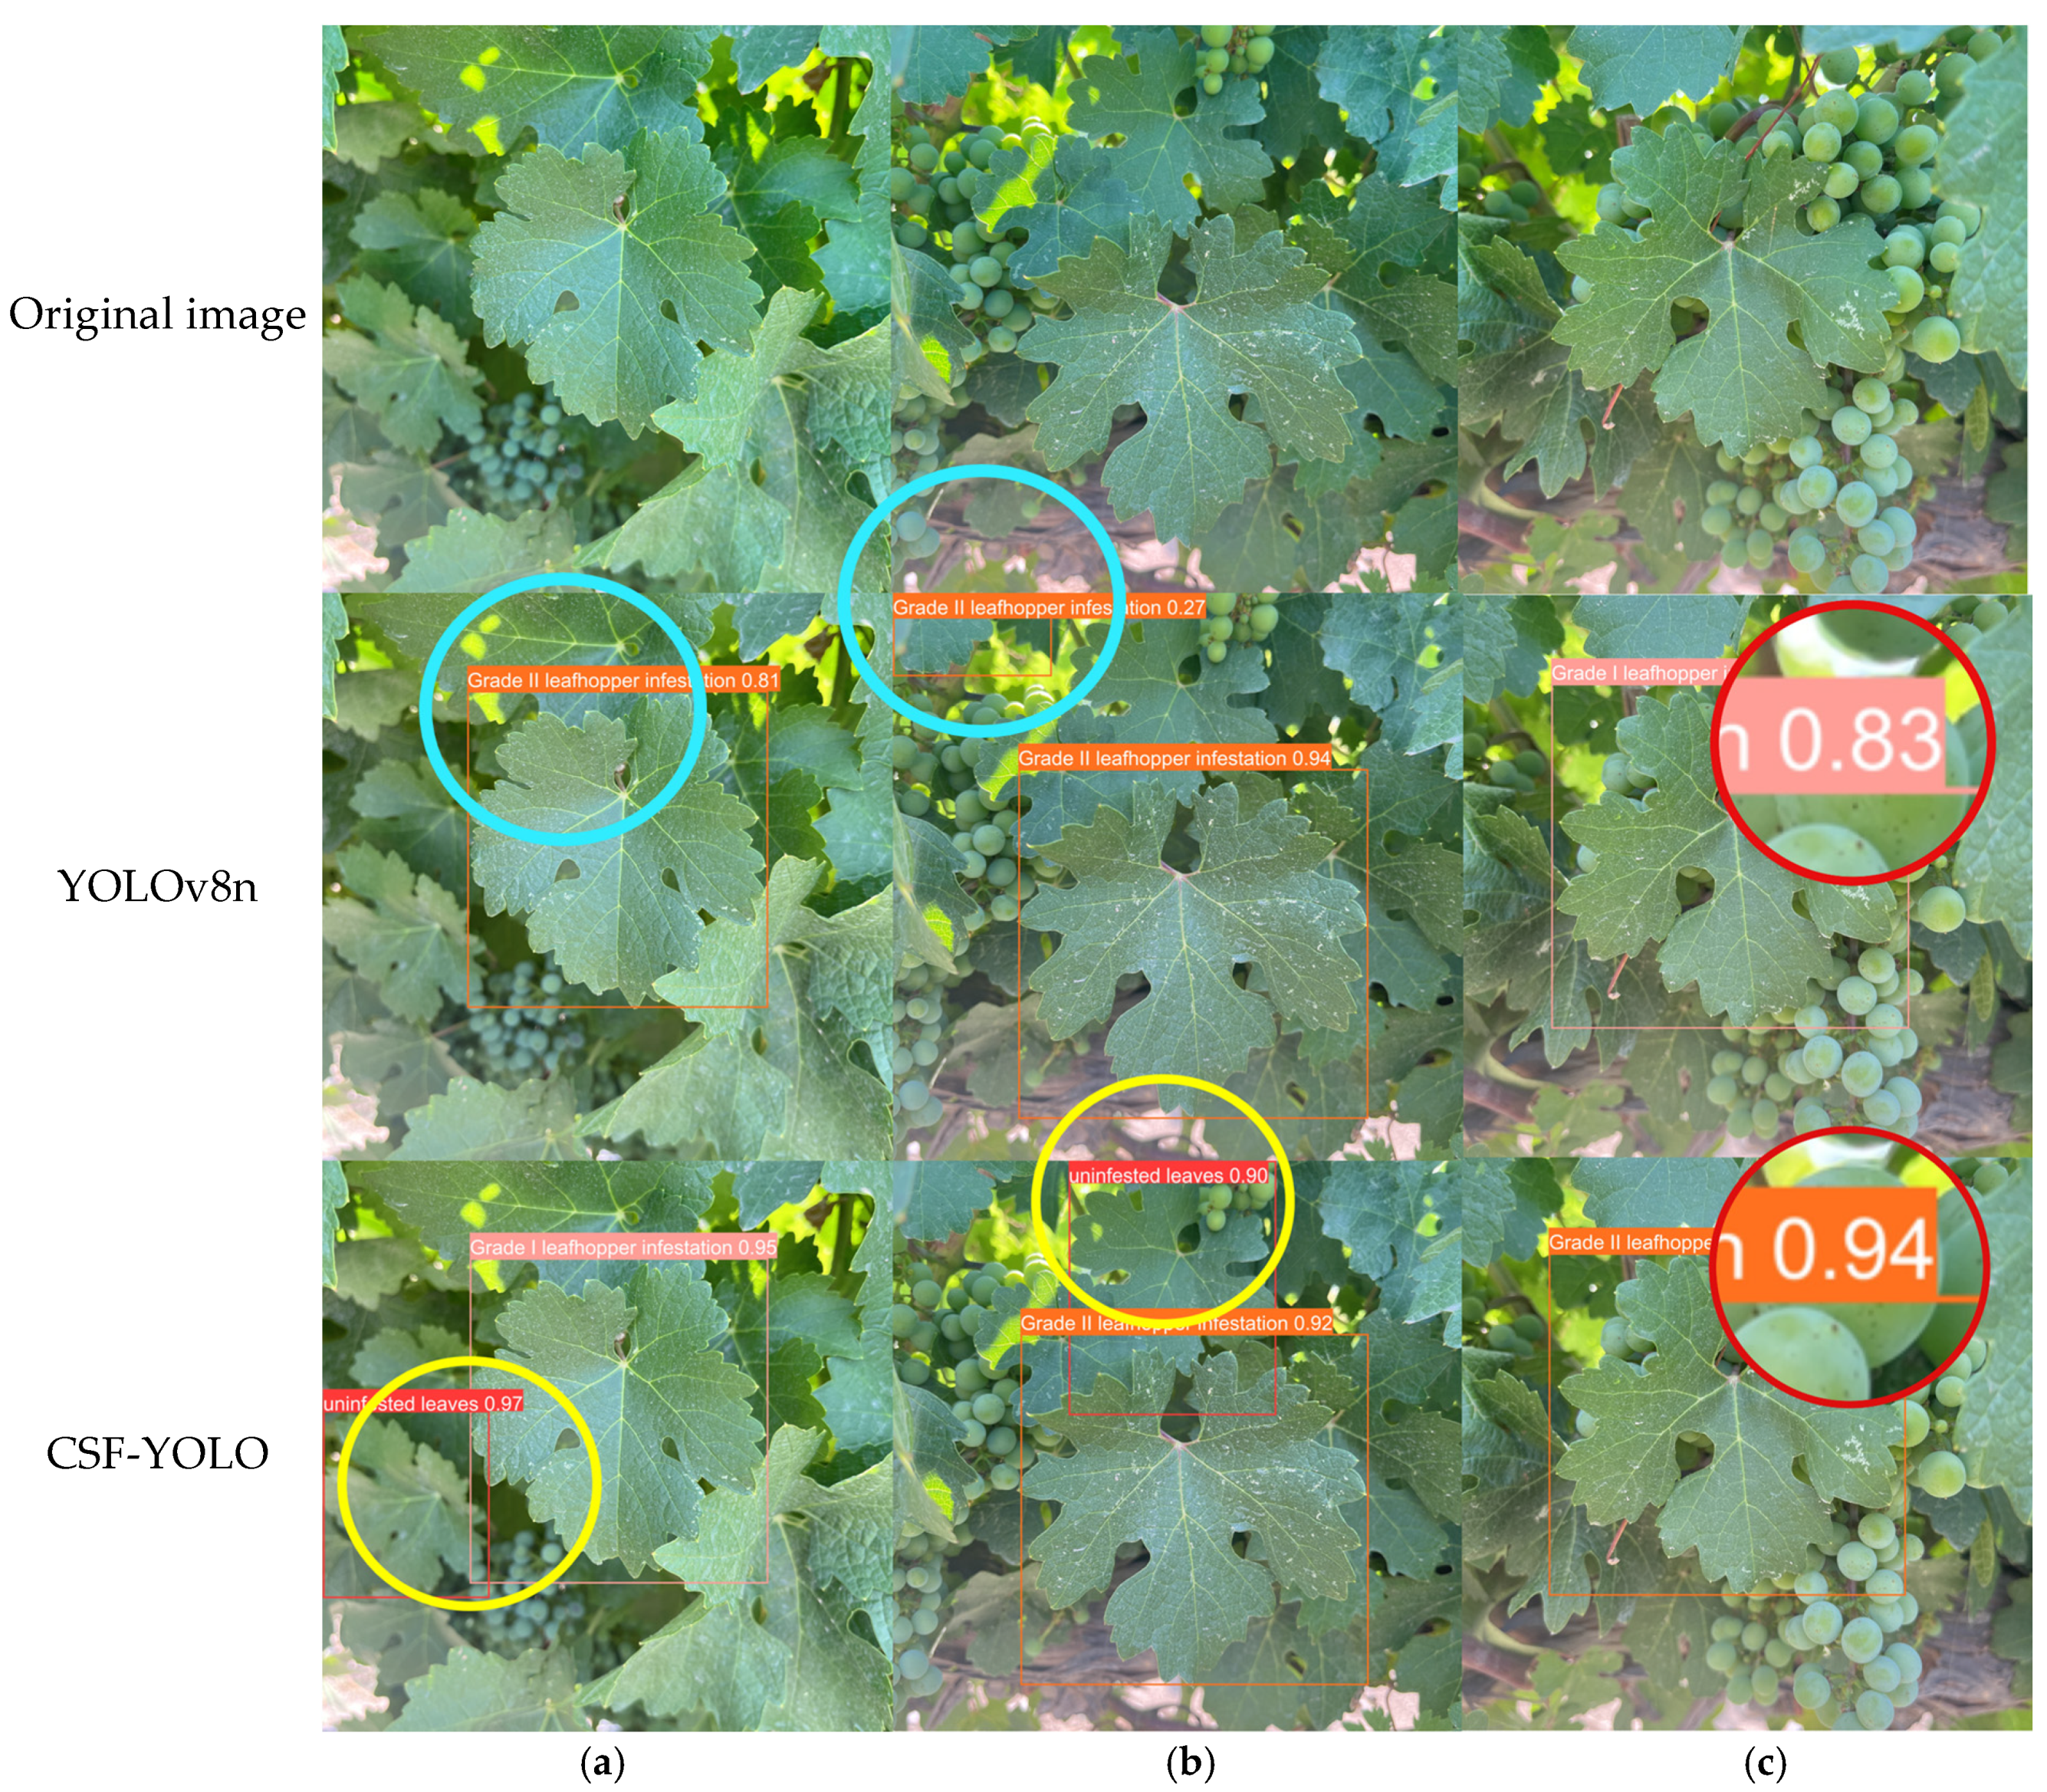
To evaluate the performance of the CSF-YOLOv8 model, we randomly selected images from the test set exhibiting varying degrees of damage and complex backgrounds and conducted comparative detection experiments with YOLOv8n.
Figure 9 presents the detection results.
In
Figure 9a, YOLOv8n failed to detect the leaf on the left side (ground truth: uninfested leaf) and erroneously detected the lesions in the center as Grade II (ground truth: Grade I). In
Figure 9b, the CSF-YOLO model successfully detected the uninfected leaf at the top of the image, whereas YOLOv8n not only missed the leaf but also misidentified the part of the leaf in the upper as Grade III. In
Figure 9c, the CSF-YOLO model accurately detected Grade II lesions with a higher confidence score, while YOLOv8n misidentified them as Grade I (ground truth: Grade II) with a lower confidence score.
Overall, the CSF-YOLO model effectively enhances the detection capability for varying levels of grape leafhopper damage, significantly reducing missing and false detections.
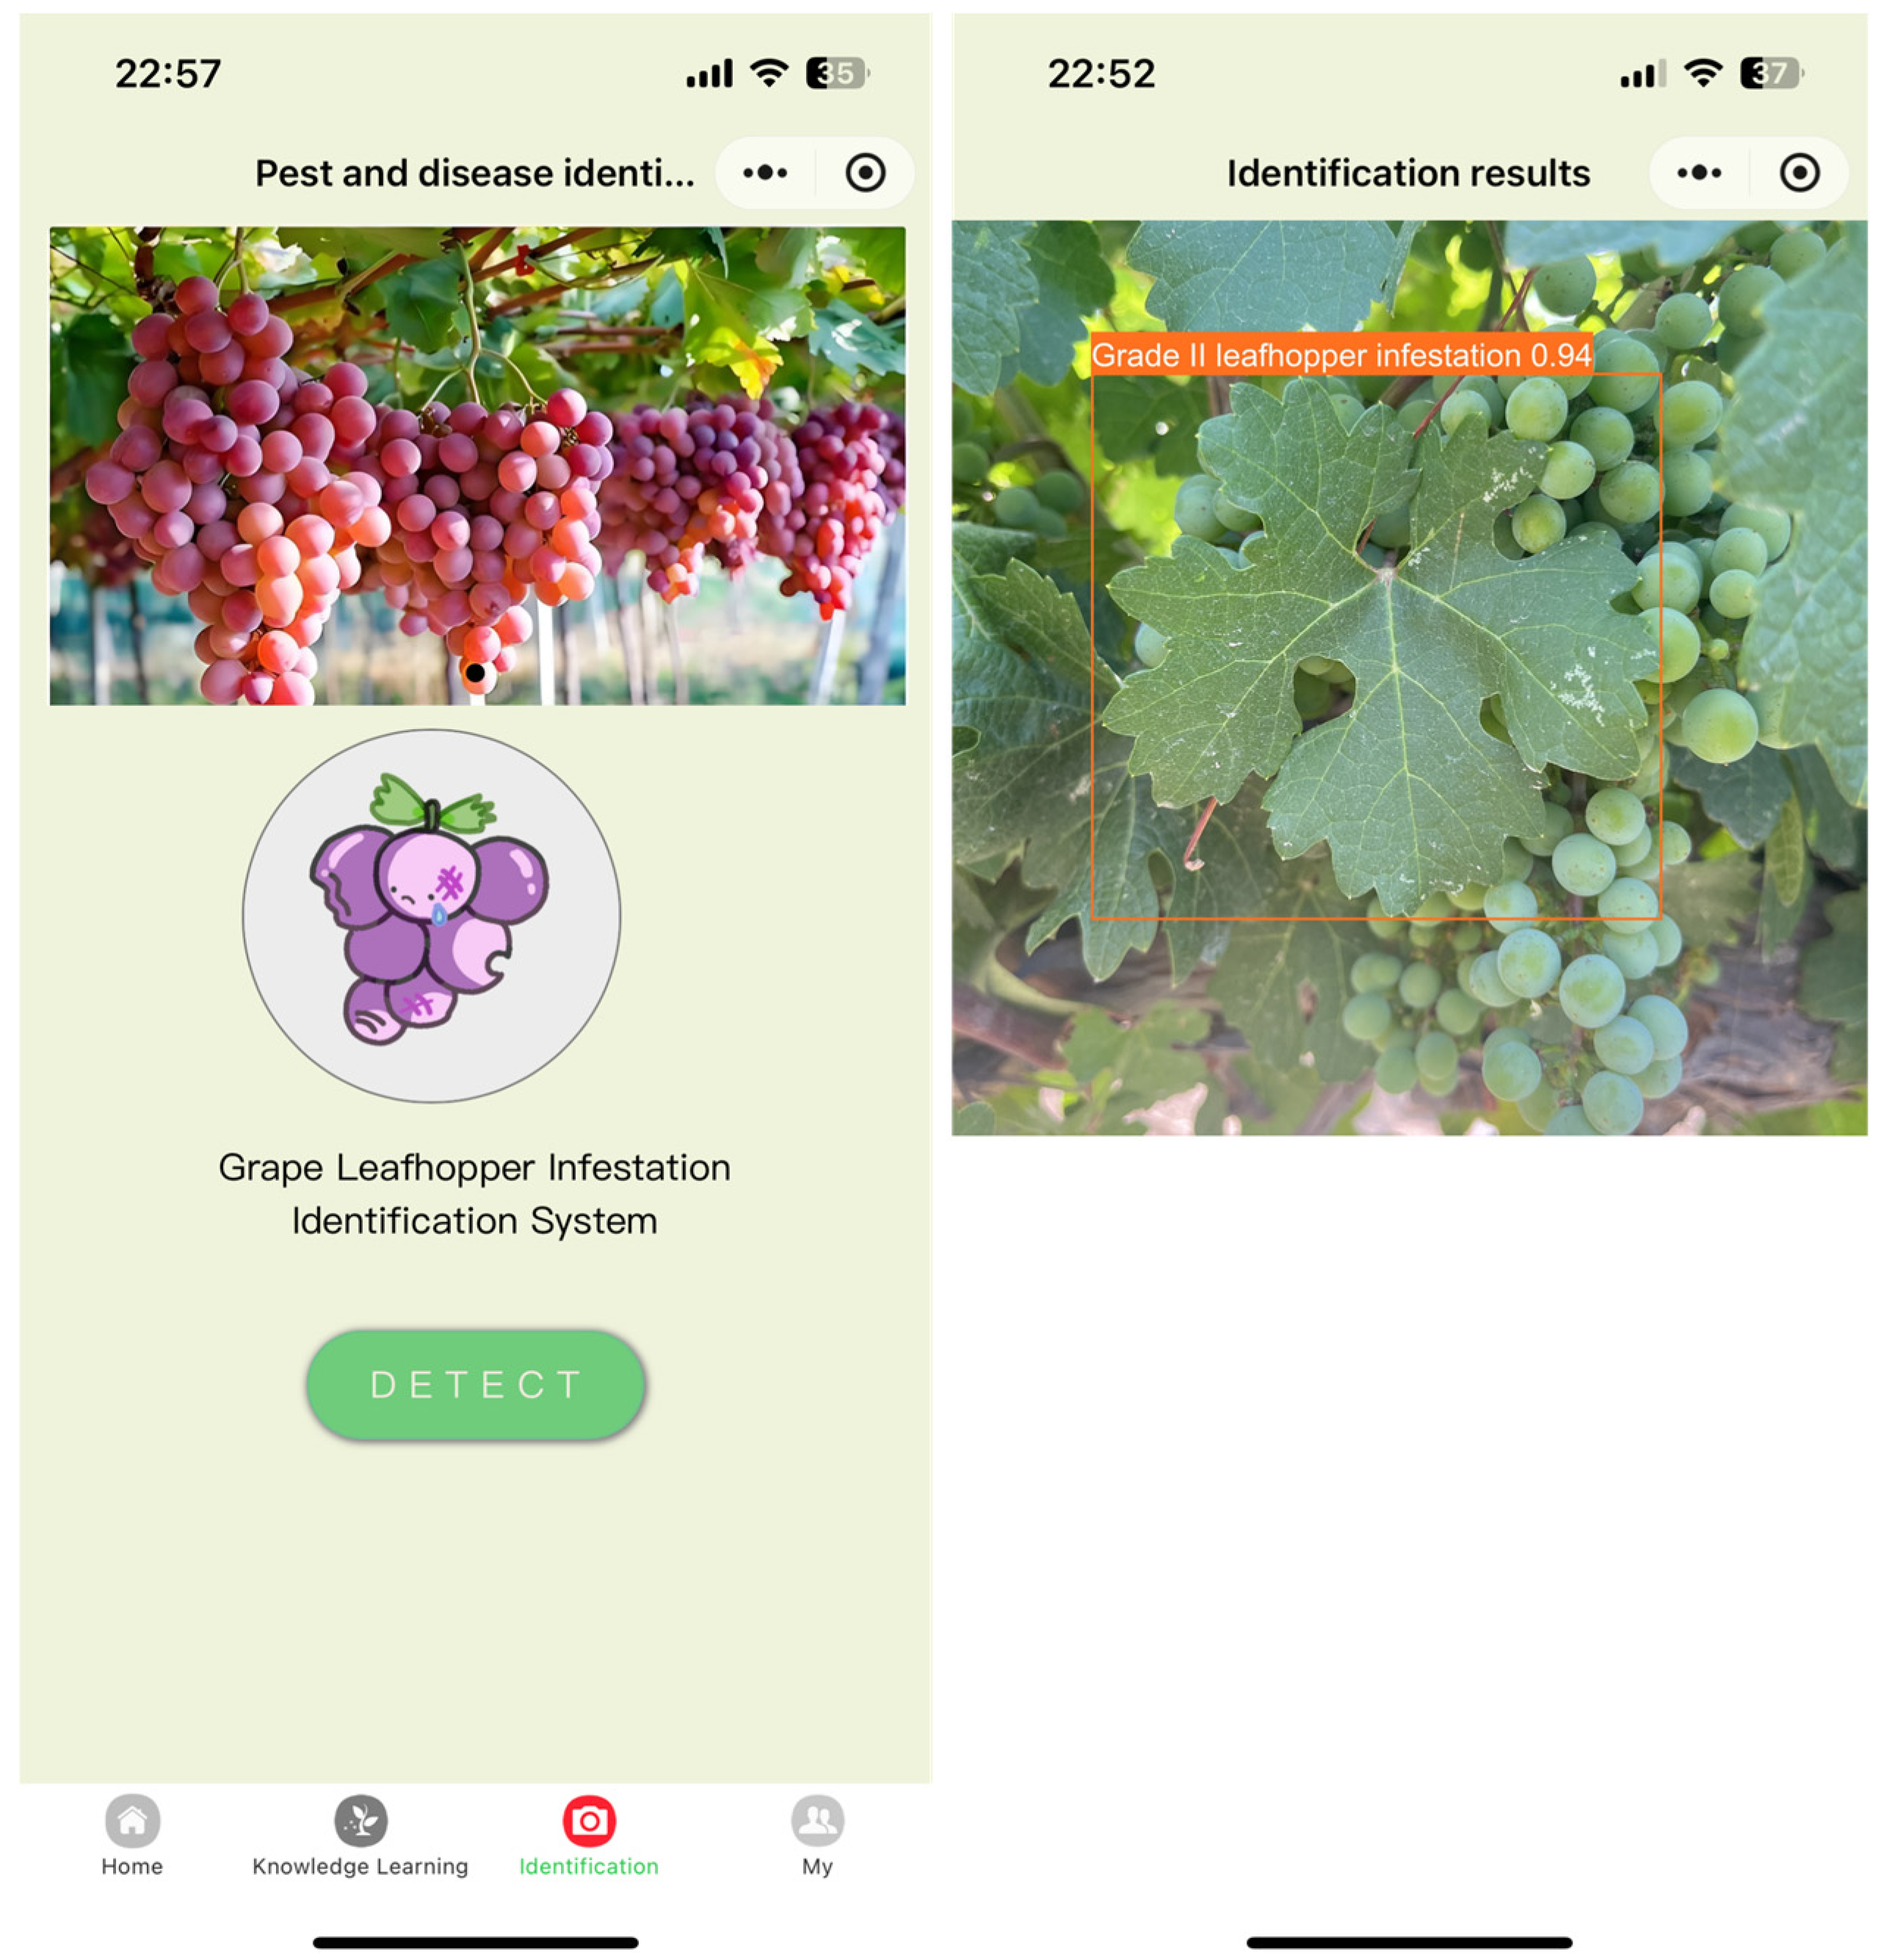
3.3. Deployment of CSF-YOLO on Mobile
To facilitate the application of the improved model in agricultural production, this study developed a grape leafhopper pest identification and control system based on a WeChat mini-program. The system allows users to upload images of grape leaves images and perform real-time inference and prediction using the program’s recognition function. The system’s test page and results, which are shown in
Figure 10, demonstrate its effectiveness in field environments. Experimental results indicate that the system accurately assesses the severity of grape leafhopper damage, meeting practical production requirements and showing strong potential for real-world application.
4. Discussion
Deep learning has emerged as a crucial tool in agricultural pest detection; however, its effectiveness heavily depends on the availability of high-quality datasets and the development of efficient detection models. This study introduces dual innovations in both data and methodology: the creation of the first specialized image dataset focusing on grape leafhopper (Erythroneura spp.) damage and the development of a five-level damage severity classification based on the proportional area of leaf lesions. Specifically, the dataset includes 7938 leaf images from Cabernet Sauvignon grapes, representing various seasons, weather conditions, and growth stages, with data augmentation techniques applied to simulate complex field environmental factors. Additionally, the damage severity classification, developed through long-term field observations, quantified leafhoppers’ damage into Levels I–V, overcoming the limitations of traditional binary detection approaches that only classify the “presence or absence” of pests. This innovation not only enhances the practical applicability of the model but also supports precision pesticide application and damage assessment.
In terms of model design, CSF-YOLO strikes a balance between high accuracy and low computational costs by integrating the lightweight FasterNet backbone, the CARAFE upsampling module, and the SE attention mechanism. Experimental results demonstrate that the model achieves a mAP of 90.15% on our custom dataset, surpassing YOLOv8n by 1.82% while reducing FLOPs by 13.58%. The successful deployment of the model of mobile devices further confirms its potential for real-world applications.
Despite these promising results, several limitations remain. First, the current dataset includes leaf images from only a single grape variety (Cabernet Sauvignon) in the Ningxia region, and the study addresses only one pest type—leafhoppers. Future research could expand the dataset to encompass multiple grape varieties and regions, consider environmental factors such as lighting, and incorporate other common grape pests to improve the model’s generalizability. Second, the model’s ability to detect severely deformed targets (e.g., folded leaves), other species of pest and disease damage, and densely overlapping objects requires further refinement. Finally, although CSF-YOLO has been preliminarily deployed on mobile devices, further optimization of its performance is required. A promising direction for future research involves integrating CSF-YOLO with sensor networks and unmanned aerial vehicle (UAV) technology. By combining real-time environmental data from sensor networks (e.g., temperature, humidity, and soil moisture) with UAV-based imaging, the model’s ability to monitor vineyard conditions comprehensively can be significantly enhanced. Moreover, coupling CSF-YOLO with a decision support system (DSS) would enable automated pesticide application recommendations. Based on the severity of pest damage, the DSS would adjust pesticide dosages accordingly, optimizing resource use and minimizing the over-application of chemicals. These advancements would facilitate the practical deployment of the model in large-scale vineyards, enhancing pest and disease management while promoting sustainable viticulture practices.
5. Conclusions
To enable the rapid and accurate detection of grape leafhopper damage levels in complex environments, this study constructs a comprehensive grape leafhopper damage dataset and proposes an improved detection model, CSF-YOLO, built upon this dataset. First, the model replaces the CSPDarkNet53 backbone in YOLOv8n with the lighter FasterNet network to reduce model complexity. Second, the CARAFE upsampling module is adopted in place of the traditional nearest-neighbor upsampling method, effectively addressing the issue of small target detection. Finally, the SE attention mechanism is incorporated before each detection head to enhance feature extraction, thereby improving the model’s performance in challenging vineyard environments. Experimental results demonstrate that CSF-YOLO achieves P, R, and mAP values of 85.95%, 83.99%, and 90.15%, respectively, surpassing the baseline YOLOv8n model by 1.60%, 0.93%, and 1.82%. The model significantly improves feature extraction, reducing both missed detections and false positives. Furthermore, CSF-YOLO’s parameters and FLOPs are 2.59 M and 7.0 G, respectively, representing a reduction in parameter count and computational complexity by 13.95% and 13.58% compared to the YOLOv8n baseline. Notably, CSF-YOLO enables real-time access to detection results on mobile devices, highlighting its practical potential for vineyard pest monitoring. In conclusion, CSF-YOLO provides substantial technical support for the automation and intelligence of grape leafhopper damage monitoring, advancing the application of smart agricultural technologies in grapevine cultivation.
Author Contributions
Conceptualization, L.Z.; methodology, C.W., L.Z. and L.W.; software, L.W.; validation, C.W., L.W. and L.Z.; formal analysis, L.W.; investigation, C.W. and L.W.; resources, G.M.; data curation, L.W. and G.M.; writing—original draft preparation, L.W.; writing—review and editing, C.W. and L.Z.; visualization, L.W.; dataset acquisition, L.W.; supervision, C.W. and L.Z.; project administration, L.Z.; funding acquisition, L.Z. and G.M. All authors have read and agreed to the published version of the manuscript.
Funding
This research was funded by the Chinese Agriculture Research System (CARS-29-bc-4) and the National Natural Science Foundation of China (32471597).
Data Availability Statement
The raw data supporting the conclusions of this article will be made available by the authors upon request.
Conflicts of Interest
The authors declare no conflicts of interest.
References
- Li, H.; Wang, H.; Liu, S. China’s Entry into the OIV: Opportunities, Challenges, and Strategies for the Wine Industry. Sino-Overseas Grapevine Wine 2025, 1, 1–9. [Google Scholar]
- Li, R.; Zhu, L.; Ma, C. Occurrence and IPM Strategies of Small Pests in Vineyard. Sino-Overseas Grapevine Wine 2022, 6, 76–82. [Google Scholar]
- Zhang, J.; Yu, G. Identification of two common leafhoppers (Hemiptera: Cicadellidae) on grapevine in China. Sino-Overseas Grapevine Wine 2020, 5, 5–37. [Google Scholar]
- Zhang, X.; Zhou, Y.; Li, Y.; Fu, X.; Liu, Y.; Chen, Z.; Chen, J.; Zhao, R.; Liu, Q.; Zhang, Y.; et al. Control Efficacy of Botanical Pesticides Against Apolygus lucorum (MeyerDür) and Erythroneura apicalis (Nawa) for Grape. Sci. Technol. Rev. 2014, 32, 36–40. [Google Scholar]
- Zhang, H.; Zhang, Y.; Su, W. Post-Hibernantion, Overwintering and Spatial Distribution Pattern of Arboridia kakogawana Adult(Hemiptera:Cicadellidae). Heilongjiang Agric. Sci. 2024, 5, 57–62. [Google Scholar]
- Qi, L. Occurrence regularity and control measures of grape leafhopper in Hexi Corridor of Gansu province. Sino-Overseas Grapevine Wine 2018, 2, 40–42. [Google Scholar]
- Dhanya, V.; Subeesh, A.; Kushwaha, N.; Vishwakarma, D.K.; Kumar, T.N.; Ritika, G.; Singh, A. Deep learning based computer vision approaches for smart agricultural applications. Artif. Intell. Agric. 2022, 6, 211–229. [Google Scholar] [CrossRef]
- Deepalakshmi, P.; Lavanya, K.; Srinivasu, P.N. Plant leaf disease detection using CNN algorithm. Int. J. Inf. Syst. Model. 2021, 12, 1–21. [Google Scholar] [CrossRef]
- Kaya, Y.; Gürsoy, E. A novel multi-head CNN design to identify plant diseases using the fusion of RGB images. Ecol. Inform. 2023, 75, 101998. [Google Scholar] [CrossRef]
- Ren, S.; He, K.; Girshick, R.; Sun, J. Faster R-CNN: Towards real-time object detection with region proposal networks. IEEE Trans. Pattern Anal. Mach. Intell. 2016, 39, 1137–1149. [Google Scholar] [CrossRef] [PubMed]
- Bari, B.S.; Islam, M.N.; Rashid, M.; Hasan, M.J.; Razman, M.A.M.; Musa, R.M.; Ab Nasir, A.F.; Majeed, A.P.A. A real-time approach of diagnosing rice leaf disease using deep learning-based faster R-CNN framework. PeerJ Comput. Sci. 2021, 7, e432. [Google Scholar] [CrossRef] [PubMed]
- Liu, W.; Anguelov, D.; Erhan, D.; Szegedy, C.; Reed, S.; Fu, C.-Y.; Berg, A.C. Ssd: Single shot multibox detector. In Proceedings of the Computer Vision–ECCV 2016: 14th European Conference, Amsterdam, The Netherlands, 11–14 October 2016; Springer: Berlin/Heidelberg, Germany, 2016; pp. 21–37. [Google Scholar]
- Redmon, J. You only look once: Unified, real-time object detection. In Proceedings of the 2016 IEEE Conference on Computer Vision and Pattern Recognition (CVPR), Las Vegas, NV, USA, 27–30 June 2016; pp. 779–788. [Google Scholar]
- Farhadi, A.; Redmon, J. Yolov3: An Incremental Improvement; Computer vision and pattern recognition; Springer: Berlin/Heidelberg, Germany, 2018; pp. 1–6. [Google Scholar]
- Wang, C.-Y.; Bochkovskiy, A.; Liao, H.-Y.M. YOLOv7: Trainable bag-of-freebies sets new state-of-the-art for real-time object detectors. In Proceedings of the IEEE/CVF Conference on Computer Vision and Pattern Recognition, Vancouver, BC, Canada, 17–24 June 2023; pp. 7464–7475. [Google Scholar]
- Varghese, R.; Sambath, M. YOLOv8: A Novel Object Detection Algorithm with Enhanced Performance and Robustness. In Proceedings of the 2024 International Conference on Advances in Data Engineering and Intelligent Computing Systems (ADICS), Chennai, India, 18–19 April 2024; IEEE: Piscataway, NJ, USA, 2024; pp. 1–6. [Google Scholar]
- Wang, C.-Y.; Yeh, I.-H.; Mark Liao, H.-Y. Yolov9: Learning what you want to learn using programmable gradient information. In Proceedings of the European Conference on Computer Vision, Milan, Italy, 29 September–4 October 2024; Springer: Cham, Switzerland, 2024; pp. 1–21. [Google Scholar]
- Sheng, S.; Duan, X.; Hu, W.; Cao, W. Dynamic-YOLOX: Detection Model for Apple Leaf Disease in Complex Background. J. Front. Comput. Sci. Technol. 2024, 18, 2118–2129. [Google Scholar]
- Xue, Z.; Xu, R.; Bai, D.; Lin, H. YOLO-tea: A tea disease detection model improved by YOLOv5. Forests 2023, 14, 415. [Google Scholar] [CrossRef]
- Tian, Y.; Wang, S.; Li, E.; Yang, G.; Liang, Z.; Tan, M. MD-YOLO: Multi-scale Dense YOLO for small target pest detection. Comput. Electron. Agric. 2023, 213, 108233. [Google Scholar] [CrossRef]
- Liu, J.; Wang, X. Tomato diseases and pests detection based on improved Yolo V3 convolutional neural network. Front. Plant Sci. 2020, 11, 898. [Google Scholar] [CrossRef] [PubMed]
- Wang, C.; Wang, Y.; Ma, G.; Bian, G.; Ma, C. Identification of Grape Diseases Based on Improved YOLOXS. Appl. Sci. 2023, 13, 5978. [Google Scholar] [CrossRef]
- Liu, Y.; Yu, Q.; Geng, S. Real-time and lightweight detection of grape diseases based on Fusion Transformer YOLO. Front. Plant Sci. 2024, 15, 1269423. [Google Scholar] [CrossRef] [PubMed]
- Sheng, C.; Yao, J.; Tian, Y. Grape Disease Detection Model Based on an Improved YOLOv8. In Proceedings of the 2024 5th International Conference on Computer Vision, Image and Deep Learning (CVIDL), Zhuhai, China, 19–21 April 2024; IEEE: Piscataway, NJ, USA, 2024; pp. 1276–1280. [Google Scholar]
- Pinheiro, I.; Moreira, G.; Queirós Da Silva, D.; Magalhães, S.; Valente, A.; Moura Oliveira, P.; Cunha, M.; Santos, F. Deep learning YOLO-based solution for grape bunch detection and assessment of biophysical lesions. Agronomy 2023, 13, 1120. [Google Scholar] [CrossRef]
- Chen, Y.; Wu, Q. Grape leaf disease identification with sparse data via generative adversarial networks and convolutional neural networks. Precis. Agric. 2023, 24, 235–253. [Google Scholar] [CrossRef]
- Chen, J.; Kao, S.-H.; He, H.; Zhuo, W.; Wen, S.; Lee, C.-H.; Chan, S.-H.G. Run, don’t walk: Chasing higher FLOPS for faster neural networks. In Proceedings of the IEEE/CVF Conference on Computer Vision and Pattern Recognition, Vancouver, BC, Canada, 17–24 June 2023; pp. 12021–12031. [Google Scholar]
- Wang, J.; Chen, K.; Xu, R.; Liu, Z.; Loy, C.C.; Lin, D. Carafe: Content-aware reassembly of features. In Proceedings of the IEEE/CVF International Conference on Computer Vision, Seoul, Republic of Korea, 27 October–2 November 2019; pp. 3007–3016. [Google Scholar]
- Hu, J.; Shen, L.; Sun, G. Squeeze-and-excitation networks. In Proceedings of the IEEE Conference on Computer Vision and Pattern Recognition, Salt Lake City, UT, USA, 18–23 June 2018; pp. 7132–7141. [Google Scholar]
| Disclaimer/Publisher’s Note: The statements, opinions and data contained in all publications are solely those of the individual author(s) and contributor(s) and not of MDPI and/or the editor(s). MDPI and/or the editor(s) disclaim responsibility for any injury to people or property resulting from any ideas, methods, instructions or products referred to in the content. |
© 2025 by the authors. Licensee MDPI, Basel, Switzerland. This article is an open access article distributed under the terms and conditions of the Creative Commons Attribution (CC BY) license (https://creativecommons.org/licenses/by/4.0/).


