Abstract
Imbalanced fertilization and inadequate of straw return have led to soil potassium (K) depletion and fertility decline in croplands of the Qinghai–Tibet Plateau. However, how these changes affect soil microbial communities remains unclear. We analyzed soil properties, microbial biomass carbon and nitrogen, enzyme activities, and microbial communities in a long-term field experiment initiated in 1992 with K fertilization and varying wheat straw return amounts. Long-term K application significantly reduced microbial biomass carbon (MBC) and bacterial species richness and inhibited positive bacteria–fungi interactions. By contrast, long-term straw return not only enhanced soil organic carbon (SOC), total nitrogen (TN), available phosphorus (AP), and available potassium (AK) but also increased MBC, microbial biomass nitrogen (MBN), enzyme activities, and fungal species richness. Furthermore, it restructured microbial community composition and improved the stability and connectivity of microbial co-occurrence networks. Critically, these benefits did not scale linearly with straw input quantity. Excessive straw return (>5000 kg ha−1) reduced beneficial effects, destabilized microbial interactions, and elevated risks associated with parasitic protozoa. Balanced potassium application with moderate straw return (approximately 5000 kg ha−1) enhances soil fertility and promotes positive microbial effects in croplands on the Qinghai–Tibet Plateau.
1. Introduction
The Qinghai–Tibet Plateau (QTP) is recognized as a globally significant high-elevation agricultural and pastoral region distinguished by its unique climatic and geographical conditions. This region is characterized by the cultivation of crops such as spring wheat, barley, spring rape, and potatoes. Spring wheat is a traditional crop cultivated in the QTP region, particularly in areas with relatively favorable water and nutrient conditions. However, the primary ecological and environmental challenges for agricultural production on the QTP include low temperatures, frost damage, drought, and soil erosion [1,2,3,4]. Based on the findings from the second comprehensive scientific expedition to the QTP, it has been revealed that cropland soil in the region is confronted with issues of declining fertility and insufficient research on soil microorganisms [5]. Meanwhile, research on soil organic carbon (SOC), nitrogen, and soil microorganisms in glacial, grassland, wetland, and forest ecosystems of the region has garnered increasing attention [6,7,8,9,10]. On the QTP, the period suitable for soil microbial activity is relatively brief, lasting approximately six months annually. For the remainder of the year, the soil remains in a low-temperature and frozen state, which significantly constrains the effective conversion of potential soil fertility. Fertilization and straw return can substantially maintain and enhance soil fertility, particularly by increasing SOC content and the availability of essential nutrients [11,12,13,14]. However, current research on straw return amounts is still limited [15,16]. Particularly in the QTP, low temperatures and drought conditions significantly impact straw decomposition and nutrient transformation. Therefore, research on optimal straw return amounts is especially important in this region.
With the increasing use of nitrogen (N) and phosphate (P) fertilizers, K fertilizers have often been overlooked globally. Approximately 20% of the world’s agricultural soil is experiencing significant K deficiencies, with the amount of applied K fertilizer typically accounting for less than 35% of K uptake by crops [17,18,19]. Long-term K deficiency in soil reserves negatively impacts crop yield and quality, as well as soil fertility and overall quality [20]. In addition to K fertilizer application, straw return also effectively replenishes soil K, thereby reducing the reliance on limited and valuable K fertilizer resources [21,22]. Moreover, the distinct impacts of K fertilization and straw return on soil fertility and microbial communities require long-term positioning trials for verification. In 1992, a long-term K fertilization and varying wheat straw return amount experiment was initiated in Qinghai Province, situated in the northeastern part of the QTP. In this region, Kastanozems is the predominant soil type in croplands and is considered to be K rich [23]. Therefore, the non-application of K fertilizer often leads to N, P, and K imbalances in cropland soil. Conducting long-term field experiments to evaluate optimal fertilization and straw return practices will contribute to maintaining and enhancing the fertility and quality of cropland soil.
Soil microbial biomass carbon (MBC) and microbial biomass nitrogen (MBN) represent the carbon and nitrogen contents of bacteria and fungi. Despite their low contents in soil, MBC and MBN play an indispensable role in stimulating soil microbial activity [24,25]. Soil microorganisms contribute to nutrient cycling through the secretion of extracellular enzymes, facilitating the transformation of organic matter and energy exchange within the soil [26]. A majority of studies have demonstrated that long-term fertilization and straw return significantly influence microbial biomass carbon and nitrogen, as well as enzyme activity [27,28,29,30,31]. These properties serve as effective indicators for quantifying the activity of microbial communities. Soil bacteria and fungi are key components of soil microorganisms, playing crucial roles in substance and energy transformation, nutrient cycling and metabolism, and the decomposition and transformation of organic matter [32]. The soil microbiome is highly structured, with diverse microbial groups forming intricate interactions. Microbial co-occurrence networks help to elucidate these complex ecological relationships and provide insights into community structure and stability [33,34]. Microbial diversity, community composition, and co-occurrence networks are affected by climate change, crop rotation systems, and also by fertilization and straw return [35,36,37,38,39,40]. These factors collectively influence microorganisms by modifying key environmental conditions, such as temperature, moisture, and nutrient availability, thereby regulating and reshaping the structure of microbial communities and their interactions. These long-term complex changes and interrelationships require further research to elucidate.
Based on soil property analysis and high-throughput sequencing of bacterial 16S rRNA and fungal ITS1, this study investigates the differential effects of K fertilization and varying straw return amounts on soil nutrients, MBC, MBN, extracellular enzyme activity, bacterial and fungal diversity, community composition, co-occurrence networks, as well as the interrelationships between environmental factors and microorganisms. The objective of the present study was to optimize fertilization strategies, particularly in ecologically fragile high-altitude regions such as the QTP.
2. Materials and Methods
2.1. Site Description
The long-term K fertilization and wheat straw return experiment was initiated in 1992 at the experimental base of Qinghai Academy of Agriculture and Forestry Science (QAAF) in Xining (36°34′03″ N, 101°49′17″ E, altitude of 2360 m), Qinghai Province, China (Figure 1). The region is characterized by a semi-arid continental climate, with an average annual rainfall of 413.6 mm and an average annual temperature of 6.1 °C. Due to the high altitude and cold climate of the QTP, the crop rotation system is generally one crop per year and spring wheat–fallow–spring wheat was the crop rotation for the long-term experiment. The soil of this region is classified as Kastanozems with a medium loam texture, which is the dominant soil type for cultivation. The basic nutrient contents of the soil (0–20 cm) in 1992 were measured as follows: soil organic carbon (SOC) 10.6 g kg−1, total nitrogen (TN) 1.27 g kg−1, nitrate nitrogen (NO3--N) 42.6 mg kg−1, ammonium nitrogen (NH4+-N) 33.8 mg kg−1, available phosphorous (AP, Olsen-P) 30.4 mg kg−1, available potassium (AK, NH4OAc-K) 177.3 mg kg−1, and pH 7.6.
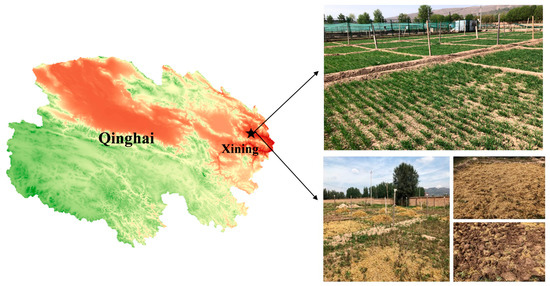
Figure 1.
Study area (spring wheat seedling stage and post-harvest straw return).
2.2. Experimental Design and Materials
The experiment used a two-factor randomized complete block design with four replicates, and each treatment was arranged in a 25 m2 plot. The two factors were fertilizer application (2 levels, NP and NPK) and wheat straw return (3 levels, None, Half, and Total) (Table 1). Therefore, the long-term experiment included six treatments: NP, NPS50, NPS100, NPK, NPKS50, and NPKS100. N, P, and K represent application of nitrogen, phosphorus, and potassium fertilizers, respectively. S50 and S100 indicate 50% and 100% wheat straw return (equivalent to 5000 kg ha−1 and 10,000 kg ha1− dry weight), respectively. The fertilizer application rates were 110 kg N ha−1 (as urea, 46% N), 55.2 kg P2O5 ha−1 (as calcium superphosphate, 12% P2O5), and 150 kg K2O ha−1 (as potassium chloride, 60% K2O). Before sowing spring wheat at the end of March, 70% of the N fertilizer and total P and K fertilizers were applied as basal fertilizer and incorporated into the soil using small-scale tillage. The remaining N fertilizer was applied as top dressing during the jointing stage. From 2019, the spring wheat variety “Plateau 448” was sown at the amount of 372 kg/hm2, with 31 rows per plot, and the row spacing was 15 cm. The spring wheat was flood-irrigated three times during the whole growth period, plus two times in winter and pre-sowing in spring, with five irrigation times in total. The spring wheat seeds were harvested at early August, subsequently dried, and the wheat straws were shred into small fragments with a farm machine and ploughed into different amounts of straw return plots before October (prior to soil freezing) by hand at a digging depth of 15~20 cm (the topsoil layer).

Table 1.
Experimental treatments in the long-term field experiment.
2.3. Soil Sample Processing and Determination
Following the 2021 spring wheat harvest, a total of 24 composite soil samples (6 treatments × 4 replicates) were collected. At each experimental plot, three subsamples were taken from the 0–20 cm depth at equidistant positions along diagonal transects using a stainless-steel auger (inner diameter: 4 cm). Each subsample consisted of 350 g of fresh soil, which was manually homogenized by quartering to form a single composite sample (total ~1.0 kg per plot). The composite fresh soil sample was divided into three portions: (1) one portion was sieved to determine soil water content, enzyme activity, and microbial biomass; (2) another portion was sieved and stored in 15 mL sterile cryogenic storage tubes for amplification of the bacterial 16S V4-V5 region and fungal ITS region (Genesky Biotechnologies Inc., Shanghai, China); and (3) the third portion was air-dried then sieved for the determination of soil properties.
Soil properties were analyzed using the methods described by Bao [41]. Specifically, soil water content (SWC) was determined using the oven-drying method; soil organic carbon (SOC) was measured via the K2Cr2O7 external heating method; total nitrogen (TN) was quantified through H2SO4 digestion followed by analysis with a Kjeldahl nitrogen analyzer (FOSS KjeltecTMT-MKT200, Hillerød, Denmark); total phosphorus (TP) was assessed using H2SO4-HClO4 digestion and molybdenum antimony anti-colorimetry (V5800 spectrophotometer, Shanghai, China); and total potassium (TK) was evaluated using the sodium hydroxide fusion method (AP1200 flame photometer, Shanghai, China). Nitrate nitrogen (NO3−-N) and ammonium nitrogen (NH4+-N) were extracted with 1 M KCl and analyzed using flow injection analysis (AA3, SEALAnalytical, Norderstedt, Germany). Available phosphorus (AP, Olsen-P) was extracted with 0.5 M NaHCO3 and measured on a V5800 spectrophotometer (China), while available potassium (AK, NH4OAc-K) was extracted with 1 M CH3COONH4 and analyzed using an AP1200 flame photometer (China). Soil pH was measured in a soil-to-water ratio of 1:2.5 (Mettler Toledo, FE28-Standard pH meter, Greifensee, Switzerland). Microbial biomass carbon (MBC) and microbial biomass nitrogen (MBN) were determined using the chloroform fumigation–extraction method [25,42]. MBC was measured using a total organic carbon analyzer (Shimadzu, TOC-VCPH, Kyoto, Japan), while MBN was analyzed using a flow injection analysis system (AA3, SEAL Analytical, Norderstedt, Germany). β-1,4-glucosidase (βG) and cellobiohydrolase (CBH) are C-acquiring enzymes that degrade fresh cellulose; leucineaminopeptidase (LAP) and N-acetyl-β-D-glucosaminidase (NAG) are N-acquiring enzymes that degrade chitin, peptidoglycan, and protein; and alkaline phosphatase (AKP) is a P-acquiring enzyme that degrades organic phosphorus compounds [43,44]. Soil enzyme activity was measured using the microplate fluorescence method [45].
2.4. DNA Extraction and High Throughput Sequencing
Total genomic DNA from fresh soil was extracted using the FastDNA® SPIN Kit (MP Biomedicals, Santa Ana, CA, USA). The integrity of the total genomic DNA was assessed using agarose gel electrophoresis, the concentration and purity were determined using Nanodrop 2000 and Qubit 3.0 spectrophotometers, and subsequently, the qualified sample was amplified by high-fidelity PCR using the standard bacterial/fungal genomic DNA mix as a positive control. Bacterial genomic DNA and fungus genomic DNA were used as the template to amplify the V4–V5 hypervariable region of the 16S rRNA gene and the ITS1 hypervariable region, respectively. High-throughput sequencing was performed using the Illumina NovaSeq 6000 sequencer. The amplification products were assessed through agarose gel electrophoresis and purified using the Agencourt AMPure XP Kit (Beckman Coulter, CA, USA) to obtain the original library of the sample. After quality inspection of the original library, a double-ended sequencing strategy was used to sequence the library, and then bioinformatics analysis was carried out. The raw sequence data were deposited in the NCBI’s Sequence Read Archive (SRA) under accession numbers PRJNA1226293 and PRJNA1226365 (bacterial and fungal sequences, respectively).
2.5. Statistical and Bioinformatics Analysis
Statistical analysis of soil properties, MBC, MBN, and enzyme activities were performed with IBM SPSS Statistics 26.0. Two-factor analysis of variance (ANOVA) with Tukey’s LSD multiple-comparison test at a significance level of 0.05 was employed to assess the significant differences among K fertilization treatments, varying wheat straw return amount treatments, and the interaction effects of both. The alpha diversity of soil bacteria and fungi was calculated using the vegan package in R version 3.5.1, and the resulting diagrams were generated using Origin 2016. Beta diversity PCoA (principal coordinates analysis) with weighted unifrac distances was calculated using the R packages scatterplot3d, pheatmap, and phyloseq. The resulting plots were generated using the OmicShare platform (https://www.omicshare.com/tools/Home/Soft/pcoa, accessed on 23 December 2024). The linear discriminant analysis effect size (LEfSe) method supports high-dimensional classification comparisons and was used to identify species that were most likely to explain the differences among the six treatments, with a threshold of |LDA| > 2.0 and p < 0.05. The composition and interrelationships of soil bacterial and fungal communities with environmental factors were analyzed using the R packages vegan and ggplot2. LEfSe analysis, redundancy analysis (RDA), and heat maps were generated using the Genesky Biotech Cloud Platform (http://cloud.geneskybiotech.com/#/tools/all, accessed on 25 December 2024). Microbial co-occurrence networks were analyzed with the R package igraph. Phyla with relative abundance greater than 0.1% were used for Spearman correlation analysis, and species with high betweenness centrality were defined as the key species in the co-occurrence networks [33,35]. According to the visualization of Cytoscape V.3.4.0, the top 20 and top 10 bacterial and fungal relative abundances at the phylum level were selected for graphs [46].
3. Results
3.1. Soil Properties, Microbial Biomass, and Enzyme Activities of Long-Term K Fertilization and Wheat Straw Return
Based on nearly three decades of long-term K fertilization and wheat straw return, the fertility of cropland soil has been significantly enhanced (Table 2). Long-term straw return significantly increased the soil water content (SWC) (p < 0.05), soil organic carbon (SOC) (p < 0.01), total nitrogen (TN) (p < 0.01), total potassium (TK) (p < 0.01), ammonium nitrogen (NH4+-N) (p < 0.01), available phosphorus (AP) (p < 0.01), available potassium (AK) (p < 0.01), microbial biomass carbon (MBC) (p < 0.01), microbial biomass nitrogen (MBN) (p < 0.01), β-glucosidase (βG) (p < 0.05), cellobiohydrolase (CBH) (p < 0.01), leucine aminopeptidase (LAP) (p < 0.01), and alkaline phosphatase (AKP) (p < 0.01). Additionally, it significantly reduced the soil pH (p < 0.05), while having no significant effect on total phosphorus (TP), nitrate nitrogen (NO3−-N), and N-acetyl-β-D-glucosaminidase (NAG). By contrast, long-term K fertilization significantly increased AP (p < 0.05), AK (p < 0.01), NAG (p < 0.05), and AKP (p < 0.05), while significantly decreasing MBC (p < 0.05). The interaction between K fertilization and straw return was highly significant for AK and pH (p < 0.01). Except for NO3−-N and NAG, all other properties exhibited significant differences among the six treatments. SOC, TN, AP, and AK showed significant differences between 50% and 100% straw return without K fertilization, whereas only AK exhibited significant differences among varying amounts of straw return with K fertilization. Although the balanced fertilization with total amount of straw return treatment (NPKS100) generally had the highest values for most properties, no statistically significant differences were observed among the NPKS100, NPKS50, and NPS100 treatments, except for AK. Compared with the NP treatment, there were no significant differences in most properties with the balanced fertilization treatment (NPK), except for AK and pH.
Table 2.
Soil properties, microbial biomass carbon and nitrogen, and enzyme activities of varying potassium fertilization and straw return treatments.
3.2. Diversity and Composition of Soil Bacterial and Fungal Communities
3.2.1. Alpha Diversity
Long-term K fertilization significantly reduced the richness (species number, Chao1 and ACE indexes) of soil bacterial communities, whereas 100% straw return significantly increased the number of fungal species and Chao1 and ACE indexes compared to the non-straw return treatments (Figure 2). Long-term K fertilization and straw return had no significant effect on the diversity (Shannon and Simpson indexes) of soil bacterial and fungal communities, except for the Simpson index of soil bacterial communities (Figure 3). Notably, the 50% straw return without K fertilization treatment (NPS50) exhibited the highest bacterial species richness, significantly higher than both the NPK and NPKS100 treatments. Meanwhile, the NPS100 treatment showed the highest bacterial Shannon index and the lowest bacterial Simpson index. Additionally, the NPKS50 treatment had the highest fungal species richness and Shannon index but the lowest Simpson index, whereas the NP treatment exhibited the opposite trend.
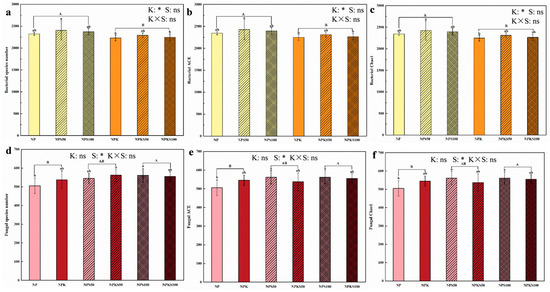
Figure 2.
Soil bacterial species number (a), Chao1 index (b), and ACE index (c), as well as soil fungal species number (d), Chao1 index (e), and ACE index (f) of varying potassium fertilization and straw return treatments (NP, nitrogen and phosphorus fertilizer; NPS50, nitrogen and phosphorus fertilizer with 50% straw return; NPS100, nitrogen and phosphorus fertilizer with 100% straw return; NPK, nitrogen, phosphorus, and potassium fertilizer; NPKS50, nitrogen, phosphorus, and potassium fertilizer with 50% straw return; NPKS100, nitrogen, phosphorus, and potassium fertilizer with 100% straw return). Different lowercase letters indicate significant differences among the six treatments (Tukey’s LSD, p < 0.05), while capital letters denote significant differences associated with potassium fertilization (K) or varying straw return amounts (S) (Tukey’s LSD, p < 0.05). One asterisk (*) represents a significant difference, and “ns” signifies no significant difference. Each treatment had four replicates (n = 4).
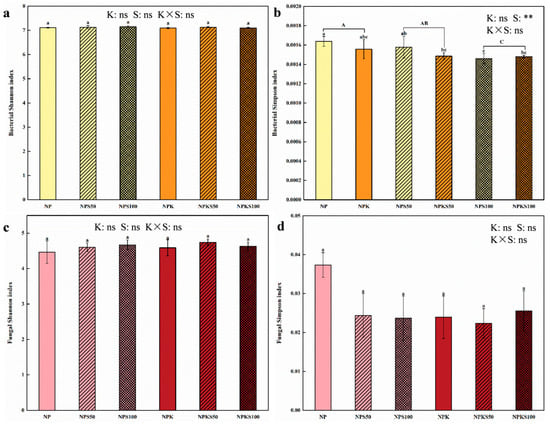
Figure 3.
Soil bacterial Shannon index (a) and Simpson index (b), as well as soil fungal Shannon index (c) and Simpson index (d) of varying potassium fertilization and straw return treatments. Different lowercase letters indicate significant differences among the six treatments (Tukey’s LSD, p < 0.05), while capital letters denote significant differences associated with potassium fertilization (K) or varying straw return amounts (S) (Tukey’s LSD, p < 0.05). while double asterisks (**) represent a highly significant difference (Tukey’s LSD, p < 0.01), and “ns” signifies no significant difference. Each treatment had four replicates (n = 4).
3.2.2. Beta Diversity
Unconstrained principal coordinate analysis (PCoA) of soil bacterial and fungal communities using weighted unifrac distances showed that the straw return treatments were distinctly separated from the non-straw return treatments along the first two principal coordinate axes (p < 0.001, PERMANOVA by Adonis) (Figure 4). The result indicated significant differences in community composition between the straw return and non-straw return treatments. However, bacterial and fungal communities exhibited similar compositions across the varying amounts of straw return treatments, particularly the NPS100 and NPKS100 treatments.
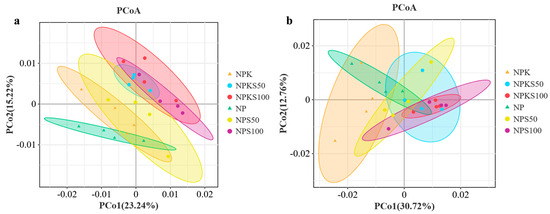
Figure 4.
Unconstrained PCoA analysis with weighted unifrac distances of soil bacterial communities (a) and fungal communities (b) among the six treatments.
3.2.3. Community Composition and Differential Microorganisms
For the bacterial community, all sequences were classified into 28 phyla. The dominant bacterial phyla (relative abundance > 1%) across all six treatments were as follows: Proteobacteria (29.14–35.43%), Actinobacteria (14.55–20.56%), Acidobacteria (10.78–14.99%), Chloroflexi (7.36–12.02%), Planctomycetes (7.00–9.43%), Bacteroidetes (4.54–11.31%), WPS-1 (1.77–2.34%), Gemmatimonadetes (1.00–2.04%), Nitrospirae (1.12–2.00%), Firmicutes (0.68–1.22%), and Verrucomicrobia (0.70–1.60%) (Figure 5a). The relative abundances of Proteobacteria, Planctomycetes, and Bacteroidetes were significantly higher in the straw return treatments compared to the non-straw return treatments (NP and NPK), while those of Chloroflexi, Gemmatimonadetes, and Armatimonadetes were significantly lower. LEfSe analysis (linear discriminant analysis effect size) identified a total of 141 species with significant differences among the six treatments. Proteobacteria (43 species) were significantly enriched in the NPKS100 and NPS100 treatments. Actinobacteria (32 species), Bacteroidetes (8 species), and Firmicutes (7 species) were significantly enriched in the NPKS100 treatment. Planctomycetes (8 species) were enriched in the NPS100 treatment. Gemmatimonadetes (8 species) were present exclusively in both the NP and NPK treatments. Chloroflexi (23 species) and Nitrospirae (7 species) were the most enriched in the NP treatment, while Armatimonadetes (5 species) were exclusive to the NP treatment (Figure 5b).
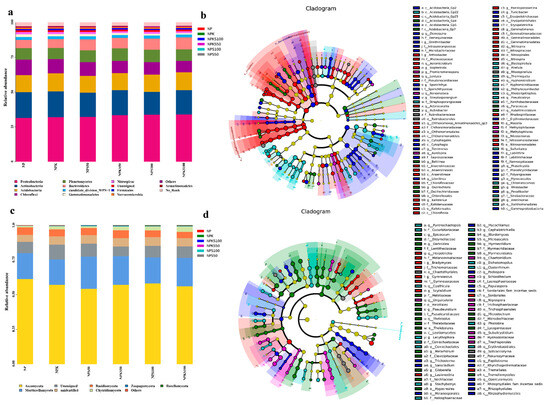
Figure 5.
High relative abundance (a) and LEfSe analysis (b) of soil bacterial communities and high relative abundance (c) and LEfSe analysis (d) of soil fungal communities among the six treatments. Distinct colors denote varying treatments. Nodes of distinct colors indicate species with significantly different relative abundance under the corresponding treatment, while yellow nodes denote no significant difference in relative abundance across varying treatments.
For the fungal community, all sequences were classified into 14 phyla. The dominant fungal phyla (relative abundance > 1%) across all six treatments were as follows: Ascomycota (51.28–70.87%), Mortierellomycota (11.24–26.81%), Basidiomycota (2.62–8.63%), and Chytridiomycota (0.41–7.05%) (Figure 5c). The relative abundances of Chytridiomycota, Zoopagomycota, and Rozellomycota were significantly higher in the straw return treatments compared to the non-straw return treatments. LEfSe analysis identified a total of 158 species with significant differences among the six treatments. Ascomycota (114 species) were significantly enriched in the NPK and NP treatments, while Mortierellomycota (4 species) were present in both the NP and NPK treatments. Basidiomycota (29 species) were significantly enriched in the NPS100, NPKS100, and NPS50 treatments. Chytridiomycota (5 species) were exclusive to the NPKS100 treatment, while Rozellomycota (6 species) were exclusive to the NPS100 treatment (Figure 5d).
3.3. Co-Occurrence Network Analysis of Soil Bacterial and Fungal Communities
Soil bacterial and fungal co-occurrence network analysis showed that the NPKS50 treatment had the highest number of links (83), comprising 51 positive and 32 negative links (Figure 6 and Table 3). This treatment notably increased the proportion of positive bacteria–fungi and fungi–fungi interactions, suggesting a more stable microbial network structure. By contrast, the NPS100 treatment had the lowest number of links (39), comprising 19 positive and 20 negative links. The NPKS100 treatment showed an intermediate number of links, higher than NPS100 but lower than other treatments, suggesting that excessive straw return did not consistently stabilize the microbial network. Both the NP and NPK treatments displayed fewer positive links compared to negative links, whereas the straw return treatments generally exhibited a higher proportion of positive interactions. These results implied that moderate straw return enhances cooperative effects within the microbial network. Notably, the NP treatment had significantly more bacteria–fungi links than the NPK treatment. Key bacterial phyla with higher degree and betweenness centrality included Bacteroidetes, Armatimonadetes, Actinobacteria, Elusimicrobia, Nitrospirae, Proteobacteria, Gemmatimonadetes, and Chloroflexi. The key fungal phyla comprised Ascomycota, Kickxellomycota, Basidiomycota, Chytridiomycota, and Mortierellomycota. However, the dominant bacterial and fungal phyla varied across treatments. The NPKS50 treatment uniquely demonstrated greater taxonomic diversity and distinct community composition compared to other treatments.
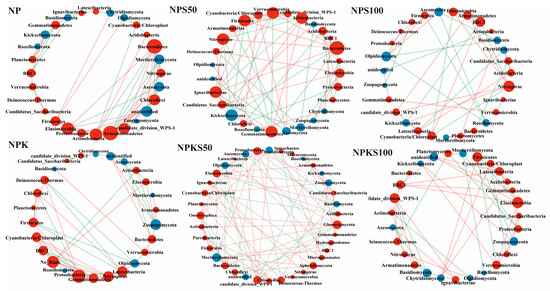
Figure 6.
Microbial co-occurrence networks at the phylum level among the six treatments. The color of the circles denotes different kingdoms (red for bacteria, blue for fungi), while the size of the circles indicates the degree and betweenness centrality. Red lines signify positive correlations, whereas green lines represent negative correlations.
Table 3.
The number of links in the co-occurrence networks among the six treatments.
3.4. Correlations Between Soil Microbial Communities and Environmental Factors
Redundancy analysis (RDA) showed that both primary environmental factors and most straw return treatments (NPKS50, NPS100, NPKS100) were predominantly distributed on the positive side of axis 1 (Figure 7). These treatments and associated explanatory variables (MBC, TN, SOC, MBN, SWC, LAP, CBH, AP, βG, TP, AKP, AK, NH4+-N, NAG, TK) correlated strongly with bacterial taxa, including Planctomycetes, Bacteroidetes, Proteobacteria, and Actinobacteria. By contrast, the non-straw return treatments (NP, NPK) and variables such as pH and NO3−-N clustered on the negative side of axis 1, showing associations with Chloroflexi, Gemmatimonadetes, Armatimonadetes, Firmicutes, and Nitrospirae. For fungal communities, the straw return treatments (NPS100, NPKS100) and their explanatory variables (MBC, TP, TN, SOC, MBN, SWC, AP, AK, LAP, CBH, AKP, NH4+-N, βG, TK) were linked to Chytridiomycota, Blastocladiomycota, and Mortierellomycota. Conversely, the non-straw return treatments and variables (pH, NO3−-N, NAG) aligned with Ascomycota on the negative side of axis 1. Bacterial community composition was primarily driven by SOC and TN, while fungal communities showed stronger responses to TN and TP.
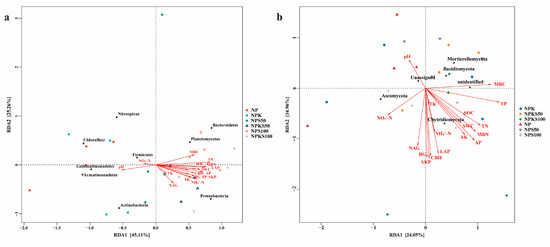
Figure 7.
RDA analysis of key soil bacterial communities in relation to environmental factors (a) and key soil fungal communities in relation to environmental factors (b) among the six treatments.
Significant correlations were observed between environmental factors and microbial taxa (Figure 8). TN, SOC, SWC, MBC, MBN, AKP, AK, and AP showed positive associations (p < 0.01 or p < 0.05) with Bacteroidetes, Proteobacteria, and Hydrogenedentes but negative associations (p < 0.01 or p < 0.05) with Chloroflexi, Gemmatimonadetes, and Armatimonadetes (Figure 8a). For fungal taxa, Rozellomycota exhibited positive correlations (p < 0.01 or p < 0.05) with all environmental factors except pH, TK, NO3−-N, and TP. Blastocladiomycota showed positive associations (p < 0.01 or p < 0.05) with AKP, LAP, CBH, βG, SWC, NAG, AP, AK, and TN. Chytridiomycota were positively correlated (p < 0.01 or p < 0.05) with AP, AK, TN, MBN, SWC, and TP. Zoopagomycota demonstrated positive associations (p < 0.01 or p < 0.05) with AK, SOC, TP, and MBC. Notably, only NH4+-N and TP displayed significant negative correlations (p < 0.01 or p < 0.05) with Basidiomycota and Ascomycota, while no other factors showed negative associations with key fungal taxa (Figure 8b).
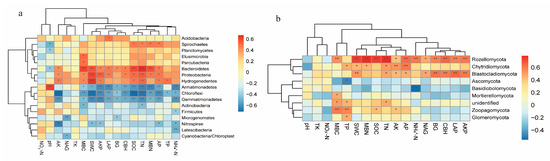
Figure 8.
Correlation analysis between key soil bacterial communities and environmental factors (a), and between key soil fungal communities and environmental factors (b). Asterisks denote significance levels: * p < 0.05, ** p < 0.01.
4. Discussion
4.1. The Impacts of Long-Term Potassium Fertilization and Wheat Straw Return on Soil Properties
Due to its rich content of essential nutrients, wheat straw return has considerable potential to mitigate deficiencies in soil carbon (C), nitrogen (N), phosphorus (P), and potassium (K) [47,48]. Long-term straw return significantly increased SWC, SOC, TN, TK, NH4+-N, AP, and AK (Table 2), and these results were consistent with those reported in most related studies [13,22,49,50,51,52]. Moreover, SOC, TN, AP, and AK showed significant differences between half and total amounts of straw return without K fertilization. However, most soil properties showed no statistically significant differences between 50% and 100% straw return with balanced fertilization. Although the balanced fertilization with 100% straw return treatment (NPKS100) resulted in the highest values for most soil properties, the rate of increase in these properties declined as the quantity of straw return increased. Straw return at rates of 3000 to 6000 kg ha−1 had the greatest improvement effect on crop yield, SOC, AP, AK, and TN [15,21,53]. In our experiment, a half rate of straw return was set at 5000 kg ha−1, representing the moderate amount of straw return under balanced fertilization. Straw return exceeding a certain quantity is not conducive to improving soil structure and may adversely affect soil nutrient transformation [54,55]. Compared with the NP treatment, most soil properties showed no significant differences under the balanced fertilization treatment (NPK). This is likely attributable to the soil’s inherently high AK content (177.3 mg kg−1 In 1992). Over the course of nearly three decades, the AK content in the NP and NPS50 treatments decreased by 46.25% and 27.54%, respectively, while the NPS100 treatment remained consistent with the initial level. By contrast, the AK content in the NPK, NPKS50, and NPKS100 treatments increased by 39.34%, 79.78%, and 122.97%, respectively, indicating significantly higher potassium levels in the soil.
4.2. The Impacts of Long-Term Potassium Fertilization and Wheat Straw Return on Microbial Biomass and Enzyme Activities
With or without K fertilization, long-term straw return significantly increased the contents of microbial biomass carbon (MBC) and microbial biomass nitrogen (MBN) (Table 2). A majority of studies indicate that straw return increases MBC, and there is a linear relationship between the amount of straw return and MBC change [15,29,30,56,57]. However, there were no significant differences between 50% and 100% straw return in this experiment. A meta-analysis revealed that as the quantity of straw return increases, the rate of increase in MBC exhibits a diminishing trend [29,30]. Notably, MBC was higher without K fertilization, suggesting that K fertilization lead to a decline in MBC, but MBN was not significantly affected by K fertilization. Chen et al. found that in soil with the content of AK exceeding 150 kg ha−1, AK exhibited a significant negative correlation with both MBC and MBN [49]. Excessive AK in the soil may lead to increased soil salinity and degraded soil structure, characterized by elevated chloride ion concentrations, which inhibit microbial metabolic processes.
Compared to the non-straw return treatments (NP and NPK) and NPS50 treatment, the 100% straw return with K fertilization treatment (NPKS100) significantly increased the activities of C-acquisition enzymes βG and CBH. Straw return exhibited a tendency to increase N-acquiring enzyme (NAG) activity, although the difference was not statistically significant. The 100% straw return with K fertilization treatment (NPKS100) significantly increased N-acquiring enzyme (LAP) and P-acquiring enzyme (AKP) activities. Unlike soil properties, enzyme activities exhibited an increasing trend with greater amounts of straw return. Additionally, potassium fertilization significantly enhanced the activities of NAG and AKP. In contrast to soil microbial biomass, high enzyme activities of NAG and AKP require environments with elevated potassium concentrations.
4.3. The Impacts of Long-Term Potassium Fertilization and Wheat Straw Return on Soil Microorganisms
Wheat straw, characterized by a high carbon-to-nitrogen ratio, serves as a stable energy source and microbial substrate with slow mineralization and humification rates [58]. The accumulation and stabilization of carbon improve soil structure stability, enhance nutrient availability, and promote a nutrient-rich environment for microbial activity [14,47,59]. In this study, long-term K fertilization and straw return had no significant effect on the Shannon and Simpson indexes of soil bacterial and fungal communities (Figure 3). Long-term fertilization and straw return promoted the preferential growth of specific bacterial taxa, thereby reducing the diversity of soil microbial communities [27,38]. Straw return had a limited effect on microbial diversity; significant changes in microbial communities occur with major soil alterations [30,60]. However, long-term K fertilization significantly reduced the species number and Chao1 and ACE indexes of soil bacterial communities. By contrast, straw return significantly increased fungal species richness compared to no straw return (Figure 2). Straw return enhances straw decomposition efficiency, facilitates nutrient release, and promotes soil enzymes synthesis and secretion, thereby increasing fungal species richness [60,61]. This is consistent with the observed higher soil nutrient availability and enzyme activities with straw return in this study.
The PCoA results indicated significant differences in the composition of soil bacterial and fungal communities between the straw return and non-straw return treatments (Figure 4). Moreover, the relative abundances of Proteobacteria, Planctomycetes, and Bacteroidetes were significantly higher in the straw return treatments (Figure 5). Proteobacteria play a crucial role in cellulose decomposition and organic carbon accumulation in soil [62,63]. Planctomycetes are predominant degraders of exopolysaccharides (EPS) and are influenced by SOC, Ca2⁺, and pH [64,65]. Bacteroidetes contribute to SOC accumulation and decompose hemicellulose and xylan [66]. Actinobacteria and Firmicutes were significantly enriched in the NPKS100 treatment, rapidly utilizing wheat straw and other degradable carbon compounds in the carbon-rich environment [67,68]. However, Gemmatimonadetes, Chloroflexi, Nitrospirae, and Armatimonadetes were enriched in the NP treatment, suggesting that they may not be suited to high-potassium or high-carbon environments. Gemmatimonadetes shows low sensitivity to soil management and correlates with soil moisture and pH [69].
Ascomycota, Mortierellomycota, and Basidiomycota, which exhibit relatively high abundance among fungal communities, play a dominant role in the decomposition of straw and organic matter [70,71,72]. Ascomycota and Mortierellomycota were enriched in the NP and NPK treatments, while Basidiomycota were significantly enriched in the straw return treatments (Figure 5). Ascomycetes are resilient to environmental stress, utilize diverse resources, and adopt strategies that confer a competitive advantage in soil ecosystems [73]. However, Ascomycota have limited capacity to degrade lignin-rich residues, while Basidiomycota exhibit remarkable efficiency in the degradation of lignocellulosic materials [72]. Ascomycetes possess an enzyme system that is more efficient in degrading cellulose and holocellulose relative to lignin, enabling them to utilize these readily degradable components for rapid growth [71]. As decomposition progresses, the depletion of these components and accumulation of recalcitrant compounds stimulate Basidiomycota activity [70]. Chytridiomycota, Zoopagomycota, and Rozellomycota were exclusively associated with the straw return treatments, indicating a potential risk related to parasitic amoebas [74,75].
Soil microorganisms play a crucial role in regulating nutrient cycling and maintaining biogeochemical processes, which are interconnected and act synergistically to form a complex network. Fungi and bacteria engage in both cooperative and competitive interactions, thereby enhancing the stability and interconnectivity of microbial co-occurrence networks [33]. Soil bacterial and fungal co-occurrence network analysis revealed that the half amount of straw return with balanced fertilization treatment (NPKS50) significantly promoted positive interspecies interactions (Figure 6), thereby enhancing soil nutrient content through the synergistic effects of bacteria and fungi involved in straw decomposition and utilization. And the key bacterial and fungal phyla with higher degree and betweenness centrality exhibited increased mutual interactions, playing a crucial role in nutrient transformation [35]. Moderate straw return was conducive to enhancing positive interactions within the microbial network, consistent with findings from most related studies [51,54]. Compared to the NPK treatment, the NP treatment resulted in a greater degree of association between bacterial and fungal communities and a more robust microbial network structure (Table 3). Long-term application of K fertilizer without straw return appears to negatively affect the stability of the bacterial and fungal interaction network.
Redundancy analysis revealed that bacteria thrive in environments with high levels of both C and N, whereas fungi have higher requirements for N and P (Figure 7). Bacteroidetes, Proteobacteria, Hydrogenedentes, Rozellomycota, Blastocladiomycota, and Chytridiomycota exhibited highly significant or significant positive correlations with SWC, SOC, TN, MBC, MBN, AP, AK, AKP, LAP, CBH, and βG (Figure 8). These findings indicate that these key soil microorganisms thrive in environments where C, N, P, and K are balanced. Key groups within bacterial and fungal communities play multiple roles in C, N, and P cycling, driving changes in the soil microenvironment and modifying soil nutrients. Long-term agricultural practices of single chemical fertilizer application lead to a lack of carbon in the soil, which in turn intensifies the competition among microorganisms [49,76]. Soil pH was negatively correlated with these key bacterial and fungal communities. Among the 145 investigated field experiments, straw return significantly exacerbated soil acidification [77]. Bacteria and fungi can actively alter soil pH and, in turn, soil pH is a major factor that affects soil microbial communities [78].
5. Conclusions
Long-term imbalanced fertilization depletes the soil potassium pool, even in soil initially rich in potassium. Potassium fertilization, particularly when combined with straw return, effectively replenishes soil potassium and maintains nutrient equilibrium. Long-term straw return significantly promotes the accumulation and transformation of carbon, nitrogen, phosphorus, and potassium nutrients, as well as MBC, MBN, and relative enzymes. It also significantly increases the relative abundance of microorganisms involved in straw decomposition and nutrient cycling. Notably, this practice has a stronger influence on bacterial communities compared to fungal communities, with specific bacterial phyla such as Proteobacteria, Actinobacteria, Planctomycetes, and Bacteroidetes and the fungal phylum Basidiomycota being particularly affected. These dominant microbial species exhibit significant positive correlations with the majority of nutrient indicators, implying a requirement for a more nutritionally balanced environment. Unlike straw return, long-term potassium fertilization significantly increased AP, AK, NAG, and AKP, while significantly decreasing MBC and species richness of bacterial communities, thereby negatively impacting the stability of the bacterial–fungal interaction network. The establishment of a nutrient-balanced and microbial stable soil environment through potassium fertilizer application (as part of balanced fertilization) also necessitates moderate straw return. Therefore, optimizing fertilization strategies—especially integrating balanced potassium application with moderate straw return (approximately 5000 kg ha1−)—is essential for regions with fragile ecosystems, such as the Qinghai–Tibet Plateau. This approach enhances soil biological function resilience and supports sustainable agroecosystem development in high-altitude cropland.
Author Contributions
Conceptualization, Y.G. and T.X.; methodology, T.X. and R.Z.; validation, Y.Z., X.W., and Z.L.; formal analysis, T.X. and Z.L.; resources, R.Z.; data curation T.X., Y.Z., and X.W.; writing—original draft preparation, T.X.; writing—review and editing, Y.G.; supervision, Y.G. All authors have read and agreed to the published version of the manuscript.
Funding
This research was supported by the National Natural Science Foundation of China (NSFC) under Grant No. 32160759 and by the Major Science and Technology Project of Qinghai Province under Grant No. 2019-NK-A11.
Data Availability Statement
The data presented in this study are available upon request from the corresponding author.
Acknowledgments
We are grateful to the Institute of Soil and Fertilizer at the Qinghai Academy of Agricultural and Forestry Sciences for providing the long-term field experimental platform. We also thank all researchers who have made significant contributions to maintaining this platform.
Conflicts of Interest
The authors declare no conflicts of interest.
Abbreviations
The following abbreviations are used in this manuscript:
| QTP | Qinghai–Tibet Plateau |
| SWC | Soil water content |
| SOC | Soil organic carbon |
| TN | Total nitrogen |
| TP | Total phosphorus |
| TK | Total potassium |
| NO3−-N | Nitrate nitrogen |
| NH4+-N | Ammonium nitrogen |
| AP | Available phosphorus |
| AK | Available potassium |
| MBC | Microbial biomass carbon |
| MBN | Microbial biomass nitrogen |
| βG | β-1,4-glucosidase |
| CBH | Cellobiohydrolase |
| LAP | Leucineaminopeptidase |
| NAG | N-acetyl-β-D-glucosaminidase |
| AKP | Alkaline phosphatase |
References
- Chen, T.D.; Chen, Y.L.; Wang, L.L.; Mei, X.S.; Wei, W.; Zhao, W.T.; Ma, X.W.; Deji, S. Spatiotemporal Variations and Socio-Economic Influencing Factors of Soil Erosion at Different Spatial Scales in Key Agricultural Areas of the Qinghai-Tibet Plateau from 2000 to 2022: A Case Study of the Huangshui River Basin. Water 2025, 17, 88. [Google Scholar] [CrossRef]
- Feng, W.; Lu, H.W.; Yao, T.C.; Yu, Q. Drought characteristics and its elevation dependence in the Qinghai–Tibet plateau during the last half-century. Sci. Rep. 2020, 10, 14323. [Google Scholar] [CrossRef]
- Lei, J.J.; Li, C.S.; Yang, W.N.; Yang, X.; Xing, X.L.; Feng, X.Y. Assessment of ecological drought vulnerability of the Qinghai-Tibet Plateau from 2003 to 2022 based on multi-source data. Catena 2024, 247, 108512. [Google Scholar] [CrossRef]
- Yi, J.W.; Fan, X.N.; Du, Y.Y.; Zhang, C.H.; Huang, S.; Xu, R.; Wang, X.Y.; Hu, D.C.; Lu, M.L.; Wang, Z.B. A bibliometric analysis and complied dataset of natural disasters on the Qinghai-Tibet Plateau since 1900. Geomat. Nat. Hazards Risk 2025, 16, 2449557. [Google Scholar] [CrossRef]
- Pan, K.W.; He, Y.; Tang, Y.W.; Shen, Y.H.; Zhang, L.; Pan, Z.F. Progress of the scientific expedition and research on farmland ecosystem and food security in Qinghai-Tibet Plateau. Chin. J. Appl. Environ. Biol. 2022, 28, 813–821. [Google Scholar] [CrossRef]
- Chen, H.; Ju, P.J.; Zhu, Q.; Xu, X.L.; Wu, N.; Gao, Y.H.; Feng, X.J.; Tian, J.Q.; Niu, S.L.; Zhang, Y.J.; et al. Carbon and nitrogen cycling on the Qinghai-Tibetan Plateau. Nat. Rev. Earth Environ. 2022, 3, 701–716. [Google Scholar] [CrossRef]
- Han, D.R.; Hu, Z.M.; Wang, X.H.; Wang, T.; Chen, A.P.; Weng, Q.H.; Liang, M.Q.; Zeng, X.; Cao, R.C.; Di, K.; et al. Shift in controlling factors of carbon stocks across biomes on the Qinghai-Tibetan Plateau. Environ. Res. Lett. 2022, 17, 074016. [Google Scholar] [CrossRef]
- Zhang, Y.; Dong, S.K.; Gao, Q.Z.; Liu, S.L.; Zhou, H.K.; Ganjurjav, H.; Wang, X.X. Climate change and human activities altered the diversity and composition of soil microbial community in alpine grasslands of the Qinghai-Tibetan Plateau. Sci. Total Environ. 2016, 562, 353–363. [Google Scholar] [CrossRef]
- Wang, F.F.; Liu, S.L.; Liu, H.; Liu, Y.X.; Yu, L.; Wang, Q.B.; Dong, Y.H.; Sun, J.; Tran, L.P.; Li, W.Q. Aggravation of nitrogen losses driven by agriculture and livestock farming development on the Qinghai-Tibet Plateau. J. Environ. Manag. 2023, 326, 116795. [Google Scholar] [CrossRef]
- Zhao, J.H.; Jiang, P.; Shen, T.Q.; Zhang, R.R.; Zhang, D.W.; Zhang, N.N.; Ting, N.; Ding, K.Q.; Yang, B.; Tan, C.H.; et al. Data-driven assessment of soil total nitrogen on the Qinghai-Tibet Plateau. Sci. Total Environ. 2024, 914, 169993. [Google Scholar] [CrossRef]
- Berhane, M.; Xu, M.; Liang, Z.Y.; Shi, J.L.; Wei, G.H.; Tian, X.H. Effects of long-term straw return on soil organic carbon storage and sequestration rate in North China upland crops: A meta-analysis. Glob. Change Biol. 2020, 26, 2686–2701. [Google Scholar] [CrossRef] [PubMed]
- Han, Y.L.; Ma, W.; Zhou, B.Y.; Yang, X.L.; Salah, A.; Li, C.F.; Cao, C.G.; Zhan, M.; Zhao, M. Effects of Straw-Return Method for the Maize-Rice Rotation System on Soil Properties and Crop Yields. Agronomy 2020, 10, 461. [Google Scholar] [CrossRef]
- Huang, T.T.; Yang, N.; Lu, C.; Qin, X.L.; Siddique, K.H.M. Soil organic carbon, total nitrogen, available nutrients, and yield under different straw returning methods. Soil Tillage Res. 2021, 214, 105171. [Google Scholar] [CrossRef]
- Zhao, Y.C.; Wang, M.Y.; Hu, S.J.; Zhang, X.D.; Ouyang, Z.; Zhang, G.L.; Huang, B.; Zhao, S.W.; Wu, J.S.; Xie, D.T.; et al. Economics-and policy-driven organic carbon input enhancement dominates soil organic carbon accumulation in Chinese croplands. Proc. Natl. Acad. Sci. USA 2018, 115, 4045–4050. [Google Scholar] [CrossRef] [PubMed]
- Chen, W.H.; Yuan, W.; Wang, J.; Wang, Z.Y.; Zhou, Z.P.; Liu, S.P. No-Tillage Combined with Appropriate Amount of Straw Returning Increased Soil Biochemical Properties. Sustainability 2022, 14, 4875. [Google Scholar] [CrossRef]
- Wang, X.J.; Jia, Z.K.; Liang, L.Y.; Zhao, Y.F.; Yang, B.P.; Ding, R.X.; Wang, J.P.; Nie, J.F. Changes in soil characteristics and maize yield under straw returning system in dryland farming. Field Crops Res. 2018, 218, 11–17. [Google Scholar] [CrossRef]
- Brownlie, W.J.; Alexander, P.; Maslin, M.; Cañedo-Argüelles, M.; Sutton, M.A.; Spears, B.M. Global food security threatened by potassium neglect. Nat. Food 2024, 5, 111–115. [Google Scholar] [CrossRef]
- Song, X.D.; Liu, F.; Wu, H.Y.; Cao, Q.; Zhong, C.; Yang, J.L.; Li, D.C.; Zhao, Y.G.; Zhang, G.L. Effects of long-term K fertilization on soil available potassium in East China. Catena 2020, 188, 104412. [Google Scholar] [CrossRef]
- Vijayakumar, S.; Gobinath, R.; Kannan, P.; Murugaiyan, V. Optimizing potassium mining in rice-wheat system: Strategies for promoting sustainable soil health-A review. Farming Syst. 2024, 2, 100099. [Google Scholar] [CrossRef]
- Li, D.X.; Li, T.; Gu, J.; Wang, Y.L.; Chen, X.Q.; Lu, D.J.; Tao, Y.Y.; Cui, Z.L.; Chen, X.P.; Lu, J.W.; et al. Potassium resources management systems in Chinese agriculture: Yield gaps and environmental costs. Resour. Conserv. Recycl. 2024, 202, 107397. [Google Scholar] [CrossRef]
- Zhao, Z.; Yang, Y.L.; Xie, H.T.; Zhang, Y.X.; He, H.B.; Zhang, X.D.; Sun, S.J. Enhancing Sustainable Agriculture in China: A Meta-Analysis of the Impact of Straw and Manure on Crop Yield and Soil Fertility. Agriculture 2024, 14, 480. [Google Scholar] [CrossRef]
- Fu, B.; Chen, L.; Huang, H.Y.; Qu, P.; Wei, Z.G. Impacts of crop residues on soil health: A review. Environ. Pollut. Bioavailab. 2021, 33, 164–173. [Google Scholar] [CrossRef]
- Pang, N.J.; Hong, S.Q.; Zhu, Y.C. The Status of Potassium in Major Cultivated Soils and the Efficacy of Potassium Fertilizers in Qinghai Province. Qinghai Agric. For. Sci. Technol. 1994, 4, 6–9. [Google Scholar]
- Gonzalez-Quiñones, V.; Stockdale, E.A.; Banning, N.C.; Hoyle, F.C.; Sawada, Y.; Wherrett, A.D.; Jones, D.L.; Murphy, D.V. Soil microbial biomass-Interpretation and consideration for soil monitoring. Soil Res. 2011, 49, 287–304. [Google Scholar] [CrossRef]
- Jenkinson, D.S.; Brookes, P.C.; Powlson, D.S. Measuring soil microbial biomass. Soil Biol. Biochem. 2004, 36, 5–7. [Google Scholar] [CrossRef]
- Zhang, Q.; Zhou, W.; Liang, G.Q.; Sun, J.W.; Wang, X.B.; He, P. Distribution of soil nutrients, extracellular enzyme activities and microbial communities across particle-size fractions in a long-term fertilizer experiment. Appl. Soil Ecol. 2015, 94, 59–71. [Google Scholar] [CrossRef]
- Cheng, L.; Wang, H.Y. Responses of Soil Bacterial Communities and Enzyme Activities to Straw Return and Potassium Fertilization with Two Soils Under Soil Potassium Balance Condition in Rice-Wheat System. J. Soil Sci. Plant Nutr. 2023, 23, 1845–1859. [Google Scholar] [CrossRef]
- Fang, Y.Y.; Nazaries, L.; Singh, B.K.; Singh, B.P. Microbial mechanisms of carbon priming effects revealed during the interaction of crop residue and nutrient inputs in contrasting soils. Glob. Change Biol. 2018, 24, 2775–2790. [Google Scholar] [CrossRef] [PubMed]
- Tang, Z.W.; Ying, W.; Tong, Z.X.; Mei, C.H.; Ci, D.W.; Na, W.P.; Qiang, Z.B.; Cai, L.J.; Xiang, C. Meta-analysis of Soil Microbial Biomass Carbon and Its Influencing Factors in Chinese Farmland Under Straw Return. Ecol. Environ. Sci. 2023, 32, 1552–1562. [Google Scholar] [CrossRef]
- Wang, Q.J.; Cao, X.; Jiang, H.; Guo, Z.H. Straw Application and Soil Microbial Biomass Carbon Change: A Meta-Analysis. Clean-Soil Air Water 2020, 49, 104395. [Google Scholar] [CrossRef]
- Yang, L.; Chen, T.Y.; Li, Z.Y.; Muhammad, I.; Chi, Y.X.; Zhou, X.B. Straw incorporation and nitrogen fertilization regulate soil quality, enzyme activities and maize crop productivity in dual maize cropping system. Bmc Plant Biol. 2024, 24, 729. [Google Scholar] [CrossRef] [PubMed]
- Bahram, M.; Hildebrand, F.; Forslund, S.K.; Anderson, J.L.; Soudzilovskaia, N.A.; Bodegom, P.M.; Bengtsson-Palme, J.; Anslan, S.; Coelho, L.P.; Harend, H.; et al. Structure and function of the global topsoil microbiome. Nature 2018, 560, 233–237. [Google Scholar] [CrossRef]
- Barberán, A.; Bates, S.T.; Casamayor, E.O.; Fierer, N. Using network analysis to explore co-occurrence patterns in soil microbial communities. Isme J. 2012, 6, 343–351. [Google Scholar] [CrossRef]
- Faust, K.; Raes, J. Microbial interactions: From networks to models. Nat. Rev. Microbiol. 2012, 10, 538–550. [Google Scholar] [CrossRef]
- Banerjee, S.; Kirkby, C.A.; Schmutter, D.; Bissett, A.; Kirkegaard, J.A.; Richardson, A.E. Network analysis reveals functional redundancy and keystone taxa amongst bacterial and fungal communities during organic matter decomposition in an arable soil. Soil Biol. Biochem. 2016, 97, 188–198. [Google Scholar] [CrossRef]
- Dai, H.C.; Zhang, H.; Li, Z.X.; Liu, K.C.; Zamanian, K. Tillage Practice Impacts on the Carbon Sequestration Potential of Topsoil Microbial Communities in an Agricultural Field. Agronomy 2020, 11, 60. [Google Scholar] [CrossRef]
- Fan, F.L.; Yu, B.; Wang, B.; George, T.S.; Yin, H.Q.; Xu, D.Y.; Li, D.C.; Song, A. Microbial mechanisms of the contrast residue decomposition and priming effect in soils with different organic and chemical fertilization histories. Soil Biol. Biochem. 2019, 135, 213–221. [Google Scholar] [CrossRef]
- Guan, Y.P.; Wu, M.K.; Che, S.H.; Yuan, S.; Yang, X.; Li, S.Y.; Tian, P.; Wu, L.; Yang, M.Y.; Wu, Z.H. Effects of Continuous Straw Returning on Soil Functional Microorganisms and Microbial Communities. J. Microbiol. 2023, 61, 49–62. [Google Scholar] [CrossRef]
- Xia, Q.; Rufty, T.; Shi, W. Soil microbial diversity and composition: Links to soil texture and associated properties. Soil Biol. Biochem. 2020, 149, 107953. [Google Scholar] [CrossRef]
- Yang, T.; Lupwayi, N.; Marc, S.-A.; Siddique, K.H.M.; Bainard, L.D. Anthropogenic drivers of soil microbial communities and impacts on soil biological functions in agroecosystems. Glob. Ecol. Conserv. 2021, 27, e01521. [Google Scholar] [CrossRef]
- Bao, S.D. Soil Agro-Chemistry Analysis, 3rd ed.; China Agriculture Press: Beijing, China, 2000; pp. 8–18. [Google Scholar]
- Wu, J.; Joergensen, R.G.; Pommerening, B.; Chaussod, R.; Brookes, P.C. Measurement of soil microbial biomass C by fumigation-extraction—An automated procedure. Soil Biol. Biochem. 1990, 22, 1167–1169. [Google Scholar] [CrossRef]
- Adetunji, A.T.; Lewu, F.B.; Mulidzi, R.; Ncube, B. The biological activities of β-glucosidase, phosphatase and urease as soil quality indicators: A review. J. Soil Sci. Plant Nutr. 2017, 17, 794–807. [Google Scholar] [CrossRef]
- Moorhead, D.L.; Rinkes, Z.L.; Sinsabaugh, R.L.; Weintraub, M.N. Dynamic relationships between microbial biomass, respiration, inorganic nutrients and enzyme activities: Informing enzyme-based decomposition models. Front. Microbiol. 2013, 4, 223. [Google Scholar] [CrossRef] [PubMed]
- Marx, M.C.; Wood, M.; Jarvis, S.C. A microplate fluorimetric assay for the study of enzyme diversity in soils. Soil Biol. Biochem. 2001, 33, 1633–1640. [Google Scholar] [CrossRef]
- Shannon, P.; Markiel, A.; Ozier, O.; Baliga, N.S.; Wang, J.T.; Ramage, D.; Amin, N.; Schwikowski, B.; Ideker, T. Cytoscape: A software environment for integrated models of biomolecular interaction networks. Genome Res. 2003, 13, 2498–2504. [Google Scholar] [CrossRef]
- Li, H.D.; Li, J.; Jiao, X.Y.; Jiang, H.Z.; Liu, Y.; Wang, X.L.; Ma, C. The Fate and Challenges of the Main Nutrients in Returned Straw: A Basic Review. Agronomy 2024, 14, 698. [Google Scholar] [CrossRef]
- Li, H.; Dai, M.W.; Dai, S.L.; Dong, X.J. Current status and environment impact of direct straw return in China’s cropland-A review. Ecotoxicol. Environ. Saf. 2018, 159, 293–300. [Google Scholar] [CrossRef]
- Chen, Q.Y.; Xin, Y.; Liu, Z.J. Long-Term Fertilization with Potassium Modifies Soil Biological Quality in K-Rich Soils. Agronomy 2020, 10, 771. [Google Scholar] [CrossRef]
- Dang, P.F.; Li, C.F.; Huang, T.T.; Lu, C.; Li, Y.J.; Qin, X.L.; Siddique, K.H.M. Effects of different continuous fertilizer managements on soil total nitrogen stocks in China: A meta-analysis. Pedosphere 2022, 32, 39–48. [Google Scholar] [CrossRef]
- Li, Y.; Li, Z.; Cui, S.; Jagadamma, S.; Zhang, Q.P. Residue retention and minimum tillage improve physical environment of the soil in croplands: A global meta-analysis. Soil Tillage Res. 2019, 194, 104292. [Google Scholar] [CrossRef]
- Liu, J.; Fang, L.C.; Qiu, T.Y.; Chen, J.; Wang, H.; Liu, M.X.; Yi, J.; Zhang, H.L.; Wang, C.; Sardans, J.; et al. Crop residue return achieves environmental mitigation and enhances grain yield: A global meta-analysis. Agron. Sustain. Dev. 2023, 43, 78. [Google Scholar] [CrossRef]
- Xie, J.; Evgenia, B.; Zhang, Y.; Wan, Y.; Hu, Q.J.; Zhang, C.M.; Wang, J.; Zhang, Y.Q.; Shi, X.J. Substituting nitrogen and phosphorus fertilizer with optimal amount of crop straw improves rice grain yield, nutrient use efficiency and soil carbon sequestration. J. Integr. Agric. 2022, 21, 3345–3355. [Google Scholar] [CrossRef]
- Liu, L.; Cheng, M.; Yang, L.; Gu, X.Y.; Jin, J.Y.; Fu, M.J. Regulation of straw decomposition and its effect on soil function by the amount of returned straw in a cool zone rice crop system. Sci. Rep. 2023, 13, 15673. [Google Scholar] [CrossRef]
- Song, J.; Zeng, X.B.; Wang, Y.N.; Bai, L.Y. Effects, Issues, and Countermeasures of Straw Return. J. Ecol. 2020, 39, 1715–1722. [Google Scholar] [CrossRef]
- Cong, P.; Wang, J.; Li, Y.Y.; Liu, N.; Dong, J.X.; Pang, H.C.; Zhang, L.; Gao, Z.J. Changes in soil organic carbon and microbial community under varying straw incorporation strategies. Soil Tillage Res. 2020, 204, 104735. [Google Scholar] [CrossRef]
- Liu, B.; Xia, H.; Jiang, C.C.; Riaz, M.; Yang, L.; Chen, Y.F.; Fan, X.P.; Xia, X.E. 14 year applications of chemical fertilizers and crop straw effects on soil labile organic carbon fractions, enzyme activities and microbial community in rice-wheat rotation of middle China. Sci. Total Environ. 2022, 841, 156608. [Google Scholar] [CrossRef]
- Kwiatkowska-Malina, J. Qualitative and quantitative soil organic matter estimation for sustainable soil management. J. Soils Sediments 2018, 18, 2801–2812. [Google Scholar] [CrossRef]
- Su, Y.; Yu, M.; Xi, H.; Lv, J.L.; Ma, Z.H.; Kou, C.L.; Shen, A. Soil microbial community shifts with long-term of different straw return in wheat-corn rotation system. Sci. Rep. 2020, 10, 6360. [Google Scholar] [CrossRef]
- Zhang, M.M.; Dang, P.F.; Haegeman, B.; Han, X.Q.; Wang, X.F.; Pu, X.; Qin, X.L.; Siddique, K.H.M. The effects of straw return on soil bacterial diversity and functional profiles: A meta-analysis. Soil Biol. Biochem. 2024, 195, 109484. [Google Scholar] [CrossRef]
- Su, Y.; Lv, J.L.; Yu, M.; Ma, Z.H.; Xi, H.; Kou, C.L.; He, Z.C.; Shen, A.L. Long-term decomposed straw return positively affects the soil microbial community. J. Appl. Microbiol. 2020, 128, 138–150. [Google Scholar] [CrossRef]
- Spain, A.M.; Krumholz, L.R.; Elshahed, M.S. Abundance, composition, diversity and novelty of soil Proteobacteria. Isme J. 2009, 3, 992–1000. [Google Scholar] [CrossRef] [PubMed]
- Li, J.J.; Dong, L.B.; Fan, M.C.; Shangguan, Z.P. Long-term vegetation restoration promotes lignin phenol preservation and microbial anabolism in forest plantations: Implications for soil organic carbon dynamics. Sci. Total Environ. 2024, 928, 172635. [Google Scholar] [CrossRef]
- Buckley Daniel, H.; Huangyutitham, V.; Nelson Tyrrell, A.; Rumberger, A.; Thies Janice, E. Diversity of Planctomycetes in Soil in Relation to Soil History and Environmental Heterogeneity. Appl. Environ. Microbiol. 2006, 72, 4522–4531. [Google Scholar] [CrossRef]
- Wang, X.Q.; Sharp Christine, E.; Jones Gareth, M.; Grasby Stephen, E.; Brady Allyson, L.; Dunfield Peter, F. Stable-Isotope Probing Identifies Uncultured Planctomycetes as Primary Degraders of a Complex Heteropolysaccharide in Soil. Appl. Environ. Microbiol. 2015, 81, 4607–4615. [Google Scholar] [CrossRef]
- Xiao, D.; He, X.Y.; Wang, G.H.; Xu, X.C.; Hu, Y.J.; Chen, X.B.; Zhang, W.; Su, Y.R.; Wang, K.L.; Soromotin, A.V.; et al. Network analysis reveals bacterial and fungal keystone taxa involved in straw and soil organic matter mineralization. Appl. Soil Ecol. 2022, 173, 104395. [Google Scholar] [CrossRef]
- Hu, X.J.; Gu, H.D.; Liu, J.J.; Wei, D.; Zhu, P.; Cui, X.A.; Zhou, B.K.; Chen, X.L.; Jin, J.; Liu, X.B.; et al. Metagenomics reveals divergent functional profiles of soil carbon and nitrogen cycling under long-term addition of chemical and organic fertilizers in the black soil region. Geoderma 2022, 418, 115846. [Google Scholar] [CrossRef]
- Li, Y.M.; Duan, Y.; Wang, G.L.; Wang, A.Q.; Shao, G.Z.; Meng, X.H.; Hu, H.Y.; Zhang, D.M. Straw alters the soil organic carbon composition and microbial community under different tillage practices in a meadow soil in Northeast China. Soil Tillage Res. 2021, 208, 104879. [Google Scholar] [CrossRef]
- DeBruyn Jennifer, M.; Nixon Lauren, T.; Fawaz Mariam, N.; Johnson Amy, M.; Radosevich, M. Global Biogeography and Quantitative Seasonal Dynamics of Gemmatimonadetes in Soil. Appl. Environ. Microbiol. 2011, 77, 6295–6300. [Google Scholar] [CrossRef]
- Ma, A.; Zhuang, X.; Wu, J.; Cui, M.; Lv, D.; Liu, C.; Zhuang, G. Ascomycota Members Dominate Fungal Communities during Straw Residue Decomposition in Arable Soil. PLoS ONE 2013, 8, e66146. [Google Scholar] [CrossRef]
- Manici, L.M.; Caputo, F.; De Sabata, D.; Fornasier, F. The enzyme patterns of Ascomycota and Basidiomycota fungi reveal their different functions in soil. Appl. Soil Ecol. 2024, 196, 105323. [Google Scholar] [CrossRef]
- Manici, L.M.; Caputo, F.; Fornasier, F.; Paletto, A.; Ceotto, E.; De Meo, I. Ascomycota and Basidiomycota fungal phyla as indicators of land use efficiency for soil organic carbon accrual with woody plantations. Ecol. Indic. 2024, 160, 111796. [Google Scholar] [CrossRef]
- Egidi, E.; Delgado-Baquerizo, M.; Plett, J.M.; Wang, J.; Eldridge, D.J.; Bardgett, R.D.; Maestre, F.T.; Singh, B.K. A few Ascomycota taxa dominate soil fungal communities worldwide. Nat. Commun. 2019, 10, 2369. [Google Scholar] [CrossRef] [PubMed]
- Corsaro, D.; Walochnik, J.; Venditti, D.; Müller, K.D.; Hauröder, B.; Michel, R. Rediscovery of Nucleophaga amoebae, a novel member of the Rozellomycota. Parasitol. Res. 2014, 113, 4491–4498. [Google Scholar] [CrossRef] [PubMed]
- Davis, W.J.; Amses, K.R.; Benny, G.L.; Carter House, D.; Chang, Y.; Grigoriev, I.; Smith, M.E.; Spatafora, J.W.; Stajich, J.E.; James, T.Y. Genome-scale phylogenetics reveals a monophyletic Zoopagales (Zoopagomycota, Fungi). Mol. Phylogenetics Evol. 2019, 133, 152–163. [Google Scholar] [CrossRef]
- Yang, Y.; Chen, X.L.; Liu, L.X.; Li, T.; Dou, Y.X.; Qiao, J.B.; Wang, Y.Q.; An, S.S.; Chang, S.X. Nitrogen fertilization weakens the linkage between soil carbon and microbial diversity: A global meta-analysis. Glob. Change Biol. 2022, 28, 6446–6461. [Google Scholar] [CrossRef]
- Liang, F.; Li, B.Z.; Vogt, R.D.; Mulder, J.; Song, H.; Chen, J.S.; Guo, J.H. Straw return exacerbates soil acidification in major Chinese croplands. Resour. Conserv. Recycl. 2023, 198, 107176. [Google Scholar] [CrossRef]
- Philippot, L.; Chenu, C.; Kappler, A.; Rillig, M.C.; Fierer, N. The interplay between microbial communities and soil properties. Nat. Rev. Microbiol. 2024, 22, 226–239. [Google Scholar] [CrossRef]
Disclaimer/Publisher’s Note: The statements, opinions and data contained in all publications are solely those of the individual author(s) and contributor(s) and not of MDPI and/or the editor(s). MDPI and/or the editor(s) disclaim responsibility for any injury to people or property resulting from any ideas, methods, instructions or products referred to in the content. |
© 2025 by the authors. Licensee MDPI, Basel, Switzerland. This article is an open access article distributed under the terms and conditions of the Creative Commons Attribution (CC BY) license (https://creativecommons.org/licenses/by/4.0/).