Article

TLDDM: An Enhanced Tea Leaf Pest and Disease Detection Model Based on YOLOv8

1
College of Information Science and Technology, Nanjing Forestry University, No. 159 Longpan Road, Nanjing 210037,China
2
Jiangsu JITRI Intelligent Sensing Technology Co., Ltd., Nantong 226001, China
*
Author to whom correspondence should be addressed.
Agronomy 2025, 15(3), 727; https://doi.org/10.3390/agronomy15030727
Submission received: 8 February 2025 / Revised: 8 March 2025 / Accepted: 15 March 2025 / Published: 18 March 2025
(This article belongs to the Section Pest and Disease Management)

Abstract

:
The detection and identification of tea leaf diseases and pests play a crucial role in determining the yield and quality of tea. However, the high similarity between different tea leaf diseases and the difficulty of balancing model accuracy and complexity pose significant challenges during the detection process. This study proposes an enhanced Tea Leaf Disease Detection Model (TLDDM), an improved model based on YOLOv8 to tackle the challenges. Initially, the C2f-Faster-EMA module is employed to reduce the number of parameters and model complexity while enhancing image feature extraction capabilities. Furthermore, the Deformable Attention mechanism is integrated to improve the model’s adaptability to spatial transformations and irregular data structures. Moreover, the Slimneck structure is incorporated to reduce the model scale. Finally, a novel detection head structure, termed EfficientPHead, is proposed to maintain detection performance while improving computational efficiency and reducing parameters which leads to inference speed acceleration. Experimental results demonstrate that the TLDDM model achieves an AP of 98.0%, which demonstrates a significant performance enhancement compared to the SSD and Faster R-CNN algorithm. Furthermore, the proposed model is not only of great significance in improving the performance in accuracy, but also can provide remarkable advantages in real-time detection applications with an FPS (frames per second) of 98.2.

1. Introduction

Tea occupies a prominent place as a traditional beverage. However, tea cultivation is increasingly threatened by plant diseases and pest infestations, which in turn hinder the quality and quantity of production [1]. The rapid and precise detection of such issues enables the implementation of effective prevention and control measures. Currently, the identification of diseases and pests predominantly relies on manual inspection which is both time-consuming and costly [2].
With the development of computer vision technologies, researchers have begun applying image processing and machine learning methods for detecting crop diseases and pests. Bauriegel et al. [3] utilized spectral angle mapping combined with hyperspectral imaging (HSI) systems to detect Fusarium head blight in wheat. Sethy et al. [4] employed deep features integrated with a support vector machine (SVM) model for the identification of rice leaf diseases. Behmann et al. [5] distinguished well-irrigated plants from those subjected to drought stress using ordinal classification with SVMs to HSI. Xie et al. [6] leveraged K-nearest neighbor and C5.0 models with HSI to classify healthy and Botrytis-infected tomato leaves. Zhang et al. [7] proposed a method for cucumber disease identification based on leaf images, integrating K-means clustering and sparse representation classification. Hossain et al. [8] developed an image processing system that employed an SVM classifier to identify and categorize brown spots and algae leaf diseases, distinguishing them from healthy leaves. Sun et al. [9] introduced an innovative approach combining simple linear iterative clustering (SLIC) with SVMs, enabling the precise extraction of saliency maps for tea leaf diseases under complex backgrounds. In summary, classical machine learning methods for plant disease detection usually rely on manual feature extraction, thereby significantly reducing the accuracy of disease diagnosis.
In recent years, the rapid evolution of deep learning technologies has spurred growing interest among researchers in applying these techniques to the detection of crop leaf diseases and pests. Breakthroughs in image recognition have facilitated the widespread adoption of convolutional neural networks (CNNs) for the automated classification and identification. For instance, Chen et al. [10] proposed a CNN model named LeafNet, specifically designed to automatically extract features related to tea plant diseases from images. Hu et al. [11] introduced a few-shot learning approach that utilized SVMs to isolate diseased regions in tea leaf photographs. They further addressed the challenge of limited sample sizes by employing an enhanced C-DCGAN. Moreover, Hu et al. [12] presented a detection model based on the CIFAR10-quick framework, incorporating multi-scale feature extraction modules and depthwise separable convolutions to improve performance. Jiang et al. [13] employed CNNs to extract image features of rice leaf diseases and used SVMs to classify and predict specific diseases. CNN-based methods for tea disease identification have demonstrated significant advantages over traditional machine learning approaches. While promising, these methods primarily focus on the recognition and classification, rather than addressing comprehensive disease management.
Image detection networks based on deep learning can be categorized into one-stage and two-stage models [14]. Faster R-CNN [15], which is region-based, is an example of a two-stage detection network. Zhou et al. developed a rice disease detection algorithm that integrates Faster R-CNN with FCM-KM, resulting in promising performance [16]. However, despite its high detection accuracy, the slower processing speed of Faster R-CNN limits its suitability for real-time applications. In contrast, one-stage detection networks offer greater computational efficiency, albeit with a potential trade-off, though they may sacrifice some accuracy. Representative one-stage detectors include You Only Look Once (YOLO), Single Shot MultiBox Detector (SSD) [17], and RetinaNet [18]. Among these, the YOLO series has garnered widespread adoption in agricultural applications due to its balance of efficiency and accuracy [19,20,21,22]. Tian et al. designed a YOLOv3-based system capable of real-time detection of apples at three distinct growth stages in orchards [23,24]. Similarly, Roy et al. developed a high-performance real-time fine-grained detection framework to tackle challenges such as dense distributions and irregular shapes [25]. Building on YOLOv4 [26], Sun et al. introduced an innovative approach leveraging the YOLOv4 deep learning network for individual tree crown (ITC) segmentation, further refining overlapping crown segmentation results using computer graphics algorithms [27]. Dai et al. proposed YOLOv5-CAcT, a YOLOv5-based method for crop disease detection [28]. Hoang et al. presented a hybrid model combining Autoencoder with YOLOv6 for the identification of poultry diseases [29]. Additionally, Zhao et al. introduced LW-YOLOv7, a lightweight version of YOLOv7 designed for real-time detection of maize seedlings in field environments [30]. Despite the widespread adoption of the YOLO series in crop disease and pest detection, its application in detecting tea leaf diseases and pests remains relatively underexplored.
To address this gap, this study proposes a model named TLDDM, which is a tea disease detection system based on an improved YOLOv8 framework. The main contributions of this study are as follows: (1) the traditional YOLOv8 backbone’s C2f module is replaced with the C2f-Faster-EMA module, enhancing feature extraction efficiency. (2) Deformable Attention is introduced at the end of the backbone structure improving the model’s ability to focus on critical regions in complex images. (3) Slimneck components, including Generalized-Sparse Convolution (GSConv) and Vector of Visual Geometry Group and Scene Parsing (VoVGSCSP), are embedded into the Neck network of the original algorithm, optimizing computational efficiency while maintaining detection accuracy. (4) The detection head of YOLOv8 is restructured into EfficientPHead, achieving a well-balanced trade-off between model performance, speed, and size.

2. Materials and Methods

2.1. Data Collection

This study utilizes the publicly available Tea_Leaf_Disease dataset for model training. The dataset comprises a total of 5867 images, categorized into six classes, adhering to the COCO128 format [12]. The classes include algal leaf spot (1000 images), brown blight (867 images), gray blight (1000 images), healthy (1000 images), helopeltis (1000 images), and redspot (1000 images).
Each image within the dataset was systematically annotated with its corresponding class label, encompassing the following categories. Representative samples from the dataset are illustrated in Figure 1. Additionally, the dataset was randomly partitioned divided in a ratio of 7:1:2. The detailed information of the dataset is shown in Table 1.

2.2. TLDDM Model Design

2.2.1. YOLOv8 Model

YOLOv8 is a versatile framework that integrates multiple tasks, including object detection, instance segmentation, and key point detection. The model offers five variants—n, s, m, l, and x—all of which adhere to a unified network architecture.
The YOLOv8 network architecture is structured into four primary components: input, backbone, neck, and output. The input stage incorporates Mosaic data augmentation, adaptive anchor box computation, and adaptive grayscale padding. The backbone consists of Conv, C2f, and Spatial Pyramid Pooling-Fast (SPPF) modules, with the C2f module serving as the core unit for learning residual features. Drawing inspiration from the Efficient Layer Aggregation Network (ELAN) structure introduced in YOLOv7, the C2f module integrates additional branched cross-layer connections, thereby enriching gradient flow and significantly improving the network’s feature representation capabilities. Furthermore, YOLOv8 also features an optimized SPPF module, which accelerates training, reduces redundant gradient information, and enhances the network’s overall learning capacity. The neck module adopts the Path Aggregation Network (PAN) structure, improving the network’s ability to fuse features from objects at varying scales. In the output stage, the classification and detection processes are decoupled, including loss computation and object detection box filtering. For loss computation, the network implements strategies for assigning positive and negative samples, with the loss calculation process divided into two branches: classification and regression, omitting an objectness branch. The classification branch still employs BCE loss, whereas the regression branch incorporates both Distribution Focal Loss and the Complete Intersection over Union (CIOU) loss function. The enhanced YOLOv8 network architecture proposed in this study is illustrated in Figure 2.

2.2.2. C2f-Faster-EMA

In the YOLOv8 architecture, the C3 module is replaced with the C2f module to achieve high-quality image feature extraction and down sampling. However, modification results in an increased parameter count and greater model complexity. To address these challenges and improve both training and inference efficiency, the FasterNet [31] module, inspired by the principles of partial convolution (PConv), is employed to replace the bottleneck structure within the C2f module. This adaptation facilitates more efficient spatial feature extraction while maintaining computational performance.
The C2f module leverages multiple bottleneck operations to obtain richer gradient information. Each bottleneck consists of two 1 × 1 convolution layers and one 3 × 3 convolution layer, which collectively perform dimension reduction, convolution, and dimension expansion on the input. However, this approach involves a large number of floating-point operations. To mitigate computational complexity and reduce FLOPs, the FasterNet block incorporates PConv, minimizing memory access and computational redundancy. PConv applies regular convolution to extract spatial features from a portion of the input channels while keeping the remaining channels unchanged [32]. The FLOPS for PConv is calculated as follows:
h × w × k 2 × c p 2
where h and w denote the width and height of the feature map, respectively; k represents the kernel size; and c p denotes the number of channels involved in the convolution operation. Typically, c p equals one-fourth of the channels used in standard convolution. Consequently, the FLOPS of PConv are merely 1/16 of those associated with standard convolution.
FasterNet is designed based on the foundational principles of PConv. It comprises four hierarchical stages, each initiated by an embedding layer—implemented as a standard 4 × 4 convolution with a stride of 4—or a merging layer—implemented as a standard 2 × 2 convolution with a stride of 2—to achieve spatial downsampling and channel expansion. Each stage consists of a sequence of FasterNet blocks, where each block incorporates a PConv layer followed by two 1 × 1 convolution layers. Batch normalization and the Rectified Linear Unit (ReLU) activation function are employed as normalization and activation mechanisms, respectively, which collectively contribute to a significant reduction in FLOPS [33].
To enhance pixel-level dependencies, attention mechanisms such as the CBAM [34] and SE [35] modules have been integrated into convolutional neural networks, demonstrating improvements in object detection and recognition performance. However, these attention modules involve manual design and a significant number of pooling operations, which substantially escalate computational demands. To address these limitations, the proposed model incorporates an EMA module into the YOLOv8 C2f-Faster module, specifically tailored for the tea tree leaf pest and disease dataset. EMA is an innovative and efficient multi-scale attention module that eliminates the necessity for dimensionality reduction. By reshaping a portion of the channels into the batch dimension and grouping the channel dimension into multiple sub-features, it achieves uniform distribution of spatial semantic features within each feature group.
Building on the original YOLOv8 network, this study introduces a significant enhancement by substituting the C2f module in the YOLOv8 backbone with the C2f-Faster-EMA module, as illustrated in Figure 3. This modification reduces floating-point operations during the feature extraction process within the backbone network. Additionally, the integration of the attention mechanism into the forward propagation process serves to augment the accuracy of target detection and the overall capability of image feature extraction [36].

2.2.3. Deformable Attention
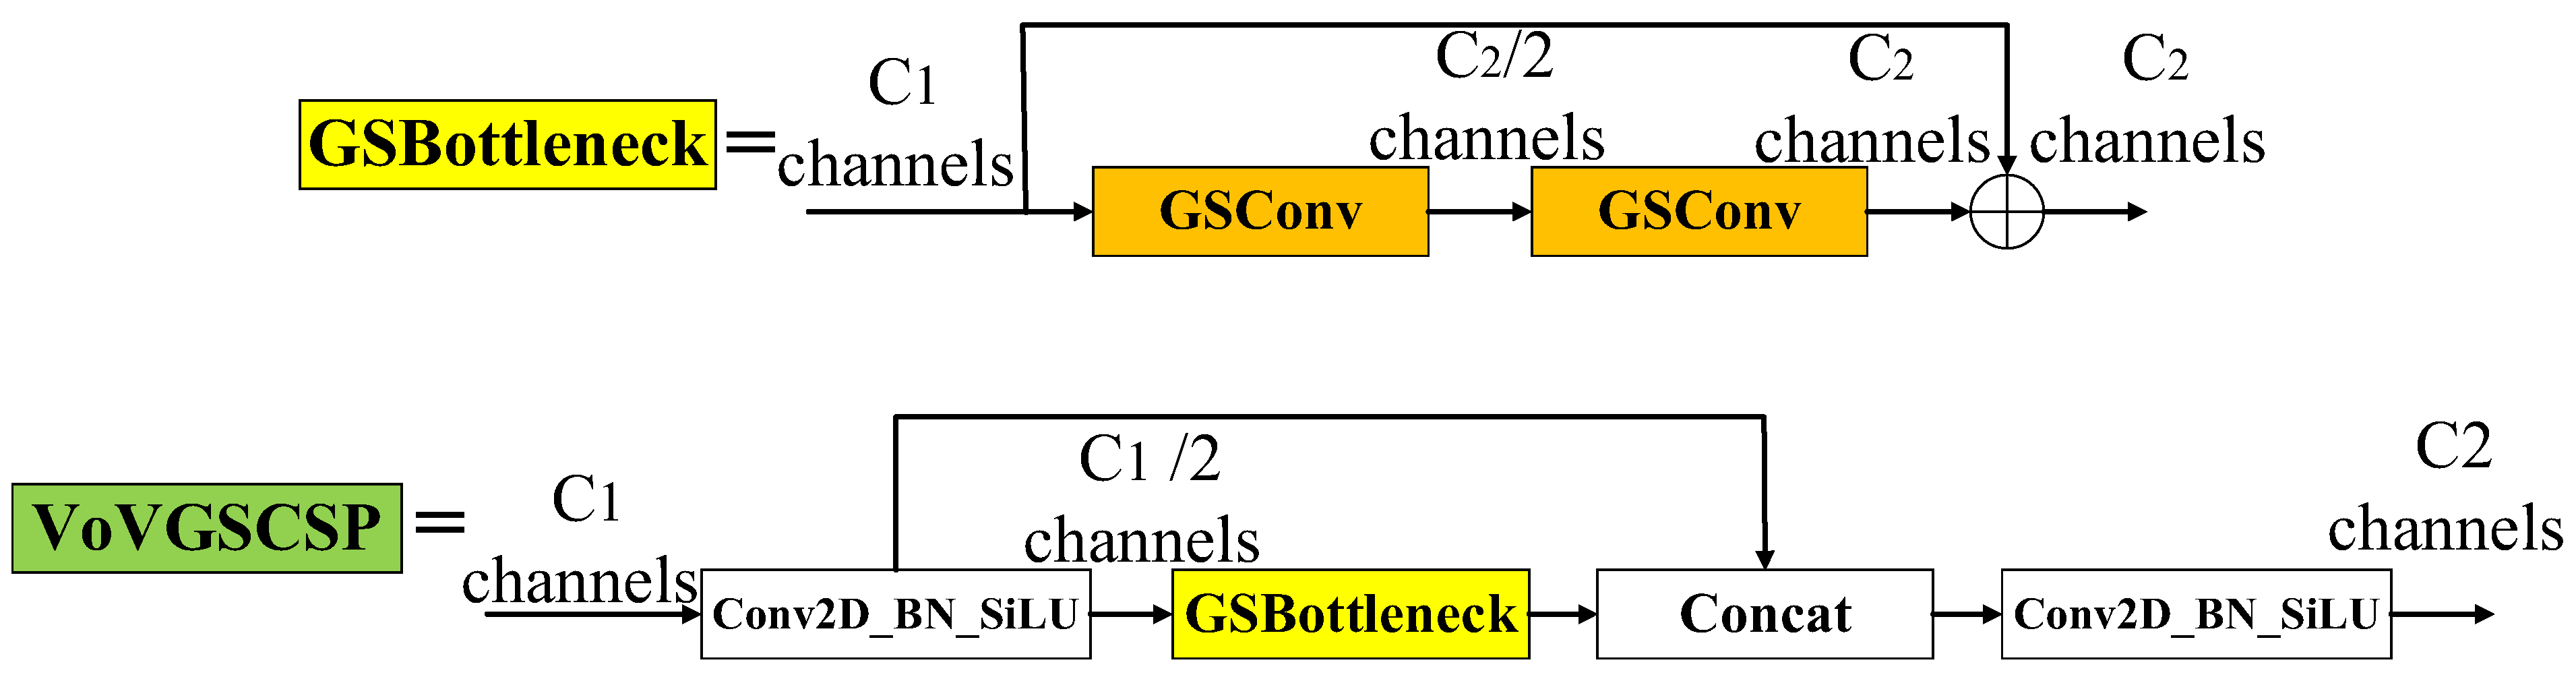
Deformable Attention is an attention mechanism in deep learning, specifically engineered to handle images, videos, and other structured data effectively [37]. The fundamental principle of Deformable Attention lies in its ability to adapt the attention mechanism to focus more flexibly on specific regions of the input data rather than relying solely on fixed, regular data structures. This adaptability is realized by dynamically selecting subsets of input features, enhancing the model’s capability to spatial transformations and irregular data structures.
In standard Transformer models, the Self-Attention mechanism allows the model to consider the entire sequence while processing each element by computing attention weights across all elements. However, this approach may prove suboptimal for data with complex spatial structures (e.g., images), this is because correlations within images often exhibit locality and can dynamically shift in response to object movement and deformation.
Deformable Attention addresses this limitation by introducing deformable sampling positions. Instead of uniformly computing attention weights across all positions, it dynamically selects a set of key positions (or sampling points) based on the input features and computes attention weights exclusively at these positions. This adaptive approach allows the model to concentrate more precisely on salient regions within an image, improving both efficiency and performance [37].
The implementation of Deformable Attention involves several steps. First and foremost, the model learns a set of offsets that determine the locations of sampling points for the input feature map. These offsets are dynamically computed based on the input features, allowing the model to adapt to variations in the input data and identifying key positions of interest. Secondly, attention weights are calculated based on the sampled features, which are then used to aggregate information. Finally, the model applies the calculated attention weights to the sampled features, generating the output feature map. This output is subsequently utilized in downstream tasks such as classification, detection, or segmentation. This approach significantly improves efficiency and effectiveness in handling vision tasks with complex spatial structures and dynamic variations [38]. Figure 4 illustrates the Deformable Attention module.
Given an input feature map x with dimensions H × W × C , our objective is to generate a point set P with dimensions H C × W G × 2 , which forms a uniform grid for reference. Specifically, the grid dimensions are derived by downsampling the input feature map by a factor of r, resulting in dimensions H G = H / r , W G = W / r . The coordinates of this reference point are linearly spaced two-dimensional coordinates ranging from (0, 0) to ( H G 1 , W G 1 ) , and these coordinates are normalized to the range of (−1, 1) according to the shape of the grid H G × W G , where (−1, 1) represents the upper left corner of the grid and (+1, +1) the lower right corner. This normalization ensures consistency in spatial representation across varying grid sizes.
To compute the offset for each reference point, the input feature map x is first linearly mapped to generate query tokens q = x W q . These query tokens are then passed through a lightweight network θ o f f s e t ( ) to produce the corresponding offsets Δ p = θ o f f s e t ( ) . To ensure training stability, a predefined scaling factor s is applied to constrain the magnitude of the offsets Δ p , thereby preventing excessive displacement. Subsequently, feature sampling is conducted at the deformed point positions, serving as the source for keys (K) and values (V). A projection matrix is then applied to these sampled features to integrate them into the subsequent computation. This structured approach ensures both precision and robustness in the computation process.
q = x W q , k ˜ = x ˜ W k , v ˜ = x ˜ W v
w i t h Δ p = θ o f f s e t ( q ) , x ˜ = ϕ ( x ; p + Δ p )
The deformed key embeddings and value embeddings are denoted as k ˜ and v ˜ . To maintain the differentiability of this process, the sampling function φ ( , ) is implemented using bilinear interpolation.
ϕ ( z ; ( p x , p y ) ) = ( r x , r y ) g ( p x , r x ) g ( p y , r y ) z r y , r x , :
Specifically, g ( a , b ) = max ( 0 , 1 a b ) , where g functions are non-zero only at the four integer positions closest to point ( p x , p y ) , which index all possible positions of z in the input feature map x , whose dimension is H × W × C .
z ( m ) = σ ( q ( m ) k ˜ ( m ) Τ / d + ϕ ( B ^ ; R ) ) v ˜ ( m )
This approach facilitates the effective utilization of information derived from the input feature map while ensuring stability during the training process, providing precisely adjusted reference points and associated features for subsequent processing steps.
The primary advantage of Deformable Attention lies in its adaptability to input data, allowing it to effectively handle spatial variations and irregular structures within images. This flexibility makes it particularly well-suited for visual tasks, where it consistently delivers superior performance. Moreover, by reducing the number of positions requiring the computation of attention weights, Deformable Attention enhances computational efficiency. Overall, Deformable Attention offers an efficient and flexible mechanism for tackling complex visual tasks, significantly enhancing the performance of deep learning models across a wide range of vision-related challenges.

2.2.4. Slimneck

In YOLOv8, the Neck network is strategically positioned between the Backbone and the Head to optimize the use of features extracted by the Backbone and facilitate effective feature fusion. It employs a PANet dual pyramid structure, which enhances the feature integration process. The traditional Feature Pyramid Network (FPN) transmits rich semantic features from the top to the bottom, thereby strengthening the entire pyramid. However, FPN focuses solely on enhancing semantic information and does not address the transfer of localization information. PANet overcomes this limitation by introducing a bottom-up pyramid, which has shallower convolutional layers and larger spatial size, alongside the conventional FPN, then forming a dual pyramid structure. PANet utilizes a path aggregation approach to improve the representation of robust localization features derived from lower layers.
To achieve an optimal balance between a lightweight architecture and detection accuracy in YOLOv8, this study employs the Slim-Neck module. This module is designed to ensure a lightweight structure while concurrently improving detection performance. Key components such as GSConv and VoVGSCSP from the Slim-Neck module are systematically integrated into the Neck network of the original algorithm.
The GSConv workflow initiates with sub-sampling of the input through standard convolution (SC), followed by depthwise convolution (DWConv) [39]. And the outputs of SC and depthwise separable convolution (DSC) are concatenated. A uniform mixing strategy is then implemented via a Shuffle operation, which randomly reordered the data samples, ensuring that each sample possesses an equal probability of being associated with either data type when sequentially accessed. GSConv retains the feature extraction capability of standard convolution while leveraging the parameter-reduction advantages of DSC. The structural design of GSConv is illustrated in Figure 5.
To enhance the efficiency of algorithm inference and prediction, the input image undergoes a transformation process within the Backbone network. As the spatial dimensions of the feature map decrease, the number of channels correspondingly increases, which potentially lead to a loss of semantic information. The time complexities of SC, DSC, and GSConv are as follows:
T i m e S C O ( W × H × K 1 × K 2 × C 1 × C 2 )
T i m e D S C O ( W × H × K 1 × K 2 × 1 × C 2 )
T i m e G S C o n v O W × H × K 1 × K 2 × C 2 2 × C 1 + 1
where, W and H represent the width and height of the output feature map, respectively. K 1 × K 2 denotes the kernel size, C 1 indicates the number of channels per kernel, and C 2 represents the number of channels in the output feature map.
GSConv demonstrates significant advantages in lightweight models. By integrating the DSC layer with the Shuffle operation, it enhances the model’s nonlinear representation capability. However, if GSConv is extensively applied in the model, it may result in an excessively deep network, thereby restricting data flow and increasing inference time. Consequently, GSConv is exclusively employed in the Neck component, where the received feature maps have the highest number of channels and the smallest spatial dimensions. In this context, the feature maps have minimal redundant information and do not necessitate further compression, allowing the attention module to operate more efficiently.
Furthermore, in order to enhance the learning capacity of CNNs, and reduce computational complexity, while ensuring sufficient model accuracy, this study employs the VoVGSCSP module in the Neck section, replacing the CSP module. This modification results in an average reduction of FLOPs by 15.72%. The VoVGSCSP module integrates several concepts from DenseNet, VoVNet, and CSPNet [40]. As depicted in Figure 6, it adopts the lightweight convolution technique GSConv to replace SC and further incorporates the GSbottleneck on top of GSConv. This enhancement improves the model’s learning ability, and reduces computational complexity while maintaining sufficient accuracy.

2.2.5. EfficientPHead: A Lightweight Detection Head

YOLOv8 utilizes a decoupled head structure, which separates the classification and localization tasks to optimize the loss function and improve detection performance. However, this design introduces increased training complexity and difficulty. Furthermore, it necessitates fine-tuning a greater number of hyperparameters and training strategies to ensure the effective collaboration between the classification and localization heads. The decoupling of these tasks may also lead to an imbalance in training samples, potentially compromising the model’s ability to detect rare classes or challenging samples. Furthermore, the increased network complexity can result in slower inference speeds, particularly in resource-constrained environments.
Although the decoupled head structure enhances performance in object detection tasks, it still presents challenges and limitations. To address the dual requirements of lightweight design and detection accuracy for a tea leaf pest and disease detection model, this study reconstructs YOLOv8’s detection head by introducing a novel structure called EfficientPHead, as shown in Figure 7.
By using PConv, the model’s parameter count is reduced as only a portion of the input channels is processed, effectively lowering model complexity and mitigating the risk of overfitting. Furthermore, this approach also accelerates both the training and inference phases. Despite the reduction in computational load and parameter count, PConv maintains high detection performance. The detection head in YOLOv8 encounters performance bottlenecks when applied to large-scale datasets, such as those used for tea tree pest and disease detection, which require real-time inference. The PConv technique in EfficientPHead can address this issues, and improve the model’s flexibility and generalization capabilities.
In conclusion, EfficientPHead significantly enhances computational efficiency, reduces the parameter count, and accelerates inference speed, all while simultaneously maintaining high detection performance, making the model more suitable for a wide range of practical applications. These improvements render the model more adaptable and effective for a diverse range of practical applications.

2.2.6. TLDDM Model

To improve the detection of tea leaf pests and diseases, this study proposes an enhanced model named Tea Leaf Disease Detection Model (TLDDM). TLDDM is developed by modifying YOLOv8, as depicted in Figure 8. Specifically, the C2f module in YOLOv8’s backbone network is replaced with C2f-Faster-EMA, which reduces the number of floating-point operations during feature extraction, while simultaneously improving detection accuracy and the model’s feature extraction capabilities.
At the end of the backbone network, a deformable attention mechanism is incorporated. This mechanism dynamically selects a set of key positions referred to as sampling points based on the characteristics of the input data and learns a set of offsets that define their locations. These offsets are computed dynamically based on the input features, enabling the model to adapt to variations in the data. Utilizing these learned offsets, the model samples features at the key positions, calculates attention weights based on the sampled features, and aggregates the information accordingly. The computed attention weights are then applied to the sampled features to generate the output feature map. This mechanism allows the model to focus more effectively on critical regions within tea leaf pest and disease images, improving both processing efficiency and overall model performance.
In the feature fusion network of YOLOv8, the PAFPN module is replaced by Slimneck, a structure designed to optimize computational efficiency and model performance. Slimneck reduces the number of channels in each convolutional layer, thereby significantly decreasing the model’s parameter count without adversely affecting performance. Slimneck utilizes lightweight convolutional operations, such as DSC and pointwise convolution, to minimize computational complexity by reducing the number of multiplication operations during convolution. Moreover, Slimneck integrates techniques such as skip connections and residual modules to reduce network depth while maintaining high performance. Additionally, Slimneck incorporates efficient attention mechanisms and feature fusion modules, which not only reduce the parameter count but also decrease computational complexity. These optimizations enable that Slimneck to achieve the dual objectives of lightweight design and high accuracy for tea leaf pest and disease detection, making the model well-suited for resource-constrained environments such as mobile devices and embedded systems.
Finally, YOLOv8’s detection head is restructured through the integration of EfficientPHead, which leverages PConv to enhance computational efficiency. Unlike traditional convolution, PConv performs calculations on only a subset of the input channels, dramatically reducing computational demands. This approach not only lowers the model’s parameter count, decreases complexity, but also mitigates the risks of overfitting. Furthermore, it accelerates both the training and inference processes. Despite the reduction in computation and parameter count, PConv preserves high detection performance by effectively processing input feature maps, thus improving the model’s precision and accuracy in but also. The original detection head in YOLOv8 encounters performance bottlenecks when applied to large-scale datasets, such as those required for tea leaf pest and disease detection, which necessitate real-time inference. The Partial Convolution technique in EfficientPHead addresses these bottlenecks by enhancing the model’s adaptability and generalization capabilities. By increasing computational efficiency, reducing parameter count, and accelerating inference while maintaining robust detection performance, EfficientPHead proves highly suitable for a wide range of practical applications.

2.3. Model Evaluation

The performance of the TLDDM was assessed using a comprehensive set of evaluation metrics, including precision (P), recall (R), average precision (AP), F1 score (F1), frames per second (FPS), parameter count, floating-point operations per second (FLOPs), and model size. FLOPs and parameter count are used to measure serve as indicators of the model’s complexity and size, respectively. Precision (P) represents the ratio of true positive samples among all positive samples relative to all samples predicted as positive by the detector. Recall (R) indicates the proportion of true positive samples correctly predicted by the detector out of all actual positive samples.
However, relying solely on P and R may not provide a comprehensive evaluation of detection accuracy. Therefore, additional metrics, AP and F1, were introduced. AP represents the average precision achieved during the detection process [41], while F1 is the harmonic mean of precision and recall, offering a balanced assessment of detection performance. Higher AP and F1 values indicate the improved detection accuracy. Moreover, average detection time comprising preprocessing time, inference time, and non-maximum suppression (NMS) time, was measured. Equations (9)–(12) can be used to calculate P, R, F1, and AP.
P = T P T P + F P
R = T P T P + F N
F 1 = 2 P R P + R
AP = 0 1 P ( R ) d R
In these equations, T P represents the number of positive samples correctly predicted as positive, F N corresponds to the number of positive samples incorrectly classified as negative, and F P indicates the number of negative samples mistakenly classified as positive. Intersection over Union (IoU) measures the overlap ratio between the predicted bounding box and the ground truth bounding box. Typically, an IoU threshold of 0.5 is used. When the IoU exceeds 0.5, the sample is classified as a true positive. Conversely, if the IoU is below 0.5, the sample is considered a false positive.

3. Results

3.1. Experimental Configuration

All training and evaluation procedures in this study were conducted under consistent parameter settings. The computer system operated on Windows 11, equipped with an Intel Core i5-9300H processor (2.40 GHz), 16 GB of RAM, and a 4 GB NVIDIA GeForce GTX 1650 GPU. GPU acceleration was enabled using CUDA 11.8.0 and CUDNN 8.9.1.
During model training, SGD was selected as the optimizer, with an input image size of 640 pixels. The YOLOv8 model was implemented using the PyTorch 2.0 deep learning framework. The parameter settings are detailed in Table 2.

3.2. Ablation Experiment

To assess the efficacy of each enhanced module, we performed an ablation study using the original YOLOv5 architecture. Detailed results are presented in Table 3.
The original YOLOv8 model achieved an average precision (AP) of 97.9%. Building upon this baseline, Model1, which incorporated the C2f-Faster-EMA module, improved the AP to 98.0%. This improvement was achieved while reducing the model’s parameter count and complexity, thereby enhancing its image feature extraction capabilities. Subsequently, Model2 integrating the DAttention module, achieved a slight AP increase to 98.1%. The DAttention module addition enhanced the model’s adaptability to spatial transformations and irregular data structures. Model3 introduced the Slimneck structure, reducing the model’s size but leading to a slight decrease in accuracy, reflecting Slimneck’s focus on balancing speed optimization with performance. The TLDDM model, integrating the Faster-EMA, DAttention, and EfficientPHead modules, achieved an AP comparable to YOLOv8, with an FPS of 98.2, and a reduced model size to 4.3 MB. These results demonstrate that the integrated improvement strategy effectively maintains detection performance while significantly reducing the model’s size and enhancing processing speed.
Overall, these improvements and integrations highlight the potential to maintain a high AP while increasing FPS and reducing model size. The TLDDM model excels by achieving an optimal trade-off between performance, speed, and size, showcasing its potential for practical real-world applications.

3.3. Comparative Experiments

To further validate the efficiency of the proposed algorithm, TLDDM was compared with Faster R-CNN, SSD, and earlier versions of the YOLO series, using multiple performance metrics. As shown in Table 4, TLDDM outperformed these models across all metrics, demonstrating its superior capabilities.
As shown in Table 4, the TLDDM model achieved an AP of 98.0%, significantly surpassing Faster R-CNN and SSD models, while also demonstrating superior performance in both precision and recall. Moreover, its FPS reached 98.2, comparable to the best value among the experimental results, highlighting its advantage in real-time detection.
Figure 9 compares the detection performance of different models. The TLDDM model achieved the highest detection accuracy across various categories in the dataset.

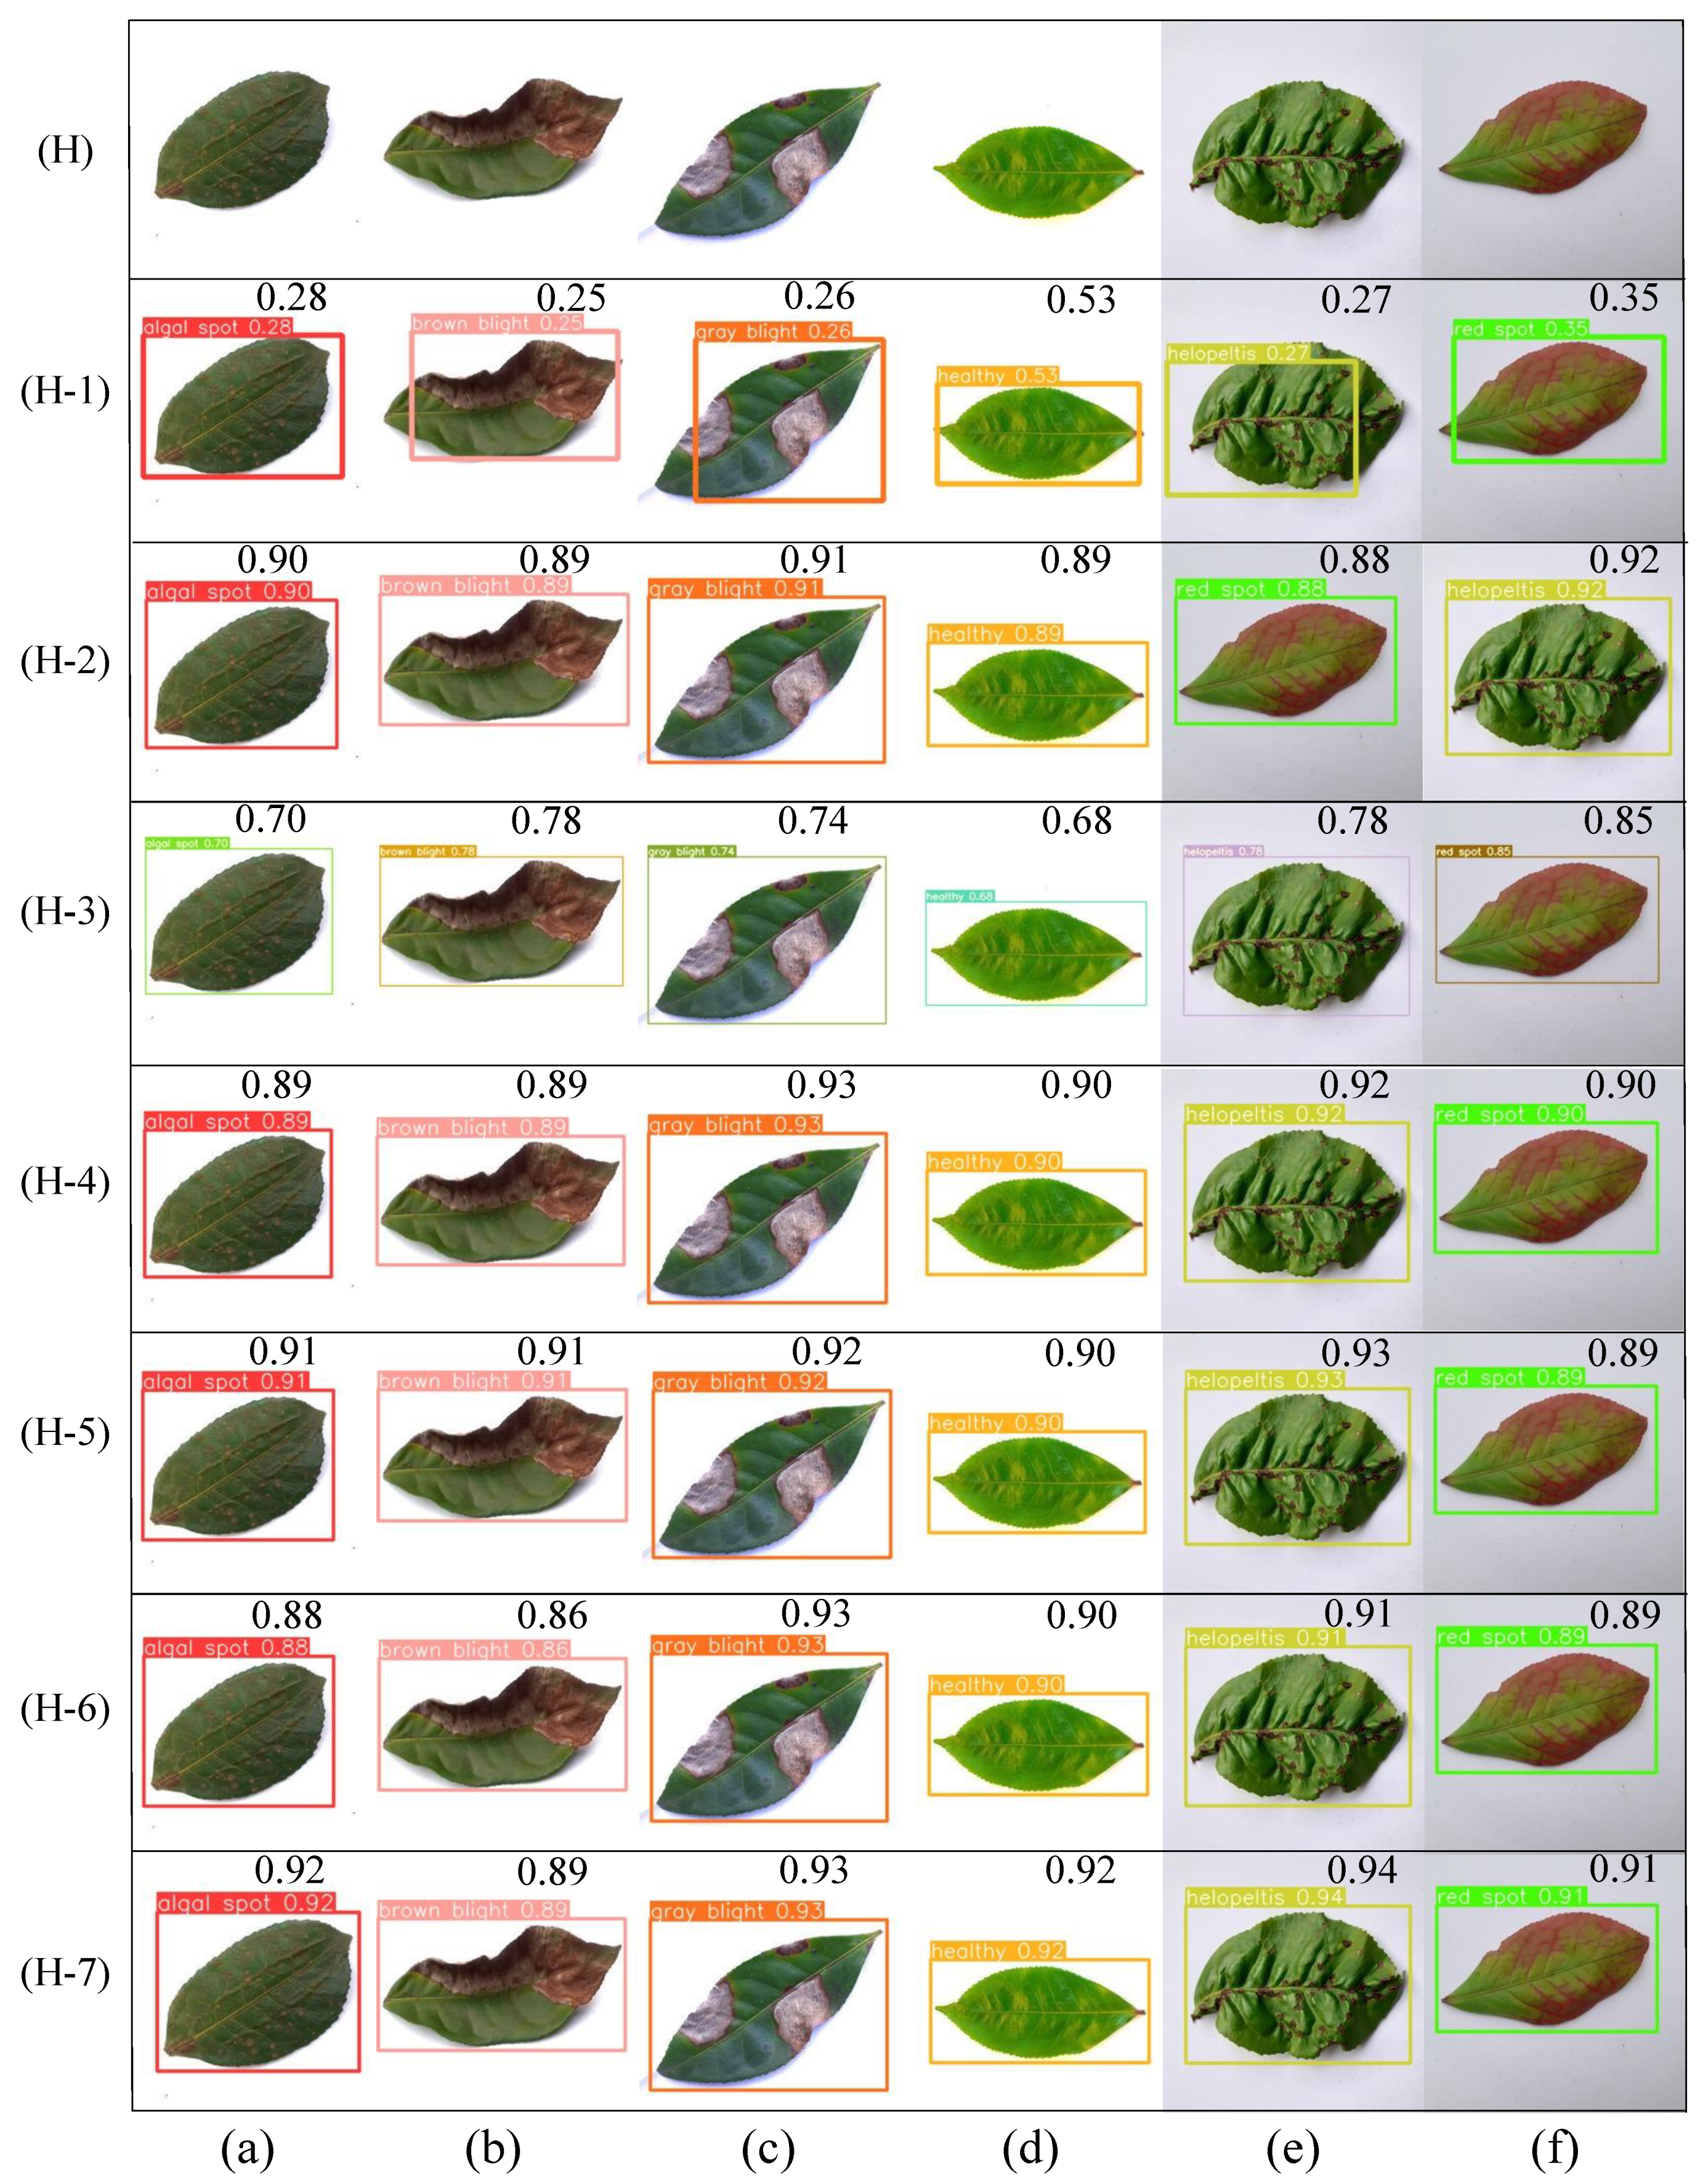
3.4. Comparison of Test Results

Precision-Recall (PR) curves and F1 curves are two critical evaluation metrics in object detection algorithms, providing detailed insights into model performance across different thresholds.
Figure 10 presents the PR curve of TLDDM, where the blue TLDDM curve completely envelops the yellow YOLOv8n curve, indicating that TLDDM’s superior performance over YOLOv8n.
The F1 curve of TLDDM and its comparison with YOLOv8n are illustrated in Figure 11. In the left chart, the overall F1 score across all categories reaches 0.98 at a confidence threshold of 0.770. The category-specific curves approach the maximum F1 score of 1.0 at different confidence thresholds, indicating that each category achieves a distinct balance between precision and recall.
The right chart shows that the TLDDM curve is wider at the top and closer to 1, representing a broader range of confidence thresholds. This suggests that the TLDDM model achieves better performance on the training dataset.
YOLOv8n and TLDDM were trained on the same dataset using identical parameter configurations. The training loss curves for both models, derived from the recorded log files, are presented in Figure 12.
Although TLDDM and YOLOv8n exhibit varying loss reduction speeds and stability across different training stages, both models ultimately converge to comparable performance levels with sufficient training.
In an effort to demonstrate the detection capabilities of the models clearly, the EigenCAM heatmap visualization method was employed. The heatmap visualization results for six different categories of tea leaves using YOLOv8n and TLDDM. As shown in Figure 13, YOLOv8n heatmaps exhibit a scattered pattern, targeting multiple areas of the tea leaves, whereas the TLDDM heatmaps are more accurate, concentrated, and consistent. The highlighted regions align closely with the diseased areas of tea leaves affected by pests and diseases. These findings demonstrate that the proposed improvement strategies significantly enhance the detection performance of the tea leaf pest and disease detection model.

4. Discussions

4.1. Key Contributions

This study primarily addresses the challenges of detecting tea leaf pests and diseases, including high similarity between different disease categories, the need for real-time performance, and the trade-off between model accuracy and complexity. First and foremost, by integrating FasterNet’s partial convolution and an efficient multi-scale attention mechanism, the model’s parameter count is reduced significantly. Secondly, the Deformable Attention Mechanism module is employed to dynamically adapt to irregular spatial structures in tea leaf images, improving the model’s ability to focus on critical regions and boosting detection accuracy. Last but not least, the lightweight Slimneck structure and partial convolution-based detection head reduced computational complexity (FLOPs decreased by 15.7%) while maintaining high inference speed (98.2 FPS).
These innovations collectively enable TLDDM to achieve state-of-the-art performance in both accuracy and efficiency, making it suitable for agricultural applications.

4.2. Comparative Analysis with Existing Methods

(1)
Comparison with Non-YOLO Algorithms
The proposed TLDDM outperformed Faster R-CNN by 20.3% in AP (98.0% vs. 77.7%) and achieved a 4.9-fold improvement in speed (98.2 FPS vs. 20 FPS) [15]. As for the improved CNN methods, named ID-CNN [12] and ADAM-CNN [42], the TLDDM exhibits a 5.5% improvement and a 14% improvement in AP, respectively.
Additionally, TLDDM showed superior precision (98.34% vs. 73.45%) and recall improvement (96.57% vs. 76.17%), while with a significantly smaller model size (4.3 MB vs. 102.7 MB) when comparing with SSD algorithm [17].
(2)
Comparison with YOLO Series Models
TLDDM, compared with YOLOv3-tiny [23], improved AP by 17.4% (98.0% vs. 80.6%) and FPS by 77.3 (98.2 vs. 20.9). Then, the proposed model reduced the parameter count by 14% (4.3 MB vs. 5.0 MB) and increased FPS by 41.5% (98.2 vs. 69.4) relative to YOLOv5n [41]. As for the original YOLOv8n [43], TLDDM maintained comparable AP (98.0% vs. 97.9%) but achieved a 19.8% higher FPS (98.2 vs. 82.0) due to optimizations in computational efficiency. What’s more, several studies in recent years are also conducted for comparison. First and foremost, the proposed TLDDM demonstrates a significantly superior performance in AP compared to YOLO-Tea [44] and TSBA-YOLO [45] (98.0% vs. 82.6%, and 98.0% vs. 85.35%, respectively), which are based on the YOLOv5 framework. When compared to the YOLO-T algorithm based on YOLO7 [46], the TLDDM mothed performs almost equally in terms of AP but excels in recall (98.34% vs. 96.4%). Then, a lightweight detection model named T-YOLO is considered [47], and TLDDM achieves an almost 14% higher average precision (AP). Finally, the improved models based on YOLOv8 framework are compared with TLDDM. Not only in AP but also in terms of precision, the TLDDM model slightly outperforms than YOLOv8-EnlightenGAN model [48] and YOLOv8-RMDA model [49].

4.3. Limitations and Future Work

This study still has some limitations and further work. Firstly, Current results are GPU-dependent, and future work will explore TensorRT acceleration and quantization for broader hardware compatibility. Secondly, the proposed TLDDM model excels in tea leaf detection, and its performance on other crops (e.g., rice, wheat) requires validation in the coming future. Lastly, a direct comparison with YOLOv10 and integration of its latest techniques (e.g., dynamic label assignment) could further enhance TLDDM’s capabilities [50].

5. Conclusions

Accurate detection and identification of tea leaf pests and diseases are of great significance for reducing tea production losses, improving tea quality, and boosting farmers’ income. However, current deep learning models still face limitations in the detection performance of tea leaf pests and diseases. To overcome these challenges, we propose TLDDM (Tea Leaf Disease Detection Model), a deep learning-based detection model with several key innovations.
TLDDM integrates C2f-Faster-EMA to reduce parameter count and complexity while enhancing image feature extraction capabilities. The addition of the DAttention module improves the model’s adaptability to spatial transformations and irregular data structures. The Slimneck structure reduces model size, and the detection head is redesigned as EfficientPHead, which maintains detection performance, improves computational efficiency, reduces parameters, and accelerates inference speed.
Experimental results demonstrate that the TLDDM model outperforms existing models on the dataset, achieving a comprehensive performance of 98.0% mAP and 98.2 FPS, with a compact model size of only 4.3 MB. By striking a well-balanced trade-off between performance, speed, and size, TLDDM provides robust support for the development of the tea industry.

Author Contributions

Data curation, J.S. and Y.Z.; methodology, J.S.; software, H.H. and X.Y.; validation, H.H. and S.L.; writing—original draft, S.L.; Literature and figures, Y.Z.; writing—review and editing, X.Y. All authors have read and agreed to the published version of the manuscript.

Funding

This research was funded by the Postgraduate Research & Practice Innovation Program of Jiangsu Province (grant number: SJCX24_0384) and the college student innovation and entrepreneurship training program of Jiangsu Province (grant number: 202410298057Z).

Data Availability Statement

The data that support the findings of this study are available from the author Jun Song (songjun@njfu.edu.cn) upon reasonable request.

Conflicts of Interest

Authors Huijie Han and Xinjian Yu were employed by the company Jiangsu JITRI Intelligent Sensing Technology Co., Ltd. The remaining authors declare that the research was conducted in the absence of any commercial or financial relationships that could be construed as a potential conflict of interest.

References

  1. Dong, Z.; Li, J.; Zhao, Y. Investigation on the types of pests and diseases in Shangluo tea trees and the distribution of major pests and diseases. J. Shanxi Agric. Univ. 2018, 38, 33–37. [Google Scholar]
  2. Bao, W.; Fan, T.; Hu, G.; Liang, D.; Li, H. Detection and identification of tea leaf diseases based on AX-RetinaNet. Sci. Rep. 2022, 12, 2183. [Google Scholar] [CrossRef] [PubMed]
  3. Bauriegel, E.; Giebel, A.; Geyer, M.; Schmidt, U.; Herppich, W. Early detection of Fusarium infection in wheat using hyper-spectral imaging. Comput. Electron. Agric. 2011, 75, 304–312. [Google Scholar] [CrossRef]
  4. Prabira, K.; Nalini, K.; Amiya, K.; Santi, K. Deep feature based rice leaf disease identification using support vector machine. Comput. Electron. Agric. 2020, 175, 105527. [Google Scholar]
  5. Behmann, J.; Steinrücken, J.; Plümer, L. Detection of early plant stress responses in hyperspectral images. ISPRS J. Photogramm. Remote Sens. 2014, 93, 98–111. [Google Scholar] [CrossRef]
  6. Xie, C.; Yang, C.; He, Y. Hyperspectral imaging for classification of healthy and gray mold diseased tomato leaves with different infection severities. Comput. Electron. Agric. 2017, 135, 154–162. [Google Scholar] [CrossRef]
  7. Zhang, S.; Wu, X.; You, Z.; Zhang, L. Leaf image based cucumber disease recognition using sparse representation classification. Comput. Electron. Agric. 2017, 134, 135–141. [Google Scholar] [CrossRef]
  8. Hossain, S.; Mou, R.; Hasan, M.; Chakraborty, S.; Razzak, M. Recognition and detection of tea leaf’s diseases using support vector machine. In Proceedings of the 2018 IEEE 14th International Colloquium on Signal Processing & Its Applications (CSPA), Penang, Malaysia, 9–10 March 2018; IEEE: Piscataway, NJ, USA, 2018. [Google Scholar]
  9. Sun, Y.; Jiang, Z.; Zhang, L.; Dong, W.; Rao, Y. SLIC_SVM based leaf diseases saliency map extraction of tea plant. Comput. Electron. Agric. 2019, 157, 102–109. [Google Scholar] [CrossRef]
  10. Yuan, W.; Lan, L.; Xu, J.; Sun, T.; Wang, X.; Wang, Q.; Hu, J.; Wang, B. Smart Agricultural Pest Detection Using I-YOLOv10-SC: An Improved Object Detection Framework. Agronomy 2025, 15, 221. [Google Scholar] [CrossRef]
  11. Hu, G.; Wu, H.; Zhang, Y.; Wan, M. A low shot learning method for tea leaf’s disease identification—Sciencedirect. Comput. Electron. Agric. 2019, 163, 104852. [Google Scholar] [CrossRef]
  12. Hu, G.; Yang, X.; Zhang, Y.; Wan, M. Identification of tea leaf diseases by using an improved deep convolutional neural network. Sustain. Comput. Inform. Syst. 2019, 24, 100353. [Google Scholar] [CrossRef]
  13. Jiang, F.; Lu, Y.; Chen, Y.; Cai, D.; Li, G. Image recognition of four rice leaf diseases based on deep learning and support vector machine. Comput. Electron. Agric. 2020, 179, 105824. [Google Scholar] [CrossRef]
  14. Jiao, L.; Zhang, F.; Liu, F.; Yang, S.; Li, L.; Feng, Z. A survey of deep learning-based object detection. IEEE Access 2019, 7, 128837–128868. [Google Scholar] [CrossRef]
  15. Ren, S.; He, K.; Girshick, R.; Sun, J. Faster R-CNN: Towards real-time object detection with region proposal networks. IEEE Trans. Pattern Anal. Mach. Intell. 2016, 39, 1137–1149. [Google Scholar] [CrossRef]
  16. Zhou, G.; Zhang, W.; Chen, A.; He, M.; Ma, X. Rapid detection of rice disease based on FCM-KM and faster R-CNN fusion. Adv. Neural Inf. Process. Syst. 2019, 7, 143190–143206. [Google Scholar] [CrossRef]
  17. Liu, W.; Anguelov, D.; Erhan, D.; Szegedy, C.; Reed, S.; Fu, C.; Berg, A. Ssd: Single shot multibox detector. In Proceedings of the Computer Vision–ECCV 2016: 14th European Conference, Amsterdam, The Netherlands, 11–14 October 2016; Part I 14: 21–37. Springer: Berlin/Heidelberg, Germany, 2016. [Google Scholar]
  18. Lin, T.; Goyal, P.; Girshick, R. Focal loss for dense object detection. In Proceedings of the IEEE International Conference on Computer Vision, Venice, Italy, 22–29 October 2017. [Google Scholar]
  19. Redmon, J.; Divvala, S.; Girshick, R. You only look once: Unified, real-time object detection. In Proceedings of the IEEE conference on computer vision and pattern recognition(CVPR), Las Vegas, NV, USA, 27–30 June 2016. [Google Scholar]
  20. Wu, D.; Lv, S.; Jiang, M.; Song, H. Using channel pruning-based YOLO v4 deep learning algorithm for the real-time and accurate detection of apple flowers in natural environments. Comput. Electron. Agric. 2020, 178, 105742. [Google Scholar] [CrossRef]
  21. Liu, G.; Nouaze, J.; Mbouembe, T. YOLO-tomato: A robust algorithm for tomato detection based on YOLOv3. Sensors 2020, 20, 2145. [Google Scholar] [CrossRef]
  22. Dang, F.; Chen, D.; Lu, Y.; Li, Z. YOLOWeeds: A novel benchmark of YOLO object detectors for multi-class weed detection in cotton production systems. Comput. Electron. Agric. 2023, 205, 107655. [Google Scholar] [CrossRef]
  23. Tian, Y.; Yang, G.; Wang, Z.; Wang, H.; Li, E.; Liang, Z. Apple detection during different growth stages in orchards using the improved YOLO-V3 model. Comput. Electron. Agric. 2019, 157, 417–426. [Google Scholar] [CrossRef]
  24. Redmon, J.; Farhadi, A. Yolov3: An incremental improvement. arXiv 2018, arXiv:1804.02767. [Google Scholar]
  25. Roy, A.M.; Bose, R.; Bhaduri, J. A fast accurate fine-grain object detection model based on YOLOv4 deep neural network. Neural. Comput. Appl. 2022, 34, 3895–3921. [Google Scholar] [CrossRef]
  26. Bochkovskiy, A.; Wang, C.; Liao, H. Yolov4: Optimal speed and accuracy of object detection. arXiv 2020, arXiv:2004.10934. [Google Scholar]
  27. Sun, C.; Huang, C.; Zhang, H. Individual tree crown segmentation and crown width extraction from a heightmap derived from aerial laser scanning data using a deep learning framework. Front. Plant Sci. 2022, 13, 914974. [Google Scholar] [CrossRef]
  28. Dai, G.; Fan, J. An industrial-grade solution for crop disease image detection tasks. Front. Plant Sci. 2022, 13, 921057. [Google Scholar] [CrossRef]
  29. Nguyen, K.; Nguyen, H.; Tran, H.; Quach, L. Combining autoencoder and YOLOv6 model for classification and disease detection in chickens. In Proceedings of the 2023 8th International Conference on Intelligent Information Technology, New York, NY, USA, 24–26 February 2023; pp. 132–138. [Google Scholar]
  30. Zhao, K.; Zhao, L.; Zhao, Y.; Deng, H. Study on lightweight model of maize seedling object detection based on YOLOv7. Appl. Sci. 2023, 13, 7731. [Google Scholar] [CrossRef]
  31. Chen, J.; Kao, S.; He, H.; Zhuo, W.; Wen, S.; Lee, C.; Chan, S. Run, don’t walk: Chasing higher FLOPS for faster neural networks. In Proceedings of the IEEE/CVF Conference on Computer Vision and Pattern Recognition, Vancouver, BC, Canada, 17–24 June 2023; IEEE: Piscataway, NJ, USA, 2023; pp. 12021–12031. [Google Scholar]
  32. Chen, J.; Ma, A.; Huang, L.; Li, H.; Zhang, H.; Huang, Y.; Zhu, T. Efficient and lightweight grape and picking point synchronous detection model based on key point detection. Comput. Electron. Agric. 2024, 217, 108612. [Google Scholar] [CrossRef]
  33. Duan, E.; Han, G.; Zhao, S.; Ma, Y.; Lv, Y.; Bai, Z. Regulation of Meat Duck Activeness through Photo period Based on Deep Learning. Animals 2023, 13, 3520. [Google Scholar] [CrossRef]
  34. Woo, S.; Park, J.; Lee, J.; Kweon, I. Cbam: Convolutional block attention module. In Proceedings of the European conference on computer vision (ECCV), Munich, Germany, 8–14 September 2018; pp. 3–19. [Google Scholar]
  35. Hu, J.; Shen, L.; Sun, G. Squeeze-and-excitation networks. In Proceedings of the IEEE Conference on Computer Vision and Pattern Recognition, Salt Lake City, UT, USA, 18–23 June 2018; IEEE: Piscataway, NJ, USA, 2018; pp. 7132–7141. [Google Scholar]
  36. Ouyang, D.; He, S.; Zhang, G.; Luo, M.; Guo, H.; Zhan, J.; Huang, Z. Efficient multi-scale attention module with cross-spatial learning. In Proceedings of the ICASSP 2023–2023 IEEE International Conference on Acoustics, Speech and Signal Processing (ICASSP), Rhodes Island, Greece, 4–10 June 2023; IEEE: Piscataway, NJ, USA, 2023; pp. 1–5. [Google Scholar]
  37. Liu, B.; Huang, X.; Sun, L.; Wei, X.; Ji, Z.; Zhang, H. MCDCNet: Multi-scale constrained deformable convolution network for apple leaf disease detection. Comput. Electron. Agric. 2024, 222, 109028. [Google Scholar] [CrossRef]
  38. Xia, Z.; Pan, X.; Song, S.; Li, L.; Huang, G. Vision transformer with deformable attention. In Proceedings of the IEEE/CVF Conference on Computer Vision and Pattern Recognition, New Orleans, LA, USA, 18–24 June 2022; pp. 4794–4803. [Google Scholar]
  39. Martinelli, F.; Matteucci, I. Partial Model Checking for the Verification and Synthesis of Secure Service Compositions. In Public Key Infrastructures, Services and Applications; EuroPKI 2013. Lecture Notes in Computer Science; Springer: Berlin/Heidelberg, Germany, 2013; Volume 8341. [Google Scholar]
  40. Li, H.; Li, J.; Wei, H.; Liu, Z.; Zhan, Z.; Ren, Q. Slim-neck by GSConv: A better design paradigm of detector architectures for autonomous vehicles. arXiv 2022, arXiv:2206.02424. [Google Scholar]
  41. Sozzi, M.; Cantalamessa, S.; Cogato, A.; Kayad, A.; Marinello, F. Automatic Bunch Detection in White Grape Varieties Using YOLOv3, YOLOv4, and YOLOv5 Deep Learning Algorithms. Agronomy 2022, 12, 319. [Google Scholar] [CrossRef]
  42. Srivastav, S.; Guleria, K.; Sharma, S. Tea Leaf Disease Detection Using Deep Learning-based Convolutional Neural Networks. In Proceedings of the 2023 IEEE World Conference on Applied Intelligence and Computing (AIC), Sonbhadra, India, 29–30 July 2023; pp. 569–574. [Google Scholar]
  43. Liu, Y.; Zeng, F.; Diao, H.; Zhu, J.; Ji, D.; Liao, X.; Zhao, Z. YOLOv8 Model for Weed Detection in Wheat Fields Based on a Visual Converter and Multi-Scale Feature Fusion. Sensors 2024, 24, 4379. [Google Scholar] [CrossRef]
  44. Xue, Z.; Xu, R.; Bai, D.; Lin, H. YOLO-Tea: A Tea Disease Detection Model Improved by YOLOv5. Forests 2023, 14, 415. [Google Scholar] [CrossRef]
  45. Lin, J.; Bai, D.; Xu, R.; Lin, H. TSBA-YOLO: An Improved Tea Diseases Detection Model Based on Attention Mechanisms and Feature Fusion. Forests 2023, 14, 619. [Google Scholar] [CrossRef]
  46. Soeb, J.A.; Jubayer, F.; Tarin, T.A.; Al Mamun, M.R.; Ruhad, F.M.; Parven, A.; Mubarak, N.M.; Karri, S.L.; Meftaul, I.M. Tea leaf disease detection and identification based on YOLOv7 (YOLO-T). Sci. Rep. 2023, 13, 6078. [Google Scholar] [CrossRef] [PubMed]
  47. Bai, B.; Wang, J.; Li, J.; Yu, L.; Wen, J.; Han, Y. T-YOLO: A lightweight and efficient detection model for nutrient buds in complex tea-plantation environments. J. Sci. Food Agric. 2024, 104, 5698–5711. [Google Scholar] [CrossRef]
  48. Ye, R.; Shao, G.; Yang, Z.; Sun, Y.; Gao, Q.; Li, T. Detection Model of Tea Disease Severity under Low Light Intensity Based on YOLOv8 and EnlightenGAN. Plants 2024, 13, 1377. [Google Scholar] [CrossRef]
  49. Ye, R.; Shao, G.; He, Y.; Gao, Q.; Li, T. YOLOv8-RMDA: Lightweight YOLOv8 Network for Early Detection of Small Target Diseases in Tea. Sensors 2024, 24, 2896. [Google Scholar] [CrossRef]
  50. Wang, A.; Chen, H.; Liu, L.; Chen, K.; Lin, Z.; Han, J. Yolov10: Real-time end-to-end object detection. Adv. Neural Inf. Process. Syst. 2024, 37, 107984–108011. [Google Scholar]
Figure 1. Some representative samples of Tea leaf disease. (a) algalspot; (b) brownblight; (c) grayblight; (d) healthy; (e) helopeltis; (f) redspot.
Agronomy 15 00727 g001
Figure 2. Schematic of structure of Yolov8.
Agronomy 15 00727 g002
Figure 3. Details of schematic of C2f-Faster-EMA module (The Asterisk stands for convolution).
Agronomy 15 00727 g003
Figure 4. Details of schematic of Deformable attention module.
Agronomy 15 00727 g004
Figure 5. Details of schematic of GSConv module.
Agronomy 15 00727 g005
Figure 6. Details of schematic of VoVGSCSP module.
Agronomy 15 00727 g006
Figure 7. Details of schematic of EfficientPHead module.
Agronomy 15 00727 g007
Figure 8. Schematic of structure of the proposed TLDDM network.
Agronomy 15 00727 g008
Figure 9. Comparison of detection results of different models. (a) algalspot; (b) brownblight; (c) grayblight; (d) healthy; (e) helopeltis; (f) redspot. (H) original; (H-1) Detection results of Faster-RCNN; (H-2) Detection results of SSD; (H-3) Detection results of YOLOv3tiny; (H-4) Detection results of YOLOv5n; (H-5) Detection results of YOLOv7tiny; (H-6) Detection results of YOLOv8n; (H-7) Detection results of TLDDM.
Agronomy 15 00727 g009
Figure 10. The precision-recall curves of the experimental results.
Agronomy 15 00727 g010
Figure 11. The F1 curves of the experimental results.
Agronomy 15 00727 g011
Figure 12. The training loss curves of the experimental results.
Agronomy 15 00727 g012
Figure 13. Illustration of heat map visualization results. (a) algalspot; (b) brownblight; (c) grayblight; (d) healthy; (e) helopeltis; (f) redspot. (X) Experimental results of YOLOv8n; (Y) Experimental results of TLDDM.
Agronomy 15 00727 g013
Table 1. Table of dataset partitioning result.
TrainValTest
algal spot681109210
brown blight61281174
gray blight71492194
healthy693104203
helopeltis71895187
redspot688106206
Table 2. Table of parameters set in this study.
Training ParametersValue
Momentu0.937
Weight_decay0.0005
Batch_size16
Learning_rate0.01
Epochs101
Table 3. Table of results from ablation experiments.
ModelC2f-Faster-EMADAttentionSlimneckEfficient
PHead
AP (%)FpsF1Size (MB)
YOLOv8n 97.982.00.876.3
Model1 98.064.10.975.5
Model2 98.169.50.986.0
Model3 97.877.50.985.6
TLDDM98.098.20.984.3
Table 4. Table of results from comparison experiments.
ModelWeight/MBAP/%fpsPrecision/%Recall/%
Faster R-CNN111.577.682075.3479.21
SSD102.773.964473.4576.17
YOLOv3tiny17.080.620.968.678.4
YOLOv5n5.098.069.498.8296.89
YOLOv7tiny [30]11.797.188.390.6994.16
YOLOv8n6.097.98298.396.8
TLDDM4.398.098.298.3496.57
Disclaimer/Publisher’s Note: The statements, opinions and data contained in all publications are solely those of the individual author(s) and contributor(s) and not of MDPI and/or the editor(s). MDPI and/or the editor(s) disclaim responsibility for any injury to people or property resulting from any ideas, methods, instructions or products referred to in the content.

