Article

Sticky Trap-Embedded Machine Vision for Tea Pest Monitoring: A Cross-Domain Transfer Learning Framework Addressing Few-Shot Small Target Detection

1
College of Information Engineering, Sichuan Agricultural University, Ya’an 625000, China
2
Computer Science and Technology, Henan Institute of Science and Technology, Xinxiang 453700, China
3
Ya’an Guangju Agricultural Development Co., Ltd., Ya’an 625100, China
*
Author to whom correspondence should be addressed.
These authors contributed equally to this work.
Agronomy 2025, 15(3), 693; https://doi.org/10.3390/agronomy15030693
Submission received: 24 February 2025 / Revised: 6 March 2025 / Accepted: 11 March 2025 / Published: 13 March 2025

Abstract

:
Pest infestations have always been a major factor affecting tea production. Real-time detection of tea pests using machine vision is a mainstream method in modern agricultural pest control. Currently, there is a notable absence of machine vision devices capable of real-time monitoring for small-sized tea pests in the market, and the scarcity of open-source datasets available for tea pest detection remains a critical limitation. This manuscript proposes a YOLOv8-FasterTea pest detection algorithm based on cross-domain transfer learning, which was successfully deployed in a novel tea pest monitoring device. The proposed method leverages transfer learning from the natural language character domain to the tea pest detection domain, termed cross-domain transfer learning, which is based on the complex and small characteristics shared by natural language characters and tea pests. With sufficient samples in the language character domain, transfer learning can effectively enhance the tiny and complex feature extraction capabilities of deep networks in the pest domain and mitigate the few-shot learning problem in tea pest detection. The information and texture features of small tea pests are more likely to be lost with the layers of a neural network becoming deep. Therefore, the proposed method, YOLOv8-FasterTea, removes the P5 layer and adds a P2 small target detection layer based on the YOLOv8 model. Additionally, the original C2f module is replaced with lighter convolutional modules to reduce the loss of information about small target pests. Finally, this manuscript successfully applies the algorithm to outdoor pest monitoring equipment. Experimental results demonstrate that, on a small sample yellow board pest dataset, the mAP@.5 value of the model increased by approximately 6%, on average, after transfer learning. The YOLOv8-FasterTea model improved the mAP@.5 value by 3.7%, while the model size was reduced by 46.6%.

1. Introduction

Tea is one of the world’s most popular beverages [1,2]. The tea cultivation industry has been affected by pests. The main pests in tea plantations are tiny pests such as Empoasca pirisuga (Matumura), Halyomorpha halys (Stål), Apolygus lucorum (Meyer-Dür), etc. [3,4]. These pests are predominantly distributed in East Asia and exhibit a broad host range, primarily affecting tea plants, fruit trees, and vegetable crops. Their damage mechanism involves sap feeding on leaves, leading to chlorosis, curling, and wilting of foliage, ultimately resulting in corresponding reductions in tea yield [5,6]. Therefore, employing safe and effective methods to monitor the occurrence of tea pests has become an important issue in tea production. Traditional monitoring methods for tea plant pests, such as manual inspection and light traps, have their respective limitations. Manual inspection not only proves resource-intensive but also faces challenges in accurately identifying pest infestations [7,8]. Light traps are constrained by high costs and complex installation requirements [9,10]. In light of this, the present study selected the cost-effective yellow sticky trap method as the primary monitoring approach. In the meantime, the rapid development of deep learning and machine vision technology has greatly improved the efficiency of pest monitoring. The main machine vision observation of insect pests is based on the mode of a camera with deep learning detection algorithms, i.e., through the field deployment of observation equipment, including a camera, to capture images of the insides of insect traps, followed by the use a deep learning model to count and recognizing insects in the images [11,12,13]. These approaches been successfully applied for pest detection in many crops, such as corn, rice, and soybean [14,15,16]. Hence, a machine vision-based deep learning algorithm is an tea pest detection approach with future development potential.
The performance of deep learning algorithms is highly dependent on the quality of training data [17,18]. However, the collection and annotation of tea pest data are costly, and publicly available datasets for yellow sticky traps are scarce, which severely limits the generalization capability and performance of models. Currently, solutions to address data insufficiency in pest detection primarily fall into two categories: generative methods and transfer learning methods. Generative methods primarily utilize techniques such as Generative Adversarial Networks (GANs) and Variational Autoencoders (VAEs) to increase the diversity and volume of the dataset, thereby enhancing the model’s generalization ability and performance [19,20]. Those methods have been successfully applied in other pest detection studies [21,22]. The premise of the generative model’s capability is the need for a large amount of training data, which is contradictory to the few-shot learning problem. Therefore, this manuscript utilizes transfer learning to tackle the challenge of insufficient tea pest datasets. Transfer learning applies the effective features learned from a source domain to a target domain, significantly improving the model’s performance on new tasks [23,24]. This approach leverages rich feature information from the source domain to help the model in better extract features relevant to the target domain, especially in cases where the target domain has limited samples [25,26]. Transfer learning is gradually being used to solve some agricultural pest detection issues, such as researchers transferring pre-trained classification models from large datasets like ImageNet for the identification and prediction of major pests in agricultural crops like tomatoes and hemp [27,28]. The rise of cross-domain transfer learning has shattered the traditional constraint that there must be a direct logical link between the source domain and target domain [29,30] by offering a novel perspective. Cross-domain transfer learning is capable of managing knowledge transfer across domains with varying data types or feature representations, thereby enhancing task performance in the target domain, even when facing data scarcity. Tiny tea pests in the image resemble characters scattered across a yellow sheet of paper, exhibiting a high degree of similarity relative to textual characters in terms of feature representation, despite belonging to a different domain. This manuscript leverages the character domain in natural language as the source domain and tea pests in images as the target domain to implement cross-domain transfer learning. Since images of characters can be generated in large quantities, they provide an ample sample size to enhance the neural network’s ability to extract features of small targets. Consequently, transferring knowledge from the textual character domain to the tea pest domain not only improves the performance of tea pest detection but also mitigates the challenge of insufficient data in the tea pest dataset.
The small size of primary tea pests inevitably presents a challenge for small target detection in detection tasks. The current approaches to addressing small target recognition typically involve feature fusion, multi-scale feature extraction, and the incorporation of attention mechanisms [31,32]. From the perspective of feature extraction, in this study, through experimental exploration, we discovered that small target pests lose substantial information in deep convolutional network layers, leading to missed detections. The primary reason is that deep convolution acts as a band-pass filter, making it prone to filter out the information of small target tea pests during transmission [33,34]. This manuscript proposes a novel tea pest detection neural network called YOLOv8-FasterTea. Experimental results demonstrate that, on a small sample yellow board pest dataset, the mAP@.5 value of the model increased by approximately 6%, on average, after transfer learning. The YOLOv8-FasterTea model improved the mAP@.5 value by 3.7%, while the model size was reduced by 46.6%.
In summary, the research objectives of this paper focus on addressing three major challenges in tea pest monitoring: the lack of high-precision observation equipment, the scarcity of data samples, and the low accuracy of models in identifying small target pests. The main innovations and contributions of this research are outlined as follows:
  • This manuscript presents the design and implementation of a specialized intelligent device for tea pest detection that is capable of self-powered operation and real-time monitoring of tea pests. The device supports continuous pest biomass monitoring in remote and harsh outdoor tea plantation environments. Furthermore, a high-quality yellow board pest dataset, TeaPests, is constructed using this device.
  • The manuscript employs cross-domain transfer learning using script-generated natural language text images for pre-training of the model, effectively addressing the issue of a limited sample size in the target domain (tea pest identification).
  • This manuscript introduces a novel network architecture named YOLOv8-FasterTea. It is designed to reduce the depth of the network and minimize the loss of features for small target tea leaf pests, thereby enhancing the accuracy of pest identification. Compared to the traditional YOLOv8 model, this model demonstrates significant advantages in terms of higher precision and a more compact size in practical detection tasks.
  • This manuscript pledges to openly share the algorithm’s code and dataset to foster academic exchange. The resources can be accessed through the following link: https://github.com/lycode1202/YOLOv8-FasterTea (accessed on 1 March 2025).

2. Materials and Methods

Tea pests pose unique computational challenges in terms of their detection due to their small size and ease of concealment, as well as the limited availability of annotated datasets. Conventional machine vision methods often struggle to localize and classify such small targets, especially in cluttered field conditions where rain, dust, light variations, and background interference can further degrade performance. To alleviate these problems, this study proposes a new multi-scale feature fusion framework that enhances the model’s ability to discriminate subtle pest features in a spatial hierarchy. Also, to address the problem of data scarcity, domain-adaptive data augmentation and cross-domain transfer learning strategies are integrated to achieve robust generalization, even with limited training samples. These approaches are complemented by hardware optimizations for field-deployed pest observation systems to ensure efficient data collection and power management in real-world agricultural environments. The specific technology roadmap is shown in Figure 1.

2.1. Tea Tree Pest Monitoring System

A detailed description of the system architecture is provided in Figure 2. In line with an environmentally friendly and energy-saving design philosophy, the system ingeniously employs solar panels in conjunction with voltage conversion modules to ensure hardware safety while achieving energy self-sufficiency. A Raspberry Pi 4B serves as the core for data processing, connected to the Internet via a 5G IoT card, ensuring the regular upload of monitoring data and providing robust data support for subsequent analysis and model training. Additionally, the system places special emphasis on the lightweight design of the model, facilitating its deployment directly on data collection nodes in later stages. Specific details about the system’s implementation are discussed in depth in subsequent sections.

2.1.1. Device Design and Realization

The tea tree pest monitoring device is composed of the following core components: a Raspberry Pi 4B mini-computer that serves as the brain of the system, responsible for data processing and coordination; a color, high-definition, industrial USB camera with a resolution of up to 12 million pixels, used to capture images of pests in the tea plantation; an efficient energy system composed of a 120 W solar panel and a 240 AH battery, ensuring the device’s continuous operation in outdoor environments; a precise power voltage regulation module, ensuring stable power supply under different voltage conditions; and a 5G outdoor network module for high-speed and stable data transmission. All components of the system are installed on a sturdy pole and horizontal steel arm structure to adapt to the challenges of the outdoor environment and ensure the stable long-term operation of the monitoring device. The mechanical design of the equipment is detailed in Figure 3a.
As shown in the physical display of Figure 3b, the tea tree pest monitoring device is installed on a 3-meter-high pole, with a sleeve in the middle of the pole to support the horizontal arm for installation of the monitoring camera and the pest observation steel plate. The high-definition camera is placed 50 cm away from the pest observation board. To enhance the tidiness of the wiring layout and the flexibility of the equipment’s operation, outlets are included at the bottom and sides, as well as universal joints mounted on each horizontal arm. In addition, the device is secured by a solid steel ground cage and a thick flange to ensure stability, ensuring that the device can operate safely and stably, even in adverse weather conditions. All key control devices, including the Raspberry Pi 4B and the power voltage regulation module, are safely enclosed in a stainless-steel distribution box on the pole, achieving good electromagnetic isolation and protection.

2.1.2. System Deployment

The tea pest monitoring system was deployed in a tea plantation located in a province in southwest China. The monitoring devices were meticulously placed at several key geographical locations within the tea plantation for continuous data collection around the clock. A total of three monitoring devices were deployed, with each device responsible for monitoring an area of approximately 20 square meters. The installation sites of the devices were selected based on the professional advice of tea experts, as these locations are hotspot areas where pests are more concentrated due to their living habits. This monitoring system was in continuous operation from 8 November 2023 to 8 July 2024, providing valuable long-term monitoring data for the research project over a period of 244 days.

2.2. Data Processing and Dataset Production

This manuscript is dedicated to collecting data related to tea plantation pests, spanning from November 2023 to April 2024. To efficiently gather data, the equipment utilizes an industrial USB camera with a resolution as high as 12 million pixels, equipped with a high-quality 5-megapixel lens free of distortion to capture clear images of pests. The camera is positioned at an optimal distance of 50 cm from the yellow sticky insect trap and takes continuous scheduled shots from 8 a.m. to 6 p.m. daily, ensuring the continuity and completeness of data collection.
Utilizing the 5G network, the tea pest monitoring devices achieved a stable network connection, allowing the Raspberry Pi 4B to smoothly upload the captured images to the image-bed server. Subsequently, researchers performed a series of data enhancement processes on the images, including rotation, cropping, and brightening, to further improve the quality of the dataset. After rigorous selection, a high-quality yellow board pest dataset was constructed, named TeaPests. The TeaPests has a total of 974 images. To enable the detection model to more accurately identify pests, researchers carried out meticulous annotation work on the dataset. The labels of the yellow board pest dataset were saved in TXT format; then, the dataset was divided into training, validation, and test sets in a ratio of 7:2:1. The specific details of the dataset are shown in Table 1.
This manuscript also constructs a large-scale source-domain dataset for transfer learning, specifically a dataset of natural characters. Initially, a large number of natural language characters were generated using a Python script file, which were then compiled into a document file named “Words.doc”. Subsequently, a coding tool was utilized to convert each page of the document into a .jpg format image, culminating in the creation of the Words dataset.
The characters dataset encompasses a rich variety of natural language characters, including traditional punctuation marks, English letters, and diverse Chinese characters. Visual attributes such as the font size, thickness, and color of the characters in the images were assigned randomly, allowing the complex features of natural language characters to enhance the recognition accuracy of the small sample dataset of small target insects in the tea plantation. For instance, large characters like Chinese and English characters in the Words dataset can correspond to flies (Muscidae) and bees (Apidae) in the tea plantation, while small punctuation marks like commas and periods can correspond to mosquitoes (Culicidae) and whiteflies (Aleyrodidae). Through the use of this carefully designed dataset, the aim was to train a robust model capable of adapting to various complex scenarios, thereby addressing challenges such as small size, low contrast, and dull color of the objects to be detected in the source target. A total of 752 images of natural language characters were selected for training; a specific dataset effect comparison is shown in Figure 4.

2.3. Cross-Domain Transfer Learning

Transfer learning involves learning common features between the source and target domains to achieve effective model transfer from the source to the target domain. To address this challenge, we used Python scripts to generate a series of simulated images that include a large number of punctuation marks, numbers, and characters, with backgrounds designed to mimic the yellow sticky boards used in tea plantations to attract flying insects. To more realistically simulate the representational characteristics of pests in tea plantations, we specifically designed the natural language characters generated in the images to vary in size, color, and font thickness, making the visual features of the natural language characters in the images similar to the tea pest targets in the tea plantation. Both possess the characteristics of being small, complex, and irregularly distributed, allowing the model pre-trained on character data to achieve more accurate detection in small sample pest dataset. At the same time, the natural language character dataset can greatly reduce the annotation cost through the use of automatic labeling technology; even creating a large-scale image dataset can be easily achieved with low resource consumption and time cost. This automated processing method not only reduces reliance on manual labor but also greatly shortens the data preparation cycle, providing strong support for the rapid construction and iteration of models.
We first trained the neural network using the character data generated by the aforementioned methods, then adjusted the neural network parameters for the actual insect dataset. The detailed process is shown in Figure 4.

2.4. Deep Learning-Based Algorithm for Tea Pest Detection

2.4.1. YOLOv8

The YOLOv8 algorithm is the latest in a series of object detection models based on YOLO from Ultralytics, offering a new state-of-the-art (SOTA) model for tasks such as object detection, instance segmentation, and image classification [35,36]. The backbone incorporates the ELAN concept from YOLOv7 and replaces the C3 structure with the more gradient-rich C2f structure [37]. For the neck, it introduces the PAN-FPN structure, effectively addressing the issue of position information that may be overlooked by traditional FPNs [38]. The head part is changed to the currently mainstream decoupled head structure, separating the classification and detection heads, making the model more versatile and adaptable. As a result, the algorithm can adjust the number of channels for different scale models, greatly reducing the number of parameters and computational load and significantly improving model performance. This makes it highly suitable for the detection requirements of tea pests; hence, we chose YOLOv8 as the base model.

2.4.2. YOLOv8-FasterTea

To enhance the detection accuracy of small flying insect targets in images and ensure the model’s lightweight nature, this paper proposes an improved model specifically for tea tree pest detection based on the YOLOv8 network, named YOLOv8-FasterTea. This model makes targeted adjustments and optimizations based on the YOLOv8 algorithm to more effectively identify and locate pest positions. The specific structure of the model is detailed in Figure 5. It not only improves detection accuracy but also significantly reduces the model’s size, providing a more accurate and lightweight solution for the monitoring and control of tea tree pests.
Figure 5 shows a comparison of network structure diagrams. In Figure 5, it can be seen that YOLOv8-FasterTea replaces the original C2f module of the YOLOv8 network with a more lightweight Faster Block (FBlock) module. The traditional C2f structure increases the computational complexity and the number of parameters by connecting multiple bottlenecks in series, adding more skip connections, eliminating convolutional operations in the branches, and introducing additional split operations, which enriches the extraction of feature information. However, this structure has certain limitations in extracting features of small targets. To address this issue, this paper partially replaces this module with the FBlock module. A detailed introduction to the specific module is provided in later sections.
Considering the actual application scenario of pest detection in tea plantations, we chose to add a P2 small target layer while removing the original P5 detection layer in YOLOv8. This targeted improvement strategy not only optimizes the model’s resource allocation but also significantly enhances the accuracy and efficiency of small target flying insect detection. With the P2 small target layer, the model can more keenly capture subtle signs of pests in the tea plantation, which is crucial for early detection and prevention of pests. At the same time, removing the P5 detection layer not only simplifies the network structure but also reduces the model’s computational load, making the model faster in operation while maintaining high precision, making it more suitable for deployment in resource-constrained field environments. Such optimization makes the model more flexible and efficient in practical applications and capable of quickly responding to the needs of tea plantation pest detection.

2.4.3. Image Feature Extraction Module

Partial Convolution (PConv) is a novel operator that, compared to traditional operators, can reduce redundant computations and memory access, thereby more efficiently extracting spatial features [39]. As a feature extraction module, PConv only applies regular convolution to a subset of the input channels for spatial feature extraction while keeping the remaining channels unchanged. The specific structure is shown in Figure 6a. With this design, PConv has lower latency and fewer memory accesses than traditional convolution, with the specific computational formulas shown in Equations (1) and (2).
FLOPs PConv = h × w × k 2 × c p 2 ,
MAC PConv = h × w × ( 2 c p + k 2 × c p 2 ) h × w × 2 c p ,
The FasterNet block, based on the partial convolution (PConv), was further designed to include two Pointwise Convolution (PWConv) layers following the PConv layer, with normalization and activation layers placed only after the intermediate layer to ensure the diversity of extracted features and lower latency. The specific structure of PWConv is shown in Figure 6b.

2.4.4. Small-Target Deep Features

We explored the feature extraction process for small target objects using the YOLOv8 network. The following section analyzes and demonstrates the process of extracting deep features of small targets under YOLOv8. Figure 7b illustrates the main process of the YOLOv8 network for feature extraction of small target objects. By carefully analyzing the feature maps generated in these steps, we were able to investigate the feature loss that occurs during the feature extraction process for small target objects. The research on the detection process is mainly divided into two parts: observation of specific stages of the backbone section and selective observation of certain stages of the neck section. A visualization of the feature map detection results is presented in Figure 7.
Figure 7a presents the complete process of feature extraction from simulated images. In this case, layers L2–L9 are used as the basic feature layers of YOLOv8, and operations such as up-sampling or addition are performed after L9. The deep features of L2–L9 directly affect the final detection results. This manuscript focuses on the deep features of L2–L9. By observing the changes in the features of these layers, one can sense how the target information in the image is gradually captured and processed by the model. We generated target points of different sizes in images with dimensions of 640 × 640 pixels. Then, these images were input into the model to observe the differences in the feature extraction process for targets of different scales. Through this analysis, the aim was to explore at which stages the neural network’s ability to extract target features is weak so as to improve the model in a targeted manner and enhance its overall performance.
By observing Figure 7b,c, it can be found that during feature extraction in the backbone stage of the neural network, as the number of convolutional neural network layers increases, the size of the feature maps gradually decreases, while their receptive field correspondingly expands. In this experiment, the small target information underwent high-level semantic information extraction in the backbone stage. Although some detailed information was not fully captured, there was no large-scale information loss overall. In light of this finding, we chose to retain the overall structure of the backbone part in our subsequent improvement work, making only a few modifications to ensure that the key feature information of small targets was effectively utilized and properly protected. In contrast, by examining the changes in feature maps during the feature extraction process in the neck part of the neural network, we found that the small target information suffered more severe information loss during the down-sampling process in the PAN-FPN stage. The phenomenon of information deficiency continued to intensify in the subsequent transmission process of the feature maps, ultimately affecting the model’s detection head’s ability to identify and locate small targets.
To more accurately evaluate the model’s perceptual ability for target features at different stages, this manuscript introduces a quantitative metric—the energy cluster ratio. This concept aims to measure the changes in the target’s attention in the image through the application a quantitative scientific method. We selected a 55 × 55 pixel area at the center of the feature map, calculated the energy value in that area, and compared it with the energy value of the remaining area of the entire feature map. The process of energy calculation involves summing the image matrix in a specific area, as shown in Equations (3) and (4).
Energy Ratio = Energy ( Central area ) Energy ( Residual area ) ,
Energy = i = 1 h j = 1 w k = 1 3 C i j k .
By calculating the ratio between these two parts, we can quantitatively assess the model’s focus on the targets in the image, providing a strong reference for subsequent model optimization, as shown in Figure 8.
Throughout the entire process of model feature extraction, the initial energy ratio of the target points remained at a relatively stable level. However, as the number of model layers increased, the energy ratio of these target points began to significantly decrease at Layer 4. At the same time, the energy ratio of larger-sized target points was consistently higher than that of smaller-sized target points throughout the process. This phenomenon reveals that when the model processes targets of different sizes, the smaller the target, the more obvious the information loss. To improve this situation, we considered removing the original P4 and P5 layers of the model and adding a P2 layer that enhances the fusion of small target information, thereby increasing the model’s sensitivity to these subtle features.
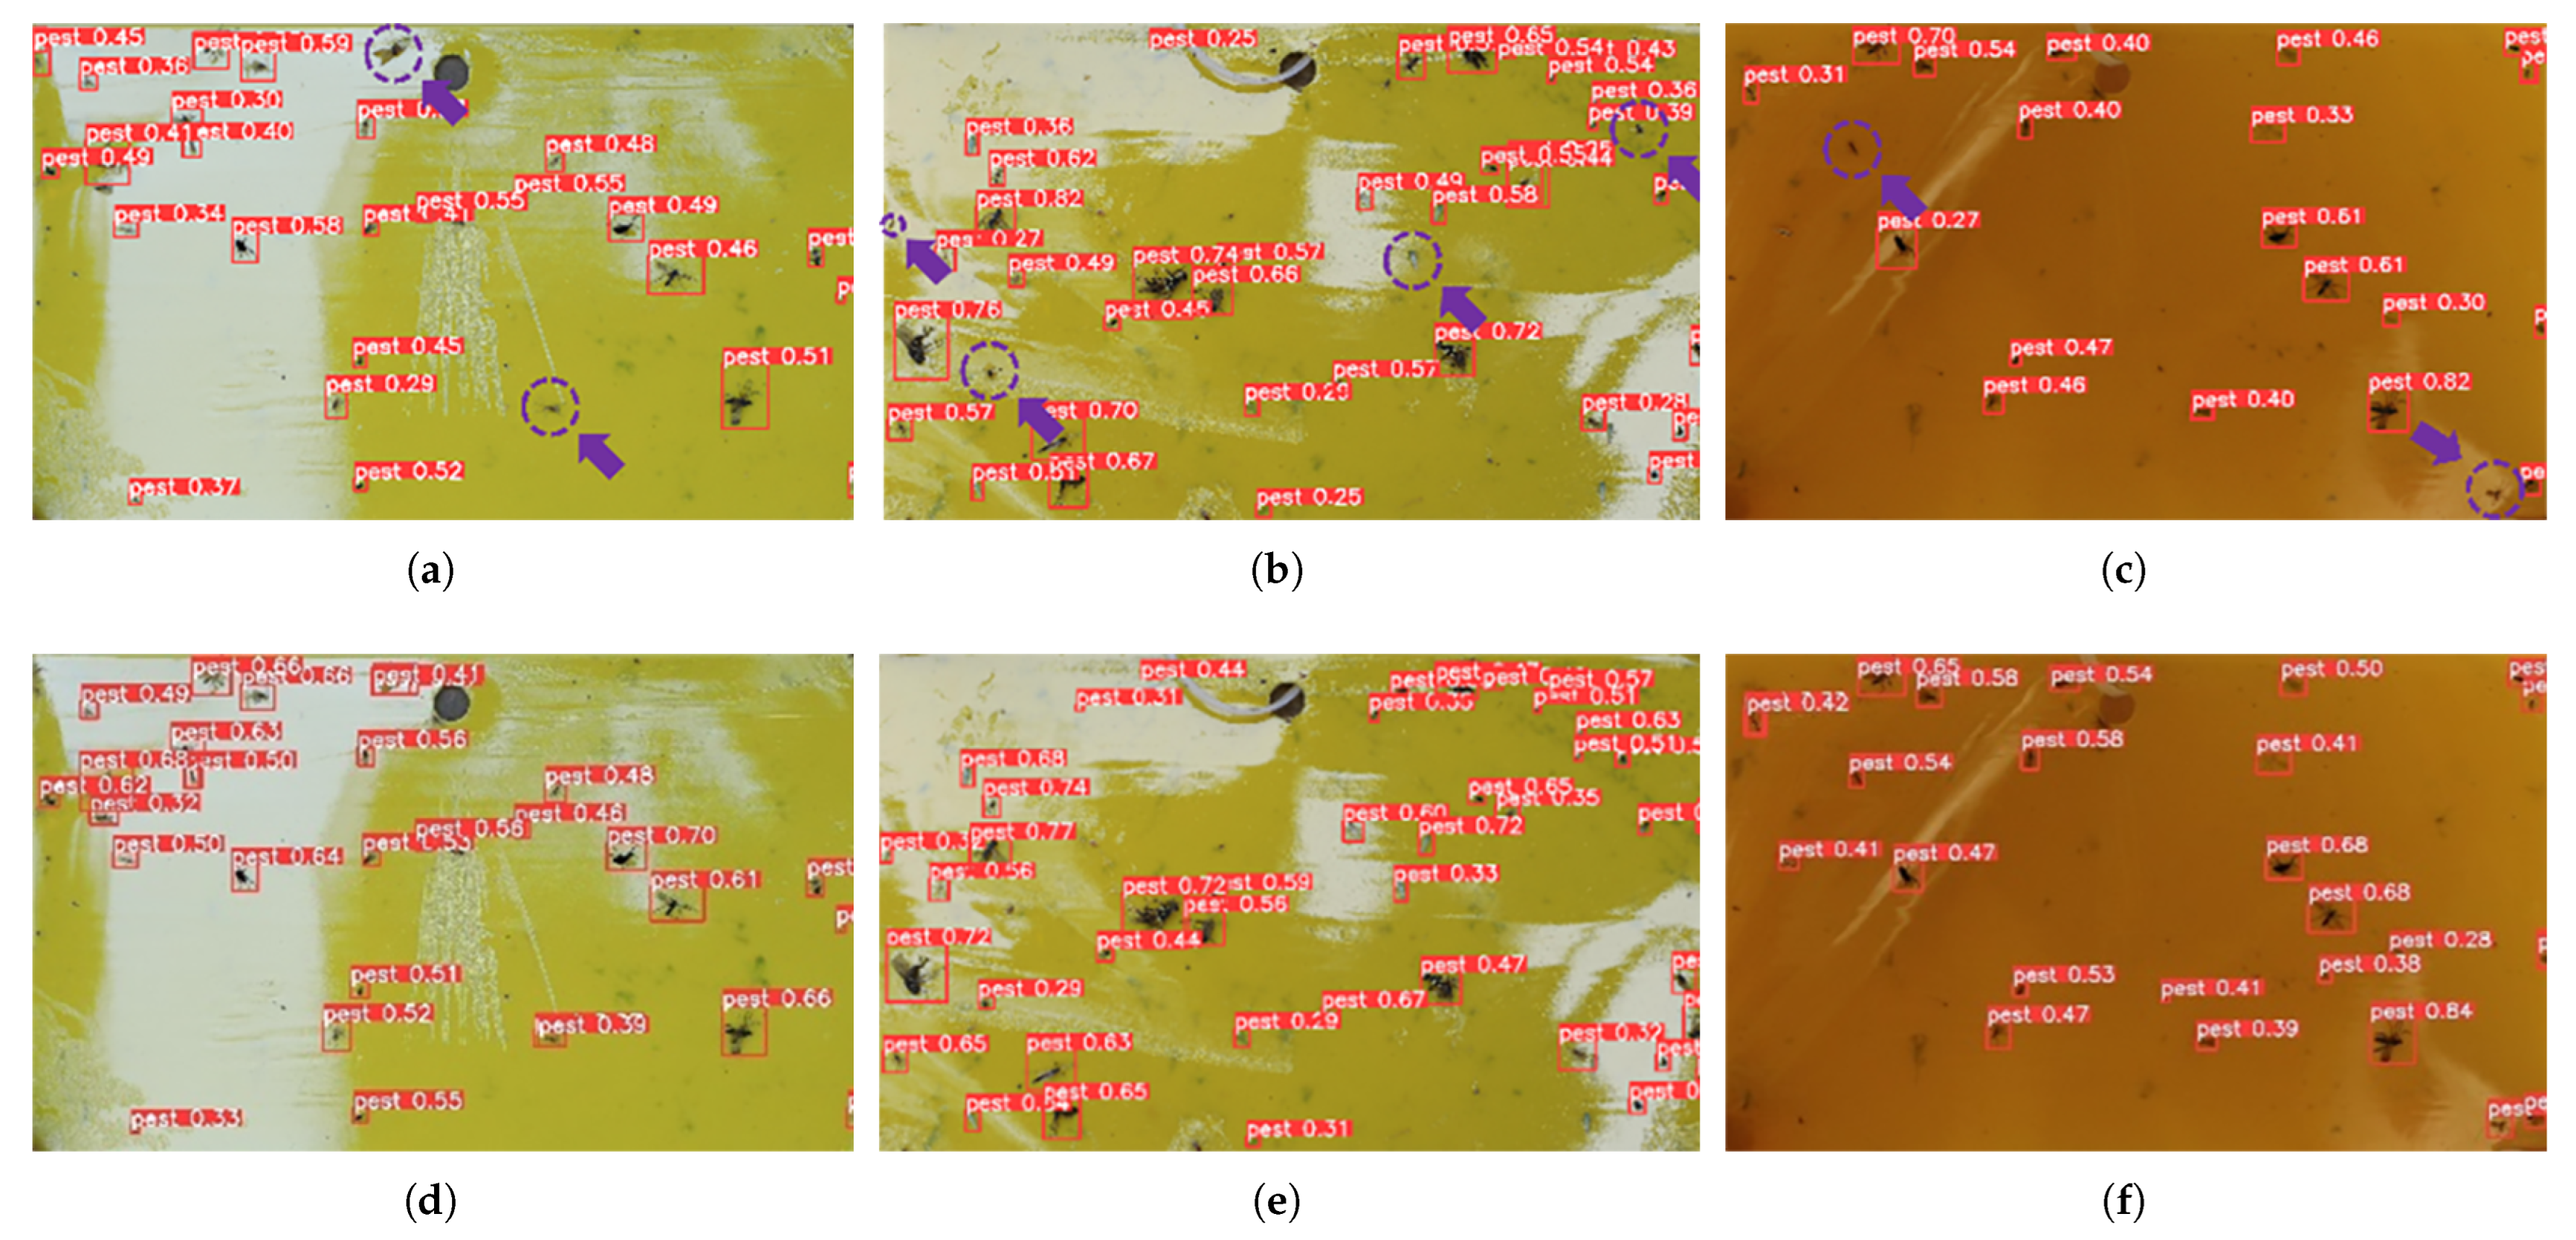
To further explore how transfer learning optimized the model’s detection process and the main reasons for the improvement in accuracy, we employed a heatmap visualization method. Heatmap visualization allows observers to quickly grasp the hot and cold spots in the dataset through changes in color intensity. The HiResCAM method [40] was used for heatmap visualization of the detection images, with the accuracy threshold set at 0.5. These methods aim to deeply understand changes in the internal mechanism within the model and how these changes lead to significant performance improvements. The specific visualization results are shown in Figure 9.

3. Results

3.1. Configuration of Experimental Base Environment

The GPU used for the experiment is an RTX 4060 Ti with 16 GB of video memory, and the CPU is a 6-core, 12-thread 12th Gen Intel(R) Core(TM) i5-12400F operating at 4.40 GHz with 32 GB of RAM. The operating system is Windows 10, and the development environment is Python 3.8, using the PyTorch 2.1.0 deep learning framework to build the model with CUDA version 12.2 and CUDNN version 8.2.0. The specific experimental parameter settings are shown in Table 2.

3.2. Validation of Transfer Learning Effectiveness

3.2.1. Model Comparison

To verify the performance of the base model on a small target dataset, this section compares several object detection models, such as RT-DETR, YOLOv5, and YOLOv7. First, 30% of the TeaPests dataset was selected to form a new small sample dataset, which was then randomly divided into three datasets named Pests-100, Pests-200, and Pests-300 with 100, 200, and 300 pest images, respectively. At the same time, 100 new images were selected to construct the test set. We chose the Pests-100 dataset to verify the basic performance of the model on small-sample and small-target tasks, with the dataset being allocated in a ratio of 8:2 for the training and validation sets, respectively. The specific experimental results are shown in Table 3.
As shown in Table 3, the YOLOv8n network outperformed other models, with a high mAP@.5 value of 64.3%, and its excellent feature extraction capability stood out among all models. In contrast, the RT-DETR model achieved a parameter count and floating-point operation count of 19.873 M and 56.9 G, respectively, but only achieved an mAP@.5 of 54.5%. Similarly, the YOLOv7 model achieved a parameter count and floating-point operation count of 36.482 M and 103.2 G, respectively, but the mAP@.5 value was also only 63.2%. Both failed to fully leverage their advantages in terms of parameter volume and computational requirements. The results demonstrate that when using a small dataset, the architectures of large models such as RT-DETR and YOLOv7 and significant computational demands restrict the convergence ability, making it difficult to achieve optimal performance. Large models also pose challenges for deployment on future edge computing devices. Although YOLOv5s has made some progress in model terms of model lightweighting, it has sacrificed a certain degree of accuracy, which may be an inevitable compromise required to simplify the model structure. Since YOLOv8n not only maintains model performance on small samples and small target datasets but also takes into account the efficiency of detection, we decided to adopt it as the base network model for further optimization and improvement.

3.2.2. Quantitative Analysis: Evaluation of Performance Indicators

This manuscript takes characters as the source domain and tea plantation pests as the target domain, using the YOLOv8n model to verify the changes in detection accuracy before and after transfer learning. To further verify the effectiveness of transfer learning, this experiment compares the effects of the Pests-100, Pests-200, Pests-300, and TeaPests datasets before and after using transfer learning weights to verify the feasibility of character-domain adaptation to the pest domain. The specific experimental results are shown in Table 4.
Table 4 shows that in the dataset of small target samples, the model’s performance is significantly improved in terms of accuracy, recall, and mean average precision when using transfer learning weights compared to when these weights are not used. The mAP@.5 values on the Pests-100, Pests-200, and Pests-300 datasets improved from original values of 64.3%, 68.6%, and 70.8% to 69.8%, 72.8%, and 74.2%, respectively. This quantitatively confirms the feasibility of the natural transfer from the language character domain to the pest domain proposed in this study. This experiment also provides a good concept of a method for transfer between different domains. The following sections further explore the principles of transfer in the adaptation process.

3.2.3. Qualitative Analysis: Deeper Understanding of Transfer Mechanisms

During the process of verifying the model’s generalization, from 15 April to 1 May 2024, we collected a new set of sticky insect board images using tea tree pest monitoring equipment and created an independent dataset named Pests-val. The establishment of this dataset aimed to provide a standardized testing environment to measure the model’s performance on the target task before and after using deep transfer learning. This section uses visual means to compare and analyze the detection results to intuitively observe the changes in the accuracy and confidence of the model’s recognition of insect targets in the images before and after transfer learning. Detailed comparative results are presented in Figure 10.
To verify the effects of models trained on different datasets while ensuring the scientific and universal nature of the data, three representative images from the Pests-val dataset were selected for comparison of results before and after training. Figure 10a–c display the detection results of the model before transfer learning, where all instances exhibit missed detections of insect targets. In images with lens flare and insufficient exposure, the missed detections are especially evident. Figure 10d–f show the detection results of the model after transfer learning, where the phenomenon of missed detections on small targets is significantly reduced and the recognition accuracy of small targets is also been greatly improved.
Through the analysis of the heatmap visualization in Figure 9, it can be concluded that the neural network without transfer learning struggles to handle image noise, such as lens flare, focus blur, and insufficient exposure. The specific effects are illustrated in Figure 9a–c. These types of noise interfere with the network’s ability to effectively extract image features, leading the model to fail in focusing on the target features.
Compared to its previous performance, the neural network after transfer learning shows a significant improvement in handling the same types of image noise. Through transfer learning, the model becomes more robust to image noise and more precise in identifying small targets. As demonstrated in Figure 9d–f, there is a noticeable increase in attention towards small target insects in the images. This enhancement is mainly attributed to the use of pre-trained weights; during the training phase, the model adapted to and absorbed complex features from the character dataset. This learning process significantly improved the model’s ability to recognize targets of various sizes, particularly small ones. Consequently, the model became more sensitive to the contour features of small-sized objects and more adept at recognizing texture and local features.
In summary, the experimental results reported in this section clearly demonstrate the effectiveness of transfer learning in enhancing the model’s recognition accuracy and generalization ability. This is particularly evident in the application scenario of identifying small targets in images, further confirming the effectiveness and practicality of the transfer learning strategy.

3.3. Ablation Study

This ablation study uses the TeaPests dataset as a verification benchmark. The manuscript explores various improvement methods, and the specific experimental results are presented in Table 5.
In the experimental study on small-target information loss in images, we observed a sharp decrease in target information in the layer 2 stage and significant loss by the layer 21 stage. To address this issue, a series of improvement measures was implemented. Firstly, we introduced the P2 small target layer to enhance the model’s ability to capture small target features, effectively mitigating potential information loss in deep network models. Although the addition of the P2 layer improved the model’s recall rate, it also led to a slight decrease in accuracy. To further optimize the model, we removed the P5 layer and its corresponding neck part’s down-sampling operation. This change not only reduced the number of model parameters but also minimized interference with the recognition capabilities of other detection layers. Additionally, a Faster block module based on deformable convolution (PConv, as shown in Figure 6) was adopted, reducing computational load while maintaining high-precision transmission of the target’s basic features. These improvements resulted in a 3.2% increase in the mAP@.5 metric for the final improved model compared to the original model.
The improved model effectively enhances recognition accuracy by removing the P5 layer and introducing the P2 layer, creating a structure specifically designed for small target detection. This not only improves recognition accuracy but also reduces computational costs. These changes allow small target information to effectively integrate with deep semantic information in the network, enabling the model to more accurately locate small targets. The PConv module, by dynamically adjusting the shape of the convolutional kernel, performs convolution operations only on parts of the input feature map related to the target shape. This makes it more flexible in adapting to the local features of the input data and reduces the computational load. As a result, PConv can more accurately locate and extract key features of targets with different sizes and shapes.
Ultimately, the improved YOLOv8-FasterTea model, combined with pre-trained weights through transfer learning, increased the mAP@.5 value by 7.5% while reducing the number of parameters by 33.3%. These experimental results demonstrate not only the effectiveness of the model improvements but also the feasibility of adaptive transfer from the natural language character domain to the pest image domain.

3.4. Mathematical Statistical Analysis

In the process of optimizing deep learning models, evaluating the effectiveness of performance improvements is a crucial step. To thoroughly assess the enhancement of this paper’s model in identifying insect targets, a comprehensive mathematical statistical analysis method was employed. Fifty images were selected from the Pests-val dataset and divided into multiple subsets based on varying numbers of insects to ensure sample diversity and representativeness. The number of insects in these images ranged from very few to many, showing an uneven yet highly representative distribution. To obtain accurate baseline data, a manual count was conducted to carefully tally the number of insects in each image.
Initially, the unoptimized model was employed to analyze these 50 images, and the predicted results were recorded. Following this, predictions were made again using the optimized model. To clearly illustrate the performance differences before and after model optimization, the predicted results from both models were plotted on the same chart. In the chart, red dots indicate the values predicted by the model before optimization, while green dots represent the values after optimization. The distribution of the actual values is depicted by a line passing through the origin, facilitating the observation of the relationship between the predicted and actual values. For detailed evaluation results, please refer to Figure 11.
In Figure 11, the difference in the scattered distribution of red and green points intuitively demonstrates the change in model performance from before to after optimization. Through the optimization of the model, the model’s count of insects in the images became more accurate, indicating that the model’s generalization ability and predictive accuracy were significantly enhanced. Furthermore, by comparing the two sets of colored points, one can observe the model’s recognition effect on different numbers of insects after optimization, including performance in extreme cases (such as very few or very many insects). These observations provide direction for further model tuning and parameter adjustment and, more importantly, direct evidence of model optimization. In this section, the effectiveness of model improvement has been effectively confirmed from the perspective of mathematical statistics.

4. Discussion

Regarding the completed and future research efforts, this paper deems it necessary to engage in candid discussions concerning the following aspects:
(1) Visual device: Conventional vision devices, such as pest reporting lamps [41,42,43], often encounter difficult in capturing detailed characteristic information due to equipment bottlenecks and technological limitations [44,45]. In field experiments, tea pests can effectively stick to yellow sticky boards. Meanwhile, the use of sticky boards reduces the dependence on chemical pesticides to a certain extent, in addition to implementing the concepts of green prevention and control and sustainable development of agriculture. Therefore, the use of sticky insect panels is a cost-effective method of pest observation [46,47]. In this study, we chose yellow sticky boards for tea pest detection and observation and developed real-time monitoring equipment that can realize long-term autonomous operation in complex outdoor environments. The equipment is built with stainless steel and equipped with a high-capacity solar panel of up to 240 AH. It is able to provide long-lasting power support for the edge computing device to ensure its continuous and stable operation. Thanks to its good materials and compact design, this device can easily adapt to various outdoor environments and realize rapid deployment. Finally, a dataset comprising 974 high-quality images was constructed utilizing this apparatus. Compared with commercially available products, the proposed apparatus demonstrates greater cost-effectiveness while integrating both simplicity and operational efficiency.
(2) The issue of small-sample learning: The small-sample problem has consistently been a challenging issue in deep learning detection tasks, and it is particularly evident in the tea-leaf pest detection application presented in this manuscript. In the application reported in this paper, the characters and tea leaf pests both had the characteristics of being small and dense, enabling the transfer of features from the character domain for the identification of tea leaf pests. The characters themselves were artificially created, and character data can be obtained in large quantities, making the sample size in the character domain very abundant. During the training process in the character domain, with abundant samples, the network’s ability to extract features of small and complex targets is effectively enhanced. Consequently, when transferring to the small sample domain of tea-leaf pests, the network only needs to use a small amount of tea-leaf pest data to adjust the background or target features to achieve better detection accuracy. Based on the aforementioned analysis, this study achieved a significant improvement in accuracy across pest detection datasets of varying scales by leveraging generated data. Notably, in the Pests-100 dataset, the mAP@.5 of the baseline model was enhanced by 5.5%. The cross-domain transfer learning methodology presented in this manuscript effectively resolves practical scientific challenges in pest identification, establishing a novel paradigm for few-shot learning research.
(3) The problem of small-target feature loss: Tea-leaf pests are mainly characterized as small” in images, with few pixel points and limited texture features. These pests occupy only a few pixels within an image, and as the number of convolutional network layers increases, information about the pests tends to be gradually lost, resulting in reduced visual detection accuracy. This study selected features from different layers to calculate feature significance indicators, thereby confirming this hypothesis. Based on the aforementioned research findings, this study designed and implemented the YOLOv8-FasterTea model. This model is based on YOLOv8 and reduces network depth by removing the P5 detection head, effectively minimizing the loss of small target features during transmission. Additionally, while YOLOv8-FasterTea connects the detection head to shallower feature layers, it also optimizes some C2f modules using the FasterNet block, significantly enhancing the model’s efficiency and accuracy in identifying small flying pest targets within tea plantations. On the Pests-100 small-scale pest detection dataset, the model demonstrated outstanding performance, with precision increasing by 1.8%, recall improving by 7.7%, and mAP@.5 significantly rising by 7.5%, while the model size was substantially reduced by 33.3%. These results indicate that, compared to baseline models of the same type, YOLOv8-FasterTea achieved significant optimization across all key performance metrics.

5. Conclusions

This manuscript proposes a novel tea pest detection method, YOLOv8-FasterTea, leveraging machine vision and cross-domain transfer learning, designed to address challenges in monitoring pests in outdoor tea gardens such as small pest targets, significant background interference, and unstable environmental conditions. The proposed method utilizes cross-domain transfer learning from the character domain to the tea pest domain. Experimental results effectively demonstrate that this method mitigates issues related to insufficient training data and small targets in tea pest detection tasks. During the investigation of deep feature extraction for small targets, it was confirmed that as the network layers deepen, there is a higher likelihood of losing location and texture information for small targets. The proposed YOLOv8-FasterTea reduces network depth to lower the risk of losing critical features of small targets, and the final detection results indicate that this method achieves superior performance compared to existing and popular detection methods. The proposed method offers an effective solution for detecting small tea pests under conditions of limited training samples.

Author Contributions

Conceptualization, K.L. and Y.L.; methodology, K.L.; software, K.L. and X.W.; validation, K.L. and J.S.; formal analysis, K.L. and L.Y.; investigation, K.L., X.L. and Y.X.; resources, J.M.; data curation, K.L., Y.L. and X.W.; writing—original draft preparation, K.L.; writing—review and editing, K.L. and Y.L.; visualization, K.L., Y.L. and X.W.; supervision, J.M.; project administration, J.M.; funding acquisition, J.M. All authors have read and agreed to the published version of the manuscript.

Funding

This study was funded by the Key Research and Development Program of the Ya’an Agriculture and Rural Bureau under Grant No. kczx2023-2025-10.

Data Availability Statement

The data supporting the findings of this study are available from the corresponding author upon reasonable request.

Acknowledgments

The authors are grateful to the anonymous reviewers for their valuable comments and suggestions. Special thanks to the management of Mengding Mountain Tea Plantation in Ya’an for their help in data collection and analysis and to the Ya’an Agriculture and Rural Bureau for their technical and financial support.

Conflicts of Interest

Lu Xiaosong is an employee of Ya’an Guangju Agricultural Development Company Limited, which has no interest in the research content of this paper. The remaining authors declare that the research was conducted in the absence of any commercial or financial relationships that could be construed as a potential conflict of interest.

References

  1. Wang, Z.; Ahmad, W.; Zhu, A.; Zhao, S.; Ouyang, Q.; Chen, Q. Recent advances review in tea waste: High-value applications, processing technology, and value-added products. Sci. Total Environ. 2024, 946, 174225. [Google Scholar] [CrossRef]
  2. Bermúdez, S.; Voora, V.; Larrea, C.; Luna, E. Tea Prices and Sustainability. R. 2024; International Institute for Sustainable Development: Winnipeg, MB, Canada, 2024. [Google Scholar]
  3. Ye, G.Y.; Xiao, Q.; Chen, M.; Chen, X.X.; Yuan, Z.J.; Stanley, D.W.; Hu, C. Tea: Biological control of insect and mite pests in China. Biol. Control 2014, 68, 73–91. [Google Scholar] [CrossRef]
  4. Qin, D.; Zhang, L.; Xiao, Q.; Dietrich, C.; Matsumura, M. Clarification of the identity of the tea green leafhopper based on morphological comparison between Chinese and Japanese specimens. PLoS ONE 2015, 10, e0139202. [Google Scholar] [CrossRef]
  5. Liao, Y.; Yu, Z.; Liu, X.; Zeng, L.; Cheng, S.; Li, J.; Tang, J.; Yang, Z. Effect of major tea insect attack on formation of quality-related nonvolatile specialized metabolites in tea (Camellia sinensis) leaves. J. Agric. Food Chem. 2019, 67, 6716–6724. [Google Scholar] [CrossRef] [PubMed]
  6. Radhakrishnan, B. Pests and their management in tea. In Trends in Horticultural Entomology; Springer: Singapore, 2022; pp. 1489–1511. [Google Scholar]
  7. Zhang, Y.; Lv, C. TinySegformer: A lightweight visual segmentation model for real-time agricultural pest detection. Comput. Electron. Agric. 2024, 218, 108740. [Google Scholar] [CrossRef]
  8. Dong, Q.; Sun, L.; Han, T.; Cai, M.; Gao, C. PestLite: A novel YOLO-based deep learning technique for crop pest detection. Agriculture 2024, 14, 228. [Google Scholar] [CrossRef]
  9. Fabian, S.T.; Sondhi, Y.; Allen, P.E.; Theobald, J.C.; Lin, H.T. Why flying insects gather at artificial light. Nat. Commun. 2024, 15, 689. [Google Scholar] [CrossRef] [PubMed]
  10. Aman, A.S.; Kumar, A.; Mishra, P.K.; Mishra, R.; Tripathi, P.; Rajpoot, P.K. Modern Technologies of Insect Trapping. In Recent Trends in Plant Protection; Nipa Genx Electronic Resources and Solution SP Ltd.: New Delhi, India, 2024; p. 15. [Google Scholar]
  11. Zhong, Y.; Gao, J.; Lei, Q.; Zhou, Y. A vision-based counting and recognition system for flying insects in intelligent agriculture. Sensors 2018, 18, 1489. [Google Scholar] [CrossRef]
  12. Saradopoulos, I.; Potamitis, I.; Ntalampiras, S.; Konstantaras, A.I.; Antonidakis, E.N. Edge computing for vision-based, urban-insects traps in the context of smart cities. Sensors 2022, 22, 2006. [Google Scholar] [CrossRef]
  13. Sun, G.; Liu, S.; Luo, H.; Feng, Z.; Yang, B.; Luo, J.; Tang, J.; Yao, Q.; Xu, J. Intelligent monitoring system of migratory pests based on searchlight trap and machine vision. Front. Plant Sci. 2022, 13, 897739. [Google Scholar] [CrossRef]
  14. Qing, Y.; Jin, F.; Jian, T.; Xu, W.G.; Zhu, X.H.; Yang, B.J.; Jun, L.; Xie, Y.Z.; Bo, Y.; Wu, S.Z.; et al. Development of an automatic monitoring system for rice light-trap pests based on machine vision. J. Integr. Agric. 2020, 19, 2500–2513. [Google Scholar]
  15. Muhammad, A.S.; Mandala, S.; Gunawan, P. IOT-Based Pest Detection in Maize Plants Using Machine Learning. In Proceedings of the 2023 International Conference on Data Science and Its Applications (ICoDSA), Bandung, Indonesia, 9–10 August 2023; pp. 254–258. [Google Scholar]
  16. Park, Y.H.; Choi, S.H.; Kwon, Y.J.; Kwon, S.W.; Kang, Y.J.; Jun, T.H. Detection of soybean insect pest and a forecasting platform using deep learning with unmanned ground vehicles. Agronomy 2023, 13, 477. [Google Scholar] [CrossRef]
  17. Luca, A.R.; Ursuleanu, T.F.; Gheorghe, L.; Grigorovici, R.; Iancu, S.; Hlusneac, M.; Grigorovici, A. Impact of quality, type and volume of data used by deep learning models in the analysis of medical images. Inform. Med. Unlocked 2022, 29, 100911. [Google Scholar] [CrossRef]
  18. Whang, S.E.; Roh, Y.; Song, H.; Lee, J.G. Data collection and quality challenges in deep learning: A data-centric ai perspective. VLDB J. 2023, 32, 791–813. [Google Scholar] [CrossRef]
  19. Liang, X.; Hu, Z.; Zhang, H.; Gan, C.; Xing, E.P. Recurrent topic-transition gan for visual paragraph generation. In Proceedings of the IEEE International Conference on Computer Vision, Venice, Italy, 22–29 October 2017; pp. 3362–3371. [Google Scholar]
  20. Bond-Taylor, S.; Leach, A.; Long, Y.; Willcocks, C.G. Deep generative modelling: A comparative review of vaes, gans, normalizing flows, energy-based and autoregressive models. IEEE Trans. Pattern Anal. Mach. Intell. 2021, 44, 7327–7347. [Google Scholar] [CrossRef]
  21. Lu, C.Y.; Rustia, D.J.A.; Lin, T.T. Generative adversarial network based image augmentation for insect pest classification enhancement. IFAC-PapersOnLine 2019, 52, 1–5. [Google Scholar] [CrossRef]
  22. Karam, C.; Awad, M.; Abou Jawdah, Y.; Ezzeddine, N.; Fardoun, A. GAN-based semi-automated augmentation online tool for agricultural pest detection: A case study on whiteflies. Front. Plant Sci. 2022, 13, 813050. [Google Scholar] [CrossRef]
  23. Weiss, K.; Khoshgoftaar, T.M.; Wang, D. A survey of transfer learning. J. Big Data 2016, 3, 9. [Google Scholar] [CrossRef]
  24. Zhuang, F.; Qi, Z.; Duan, K.; Xi, D.; Zhu, Y.; Zhu, H.; Xiong, H.; He, Q. A comprehensive survey on transfer learning. Proc. IEEE 2020, 109, 43–76. [Google Scholar] [CrossRef]
  25. Neyshabur, B.; Sedghi, H.; Zhang, C. What is being transferred in transfer learning? Adv. Neural Inf. Process. Syst. 2020, 33, 512–523. [Google Scholar]
  26. Wang, J.; Chen, Y.; Feng, W.; Yu, H.; Huang, M.; Yang, Q. Transfer learning with dynamic distribution adaptation. ACM Trans. Intell. Syst. Technol. TIST 2020, 11, 1–25. [Google Scholar] [CrossRef]
  27. Huang, M.L.; Chuang, T.C.; Liao, Y.C. Application of transfer learning and image augmentation technology for tomato pest identification. Sustain. Comput. Inform. Syst. 2022, 33, 100646. [Google Scholar] [CrossRef]
  28. Sourav, M.S.U.; Wang, H. Intelligent identification of jute pests based on transfer learning and deep convolutional neural networks. Neural Processing Letters 2023, 55, 2193–2210. [Google Scholar] [CrossRef] [PubMed]
  29. Bukhsh, Z.A.; Jansen, N.; Saeed, A. Damage detection using in-domain and cross-domain transfer learning. Neural Comput. Appl. 2021, 33, 16921–16936. [Google Scholar] [CrossRef]
  30. Pan, S.J. Transfer learning. Learning 2020, 21, 1–2. [Google Scholar]
  31. Liu, B.; Jia, Y.; Liu, L.; Dang, Y.; Song, S. Skip DETR: End-to-end Skip connection model for small object detection in forestry pest dataset. Front. Plant Sci. 2023, 14, 1219474. [Google Scholar] [CrossRef]
  32. Ye, R.; Gao, Q.; Qian, Y.; Sun, J.; Li, T. Improved Yolov8 and Sahi Model for the Collaborative Detection of Small Targets at the Micro Scale: A Case Study of Pest Detection in Tea. Agronomy 2024, 14, 1034. [Google Scholar] [CrossRef]
  33. Gonzalez, R.C. Deep convolutional neural networks [lecture notes]. IEEE Signal Process. Mag. 2018, 35, 79–87. [Google Scholar] [CrossRef]
  34. Zhou, D.X. Universality of deep convolutional neural networks. Appl. Comput. Harmon. Anal. 2020, 48, 787–794. [Google Scholar] [CrossRef]
  35. Redmon, J.; Divvala, S.; Girshick, R.; Farhadi, A. You only look once: Unified, real-time object detection. In Proceedings of the IEEE Conference on Computer Vision and Pattern Recognition, Las Vegas, NV, USA, 27–30 June 2016; pp. 779–788. [Google Scholar]
  36. Hussain, M. YOLO-v1 to YOLO-v8, the rise of YOLO and its complementary nature toward digital manufacturing and industrial defect detection. Machines 2023, 11, 677. [Google Scholar] [CrossRef]
  37. Hu, D.; Yu, M.; Wu, X.; Hu, J.; Sheng, Y.; Jiang, Y.; Huang, C.; Zheng, Y. DGW-YOLOv8: A small insulator target detection algorithm based on deformable attention backbone and WIoU loss function. IET Image Process. 2024, 18, 1096–1108. [Google Scholar] [CrossRef]
  38. Yang, P.; Yang, C.; Shi, B.; Ao, L.; Ma, S. Research on Mask Detection Method Based on Yolov8. In Proceedings of the 2023 International Conference on Computer, Vision and Intelligent Technology, Chenzhou, China, 25–28 August 2023; pp. 1–10. [Google Scholar]
  39. Chen, J.; Kao, S.H.; He, H.; Zhuo, W.; Wen, S.; Lee, C.H.; Chan, S.H.G. Run, don’t walk: Chasing higher FLOPS for faster neural networks. In Proceedings of the IEEE/CVF Conference on Computer Vision and Pattern Recognition, Vancouver, BC, Canada, 18–22 June 2023; pp. 12021–12031. [Google Scholar]
  40. Draelos, R.L.; Carin, L. Use HiResCAM instead of Grad-CAM for faithful explanations of convolutional neural networks. arXiv 2020, arXiv:2011.08891. [Google Scholar]
  41. Sciarretta, A.; Calabrese, P. Development of automated devices for the monitoring of insect pests. Curr. Agric. Res. J. 2019, 7, 19–25. [Google Scholar] [CrossRef]
  42. Cardim Ferreira Lima, M.; Damascena de Almeida Leandro, M.E.; Valero, C.; Pereira Coronel, L.C.; Gonçalves Bazzo, C.O. Automatic detection and monitoring of insect pests—A review. Agriculture 2020, 10, 161. [Google Scholar] [CrossRef]
  43. Noskov, A.; Bendix, J.; Friess, N. A review of insect monitoring approaches with special reference to radar techniques. Sensors 2021, 21, 1474. [Google Scholar] [CrossRef]
  44. Suto, J. A novel plug-in board for remote insect monitoring. Agriculture 2022, 12, 1897. [Google Scholar] [CrossRef]
  45. Sittinger, M.; Uhler, J.; Pink, M.; Herz, A. Insect detect: An open-source DIY camera trap for automated insect monitoring. PLoS ONE 2024, 19, e0295474. [Google Scholar] [CrossRef]
  46. Rustia, D.J.A.; Lee, W.C.; Lu, C.Y.; Wu, Y.F.; Shih, P.Y.; Chen, S.K.; Chung, J.Y.; Lin, T.T. Edge-based wireless imaging system for continuous monitoring of insect pests in a remote outdoor mango orchard. Comput. Electron. Agric. 2023, 211, 108019. [Google Scholar] [CrossRef]
  47. Tian, Y.; Wang, S.; Li, E.; Yang, G.; Liang, Z.; Tan, M. MD-YOLO: Multi-scale Dense YOLO for small target pest detection. Comput. Electron. Agric. 2023, 213, 108233. [Google Scholar] [CrossRef]
Figure 1. Specific technology roadmap.
Agronomy 15 00693 g001
Figure 2. Schematic diagram of the tea pest monitoring system: (a) system flowchart; (b) system architecture.
Agronomy 15 00693 g002
Figure 3. Schematic diagram of the tea pest monitoring system: (a) 3D design of the equipment; (b) actual device setup in the tea plantation.
Agronomy 15 00693 g003
Figure 4. Transfer learning between different data domains.
Agronomy 15 00693 g004
Figure 5. Comparison of network structure diagrams: (a) YOLOv8n; (b) YOLOv8-FasterTea.
Agronomy 15 00693 g005
Figure 6. Schematic diagram of the tea pest monitoring system: (a) 3D design of the equipment; (b) actual device setup in the tea plantation.
Agronomy 15 00693 g006
Figure 7. Visualizationof small target object feature extraction: (a) simplified diagram of the YOLOv8 network’s architecture hierarchy; (b) backbone-stage feature map; (c) neck-stage characteristic map.
Agronomy 15 00693 g007
Figure 8. Energy ratios of targets of different sizes in the image relative to the background.
Agronomy 15 00693 g008
Figure 9. Heatmap visualization of the detection images before and after transfer learning: (a,d) images from Pests-100; (b,e) images from Pests-200; (c,f) images from Pests-300; (ac) the detection results of the model before transfer learning; (df) the detection results of the model after transfer learning.
Agronomy 15 00693 g009
Figure 10. Visualization of detection results before and after transfer learning: (a,d) images from Pests-100; (b,e) images from Pests-200; (c,f) images from Pests-300; (ac) the detection results of the model before transfer learning; (df) the detection results of the model after transfer learning.
Agronomy 15 00693 g010
Figure 11. Energy ratios of targets of different sizes in the image relative to the background.
Agronomy 15 00693 g011
Table 1. Yellow sticky board pest dataset.
DatasetPercentageNumber of PicturesNumber of Labeled Boxes
Training7068119,910
Validation201955179
Testing10983092
Total10097428,181
Table 2. Experimental parameter settings.
ParameterValue
Input shape(640, 640, 3)
Training epochs200
Close mosaic10
Batch size8
Workers8
OptimizerSGD
Ir0 1 × 10 2
Ir1 1 × 10 4
momentum0.937
Iou0.7
Table 3. Comparison of results of different models on the Pests-100 dataset.
ModelParameters (M)FLOPs (G)Precision (%)Recall (%)mAP@.5 (%)mAP@.5-.95 (%)
RT-DETR19.87356.961.158.954.518.9
YOLOv5s2.5037.169.263.762.223.2
YOLOv736.482103.27065.463.220.6
YOLOv8n3.0068.173.464.364.324.8
Table 4. Table of effects of different datasets with or without transfer learning weights.
DatasetTransfer Learning WeightsPrecision (%)Recall (%)mAP@.5 (%)mAP@.5-.95 (%)
Pests-100NO73.464.364.324.8
Pests-100YES76.769.569.829.1
Pests-200NO73.268.368.628
Pests-200YES77.370.872.831.6
Pests-300NO75.370.670.830.1
Pests-300YES7973.274.233.6
TeaPestsNO80.274.378.237.2
TeaPestsYES82.473.779.137.7
Table 5. Table of effects of different datasets with or without transfer learning weights.
P2DHeadFBlockTransfer WeightParameters (M)FLOPs (G)Precision (%)Recall (%)mAP@.5 (%)mAP@.5-.95 (%)
3.0068.173.464.364.324.8
2.92112.261.264.661.925.7
1.9937.370.763.263.324
2.9757.670.864.764.725.2
2.01011.563.964.563.626.2
2.56011.163.963.762.925.3
1.9897.172.465.865.525.6
2.00611.37066.867.527.5
2.00611.375.27271.830.5
Disclaimer/Publisher’s Note: The statements, opinions and data contained in all publications are solely those of the individual author(s) and contributor(s) and not of MDPI and/or the editor(s). MDPI and/or the editor(s) disclaim responsibility for any injury to people or property resulting from any ideas, methods, instructions or products referred to in the content.

