
Impact of Climate, Phenology, and Soil Factors on Net Ecosystem Productivity in Zoigê Alpine Grassland
 , , , ,
  ,
,
Abstract
:1. Introduction
2. Data and Methods
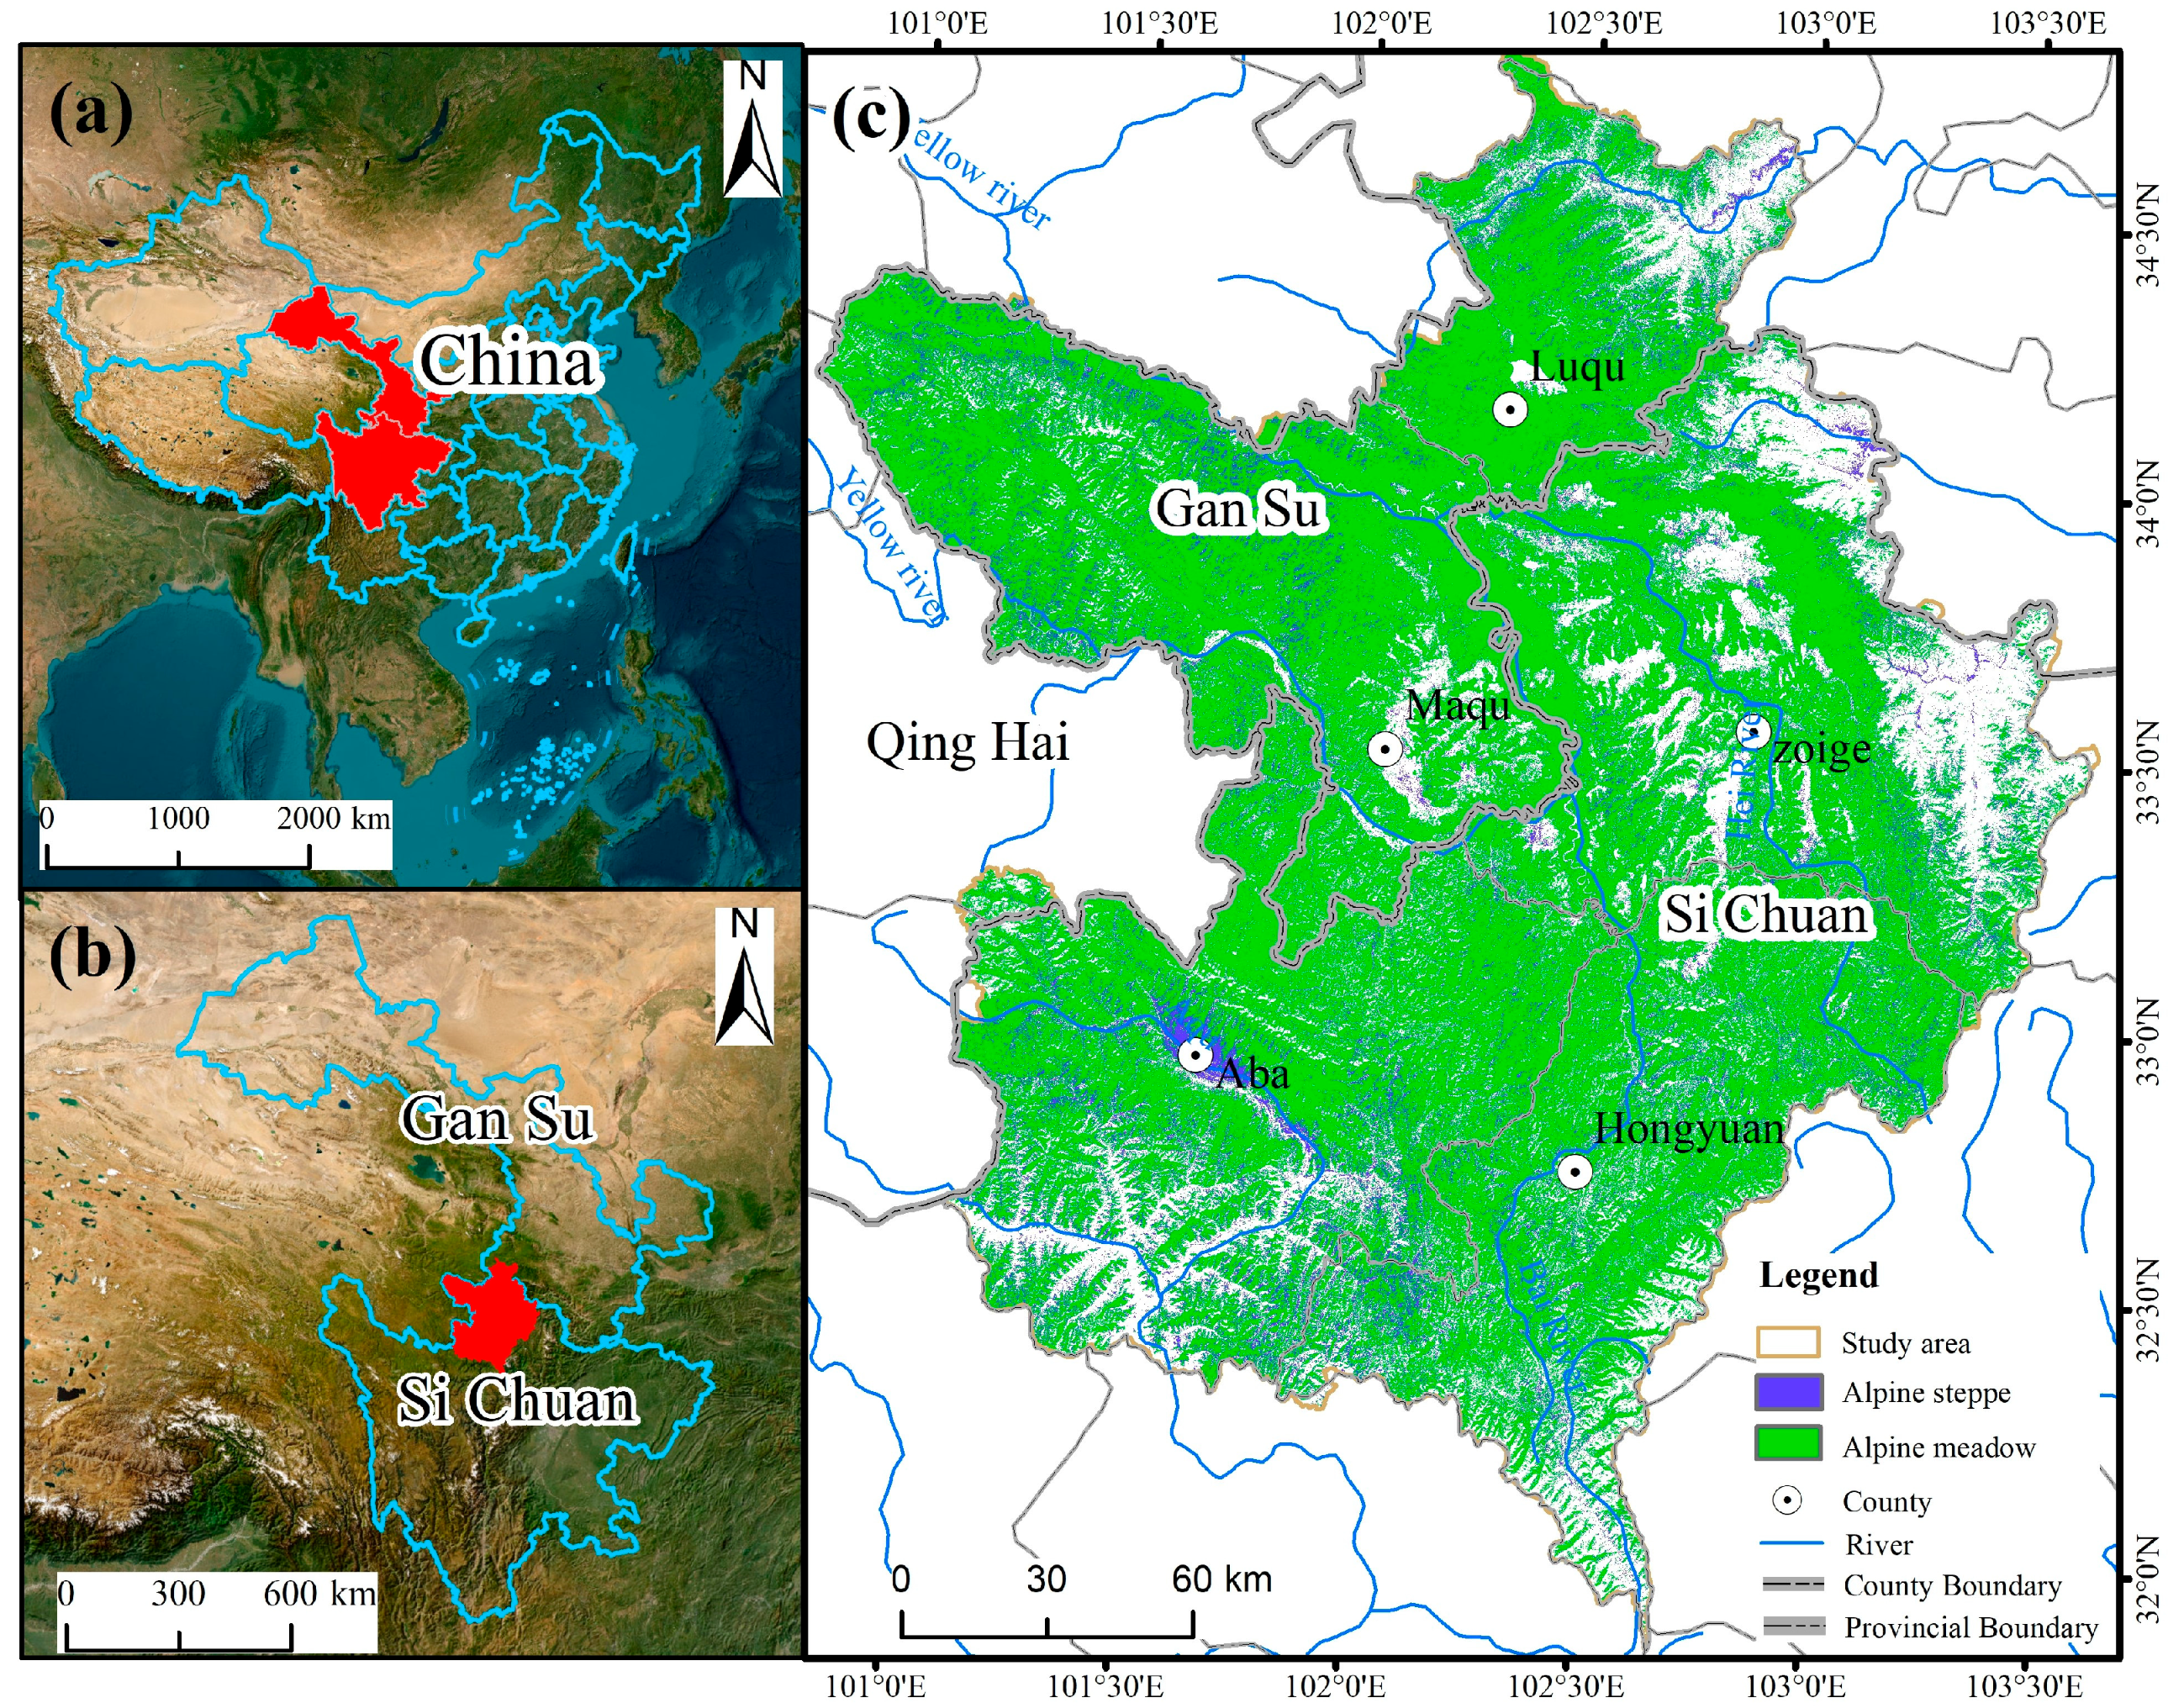
2.1. Zoigê Plateau
2.2. Data
2.3. Methods
2.3.1. Estimation of NEP Products
2.3.2. Aridity Index
2.3.3. Structural Equation Model (SEM)
3. Results
3.1. Evaluation Results of NEP Datasets
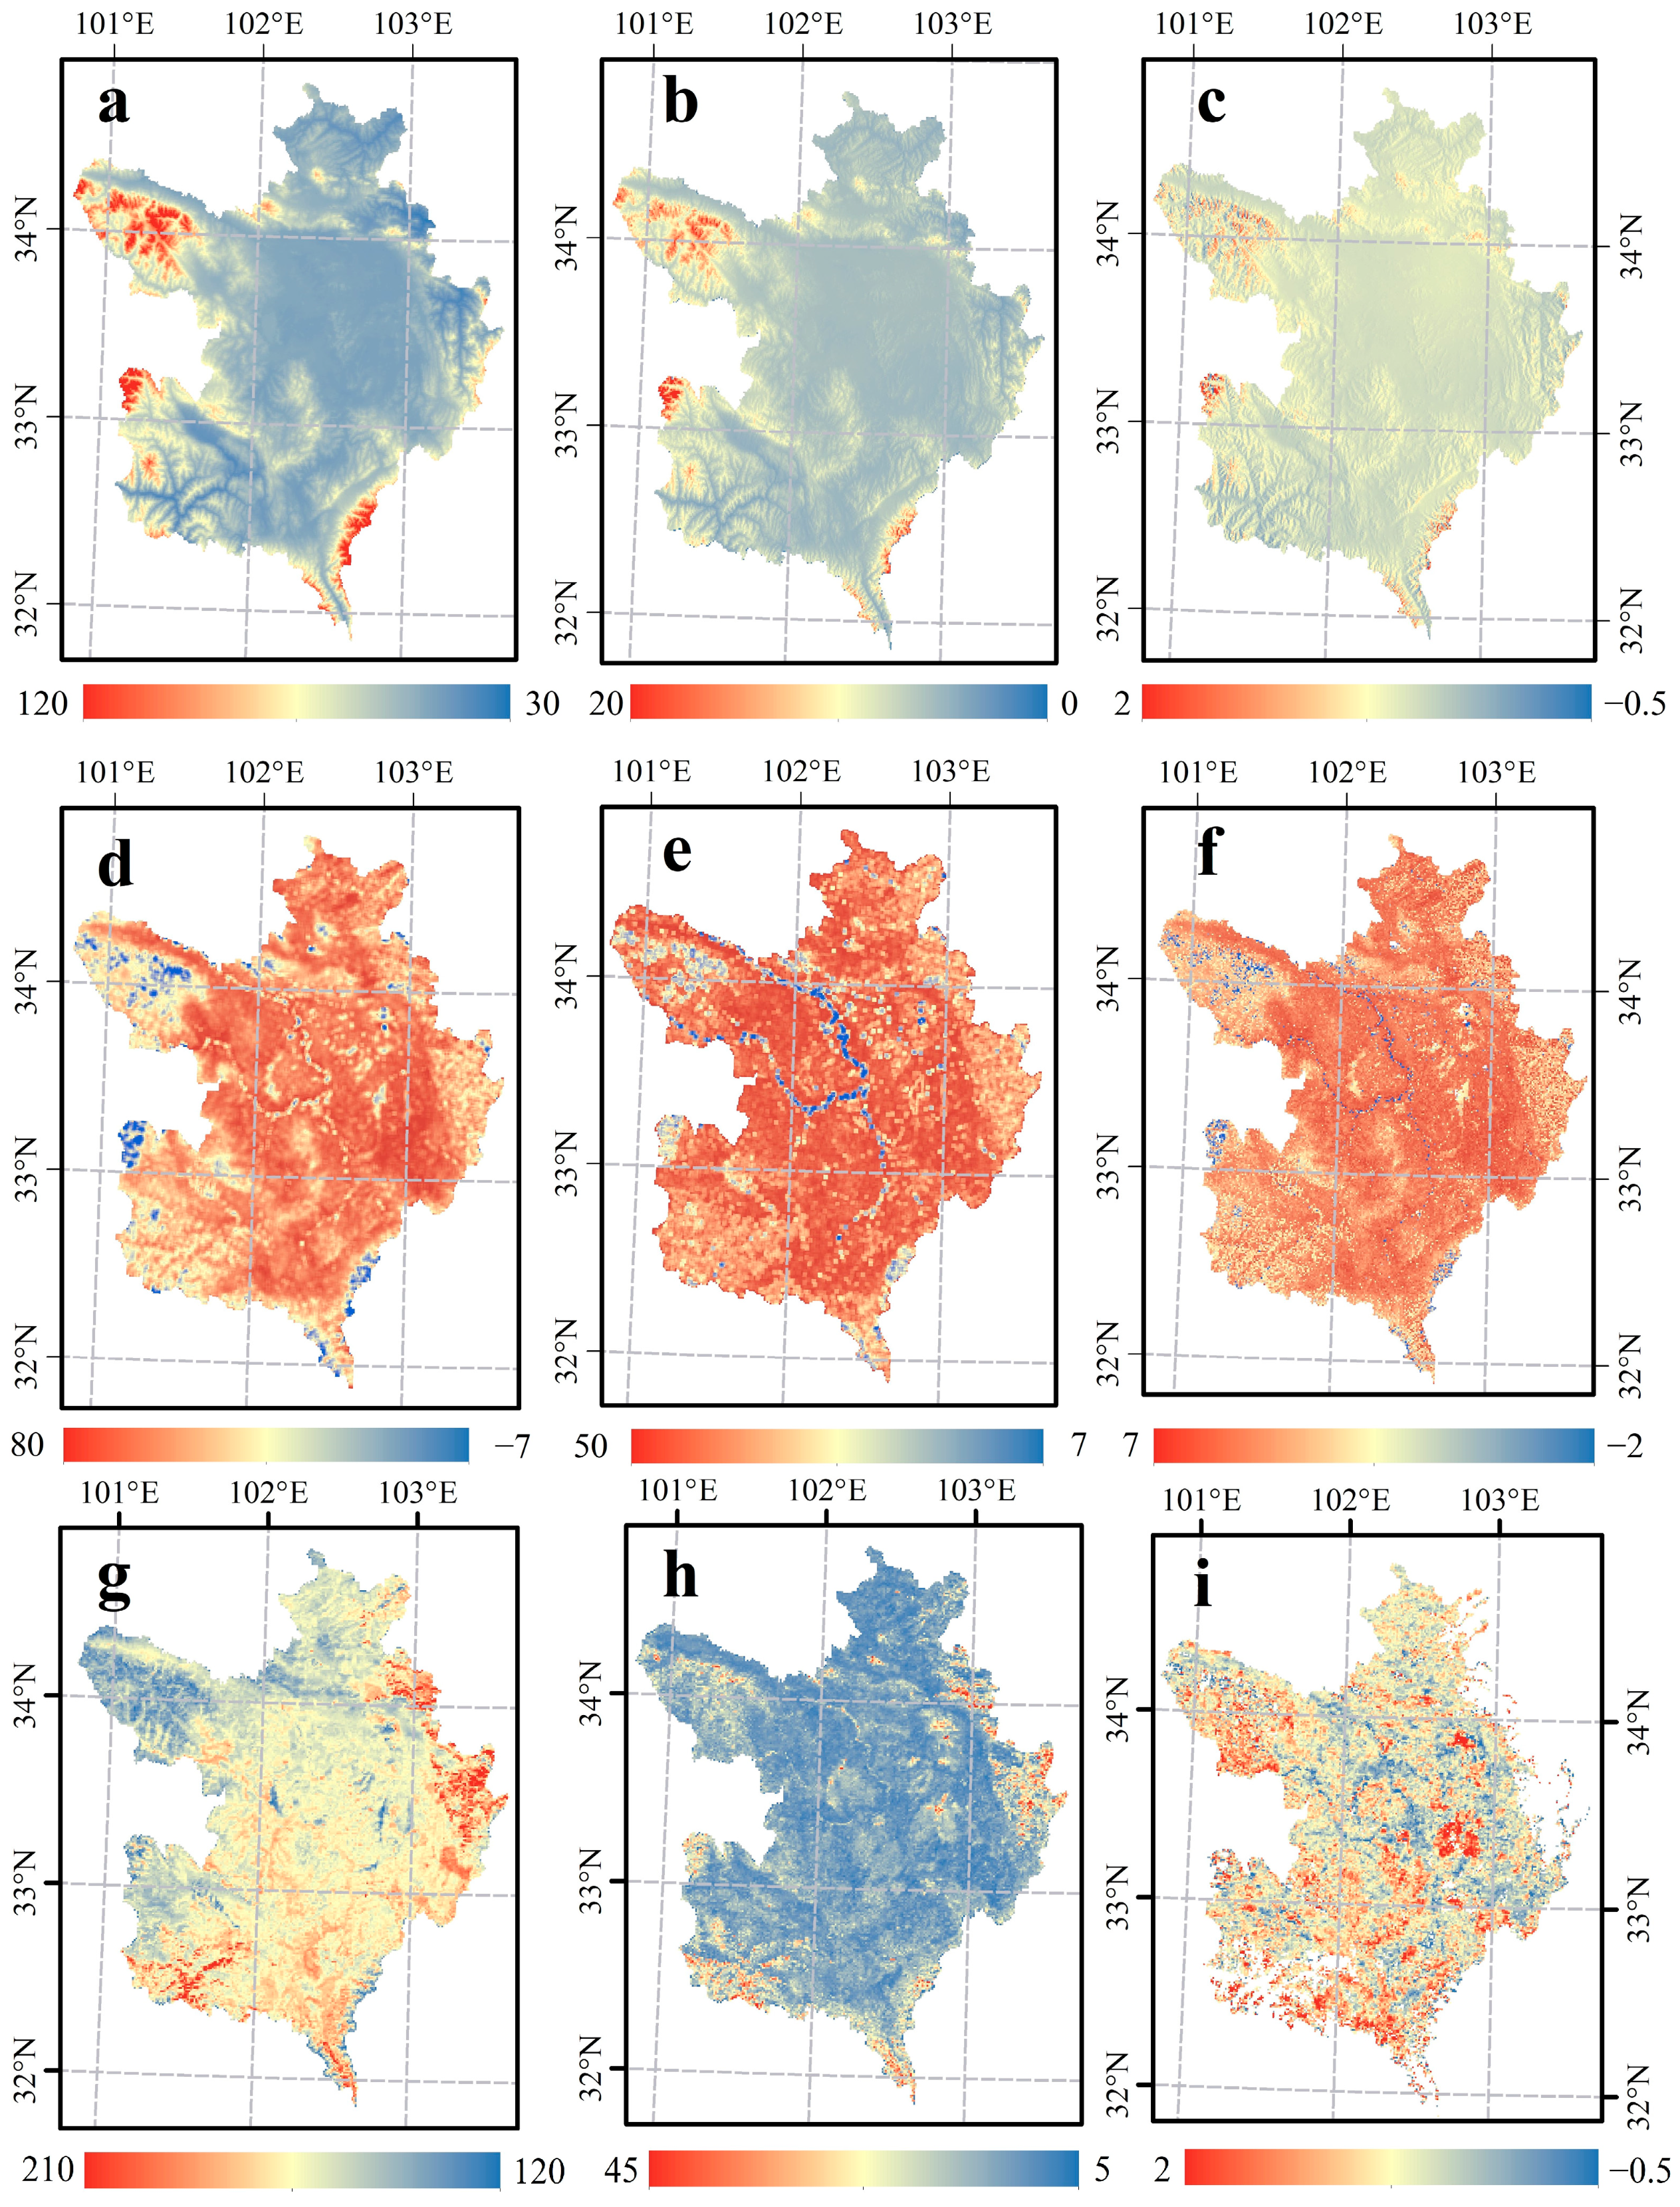
3.2. Spatio-Temporal Patterns of NEP, AI, and LOS in the Zoigê Plateau
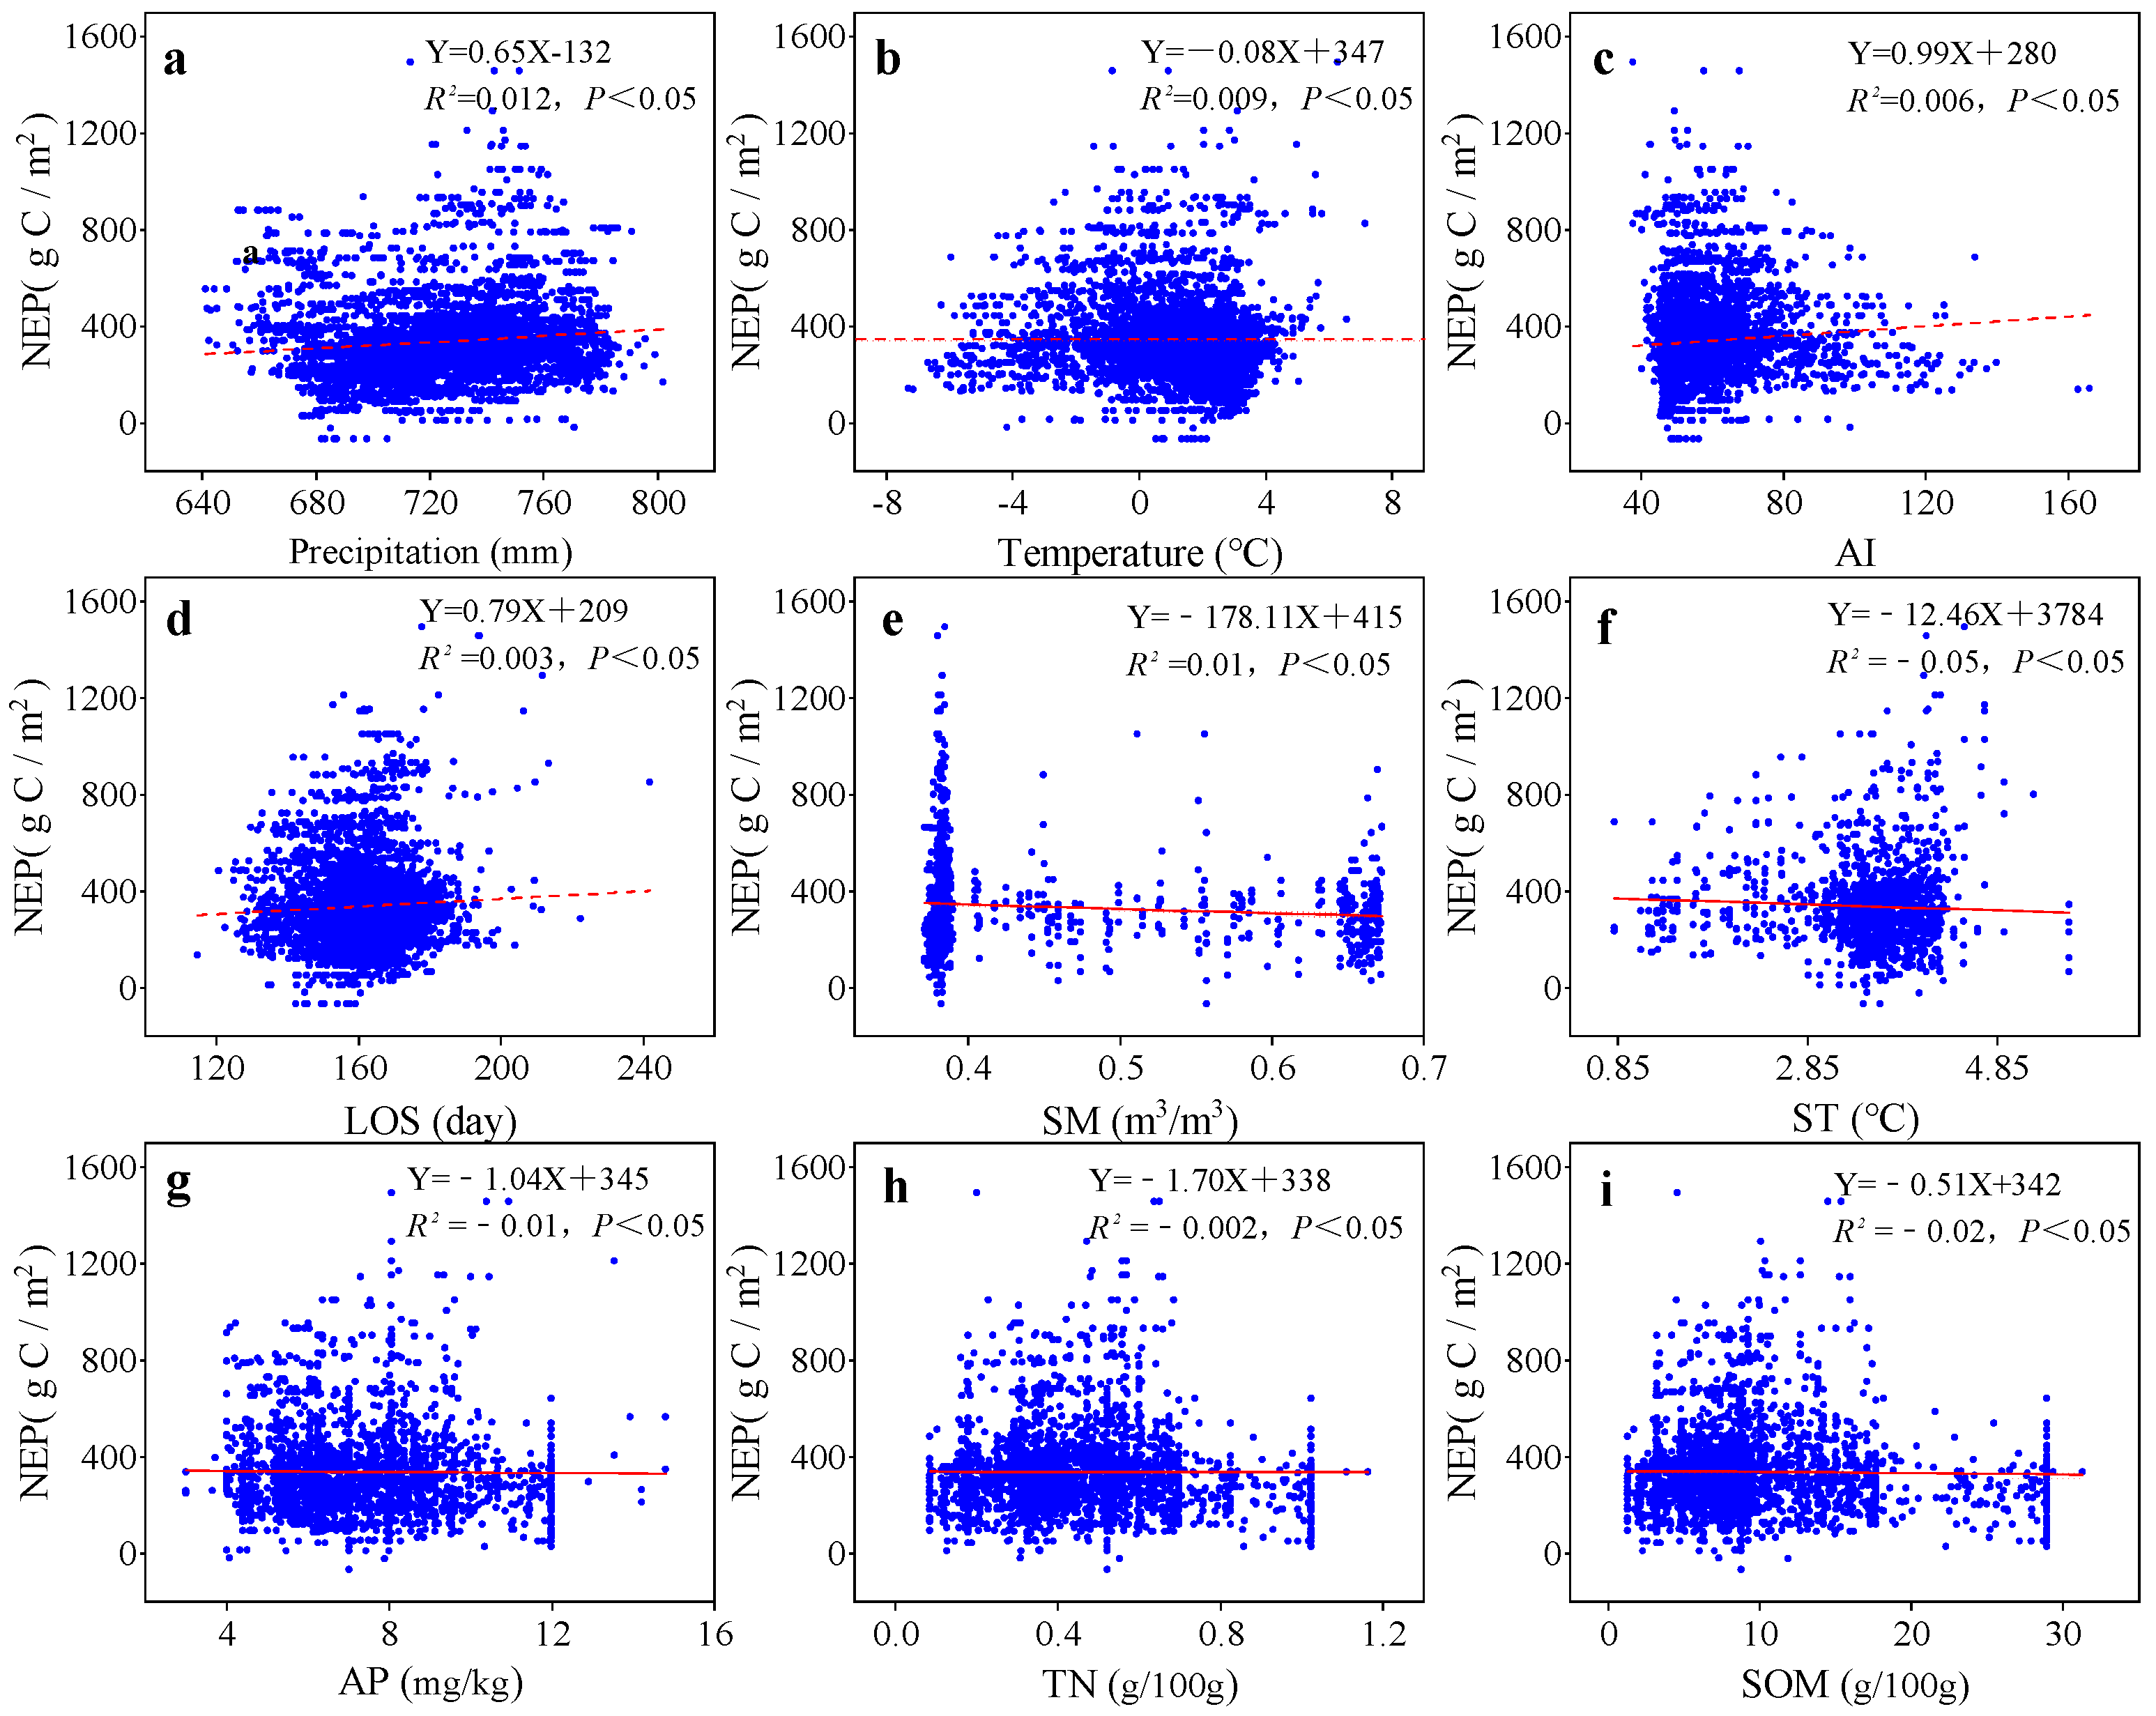
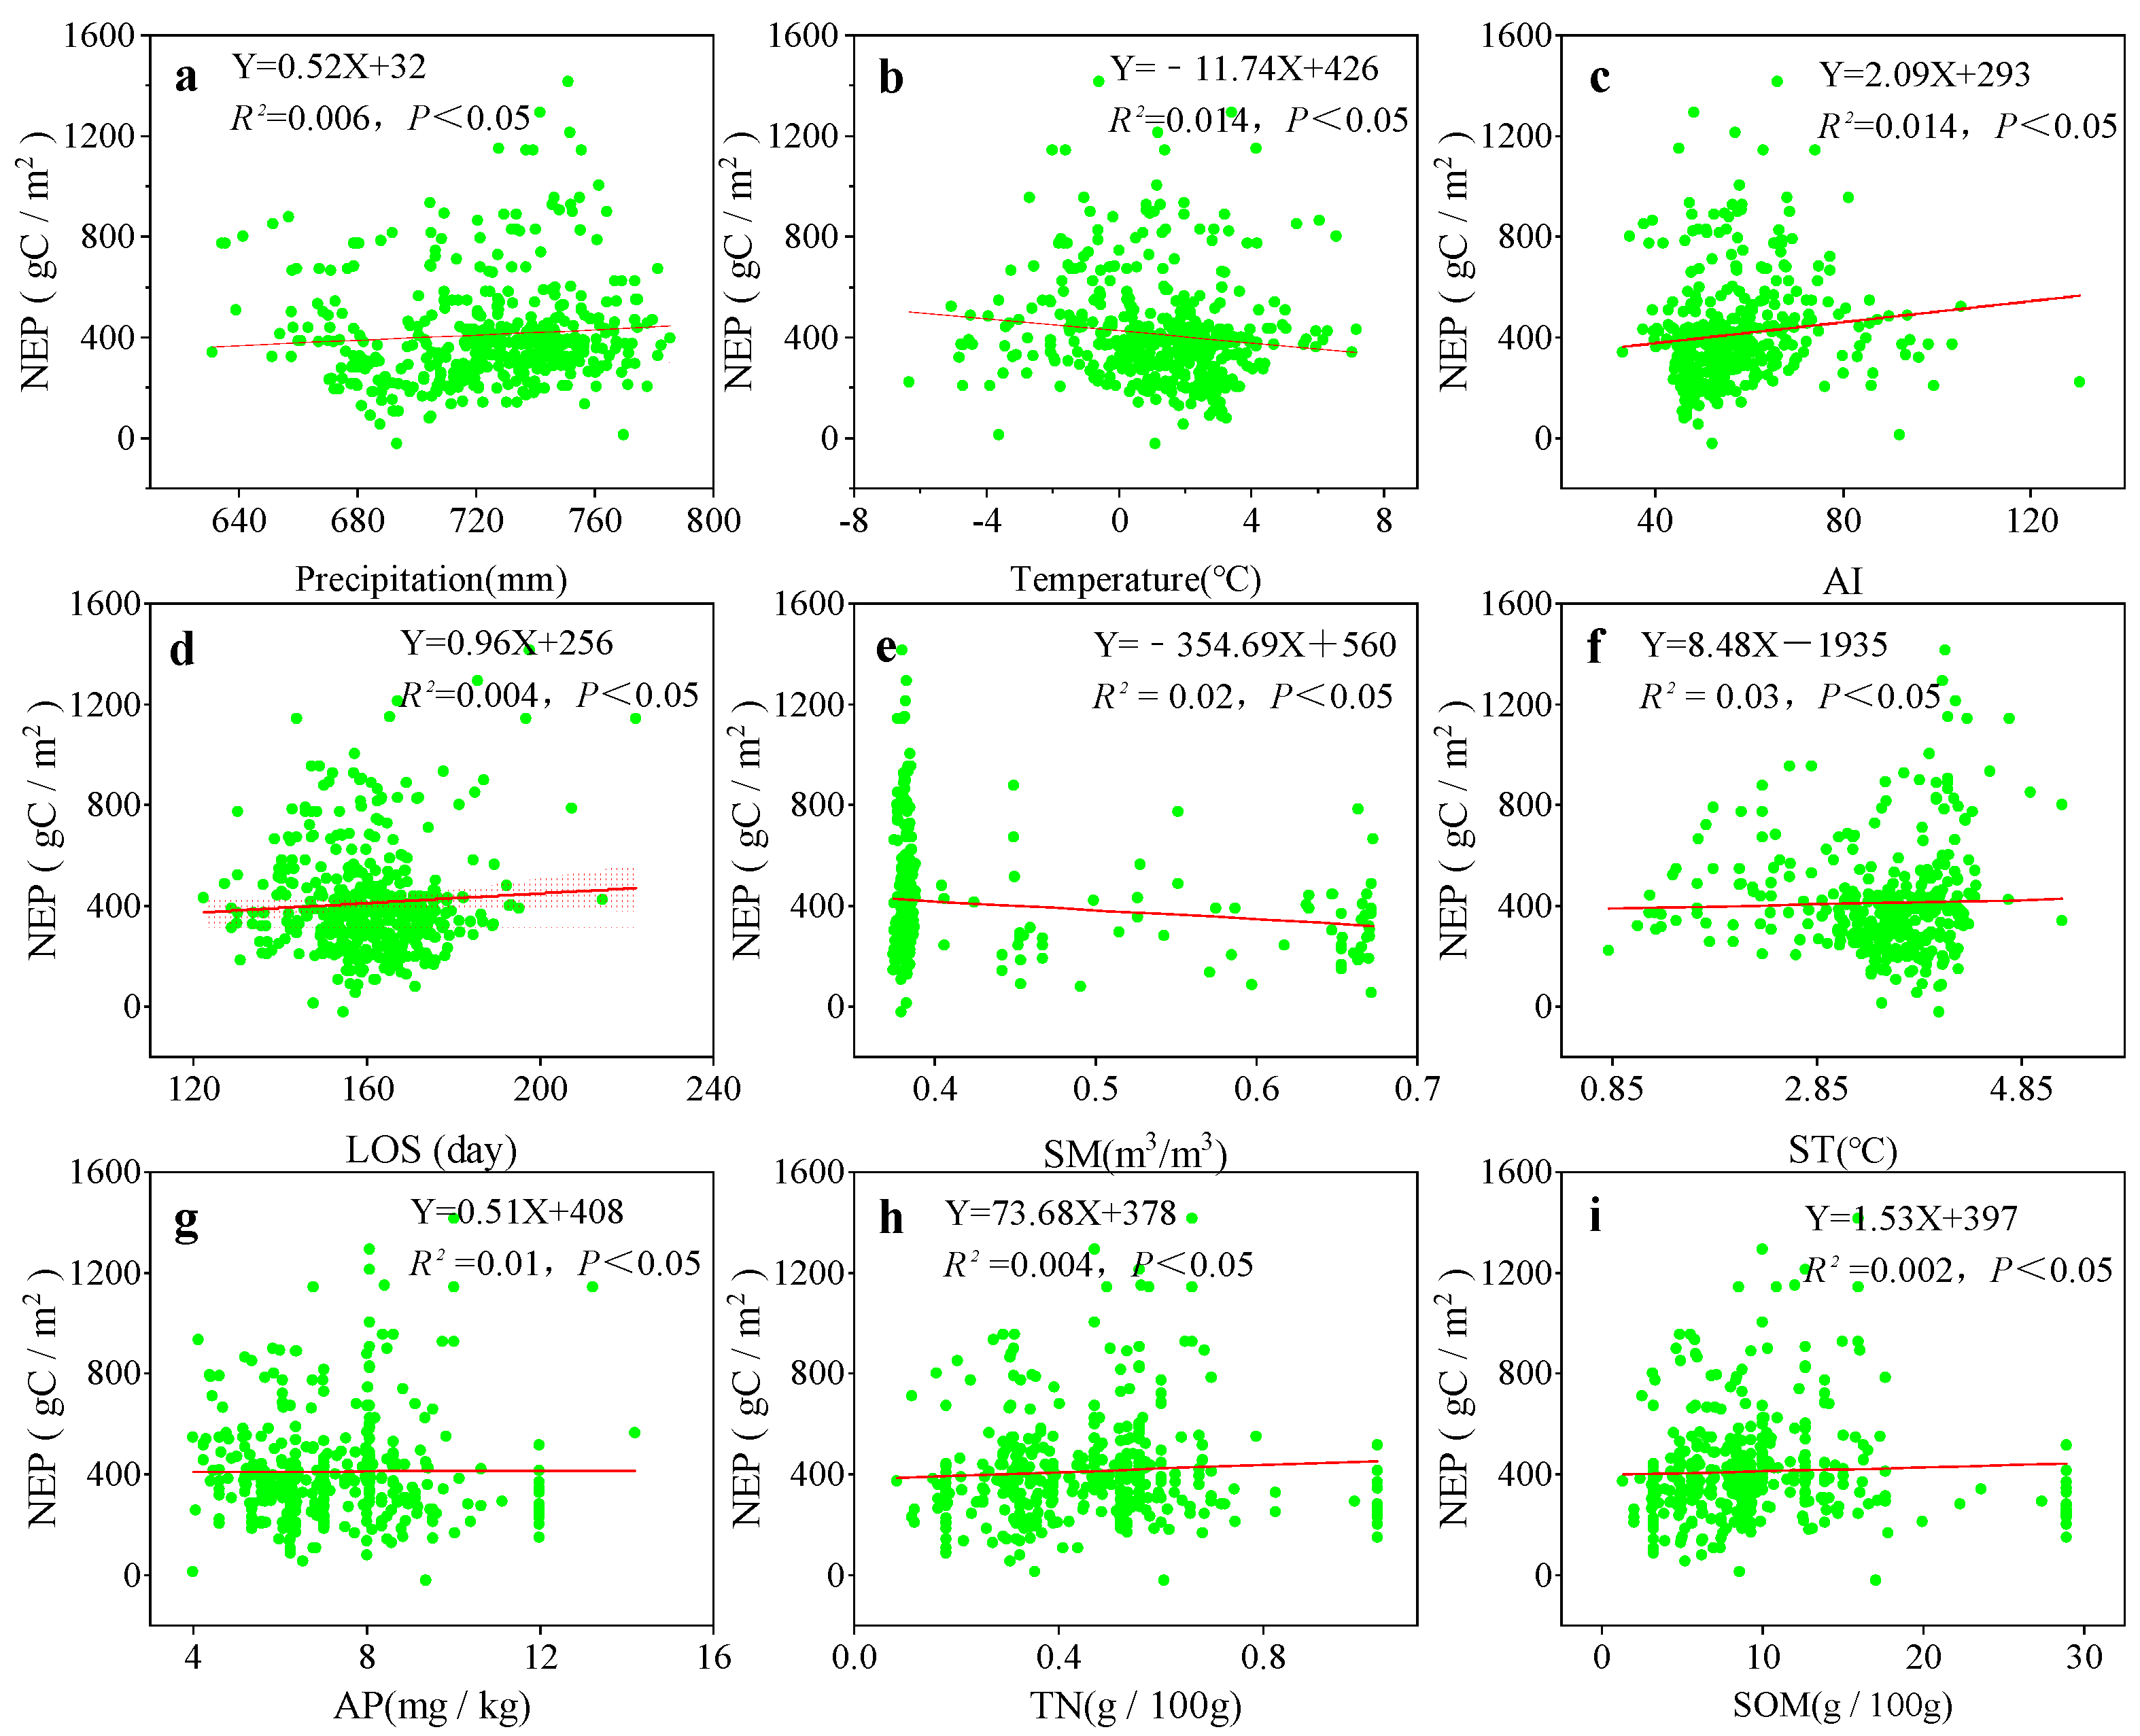
3.3. Relationships Among Climate Factors, Phenology, Soil Factors, and NEP in Various Grassland Ecosystems of the Zoigê Plateau
4. Discussion
4.1. Uncertainty Analysis
4.2. Spatial and Temporal Patterns of NEP
4.3. NEP Response to Vegetation Climate, Phenology, and Soil
5. Conclusions
Author Contributions
Funding
Data Availability Statement
Acknowledgments
Conflicts of Interest
References
- He, N.; Yan, P.; Liu, C.; Xu, L.; Li, M.; Van Meerbeek, K.; Zhou, G.; Zhou, G.; Liu, S.; Zhou, X. Predicting ecosystem productivity based on plant community traits. Trends Plant Sci. 2023, 28, 43–53. [Google Scholar] [CrossRef] [PubMed]
- Huang, Y.; Wang, F.; Zhang, L.; Zhao, J.; Zheng, H.; Zhang, F.; Wang, N.; Gu, J.; Zhao, Y.; Zhang, W. Changes and net ecosystem productivity of terrestrial ecosystems and their influencing factors in China from 2000 to 2019. Front. Plant Sci. 2023, 14, 1120064. [Google Scholar] [CrossRef] [PubMed]
- Wang, N.; Liu, Y.; Yin, F.; Shi, Y.; Liu, Y. Estimation and Analysis of Net Ecosystem Carbon Sink Considering the Topographical Correction. Geomat. Inf. Sci. Wuhan Univ. 2024. [Google Scholar] [CrossRef]
- Lemordant, L.; Gentine, P. Vegetation response to rising CO2 impacts extreme temperatures. Geophys. Res. Lett. 2019, 46, 1383–1392. [Google Scholar] [CrossRef]
- Sha, Z.; Bai, Y.; Li, R.; Lan, H.; Zhang, X.; Li, J.; Liu, X.; Chang, S.; Xie, Y. The global carbon sink potential of terrestrial vegetation can be increased substantially by optimal land management. Commun. Earth Environ. 2022, 3, 8. [Google Scholar] [CrossRef]
- Yang, Y.; Shi, Y.; Sun, W.; Chang, J.; Zhu, J.; Chen, L.; Wang, X.; Guo, Y.; Zhang, H.; Yu, L. Terrestrial carbon sinks in China and around the world and their contribution to carbon neutrality. Sci. China Life Sci. 2022, 65, 861–895. [Google Scholar] [CrossRef]
- Yu, P.; Zhou, T.; Luo, H.; Liu, X.; Shi, P.; Zhang, Y.; Zhang, J.; Zhou, P.; Xu, Y. Global pattern of ecosystem respiration tendencies and its implications on terrestrial carbon sink potential. Earth’s Future 2022, 10, e2022EF002703. [Google Scholar] [CrossRef]
- Walker, A.P.; De Kauwe, M.G.; Bastos, A.; Belmecheri, S.; Georgiou, K.; Keeling, R.F.; McMahon, S.M.; Medlyn, B.E.; Moore, D.J.; Norby, R.J. Integrating the evidence for a terrestrial carbon sink caused by increasing atmospheric CO2. New Phytol. 2021, 229, 2413–2445. [Google Scholar] [CrossRef]
- Ruehr, S.; Keenan, T.F.; Williams, C.; Zhou, Y.; Lu, X.; Bastos, A.; Canadell, J.G.; Prentice, I.C.; Sitch, S.; Terrer, C. Evidence and attribution of the enhanced land carbon sink. Nat. Rev. Earth Environ. 2023, 4, 518–534. [Google Scholar] [CrossRef]
- Tu, H.; Jiapaer, G.; Yu, T.; Zhang, L.; Chen, B.; Lin, K.; Li, X. Effects of Land Cover Change on Vegetation Carbon Source/Sink in Arid Terrestrial Ecosystems of Northwest China, 2001–2018. Remote Sens. 2023, 15, 2471. [Google Scholar] [CrossRef]
- Chen, B.; Zhang, X.; Tao, J.; Wu, J.; Wang, J.; Shi, P.; Zhang, Y.; Yu, C. The impact of climate change and anthropogenic activities on alpine grassland over the Qinghai-Tibet Plateau. Agric. For. Meteorol. 2014, 189, 11–18. [Google Scholar] [CrossRef]
- Du, C.; Jing, J.; Shen, Y.; Liu, H.; Gao, Y. Short-term grazing exclusion improved topsoil conditions and plant characteristics in degraded alpine grasslands. Ecol. Indic. 2020, 108, 105680. [Google Scholar] [CrossRef]
- Duan, H.; Xue, X.; Wang, T.; Kang, W.; Liao, J.; Liu, S. Spatial and temporal differences in alpine meadow, alpine steppe and all vegetation of the Qinghai-Tibetan Plateau and their responses to climate change. Remote Sens. 2021, 13, 669. [Google Scholar] [CrossRef]
- Gaffney, P.P.; Tang, Q.; Li, Q.; Zhang, R.; Pan, J.; Xu, X.; Li, Y.; Niu, S. The impacts of land-use and climate change on the Zoigê peatland carbon cycle: A review. Wiley Interdiscip. Rev. Clim. Change 2024, 15, e862. [Google Scholar] [CrossRef]
- Craine, J.M.; Ocheltree, T.W.; Nippert, J.B.; Towne, E.G.; Skibbe, A.M.; Kembel, S.W.; Fargione, J.E. Global diversity of drought tolerance and grassland climate-change resilience. Nat. Clim. Change 2013, 3, 63–67. [Google Scholar] [CrossRef]
- Song, C.; Wang, G.; Hu, Z.; Zhang, T.; Huang, K.; Chen, X.; Li, Y. Net ecosystem carbon budget of a grassland ecosystem in central Qinghai-Tibet Plateau: Integrating terrestrial and aquatic carbon fluxes at catchment scale. Agric. For. Meteorol. 2020, 290, 108021. [Google Scholar] [CrossRef]
- Piao, S.; He, Y.; Wang, X.; Chen, F. Estimation of China’s terrestrial ecosystem carbon sink: Methods, progress and prospects. Sci. China Earth Sci. 2022, 65, 641–651. [Google Scholar] [CrossRef]
- Chen, X.; Zhang, Y. Impacts of climate, phenology, elevation and their interactions on the net primary productivity of vegetation in Yunnan, China under global warming. Ecol. Indic. 2023, 154, 110533. [Google Scholar] [CrossRef]
- Sun, M.; Li, P.; Ren, P.; Tang, J.; Zhang, C.; Zhou, X.; Peng, C. Divergent response of vegetation phenology to extreme temperatures and precipitation of different intensities on the Tibetan Plateau. Sci. China Earth Sci. 2023, 66, 2200–2210. [Google Scholar] [CrossRef]
- Liu, Z.; Chen, Z.; Yu, G.; Zhang, W.; Zhang, T.; Han, L. The role of climate, vegetation, and soil factors on carbon fluxes in Chinese drylands. Front. Plant Sci. 2023, 14, 1060066. [Google Scholar] [CrossRef]
- Li, X.; Zhao, H.; Gu, B.; Chen, Y. Carbon sinks/sources’ spatiotemporal heterogeneity and their spatial response to economic-social factors in relatively developed regions: A case of China’s coastal area. J. Environ. Manag. 2024, 354, 120494. [Google Scholar] [CrossRef]
- Sarma, D.; Baruah, K.K.; Chakraborty, S.; Karipot, A.; Baruah, R. Impact of ecosystem respiration on carbon balance in a semi-evergreen forest of Northeast India. Curr. Sci. 2019, 116, 751–757. [Google Scholar] [CrossRef]
- Hou, X.; Zhang, B.; He, Q.-Q.; Shao, Z.-L.; Yu, H.; Zhang, X.-Y. Spatial–Temporal Variations in the Climate, Net Ecosystem Productivity, and Efficiency of Water and Carbon Use in the Middle Reaches of the Yellow River. Remote Sens. 2024, 16, 3312. [Google Scholar] [CrossRef]
- Larmola, T.; Alm, J.; Juutinen, S.; Saarnio, S.; Martikainen, P.J.n.; Silvola, J. Floods can cause large interannual differences in littoral net ecosystem productivity. Limnol. Oceanogr. 2004, 49, 1896–1906. [Google Scholar] [CrossRef]
- Luo, Y.; Jiang, L.; Niu, S.; Zhou, X. Nonlinear responses of land ecosystems to variation in precipitation. New Phytol. 2017, 214, 5–7. [Google Scholar] [CrossRef]
- Hou, P.; Zhai, J.; Jin, D.-D.; Zhou, Y.; Chen, Y.; Gao, H.-F. Assessment of changes in key ecosystem factors and water conservation with remote sensing in the Zoigê. Diversity 2022, 14, 552. [Google Scholar] [CrossRef]
- Ju, W.; Chen, J.M.; Black, T.A.; Barr, A.G.; Liu, J.; Chen, B. Modelling multi-year coupled carbon and water fluxes in a boreal aspen forest. Agric. For. Meteorol. 2006, 140, 136–151. [Google Scholar] [CrossRef]
- Zhou, W.; Yang, H.; Zhou, L.; Chen, Y.; Huang, L.; Ju, W. Dynamics of grassland carbon sequestration and its coupling relation with hydrothermal factor of Inner Mongolia. Ecol. Indic. 2018, 95, 1–11. [Google Scholar] [CrossRef]
- De Martonne, E. Une Nouvelle Fonction Climatologique: L’Indice D’aridité; Impr. Gauthier-Villars: Paris, France, 1926. [Google Scholar]
- Sun, H.; Chen, Y.; Xiong, J.; Ye, C.; Yong, Z.; Wang, Y.; He, D.; Xu, S. Relationships between climate change, phenology, edaphic factors, and net primary productivity across the Tibetan Plateau. Int. J. Appl. Earth Obs. Geoinf. 2022, 107, 102708. [Google Scholar] [CrossRef]
- Hayes, A.F.; Montoya, A.K.; Rockwood, N.J. The analysis of mechanisms and their contingencies: PROCESS versus structural equation modeling. Australas. Mark. J. 2017, 25, 76–81. [Google Scholar] [CrossRef]
- Westland, J.C. Structural equation models. Stud. Syst. Decis. Control 2015, 22, 152. [Google Scholar]
- Thorson, J.T.; Andrews, A.G., III; Essington, T.E.; Large, S.I. Dynamic structural equation models synthesize ecosystem dynamics constrained by ecological mechanisms. Methods Ecol. Evol. 2024, 15, 744–755. [Google Scholar] [CrossRef]
- He, P.; Ma, X.; Han, Z.; Meng, X.; Sun, Z. Uncertainties of gross primary productivity of Chinese grasslands based on multi-source estimation. Front. Environ. Sci. 2022, 10, 928351. [Google Scholar] [CrossRef]
- Quetin, G.R.; Bloom, A.A.; Bowman, K.W.; Konings, A.G. Carbon flux variability from a relatively simple ecosystem model with assimilated data is consistent with terrestrial biosphere model estimates. J. Adv. Model. Earth Syst. 2020, 12, e2019MS001889. [Google Scholar] [CrossRef]
- Myrgiotis, V.; Blei, E.; Clement, R.; Jones, S.K.; Keane, B.; Lee, M.A.; Levy, P.E.; Rees, R.M.; Skiba, U.M.; Smallman, T.L. A model-data fusion approach to analyse carbon dynamics in managed grasslands. Agric. Syst. 2020, 184, 102907. [Google Scholar] [CrossRef]
- Liu, H.; Wood, A.W.; Newman, A.J.; Clark, M.P. Ensemble dressing of meteorological fields: Using spatial regression to estimate uncertainty in deterministic gridded meteorological datasets. J. Hydrometeorol. 2022, 23, 1525–1543. [Google Scholar] [CrossRef]
- Xie, Y.; Wilson, A.M. Change point estimation of deciduous forest land surface phenology. Remote Sens. Environ. 2020, 240, 111698. [Google Scholar] [CrossRef]
- Xu, L.; Niu, B.; Zhang, X.; He, Y. Dynamic threshold of carbon phenology in two cold temperate grasslands in China. Remote Sens. 2021, 13, 574. [Google Scholar] [CrossRef]
- Wang, S.; Li, R.; Wu, Y.; Zhao, S. Vegetation dynamics and their response to hydrothermal conditions in Inner Mongolia, China. Glob. Ecol. Conserv. 2022, 34, e02034. [Google Scholar] [CrossRef]
- Meng, F.; Luo, M.; Sa, C.; Wang, M.; Bao, Y. Quantitative assessment of the effects of climate, vegetation, soil and groundwater on soil moisture spatiotemporal variability in the Mongolian Plateau. Sci. Total Environ. 2022, 809, 152198. [Google Scholar] [CrossRef]
- Song, Y.; Lu, Y.; Liu, T.; Li, H.; Yue, Z.; Liu, H.; Gao, T. Variation of vegetation fractional coverage and its relationship with climate in a desert steppe: Optimization of farmland layout in a farming–pastoral ecotone using the ecological suitability index. Ecol. Eng. 2020, 150, 105834. [Google Scholar] [CrossRef]
- Zhang, Y.; Zhou, T.; Liu, X.; Xu, Y.; Zeng, J.; Zhang, J. Vertical distribution patterns of community biomass, carbon and nitrogen content in grasslands on the eastern Qinghai–Tibet Plateau. Ecol. Indic. 2023, 154, 110726. [Google Scholar] [CrossRef]
- Shen, X.; Liu, B.; Henderson, M.; Wang, L.; Jiang, M.; Lu, X. Vegetation greening, extended growing seasons, and temperature feedbacks in warming temperate grasslands of China. J. Clim. 2022, 35, 5103–5117. [Google Scholar] [CrossRef]
- Xie, J.; Yin, G.; Ma, D.; Chen, R.; Zhao, W.; Xie, Q.; Wang, C.; Lin, S.; Yuan, W. Climatic limitations on grassland photosynthesis over the Tibetan Plateau shifted from temperature to water. Sci. Total Environ. 2024, 906, 167663. [Google Scholar] [CrossRef]
- Qi, J.; Li, X.; Jia, R.; Yang, H.; Shi, Y.; Sun, J.; Fu, T. Response of biocrust nitrogenase activity to the variation of rainfall regime in the Tengger Desert, northern China. Catena 2022, 212, 106093. [Google Scholar] [CrossRef]
- Bhandari, J.; Bijaya, G.; Gaudel, G.; Li, C. Effect of altitude on soil properties of subalpine grasslands in Manang district of Nepal. Range Manag. Agrofor. 2020, 41, 368–373. [Google Scholar]
- Kewlani, P.; Negi, V.S.; Bhatt, I.D.; Rawal, R.S.; Nandi, S. Soil nutrients concentration along altitudinal gradients in Indian Western Himalaya. Scand. J. For. Res. 2021, 36, 98–104. [Google Scholar] [CrossRef]
- Chen, R.; Liu, L.; Liu, X. Satellite-based observations reveal the altitude-dependent patterns of SIFyield and its sensitivity to ambient temperature in Tibetan Meadows. Remote Sens. 2021, 13, 1400. [Google Scholar] [CrossRef]
- Pu, X.; Lyu, L. Disentangling the impact of photosynthesis and stomatal conductance on rising water-use efficiency at different altitudes on the Tibetan plateau. Agric. For. Meteorol. 2023, 341, 109659. [Google Scholar] [CrossRef]
- Kou-Giesbrecht, S.; Arora, V.K. Representing the dynamic response of vegetation to nitrogen limitation via biological nitrogen fixation in the CLASSIC land model. Glob. Biogeochem. Cycles 2022, 36, e2022GB007341. [Google Scholar] [CrossRef]
- Boegh, E.; Soegaard, H.; Thomsen, A.; Hansen, S. Multi-scale remote sensing based estimation of leaf area index and nitrogen concentration for photosynthesis modelling. In Proceedings of the IGARSS 2003. 2003 IEEE International Geoscience and Remote Sensing Symposium. Proceedings (IEEE Cat. No. 03CH37477), Toulouse, France, 21–25 July 2003; pp. 2847–2849. [Google Scholar]
- Wang, L.-W.; Wei, Y.-X. Progress in inversion of vegetation nitrogen concentration by hyperspectral remote sensing. Spectrosc. Spectr. Anal. 2013, 33, 2823–2827. [Google Scholar]
- Verburg, P.S.; Larsen, J.; Johnson, D.W.; Schorran, D.E.; Arnone, J.A., III. Impacts of an anomalously warm year on soil CO2 efflux in experimentally manipulated tallgrass prairie ecosystems. Glob. Change Biol. 2005, 11, 1720–1732. [Google Scholar] [CrossRef]
- Xing, X.; Wu, M.; Scholze, M.; Kaminski, T.; Vossbeck, M.; Lu, Z.; Wang, S.; He, W.; Ju, W.; Jiang, F. Soil Moisture Assimilation Improves Terrestrial Biosphere Model GPP Responses to Sub-Annual Drought at Continental Scale. Remote Sens. 2023, 15, 676. [Google Scholar] [CrossRef]
- Hasi, M.; Zhang, X.; Niu, G.; Wang, Y.; Geng, Q.; Quan, Q.; Chen, S.; Han, X.; Huang, J. Soil moisture, temperature and nitrogen availability interactively regulate carbon exchange in a meadow steppe ecosystem. Agric. For. Meteorol. 2021, 304, 108389. [Google Scholar] [CrossRef]
- Von Haden, A.C.; Dornbush, M.E. Ecosystem carbon pools, fluxes, and balances within mature tallgrass prairie restorations. Restor. Ecol. 2017, 25, 549–558. [Google Scholar] [CrossRef]
- Van Nuland, M.E.; Ware, I.M.; Schadt, C.W.; Yang, Z.; Bailey, J.K.; Schweitzer, J.A. Natural soil microbiome variation affects spring foliar phenology with consequences for plant productivity and climate-driven range shifts. New Phytol. 2021, 232, 762–775. [Google Scholar] [CrossRef]


| No. | Usage | Duration | Resolution | Source | Links |
|---|---|---|---|---|---|
| 1 | Monthly precipitation and temperature | 2000–2020 | / | China Meteorological Administration | http://data.cma.cn/ (accessed on 10 December 2024) |
| 2 | Soil organic matter (SOM) Total nitrogen (TN) Quick-acting phosphorus (AP) | / | 1 km | The Soil Database of China for Land Surface Modeling | http://globalchange.bnu.edu.cn/research/soil2 (accessed on 10 December 2024) |
| 3 | Plant phenology observation data for the Tibetan Plateau | 2000–2015 | 16 days | National Tibetan Plateau Science Data Center | https://data.tpdc.ac.cn/zh-hans/data/6466bf35-06ed-4c4d-ad21-) 0f64aedbdec0 (accessed on 10 December 2024) |
| 4 | Soil temperature (0–10 cm), soil moisture (0–10 cm) | 2000–2020 | 1 km | ERA5-Land | https://cds.climate.copernicus.eu/cdsapp#!/dataset/reanalysis-era5-land-monthly-means?tab=form (accessed on 15 December 2024) |
| 5 | Qinghai-Tibetan Plateau vegetation type | / | 1 month | National Tibetan Plateau Science Data Center | https://data.tpdc.ac.cn/zh-hans/data/8c12e483-bd59-402d-a6b5-fbc72da9f771 (accessed on 20 December 2024) |
Disclaimer/Publisher’s Note: The statements, opinions and data contained in all publications are solely those of the individual author(s) and contributor(s) and not of MDPI and/or the editor(s). MDPI and/or the editor(s) disclaim responsibility for any injury to people or property resulting from any ideas, methods, instructions or products referred to in the content. |
© 2025 by the authors. Licensee MDPI, Basel, Switzerland. This article is an open access article distributed under the terms and conditions of the Creative Commons Attribution (CC BY) license (https://creativecommons.org/licenses/by/4.0/).
Share and Cite
Qu, R.; He, Z.; He, L.; Awange, J.; Song, Y.; Wang, B.; Wen, B.; Hu, J. Impact of Climate, Phenology, and Soil Factors on Net Ecosystem Productivity in Zoigê Alpine Grassland. Agronomy 2025, 15, 685. https://doi.org/10.3390/agronomy15030685
Qu R, He Z, He L, Awange J, Song Y, Wang B, Wen B, Hu J. Impact of Climate, Phenology, and Soil Factors on Net Ecosystem Productivity in Zoigê Alpine Grassland. Agronomy. 2025; 15(3):685. https://doi.org/10.3390/agronomy15030685
Chicago/Turabian StyleQu, Rui, Zhengwei He, Li He, Joseph Awange, Yongze Song, Bing Wang, Bo Wen, and Jiao Hu. 2025. "Impact of Climate, Phenology, and Soil Factors on Net Ecosystem Productivity in Zoigê Alpine Grassland" Agronomy 15, no. 3: 685. https://doi.org/10.3390/agronomy15030685
APA StyleQu, R., He, Z., He, L., Awange, J., Song, Y., Wang, B., Wen, B., & Hu, J. (2025). Impact of Climate, Phenology, and Soil Factors on Net Ecosystem Productivity in Zoigê Alpine Grassland. Agronomy, 15(3), 685. https://doi.org/10.3390/agronomy15030685