Article

Effects of High Temperature at Grain Filling Stage on Grain Quality and Gene Transcription in Heat-Sensitive Versus Heat-Tolerant Rice Cultivars

1
College of Agronomy, Hunan Agricultural University, Changsha 410128, China
2
Hunan Provincial Key Laboratory of Rice and Rapeseed Breeding for Disease Resistance, Changsha 410128, China
3
Yuelushan Laboratory, Changsha 410128, China
*
Author to whom correspondence should be addressed.
These authors contributed equally to this work.
Agronomy 2025, 15(3), 668; https://doi.org/10.3390/agronomy15030668
Submission received: 26 January 2025 / Revised: 4 March 2025 / Accepted: 6 March 2025 / Published: 7 March 2025
(This article belongs to the Section Plant-Crop Biology and Biochemistry)

Abstract

:
There are many factors affecting rice yield and quality during cultivation, including temperature, light, water, and fertilization, among which high temperature (HT) is one of the main factors affecting rice yield and quality. However, less is known about the effects and potential mechanisms of different durations of HT stress during the grain filling stage on grain quality. In this study, the differences in rice quality and starch rapid viscosity analyzer (RVA) characteristics of eight indica rice varieties under different high-temperature treatment times were studied by simulating high temperature in an artificial climate chamber. The prolonged duration of HT leads to an overall deterioration in the milling quality, appearance quality, and cooking quality of rice. The impact of HT duration on the starch RVA characteristics of rice is more complex and is mainly related to the varieties. Among them, the starch RVA characteristics of R313 were more stable. It is worth noting that there is a significant difference in the sensitivity of the appearance quality of 8XR274 and 5W0076 to HT duration, with 8XR272 being more sensitive and 5W0076 being the opposite. We selected these two varieties for transcriptome analysis after 14 days of HT treatment and found that the number of differentially expressed genes (DEGs) in 8XR274 was significantly less than that in 5W0076. The DEGs of 8XR274 were mainly enriched in pathways related to carbohydrates, while 5W0076 was mainly enriched in pathways related to photosynthesis. Our study provides a new perspective on the molecular response and related genes of different rice varieties under high temperature, as well as the high-quality rice breeding under high temperature.

1. Introduction

Rice (Oryza sativa L.) is a globally important staple crop grown mainly in Asia; it accounts for 90% of global production, and its yield and quality are critical for global food security and nutritional well-being [1,2]. With the continuous growth of the global population and increasing food consumption, it is expected that by 2050, the market demand for food will surge by 35% to 56% compared with 2010 [3]. In recent years, due to the intensification of global warming and frequent occurrence of extreme temperature events, high temperature may be the main obstacle to the quality and yield of rice in the future [4,5]. In the process of rice cultivation, the grain filling and fruiting stage is a critical period for the formation of rice quality, and the physiological and metabolic activities of rice at this stage are exuberant and extremely sensitive to changes in environmental factors such as temperature and light [6,7,8]. The grain filling stage is a key period affecting grain filling and rice quality. The best daytime temperature for rice growth is 25~35 °C, and the best nighttime temperature is 20~25 °C [9]. When the external temperature exceeds the optimum temperature for rice growth, it will not only affect grain filling and greatly reduce yield but also lead to the deterioration of rice quality [10]. Studies have shown that for every 1 °C increase in global temperature, global rice production will decrease by an average of 3.2% [11]. In the main rice producing areas of South and Southeast Asia, rice production has been reduced by up to 10% due to rising temperatures [12]. It has been suggested that high-temperature weather significantly reduces rice quality, such as by causing an increase in the chalky grain rate and chalkiness degree and a decrease in the brown rice rate, milled rice rate, and head rice rate [12,13,14,15].
The quality of rice grains usually includes milling quality (MQ), appearance quality (AQ), eating and cooking quality (ECQ), and nutrition quality (NQ) [16,17,18]. The milling quality represents the state of grains after milling and is mainly determined by the brown rice rate, milled rice rate, and milled head rice rate [19,20]. High-temperature stress during the grain filling stage can reduce the activities of granule-bound starch synthase and soluble starch synthase in rice grains, resulting in inhibition of starch synthesis, decrease in the brown rice rate, milled rice rate, and milled head rice rate, and deterioration of milling quality [21,22]. The appearance quality is largely affected by the particle shape and endosperm turbidity (or chalkiness) [23]. Chalkiness is an undesirable trait that negatively affects milling, cooking, eating, and grain appearance and is a major problem in many rice-producing regions of the world [24,25]. High-temperature stress increases chalkiness and deteriorates grain appearance [26]. There are many reasons for the effect of high temperature on rice chalkiness. It has been reported that high temperature during grain filling can affect the storage of starch and protein, leading to the deposition of starch granules, thereby increasing the formation of chalkiness [27]. High temperature can also lead to abnormal starch granule structure, affecting the arrangement of starch granules during the development of endosperm cells [28,29]. Moreover, high temperature can also alter the content and composition of endosperm starch [30]. In addition, amylopectin is also an important factor in the formation of chalkiness. High temperature changes the fine structure of amylopectin, increasing the proportion of long and short chains, resulting in an increase in chalkiness formation [31]. The eating and cooking quality of rice refers to the physical and chemical properties during cooking, such as swelling, water absorption, retrogradation, color (gloss and whiteness), gelatinization, morphology (particle structure and integrity), aroma, and palatability (viscosity, elasticity, and softness). The physical and chemical indicators include amylose content, gel consistency, and gelatinization temperature [32,33]. Recently, the cooked rice elongation has also been considered as one of the important indicators for evaluating rice cooking quality [34]. The effect of high temperature during the grain filling stage on the cooking quality of rice is mainly reflected in the change in amylose content [35]. It has been observed that high temperature during the grain filling stage can reduce the amylose content of rice [36].
The pasting characteristics of starch are usually measured by a rapid viscosity analyzer (RVA) and are an important factor in the ECQ (cooking quality) of rice. The RVA curve is the pasting curve of rice flour produced during the heating–cooling process [37]. The peak viscosity, breakdown value, setback value, and recovery value are closely related to the eating and cooking quality of rice and are used as important indicators for evaluating rice quality [38,39,40]. Among them, a high breakdown value indicates good gel consistency [41]. Setback viscosity reflects the degree of degradation or hardening of starch during cooling [42]. The RVA characteristics of rice are mainly controlled by genetics; however, they are also influenced by the interaction between genotype and environment [43].
This study investigated the effects of high-temperature treatment at different times during the grain filling stage on the rice quality and starch RVA characteristics of eight indica rice varieties. Two rice varieties, 8XR274 (appearance quality, sensitivity to high temperature) and 5W0076 (appearance quality, insensitivity to high temperature), were selected. Through RNA sequencing, the complex molecular responses of these two rice varieties to high temperature were analyzed. The results of this study help to explain the complex regulatory mechanisms of changes in rice appearance quality under high-temperature stress and to provide a reference for the breeding of heat-tolerant and high-quality rice varieties.

2. Materials and Methods

2.1. Plant Material and Experiment Design

Eight indica rice varieties, namely 8XR274, Huazhan, 5W0076, ZH535, Huanghuazhan, R751, R313, and Yuewangsimiao (YWSM), were used in our study. All plants were planted in May 2021 at the Rice Research Institute of Hunan Agricultural University. They were sown on 22 April and transplanted into pots on 23 May, with 16 pots per variety and 8 plants per pot. Among them, 12 pots were used for high-temperature treatment, and 4 pots grew under optimum temperature, with each treatment repeated twice. On the 14th day after panicle differentiation, the test materials were first transferred to an artificial climate chamber for high-temperature treatment, and then transferred to optimum temperature after 7, 14, and 21 days of treatment, respectively. After maturity, the harvested grains were dried to about 13% moisture and stored at room temperature for 2 months to determine milling quality, appearance quality, eating and cooking quality and starch RVA characteristics.
The high-temperature treatment in the artificial climate chamber was divided into 8 temperature ranges (Table 1), with a daily average temperature of 32.75 °C. The highest temperature during the period of 12:00–15:00 was 38 °C, and the lowest temperature during the period of 24:00–3:00 was 29 °C. The duration of illumination was 12 h per day (7:00–19:00), with a light intensity of 30,000 lux and a relative humidity of 65%.
The optimal temperature treatment settings for the artificial climate chamber were as follows (Table 2): two temperature ranges, with a daily average temperature of 27.5 °C, a daily maximum temperature of 30 °C, and a daily minimum temperature of 25 °C. The relative humidity was 65%.

2.2. Determination of Milling Quality

The standard for evaluating the milling quality of rice is the national standard of China GB/T17891-2017 (https://openstd.samr.gov.cn/bzgk/gb/newGbInfo?hcno=56C97D505F4880DE76E2D49C7DA0C872, accessed on 16 November 2021) [44]. Briefly, 25 g of rice was weighed, and the JLGJ-45 huller (Taizhou Luqiao Jingao Grain Equipment Factory, Taizhou, China) was used to remove the husk and calculate the brown rice rate. Then, the brown rice underwent milling with a JNNJ3B inspection rice milling machine (Hangzhou Daji Optoelectronics Instrument Co., Ltd., Hangzhou, China) to ascertain the milled rice rate.

2.3. Determination of Appearance Quality

Two groups of samples were randomly selected, each containing 25 g of polished rice grains, and the Wanshen SC-E Rice Appearance Quality Analyzer (Wanshen Detection Technology Co., Ltd., Hangzhou, China) was used for image processing. The analysis was conducted to determine chalkiness (the percentage of chalky area in the rice grain relative to the projected area of the rice grain) and the chalky grain percentage (the percentage of chalky grains in the rice grain). The criteria for evaluating chalkiness were a chalkiness area exceeding 30 pixels and a chalkiness surface area exceeding 10%.

2.4. Cooking Quality

Amylose content (AC) was determined using the ISO 6647-2 method [45]. The method was to weigh 100 ± 0.2 mg rice flour samples and standard samples, shake gently, mix fully, add 1 mL of absolute ethanol and 9 mL of 1 M NaOH, then incubate at 37 °C overnight for nitrification. Next, 0.2% potassium iodide solution was added for color development, and the OD value was measured at 620 nm. The AC content in the test samples was calculated based on the AC content of the standard sample.
Gelatinization temperature (GT) was determined by evenly placing 6 transparent and full head rice samples into a 5 cm × 5 cm × 2 cm square box, adding 10 mL of 70% KOH, and covering it with a lid. The box was incubated at 30 ± 2 °C for 23 h, and the endosperm decomposition was observed. The degree of decomposition was used as the main basis for GT classification.
The measurement method for gel consistency (GC) was to weigh 100 ± 0.2 mg of rice flour sample in the test tube after balancing the moisture, add 2 mL of 0.2 mL/L thymol blue solution, vortex and shake evenly, then add 2 mL of 0.2 mol/L KOH and shake evenly. The test tube was then placed in a boiling water bath, covered with glass beads for cooking, then removed in the order in which it was placed, cooled at room temperature for 5 min, and then placed in an ice water bath for 20 min. Finally, it was placed at a constant temperature of 25 °C for 1 h, and the gel length in the test tube was measured.
Cooked rice elongation (CRE) was measured by randomly selecting 10 head rice samples and measuring the length of the whole milled rice (L0) with a vernier caliper. The 10 head rice samples were placed in a 10 mL test tube and filled with distilled water. After standing at room temperature for 30 min, they were placed in 100 °C boiling water for 10 min. Then, the rice grains were taken out from the test tube and placed on filter paper for 3 h. Finally, the length of the rice grains (L1) was measured using a vernier caliper. The cooked rice elongation was calculated according to Formula (1):
Cooked rice elongation = (L1 − L0)/L0 × 100

2.5. Determination of Viscosity of Rice Starch

The properties of the rice paste were determined with a rapid viscosity analyzer (RVA, 3-D, Newport Scientific, Warriewood, Australia). Rice flour (3 g, 12% m.b.) and 25 mL of double distilled water were added to the RVA sample container. Thermoceline for Windows software (version 1.2) was used to perform RVA. Using the procedure of rice method 1, a series of heating and cooling stages were included: hold at 50 °C for one minute, reach 95 °C within three minutes, hold at 95 °C for two and a half minutes, then cool to 50 °C in three minutes, and finally stabilize at 50 °C in one minute. During the first 10 s of the experiment, the rotation rate of the RVA blade was maintained at 960 revolutions per minute and then increased to 160 revolutions per minute. The measurements of peak viscosity (PV), hot paste viscosity (HPV), cool paste viscosity (CPV), breakdown value (BDV = PV − HPV), setback value (SBV = CPV − PV), and recovery value (RV = CPV − HPV) were collected using the Thermocline for Windows software (version 1.2).

2.6. RNA Extraction and Sequencing

Total RNA was extracted using a total RNA rapid extraction kit (BioTeke, Beijing, China, product number: RP3302). Strict quality control was carried out on the RNA samples. The quality control method mainly used the Agilent 2100 bioanalyzer (Shanghai Asiagene Technology Co., Ltd., Shanghai, China) to accurately detect RNA integrity, with RNA integrity and total amount as the main reference indicators. The initial RNA of the sequencing library was total RNA, and the mRNA with polyA tail was enriched by oligo (dT) magnetic beads; then, the obtained mRNA was randomly interrupted with divalent cations in the fragmentation buffer. The database was built according to the NEB ordinary database construction method [46]. After the library inspection was qualified, Illumina sequencing was performed after pooling different libraries according to the effective concentration and data volume requirements, and the sequencing depth was 15×. The reference genome was rice variety R498 (http://www.mbkbase.org/R498, accessed on 6 January 2022). The index of the reference genome was constructed using HISAT2v2.0.5, and the paired-end clean reads were compared with the reference genome using HISAT2v2.0.5. The resulting result files could be visualized using the Integrative Genomics Viewer (IGV) browser (version 2.19.2) in combination with the species reference genome and annotation files. FeatureCounts (version 1.5.0-p3) was used to count the reads of each gene, representing the basic expression of the gene, and fragments per kilobase of transcript per million mapped reads (FPKM) was used to standardize each gene, making it comparable between the two varieties and the populations.

2.7. Principal Component Analysis

Principal component analysis (PCA) uses a linear algebraic calculation method to reduce the dimension of tens of thousands of genetic variables and extract principal components. We performed PCA analysis on the FPKM of all the samples and drew the PCA diagram.

2.8. RNA-Seq Analysis

Differential expression analysis between the two comparison combinations was performed using DESeq2 software (version 1.20.0), and |Log2 Fold Change| > 1 and p < 0.05 were used as screening criteria. Benjamini and Hochberg’s method was used to adjust the resulting p value to control the false discovery rate (FDR). ClusterProfiler software (version 3.8.1) was used to perform Gene Ontology (GO) enrichment and Kyoto Encyclopedia of Genes and Genomes (KEGG) enrichment analysis on the DEGs. GO and KEGG terms with p < 0.05 were significantly enriched. The RNA-Seq data were deposited in the National Center for Biotechnology Information (NCBI) Sequence Read Archive (SRA) database with accession number PRJNA1215037.

2.9. Real-Time Fluorescence Quantitative PCR (qRT-PCR) Validation

The cDNA was used as a template for qRT-PCR reaction on a real-time fluorescence quantitative system CFX96TM C1000 thermal cycler (Bio-Rad Laboratories Co., Ltd., Hercules, CA, USA). The reaction system was 10 μL, including 2 μL of cDNA; 5 μL of 2 × SYBR Green Fast qPCR Mix; 0.5 μL of primers (F + R); and 2.5 μL of ddH2O. Each sample included 3 biological replicates. The rice gene OsActin1 (LOC_Os03g50885) was used as an internal reference gene. The relative expression values of the different genes were calculated using the 2−∆∆Ct method.

2.10. Data Processing and Statistical Analysis

The raw data of the experiment were processed using Microsoft Excel 2010; significance analysis was carried out using the DPS data processing system. One-way analysis of variance and the T-test were used to determine whether there was a statistically significant difference between the mean values (p < 0.05), and multiple comparisons were performed using the LSD method.

3. Results and Discussion

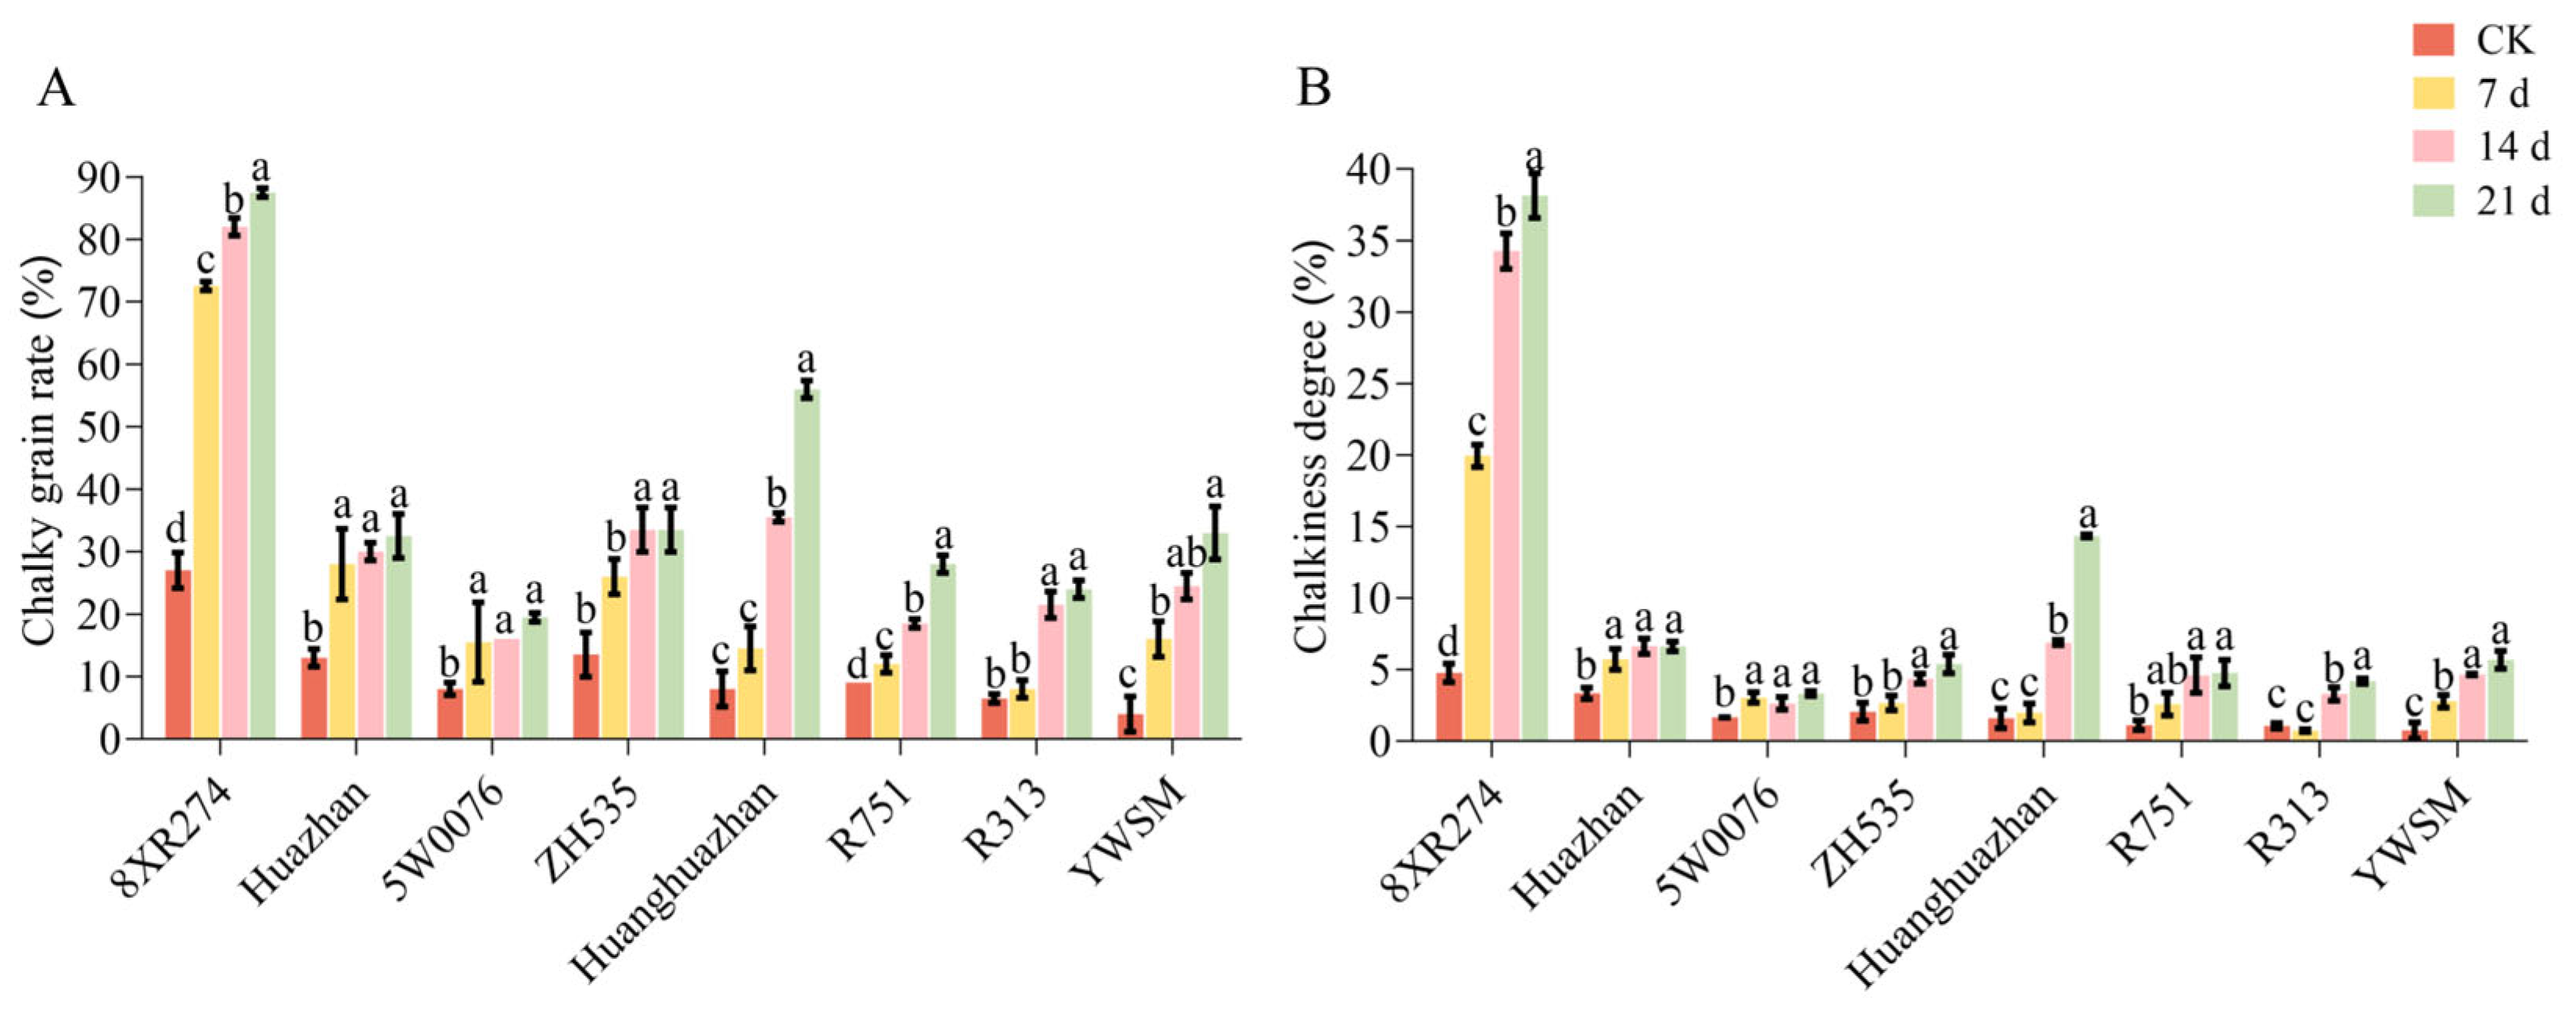
3.1. Effects of Different High-Temperature Durations on Rice Appearance Quality and Milling Quality

Chalkiness is an important index to evaluate the appearance quality of rice, including chalky grain rate and chalkiness degree [47]. High temperature (HT) will accelerate the grain filling process of rice, resulting in insufficient accumulation of grain starch, irregular arrangement of starch grains, and increased chalkiness [26,48]. To investigate the effects of different HT durations on the rice appearance quality, the chalky grain rate and chalkiness degree of eight indica rice varieties under different time treatments were compared. Although all the materials showed a continuous increasing trend in the chalky grain rate under HT stress, 8XR274 and Huanghuazhan were the most affected (Figure 1A). After 7, 14, and 21 days of HT treatment, the chalky grain rate of 8XR274 increased by 45.50%, 55.00%, and 60.50%, respectively; and for Huanghuazhan, it increased by 6.50%, 27.50%, and 48.00%, respectively. The rice varieties 5W0076, R751, and R313 were less sensitive to HT, with an increase in chalky grain rate of less than 20%. Like the chalky grain rate, the chalkiness degree of the test varieties also showed a continuous increase with the extension of HT time (Figure 1B). Among them, the increase of 8XR274 was the largest; it increased by 15.17%, 29.49%, and 33.37% after 7, 14, and 21 days of HT treatment. Conversely, 5W0076 showed the smallest increases, with increases of 1.39%, 0.98%, and 1.67%. It was worth noting that the increase in the chalkiness degree of Huazhan, ZH535, R751, R313, and YWSM was also relatively small, and the increase after 21 days of HT treatment was less than 5%. Collectively, the chalky grain rate and chalkiness degree of the test varieties increased in proportion to the length of HT treatment. And the appearance quality of 8XR274 exhibited the greatest sensitivity to HT. Conversely, 5W0076 was the most insensitive to HT.
Studies have shown that compared with the appearance of high-quality rice, the structure of low-quality rice is loose and porous, making it easy to break during processing, resulting in a decrease in the head rice rate [49,50]. We found that, with the extension of HT time, the head rice rate of each variety showed a significant downward trend (Figure S1A). Furthermore, other milling quality indicators, such as the brown rice rate and milled rice rate, were less affected by HT treatment compared with the milled head rice rate, but with the HT time prolonged, the milled rice rate still showed a decreasing trend to varying degrees (Figure S1B,C).

3.2. Effect of Different HT Treatment Time on Rice Cooking Quality

Changes in the appearance quality of rice are often accompanied by changes in its cooking quality [51]. Several key indicators of cooking quality, such as amylose content, gelatinization temperature, gel consistency, and cooked rice elongation, collectively determine the texture, taste, and flavor quality of rice. Generally, rice with good cooking quality has lower amylose content and gelatinization temperature, higher gel consistency, and lower cooked rice elongation [32,33,52]. We found that there was no obvious regularity in the effect of HT treatment on the amylose content of the tested varieties during the filling stage (Figure 2A). Except for Huazhan, most of them displayed a decrease in gelatinization temperature with the increase in HT time, while the gel consistency showed a trend of increasing first and then decreasing in 8XR274, Huazhan, 5W0076, and YWSM (Figure 2B,C). Furthermore, HT treatment at the filling stage had a relatively small impact on the grain length of the head rice, but significantly reduced the cooked rice length of 5W0076, ZH535, Huanghuazhan, R751, R313, and YWSM, resulting in an increase in cooked rice elongation in 8XR274 and a decrease in the rest of the varieties (Figure 2D–F). These results suggested that the cooking quality of Huazhan, Huanghuazhan, R751, and 5W0076 was less affected by HT during the grain filling stage. In contrast, the cooking quality of 8XR274 showed specificity after HT treatment.

3.3. Effect of Different HT Time Treatments on Physicochemical Properties of Starch

The RVA profile characteristic value of starch is usually used to analyze the physicochemical properties of starch, which are important factors affecting the cooking quality of rice [37]. In this study, the peak viscosity, hot paste viscosity, and cool paste viscosity of 8XR274 increased with the extension of HT treatment time; R751 showed a trend of decreasing first and then increasing (Table 3). In terms of peak viscosity, Huazhan, 5W0076, Huanghuazhan, and R313 showed an upward trend with the HT treatment time; ZH535 and YWSM decreased and increased first, respectively, but returned to the control level after 21 days of HT treatment. With regard to hot paste viscosity, Huazhan and ZH535 decreased first, while Huanghuazhan and R313 increased first. However, after 21 days of HT treatment, these four varieties returned to the control level. 5W0076 showed a downward trend; YWSM did not decrease until the HT treatment time reached 21 days. As for cool paste viscosity, under different HT treatment times, Huazhan and Huanghuazhan showed an upward trend; 5W0076 increased first and then returned to the control level; ZH535 showed a trend of decreasing first and then increasing, while YWSM showed the opposite trend; R751 only increased at 21 days; R313 increased first, then decreased and then increased again. With respect to peak time, except for 8XR274, HT treatment had no significant effect on the other varieties; 8XR274 decreased first and then returned to the control level. Regarding peak temperature, HT treatment had no significant effect on 8XR274, Huazhan, 5W0076, and ZH535; Huanghuazhan decreased first with the prolongation of HT treatment time and then returned to the control level. R751, R313, and YWSM decreased until the HT treatment time reached a certain length.
With the extension of HT time in the filling stage, the breakdown value of Huazhan, 5W0076, and Huanghuazhan showed an upward trend; ZH535, R751, and R313 showed a trend of decreasing first and then increasing; 8XR274 and YWSM increased first and then returned to the control level. Interestingly, after 7 days of HT treatment, Huazhan, 5W0076, Huanghuazhan, and R313 showed stable breakdown values.
HT treatment had no significant effect on the setback value of 8XR274 during the grain filling stage. Huazhan did not decrease until the HT treatment time reached 21 days. With the HT time, the setback value of R751 showed an upward trend, while 5W0076, Huanghuazhan, R313, and YWSM showed the opposite trend.
In addition, the impact of HT treatment on the recovery value of the tested varieties was more complicated. The recovery value of 8XR274 and YWSM increased first and then returned to the control level; Huazhan and 5W0076 showed an upward trend with the HT time, while ZH535 and Huanghuazhan showed the opposite trend; R751 did not rise until the HT treatment time reached 21 days; R313 decreased first and then returned to the control level.

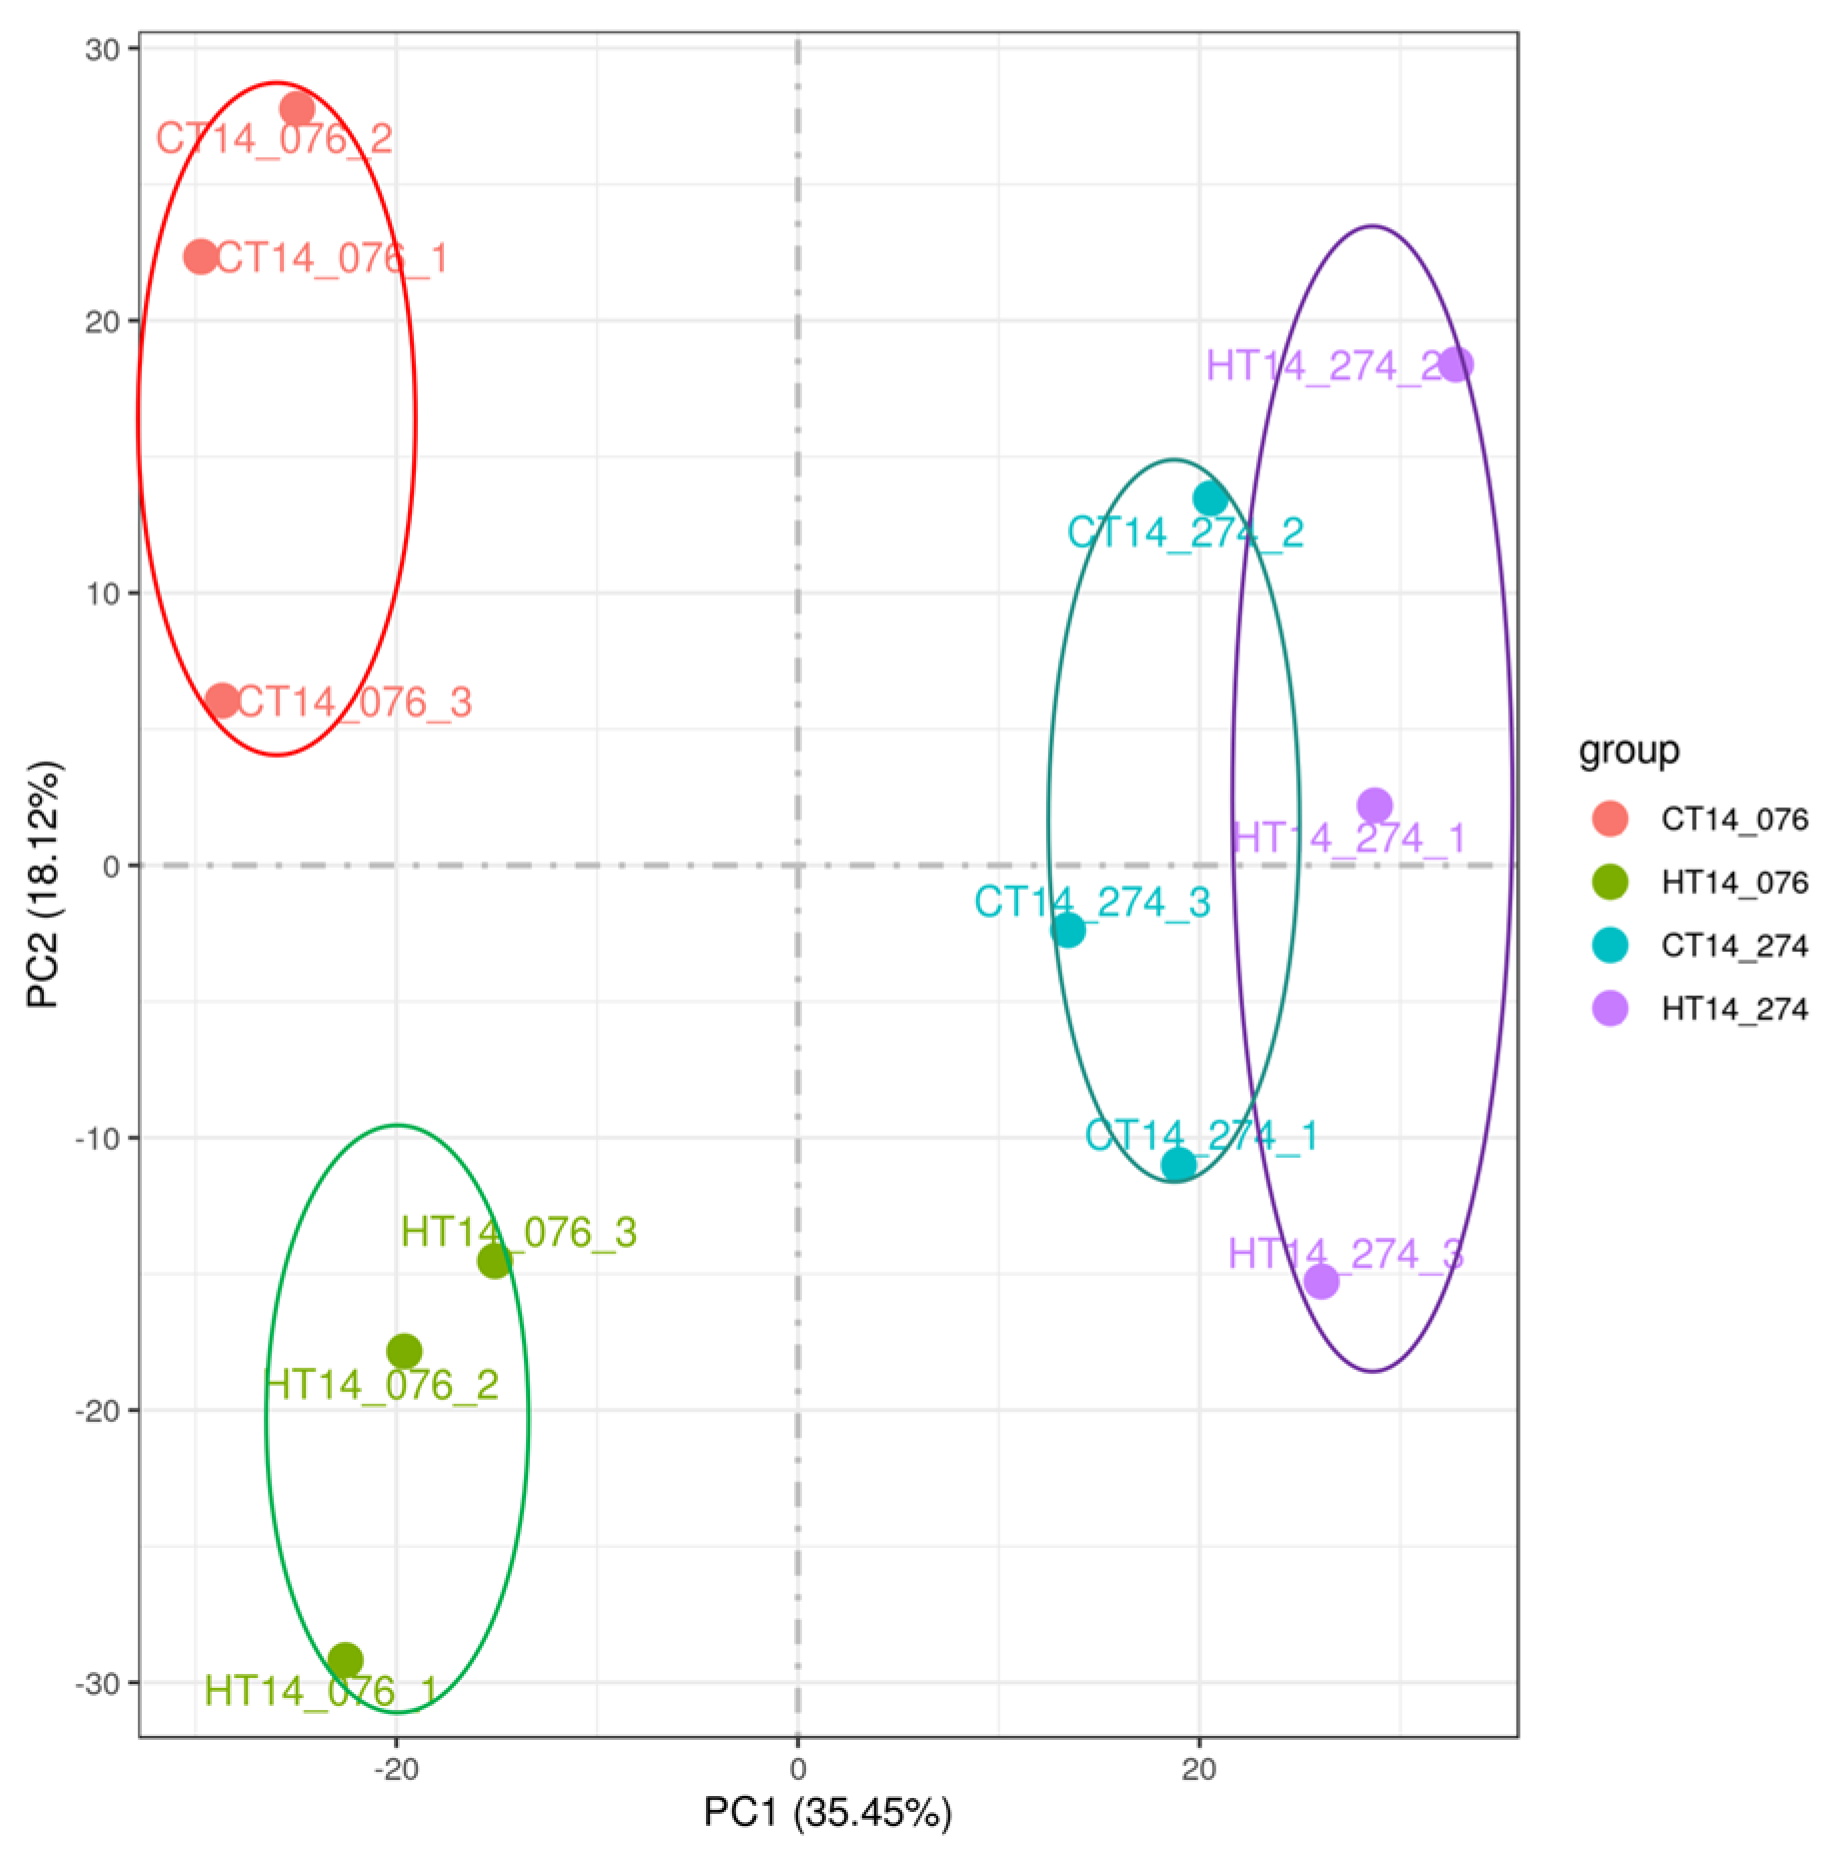
3.4. Principal Component Analysis of Transcriptome of 8XR274 and 5W0076

According to the appearance quality data under HT stress (Figure 1), the rice varieties 8XR274 and 5W0076 were classified as heat-sensitive and heat-tolerant varieties, respectively. To further reveal the molecular mechanisms by which these two different varieties regulate HT responses, transcriptome analysis was conducted using RNA sequencing technology (RNA-Seq). The 8XR274 and 5W0076 grains treated with or without high temperature for 14 days were used for RNA-Seq.
Principal component analysis (PCA) is commonly used to evaluate inter-group differences and intra-group sample repetition [53]. We found that the samples between 8XR274 and 5W0076 had good differences, and the same variety also had good differences between the different treatments. The differences among the three biological replicates within the same treatment were relatively small, indicating that the experimental data are reliable and can be further analyzed for differentially expressed genes (DEGs) (Figure 3).

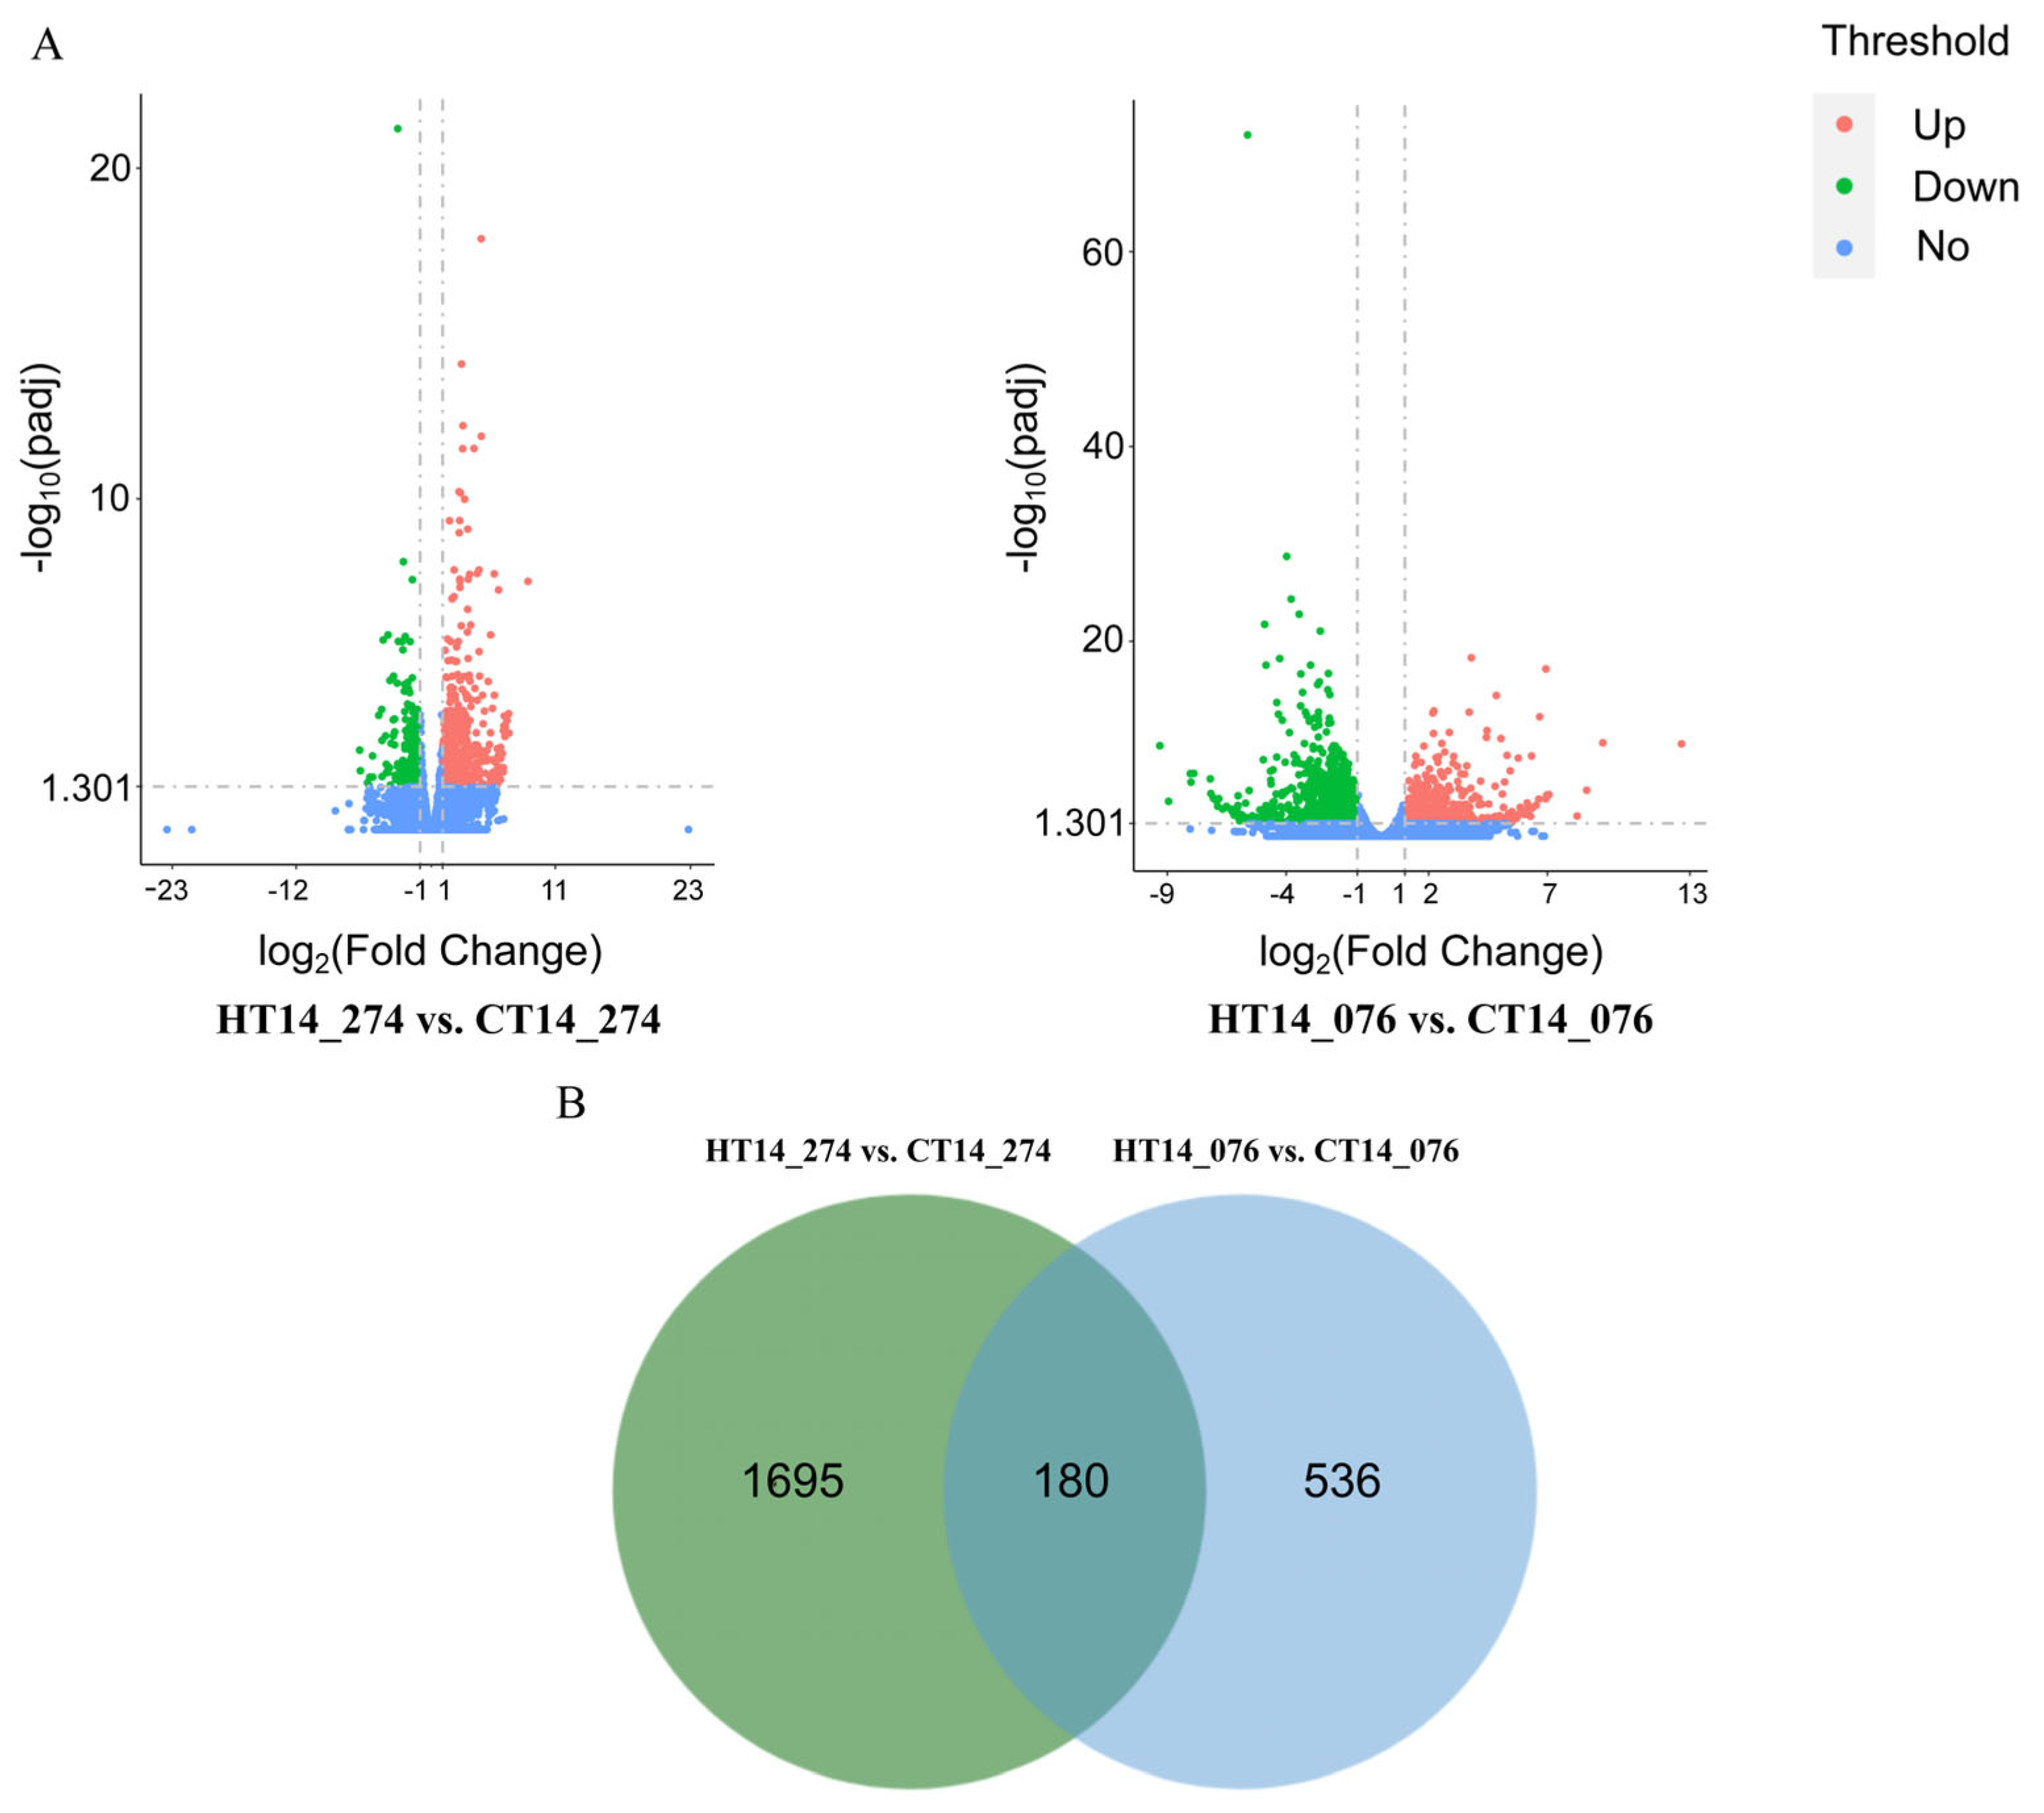
3.5. Identification of DEGs Between 8XR274 and 5W0076

Differential expression analysis was performed on the sequencing results of four treated rice samples using DEGseq. The high-temperature treatment of 8XR274 and 5W0076 was compared with the optimum temperature treatment, and the screening criteria were |Log2 Fold Change| > 1 and p < 0.05. The results showed that the number of DEGs in the heat-sensitive variety 8XR274 was significantly smaller than that in the heat-tolerant variety 5W0076 (Figure 4A). Specifically, a total of 716 DEGs were identified in 8XR274 after HT treatment, of which 497 were up-regulated and 219 were down-regulated. A total of 1875 DEGs were identified in 5W0076, of which 844 were up-regulated and 1031 were down-regulated. In 8XR274, the number of up-regulated DEGs was greater than that of the down-regulated DEGs, while 5W0076 was the opposite. Comparative analysis of the DEGs between the two varieties revealed that 8XR274 and 5W0076 co-expressed 180 DEGs (Figure 4B).

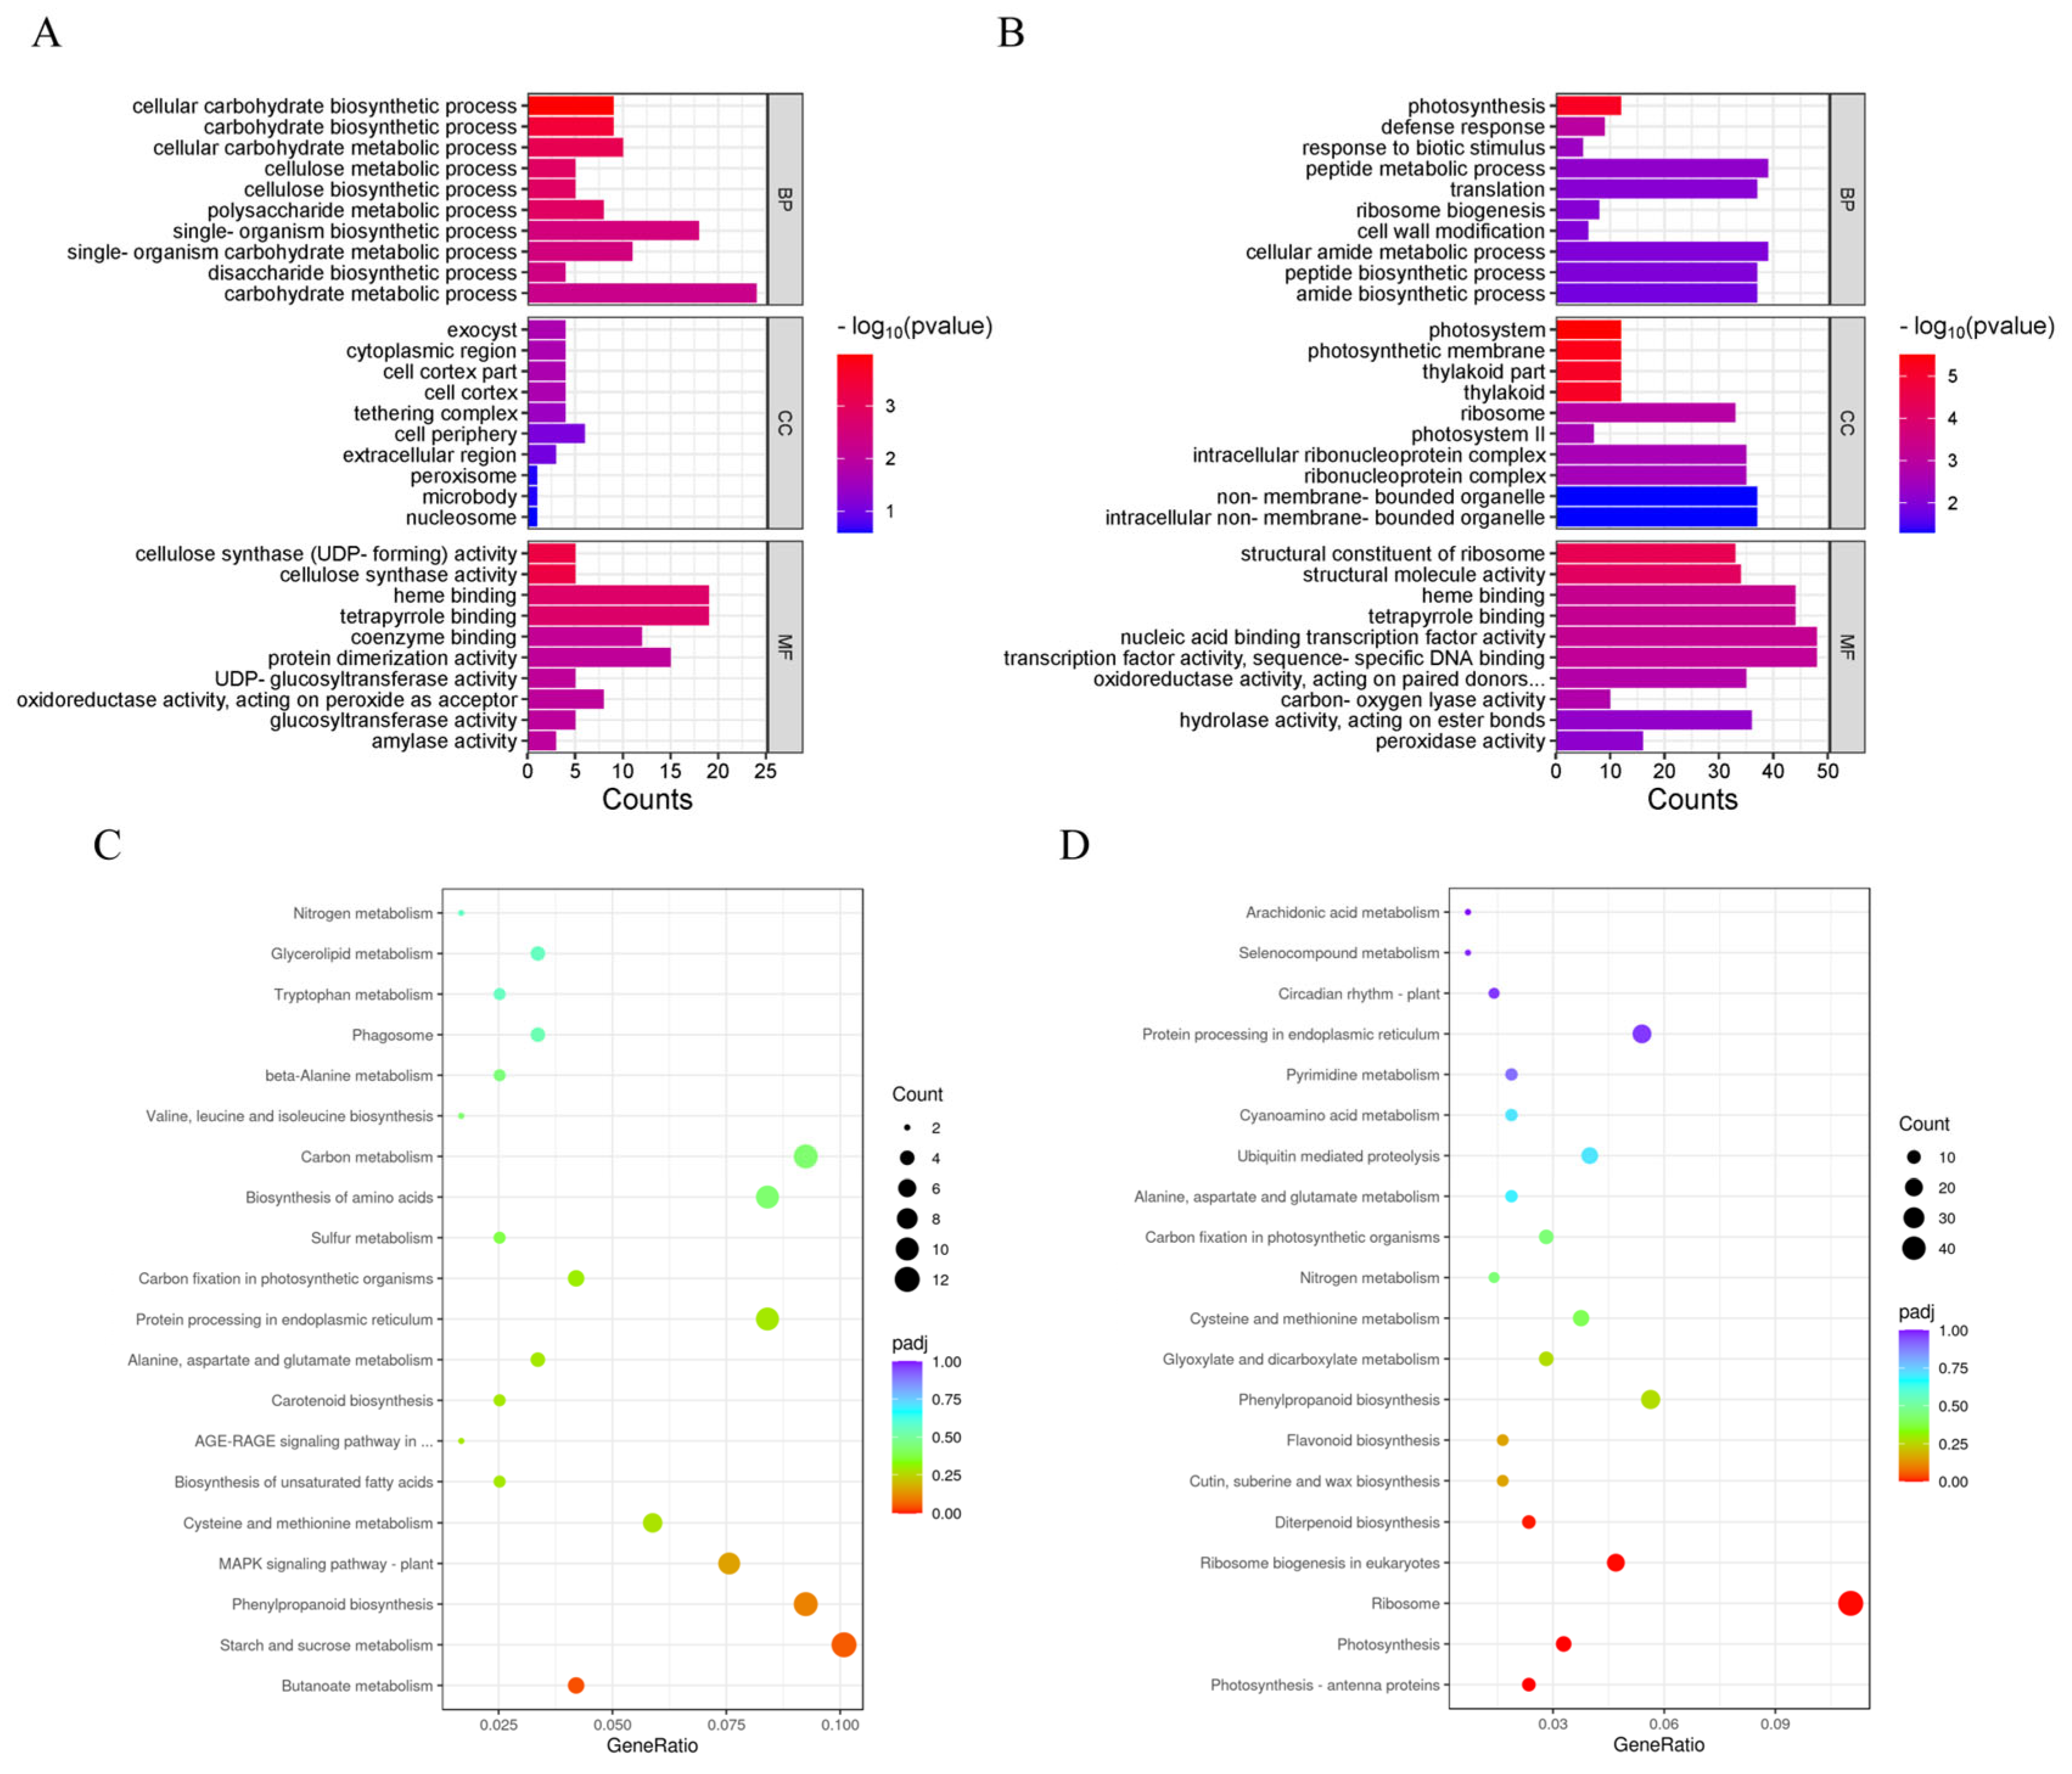
3.6. GO and KEGG Enrichment Analysis of DEGs Between 8XR274 and 5W0076

We performed Gene Ontology (GO) annotation classification and enrichment analysis of the DEGs of 8XR274 and 5W0076. Among them, the annotated GO entries included three parts: various biological processes (BPs), cellular components (CCs), and molecular functions (MFs). The first 10 GO terms were selected for each part of each group. Enrichment analysis of the DEGs in the heat-sensitive variety 8XR274 showed that the most significant category for BPs was the “cellular carbohydrate biosynthesis process” (GO:0034637); the category with the largest number of enriched DEGs was “carbohydrate metabolic process” (GO:0005975). In terms of CCs, the most significant categories were “exocyst” (GO:0000145), “cell cortex” (GO:0005938), “cell cortex part” (GO:0044448), and “cytoplasmic region” (GO:0099568); the category with the largest number of enriched DEGs was “cell periphery” (GO:0071944). In terms of MFs, the most significant categories were “cellulose synthase activity” (GO:0016759) and “cellulose synthase (UDP-forming) activity” (GO:0016760); the categories with the largest number of enriched DEGs were “heme binding” (GO:0020037) and “tetrapyrrole binding” (GO:0046906) (Figure 5A). Enrichment analysis of DEGs in the heat-tolerant variety 5W0076 showed that the most significant category was “photosynthesis” (GO:0015979); the categories with the largest number of enriched DEGs were the “peptide metabolic process” (GO:0006518), and “cellular amide metabolic process” (GO:0043603). In terms of CCs, the most significant category was “photosystem” (GO:0009521); the categories with the largest number of enriched DEGs were “non-membrane-bounded organelle” (GO:0043228) and “intracellular non-membrane-bounded organelle” (GO:0043232). In terms of MFs, the most significant category was “structural constituent of ribosome” (GO:0003735); the categories with the largest number of enriched DEGs were “nucleic acid binding transcription factor activity” (GO:0001071), “transcription factor activity, and sequence-specific DNA binding” (GO:0003700) (Figure 5B).
In order to further understand the function of DEGs, we also performed KEGG enrichment analysis to estimate the number of DEGs contained in 8XR274 and 5W0076 in different categories of KEGG pathways. According to the KEGG database (https://www.kegg.jp/, accessed on 3 April 2022), the DEGs were annotated, and the significant enrichment standard of the KEGG enriched pathway was set to p < 0.05. The top 20 KEGG pathway categories in each group are shown in Figure 5C,D. In 8XR274, the DEGs were significantly enriched in the “butanoate metabolism” (osa00650) category; the category with the largest number of enriched DEGs was “starch and sucrose metabolism” (osa00500); there was also more DEG enrichment in the “carbon metabolism” (osa01200) category. In 5W0076, the DEGs were significantly enriched in the category of “photosynthesis-antenna proteins” (osa00196); the category with the largest number of enriched DEGs was “ribosomal” (osa03010). Combined with the results of the GO and KEGG enrichment analysis, we found that, in 8XR274 and 5W0076, the DEGs were mainly enriched in the “carbohydrate”- and “photosynthesis”-related pathways, respectively.

3.7. Involvement of Genes Related to “Carbohydrate” and “Photosynthesis” in Response of Rice Appearance Quality to HT

To explore the correlation between the differences in the regulation of the “carbohydrate” and “photosynthesis” pathways and the sensitivity of rice appearance quality to high temperature, we drew the expression heatmaps of the DEGs associated with each pathway. A total of 24 DEGs related to “carbohydrate” were identified (Figure 6A). In 8XR274, most of the DEGs were up-regulated after HT stress, with only 5 DEGs down-regulated, while in 5W0076, 14 DEGs were up-regulated and 10 DEGs were down-regulated. Among the 14 up-regulated DEGs in the two varieties, the fold changes of most of the DEGs in 8XR274 were higher than those in 5W0076. For the five DEGs down-regulated in both varieties after high-temperature stress, the fold changes of most of the DEGs in 8XR274 were also higher than those in 5W0076. It is worth noting that five DEGs had opposite expression patterns at high temperatures. Among them, the five DEGs up-regulated by 8XR274 and down-regulated by 5W0076 were OsR498G0204464600.01, OsR498G0917279900.01, OsR498G0714546500.01, OsR498G0202934300.01, and OsR498G0409505000.01, respectively.
For the “photosynthesis” pathway, a total of 38 related DEGs were identified (Figure 6B). After high-temperature stress, most of the DEGs in 5W0076 were down-regulated, with only one up-regulated, while in 8XR274, 14 DEGs were up-regulated and 24 DEGs were down-regulated. The only up-regulated DEG showed a much higher fold change in 5W0076 compared to 8XR274. As for the 24 DEGs down-regulated in both varieties, the fold changes of these DEGs in 5W0076 were higher than those in 8XR274. In 8XR274 and 5W0076, 14 DEGs exhibited opposite expression patterns at high temperatures. The 14 DEGs were down-regulated in 5W0076, and the opposite was the case in 8XR274, namely OsR498G0713510500.01, OsR498G0815087200.01, OsR498G0713515500.01, OsR498G0714939800.01, OsR498G0305924900.01, OsR498G0511332700.01, OsR498G0612275900.01, OsR498G1119689900.01, OsR498G0408688400.01, OsR498G0816159000.01, OsR498G0714623900.01, OsR498G1221348500.01, OsR498G0408010700.01, OsR498G0509891000.01. All these results indicated that specific DEGs related to “carbohydrate” and “photosynthesis” were actively involved in the response of rice appearance quality to HT stress during the grain filling stage.
In order to verify the results of RNA-Seq, we randomly selected six genes from these two pathways for qRT-PCR analysis based on the heatmap results. As shown in Figure 6C, the relative trend of the expression profile in qRT-PCR was consistent with the RNA-Seq data (Figure 6C). After high-temperature stress, the expression of OsR498G0204464600.01 was up-regulated in 8XR274, while the opposite was observed in 5W0076; OsR498G0917611900.01 was up-regulated in 8XR274 and 5W0076, with 8XR274 showing a greater up-regulation; in 8XR274 and 5W0076, the expressions of OsR498G0100034600.01, OsR498G1221059300.01, OsR498G0713493200.01, and OsR498G0917206700.01 were down-regulated, with 5W0076 showing a greater degree of down-regulation.

4. Discussion

The situation in which high temperature endangers rice yield and quality is very serious. Since the beginning of the 21st century, rice in China has been subjected to varying degrees of high-temperature stress almost every year. In 2003, due to high temperature and heat damage, the damaged area of the Yangtze River Basin in China reached 30 million hm2, with a loss of 50 million tons of rice and an economic loss of nearly CNY 10 billion, causing the national rice production to drop that year to the lowest point in nearly 20 years [54]. Extreme high temperatures have damaged not only rice but also the yields of food crops such as wheat, corn, and soybeans. Studies have shown that for every 1 °C increase in global average temperature, the global wheat, corn and soybean yields will decrease by 6.0%, 7.4%, and 3.1%, respectively, and the results vary greatly among different crops and geographical regions [11]. Therefore, the cultivation of high-temperature-tolerant crop varieties has increasingly become the focus of attention.
The quality of rice is not only controlled by genetic factors; it is also affected by environmental and cultivation conditions. Among them, high temperature during the grain filling stage has a great influence on rice quality. Many studies have shown that high temperature during the grain filling stage can significantly reduce rice quality. For example, two japonica rice varieties, Ningjing3 and Wuyunjing24, were exposed to elevated temperature in the open field, and the low-amplitude warming during grain filling reduced milling, appearance, and cooking quality [13]. In addition, it was found that during the growing season, for every 1 °C increase in average temperature, the yields of six common rice varieties in Arkansas decreased by 6.2%, the total milled rice yield decreased by 7.1~8.0%, the whole milled rice yield decreased by 9.0~13.8%, and the total milling income decreased by 8.1~11.0% [15]. The results of this study also showed that the appearance quality, milling quality, and cooking quality of rice exhibited a downward trend with the extension of the duration of high-temperature treatment during grain filling. The RVA characteristics of rice starch are also closely related to the cooking quality of rice. The varieties with good RVA characteristics have excellent cooking quality [37]. In terms of breakdown value, setback value, and recovery value, the variety R313 was identified for its stable RVA characteristics under continuous high temperature.
Among the many indicators of rice quality, appearance quality is the most intuitive indicator, which can be distinguished by the naked eye. It is the first sensory impression of rice by consumers. Therefore, the appearance quality of rice is closely associated with its commodity [17,55]. The appearance quality of rice is greatly affected by high-temperature stress. Therefore, selecting rice that can maintain good appearance quality under extreme temperature conditions is one of the most economical and effective ways to solve the problem of rice quality [56,57]. In this study, we found that the appearance quality of the two rice varieties 8XR274 and 5W0076 showed a great difference in sensitivity to high-temperature treatment. With the extension of treatment time, 5W0076 could maintain a more stable appearance quality than 8XR274. Through transcriptome sequencing of these two varieties, it was found that the number of DEGs in the heat-tolerant variety 5W0076 was higher than that in the heat-sensitive variety 8XR274, which may indicate that the response of 5W0076 under high-temperature stress is more complicated than that of 8XR274. Revealing the key mechanism of high-temperature tolerance in 5W0076 will be beneficial for breeding rice varieties with excellent appearance quality under high temperature.
High temperature leads to obvious changes in carbohydrate metabolism in various tissues of rice, resulting in low production and utilization efficiency of assimilates [58,59,60]. Moreover, high temperature inhibits the function of sucrose and starch synthase and causes great harm to rice yield and quality [61,62]. Even worse, high temperature significantly induces the reaction of the starch degradation enzyme, exacerbating starch shortage and promoting the production of highly chalky rice [61,63]. In this study, GO and KEGG enrichment analysis of the heat-sensitive variety 8XR274 showed that the DEGs were mainly enriched in carbohydrate-related pathways. In both varieties, regardless of whether the DEGs were up-regulated or down-regulated, the fold changes of most the DEGs in 8XR274 were higher than those in 5W0076. Interestingly, we found that among the five DEGs up-regulated by 8XR274 and down-regulated by 5W0076, OsR498G0202934300.01 and OsR498G0409505000.01 encoded glycoside hydrolases. It has been shown that glycoside hydrolases affect the carbohydrate metabolism of plastids [64]. The heat-resistant variety 5W0076 may maintain a sufficient net carbohydrate ratio under high temperature by decreasing the expression of carbohydrate metabolism genes, thereby reducing the damage of heat stress to its rice appearance quality.
High-temperature stress also affects the photosynthesis of rice plants. Plant photosynthesis is very sensitive to high temperature and is easily inhibited under high-temperature conditions [65]. Many photosynthetic processes, such as the electron transport chain, ATP synthesis, and carbon fixation, are altered when plants are exposed to high-temperature stress [66,67,68]. High temperature can even lead to the destruction of thylakoid membrane permeability, disintegration of thylakoid particles, a decrease in chlorophyll content, a change in photochemical reaction, and a decrease in photosynthetic rate [69,70,71]. The appearance quality of rice is closely related to photosynthesis, and there are different views on the effect of photosynthesis on the appearance quality of rice. Deng et al. (2021) proposed that shading stress during the grain filling stage could increase rice chalkiness and reduce rice appearance quality by regulating rice starch characteristics [72]. Conversely, Yang et al. (1998) deemed that reducing light at a specific period could effectively reduce the occurrence of chalkiness, thereby improving the appearance quality of rice [73]. The DEGs of the heat-tolerant variety 5W0076 were mainly enriched in photosynthesis-related pathways, with all but one down-regulated. There are 14 DEGs up-regulated in 8XR274 and down-regulated in 5W0076, among which 5 genes encode chlorophyll a/b-binding proteins, and they are OsR498G0511332700.01, OsR498G0612275900.01, OsR498G1119689900.01, OsR498G0408688400.01, and OsR498G0816159000.01. Chlorophyll a/b-binding proteins are important members of plant photosynthesis. They play an important role in capturing and transferring light energy, protecting light and dissipating excess energy, regulating the distribution of light energy in two photosystems and maintaining the structure of the thylakoid membrane [74,75,76]. Our study showed that the expression of chlorophyll a/b-binding protein genes was down-regulated in the heat-tolerant variety 5W0076 under continuous high-temperature conditions during the filling stage, indicating that it may reduce the photosynthetic intensity under high-temperature stress during the filling stage; thus, its appearance quality remains relatively stable. In summary, the high-temperature insensitivity of 5W0076 may be achieved by suppressing or decreasing the expression of carbohydrate- and photosynthesis-related genes.

5. Conclusions

The most effective method to cope with the threat of high-temperature stress is to cultivate rice varieties that are tolerant to high temperature. This study comprehensively compared the differences in rice quality and starch RVA characteristics among eight indica rice varieties under different high-temperature treatment times. During the grain filling period, as the high-temperature treatment time is prolonged, the appearance quality, processing quality, and cooking quality of the rice all decrease. The rice variety R313 was screened out, since it had stable RVA characteristics under continuous high temperature.
The appearance quality of the heat-tolerant variety 5W0076 has a more complex high-temperature response mechanism than the heat-sensitive variety 8XR274. Based on the results of the GO and KEGG enrichment analysis, the DEGs were mainly enriched in pathways related to “carbohydrates” and “photosynthesis” in 8XR274 and 5W0076, respectively. By plotting the relevant heatmap, it was found that the high-temperature insensitivity of 5W0076 may be achieved by inhibiting or reducing the expression of carbohydrate- and photosynthesis-related genes. There is a significant difference in the expressions of OsR498G0204464600.01, OsR498G0917611900.01, OsR498G0100034600.01, OsR498G1221059300.01, OsR498G0713493200.01, and OsR498G0917206700.01 between 8XR274 and 5W0076. It will be of great significance to explore the functional mechanisms of the six genes mentioned above under high temperature. Overall, this study found molecular response differences in the grain filling process of different indica rice varieties under high-temperature conditions, providing new ideas for breeding rice varieties that are insensitive to high temperature.

Supplementary Materials

The following supporting information can be downloaded at: https://www.mdpi.com/article/10.3390/agronomy15030668/s1, Figure S1: Effect of different durations of high temperature on milling quality of different rice varieties; Table S1: Primers used for qRT-PCR validation of selected genes.

Author Contributions

Y.G. and H.L.: investigation, writing—original draft, formal analysis. X.L.: conceptualization, supervision, validation, writing—review and editing. H.D.: resources, conceptualization, supervision, funding acquisition, writing—review and editing. J.Y.: investigation, formal analysis. Y.Z., X.M., Y.J. and Y.P.: investigation, writing—review and editing. Y.X. and G.Z.: methodology, validation, writing—review and editing. All authors have read and agreed to the published version of the manuscript.

Funding

This research was funded by the National Natural Science Foundation of China (32372204, 32172078, and U22A20502) and the Science and Technology Innovation Program of Hunan Province (2022RC1147).

Data Availability Statement

The original contributions presented in the study are included in the article; further inquiries can be directed to the corresponding author.

Conflicts of Interest

The authors declare no conflicts of interest.

References

  1. Fukagawa, N.K.; Ziska, L.H. Rice: Importance for global nutrition. J. Nutr. Sci. Vitaminol. 2019, 65, S2–S3. [Google Scholar] [CrossRef]
  2. Verma, V.; Vishal, B.; Kohli, A.; Kumar, P.P. Systems-based rice improvement approaches for sustainable food and nutritional security. Plant Cell Rep. 2021, 40, 2021–2036. [Google Scholar] [CrossRef]
  3. Cheng, P.; Zhang, Y.; Liu, K.; Kong, X.; Wu, S.; Yan, H.; Jiang, P. Continuing the continuous harvests of food production: From the perspective of the interrelationships among cultivated land quantity, quality, and grain yield. Humanit. Soc. Sci. Commun. 2025, 12, 46. [Google Scholar] [CrossRef]
  4. Lv, Z.; Zhu, Y.; Liu, X.; Ye, H.; Tian, Y.; Li, F. Climate change impacts on regional rice production in China. Clim. Change 2018, 147, 523–537. [Google Scholar] [CrossRef]
  5. Hieronymus, M.; Kalén, O. Sea-level rise projections for Sweden based on the new IPCC special report: The ocean and cryosphere in a changing climate. Ambio 2020, 49, 1587–1600. [Google Scholar] [CrossRef]
  6. Ma, B.; Zhang, L.; He, Z. Understanding the regulation of cereal grain filling: The way forward. J. Integr. Plant Biol. 2023, 65, 526–547. [Google Scholar] [CrossRef]
  7. Park, J.R.; Kim, E.G.; Jang, Y.H.; Kim, K.M. Screening and identification of genes affecting grain quality and spikelet fertility during high-temperature treatment in grain filling stage of rice. BMC Plant Biol. 2021, 21, 263. [Google Scholar] [CrossRef]
  8. Dou, Z.; Zhang, H.; Chen, W.; Li, G.; Liu, Z.; Ding, C.; Chen, L.; Wang, S.; Ding, Y.; Tang, S. Grain-filling of superior spikelets and inferior spikelets for japonica rice under low-amplitude warming regime in lower reaches of Yangtze River Basin. J. Agric. Sci. 2021, 159, 59–68. [Google Scholar] [CrossRef]
  9. Su, Q.; Rohila, J.S.; Ranganathan, S.; Karthikeyan, R. Rice yield and quality in response to daytime and nighttime temperature increase—A meta-analysis perspective. Sci. Total Environ. 2023, 1, 52–56. [Google Scholar] [CrossRef]
  10. Kumar, N.; Kumar, N.; Shukla, A.; Shankhdhar, S.C.; Shankhdhar, D. Impact of terminal heat stress on pollen viability and yield attributes of rice (Oryza sativa L.). Cereal Res. Commun. 2015, 43, 1–11. [Google Scholar] [CrossRef]
  11. Zhao, C.; Liu, B.; Piao, S.; Wang, X.; Lobell, D.B.; Huang, Y.; Huang, M.; Yao, Y.; Bassu, S.; Ciais, P.; et al. Temperature increase reduces global yields of major crops in four independent estimates. Proc. Natl. Acad. Sci. USA 2017, 114, 9326–9331. [Google Scholar] [CrossRef] [PubMed]
  12. Lyman, N.B.; Jagadish, K.S.; Nalley, L.L.; Dixon, B.L.; Siebenmorgen, T. Neglecting rice milling yield and quality underestimates economic losses from high-temperature stress. PLoS ONE 2013, 8, e72157. [Google Scholar] [CrossRef] [PubMed]
  13. Yang, T.; Xiong, R.; Tan, X.; Huang, S.; Pan, X.; Guo, L.; Zeng, Y.; Zhang, Z.; Zeng, Y. The impacts of post-anthesis warming on grain yield and quality of double-cropping high-quality indica rice in Jiangxi Province, China. Eur. J. Agron. 2022, 139, 126551. [Google Scholar] [CrossRef]
  14. Dou, Z.; Tang, S.; Chen, W.; Zhang, H.; Li, G.; Liu, Z.; Ding, C.; Chen, L.; Wang, S.; Zhang, H.; et al. Effects of open-field warming during grain-filling stage on grain quality of two japonica rice cultivars in lower reaches of Yangtze River delta. J. Cereal Sci. 2018, 81, 118–126. [Google Scholar] [CrossRef]
  15. Ambardekar, A.A.; Siebenmorgen, T.J.; Counce, P.A.; Lanning, S.B.; Mauromoustakos, A. Impact of field-scale nighttime air temperatures during kernel development on rice milling quality. Field Crops Res. 2011, 122, 179–185. [Google Scholar] [CrossRef]
  16. Custodio, M.C.; Cuevas, R.P.; Ynion, J.; Laborte, A.G.; Velasco, M.L.; Demont, M. Rice quality: How is it defined by consumers, industry, food scientists, and geneticists? Trends Food Sci. Technol. 2019, 92, 122–137. [Google Scholar] [CrossRef]
  17. Ward, R.; Spohr, L.; Snell, P. Rice grain quality: An Australian multi-environment study. Crop Pasture Sci. 2019, 70, 946–957. [Google Scholar] [CrossRef]
  18. Ahmed, F.; Abro, T.F.; Kabir, M.S.; Latif, M.A. Rice quality: Biochemical composition, eating quality, and cooking quality. In The Future of Rice Demand: Quality Beyond Productivity; Springer: Cham, Switzeland, 2020; pp. 3–24. [Google Scholar]
  19. Peng, B.; Liu, Y.; Qiu, J.; Peng, J.; Sun, X.; Tian, X.; Zhang, Z.; Huang, Y.; Pang, R.; Zhou, W.; et al. OsG6PGH1 affects various grain quality traits and participates in the salt stress response of rice. Front. Plant Sci. 2024, 15, 1436998. [Google Scholar] [CrossRef]
  20. Koutroubas, S.D.; Mazzini, F.; Pons, B.; Ntanos, D.A. Grain quality variation and relationships with morpho-physiological traits in rice (Oryza sativa L.) genetic resources in Europe. Field Crops Res. 2004, 86, 115–130. [Google Scholar] [CrossRef]
  21. Yao, D.; Wu, J.; Luo, Q.; Li, J.; Zhuang, W.; Xiao, G.; Deng, Q.; Lei, D.; Bai, B. Influence of high natural field temperature during grain filling stage on the morphological structure and physicochemical properties of rice (Oryza sativa L.) starch. Food Chem. 2020, 310, 125817. [Google Scholar] [CrossRef]
  22. Liu, W.; Yin, T.; Zhao, Y.; Wang, X.; Wang, K.; Shen, Y.; Ding, Y.; Tang, S. Effects of high temperature on rice grain development and quality formation based on proteomics comparative analysis under field warming. Front. Plant Sci. 2021, 12, 746180. [Google Scholar] [CrossRef] [PubMed]
  23. Morita, S.; Wada, H.; Matsue, Y. Countermeasures for heat damage in rice grain quality under climate change. Plant Prod. Sci. 2016, 19, 1–11. [Google Scholar] [CrossRef]
  24. Singh, N.; Sodhi, N.S.; Kaur, M.; Saxena, S.K. Physico-chemical, morphological, thermal, cooking and textural properties of chalky and translucent rice kernels. Food Chem. 2003, 82, 433–439. [Google Scholar] [CrossRef]
  25. Cheng, F.M.; Zhong, L.J.; Wang, F.; Zhang, G.P. Differences in cooking and eating properties between chalky and translucent parts in rice grains. Food Chem. 2005, 90, 39–46. [Google Scholar] [CrossRef]
  26. Yang, W.; Liang, J.; Hao, Q.; Luan, X.; Tan, Q.; Lin, S.; Zhu, H.; Liu, G.; Liu, Z.; Bu, S.; et al. Fine mapping of two grain chalkiness QTLs sensitive to high temperature in rice. Rice 2021, 14, 33. [Google Scholar] [CrossRef]
  27. Morita, S. Prospect for developing measures to prevent high-temperature damage to rice grain ripening. Jpn. J. Crop Sci. 2008, 77, 1–12. [Google Scholar] [CrossRef]
  28. Fan, X.; Li, Y.; Zhang, C.; Li, E.; Chen, Z.; Li, Q.; Zhang, Z.; Zhu, Y.; Sun, X.; Liu, Q. Effects of high temperature on starch fine structure during grain-filling stages in rice: Mathematical modeling and integrated enzymatic analysis. J. Sci. Food Agric. 2019, 99, 2865–2873. [Google Scholar] [CrossRef]
  29. Zhang, G.; Liao, B.; Li, B.; Cai, Z. The effect of high temperature after anthesis on rice quality and starch granule structure of endosperm. Meteorol. Environ. Res. 2016, 7, 72–75. [Google Scholar]
  30. Zhu, L.; Shah, F.; Nie, L.; Cui, K.; Shah, T.; Wu, W.; Chen, Y.; Chen, C.; Wang, K.; Wang, Q.; et al. Efficacy of sowing date adjustment as a management strategy to cope with rice (Oryza sativa L.) seed quality deterioration due to elevated temperature. Aust. J. Crop Sci. 2013, 7, 543–549. [Google Scholar]
  31. Umemoto, T.; Terashima, K.; Nakamura, Y.; Satoh, H. Differences in amylopectin structure between two rice varieties in relation to the effects of temperature during grain-filling. Starch-Stärke 1999, 51, 58–62. [Google Scholar] [CrossRef]
  32. Zhou, H.; Xia, D.; He, Y. Rice grain quality-traditional traits for high quality rice and health-plus substances. Mol. Breed. 2020, 40, 1. [Google Scholar] [CrossRef]
  33. Bao, J.; Deng, B.; Zhang, L. Molecular and genetic bases of rice cooking and eating quality: An updated review. Cereal Chem. 2023, 100, 1220–1233. [Google Scholar] [CrossRef]
  34. Qiu, X.; Yang, J.; Zhang, F.; Niu, Y.; Zhao, X.; Shen, C.; Chen, K.; Teng, S.; Xu, J. Genetic dissection of rice appearance quality and cooked rice elongation by genome-wide association study. Crop J. 2021, 9, 1470–1480. [Google Scholar] [CrossRef]
  35. Zhong, L.J.; Cheng, F.M.; Wen, X.; Sun, Z.X.; Zhang, G.P. The deterioration of eating and cooking quality caused by high temperature during grain filling in early-season indica rice cultivars. J. Agron. Crop Sci. 2005, 191, 218–225. [Google Scholar] [CrossRef]
  36. Chun, A.; Lee, H.J.; Hamaker, B.R.; Janaswamy, S. Effects of ripening temperature on starch structure and gelatinization, pasting, and cooking properties in rice (Oryza sativa). J. Agric. Food Chem. 2015, 63, 3085–3093. [Google Scholar] [CrossRef]
  37. Xuan, Y.; Yi, Y.; Liang, H.E.; Wei, S.; Chen, N.; Jiang, L.; Ali, I.; Ullah, S.; Wu, X.; Cao, T.; et al. Amylose content and RVA profile characteristics of noodle rice under different conditions. Agron. J. 2020, 112, 117–129. [Google Scholar] [CrossRef]
  38. Tao, K.; Yu, W.; Prakash, S.; Gilbert, R.G. Investigating cooked rice textural properties by instrumental measurements. Food Sci. Hum. Wellness 2020, 9, 130–135. [Google Scholar] [CrossRef]
  39. Pang, Y.; Ali, J.; Wang, X.; Franje, N.J.; Revilleza, J.E.; Xu, J.; Li, Z. Relationship of rice grain amylose, gelatinization temperature and pasting properties for breeding better eating and cooking quality of rice varieties. PLoS ONE 2016, 11, e0168483. [Google Scholar] [CrossRef]
  40. Tong, C.; Chen, Y.; Tang, F.; Xu, F.; Huang, Y.; Chen, H.; Bao, J. Genetic diversity of amylose content and RVA pasting parameters in 20 rice accessions grown in Hainan, China. Food Chem. 2014, 161, 239–245. [Google Scholar] [CrossRef]
  41. Han, X.Z.; Hamaker, B.R. Amylopectin fine structure and rice starch paste breakdown. J. Cereal Sci. 2001, 34, 279–284. [Google Scholar] [CrossRef]
  42. Yan, C.J.; Li, X.; Zhang, R.; Sui, J.M.; Liang, G.H.; Shen, X.P.; Gu, S.L.; Gu, M.H. Performance and inheritance of rice starch RVA profile characteristics. Rice Sci. 2005, 12, 39–47. [Google Scholar]
  43. Bao, J.; Kong, X.; Xie, J.; Xu, L. Analysis of genotypic and environmental effects on rice starch. 1. Apparent amylose content, pasting viscosity, and gel texture. J. Agric. Food Chem. 2004, 52, 6010–6016. [Google Scholar] [CrossRef] [PubMed]
  44. GB/T 17891-2017; The National Standard for Rice Quality Evaluation, the People’s Republic of China. NBQTC (National Bureau of Quality and Technology Control): Beijing, China, 2017.
  45. ISO 6647-2; Rice-Determination of Amylose Content-Part 2: Spectrophotometric Routine Method without Defatting Procedure and with Calibration from Rice Standards. International Organization for Standardization: Geneva, Switzerland, 2020.
  46. Parkhomchuk, D.; Borodina, T.; Amstislavskiy, V.; Banaru, M.; Hallen, L.; Krobitsch, S.; Lehrach, H.; Soldatov, A. Transcriptome analysis by strand-specific sequencing of complementary DNA. Nucleic Acids Res. 2009, 37, e123. [Google Scholar] [CrossRef]
  47. Cao, L.; Ding, G.; Lei, L.; Zhou, J.; Bai, L.; Luo, Y.; Xia, T.; Liu, K.; Wang, X.; Yang, G.; et al. QTL analysis related to rice appearance quality and rice food quality trait using high-density SNP genetic map. Plant Growth Regul. 2024, 102, 461–470. [Google Scholar] [CrossRef]
  48. Ishimaru, T.; Horigane, A.K.; Ida, M.; Iwasawa, N.; San-oh, Y.A.; Nakazono, M.; Nishizawa, N.K.; Masumura, T.; Kondo, M.; Yoshida, M. Formation of grain chalkiness and changes in water distribution in developing rice caryopses grown under high-temperature stress. J. Cereal Sci. 2009, 50, 166–174. [Google Scholar] [CrossRef]
  49. Fitzgerald, M.A.; McCouch, S.R.; Hall, R.D. Not just a grain of rice: The quest for quality. Trends Plant Sci. 2009, 14, 133–139. [Google Scholar] [CrossRef]
  50. Zhang, H.; Tan, G.; Wang, Z.; Yang, J.; Zhang, J. Ethylene and ACC levels in developing grains are related to the poor appearance and milling quality of rice. Plant Growth Regul. 2009, 58, 85–96. [Google Scholar] [CrossRef]
  51. Chun, A.; Song, J.; Kim, K.J.; Lee, H.J. Quality of head and chalky rice and deterioration of eating quality by chalky rice. J. Crop Sci. Biotech. 2009, 12, 239–244. [Google Scholar] [CrossRef]
  52. Takeuchi, Y.; Nonoue, Y.; Ebitani, T.; Suzuki, K.; Aoki, N.; Sato, H.; Ideta, O.; Hirabayashi, H.; Hirayama, M.; Ohta, H.; et al. QTL detection for eating quality including glossiness, stickiness, taste and hardness of cooked rice. Breed. Sci. 2007, 57, 231–242. [Google Scholar] [CrossRef]
  53. Groth, D.; Hartmann, S.; Klie, S.; Selbig, J. Principal components analysis. Methods Mol. Biol. 2013, 930, 527–547. [Google Scholar]
  54. Piao, S.; Ciais, P.; Huang, Y.; Shen, Z.; Peng, S.; Li, J.; Zhou, L.; Liu, H.; Ma, Y.; Ding, Y.; et al. The impacts of climate change on water resources and agriculture in China. Nature 2010, 467, 43–51. [Google Scholar] [CrossRef] [PubMed]
  55. Zhao, D.; Zhang, C.; Li, Q.; Liu, Q. Genetic control of grain appearance quality in rice. Biotechnol. Adv. 2022, 60, 108014. [Google Scholar] [CrossRef] [PubMed]
  56. Arshad, M.S.; Farooq, M.; Asch, F.; Krishna, J.S.; Prasad, P.V.; Siddique, K.H. Thermal stress impacts reproductive development and grain yield in rice. Plant Physiol. Biochem. 2017, 115, 57–72. [Google Scholar] [CrossRef] [PubMed]
  57. Chen, J.; Tang, L.; Shi, P.; Yang, B.; Sun, T.; Cao, W.; Zhu, Y. Effects of short-term high temperature on grain quality and starch granules of rice (Oryza sativa L.) at post-anthesis stage. Protoplasma 2017, 254, 935–943. [Google Scholar] [CrossRef]
  58. Glaubitz, U.; Erban, A.; Kopka, J.; Hincha, D.K.; Zuther, E. High night temperature strongly impacts TCA cycle, amino acid and polyamine biosynthetic pathways in rice in a sensitivity-dependent manner. J. Exp. Bot. 2015, 66, 6385–6397. [Google Scholar] [CrossRef]
  59. Scafaro, A.P.; Haynes, P.A.; Atwell, B.J. Physiological and molecular changes in Oryza meridionalis Ng.; a heat-tolerant species of wild rice. J. Exp. Bot. 2010, 61, 191–202. [Google Scholar] [CrossRef]
  60. Kumar, N.; Suyal, D.C.; Sharma, I.P.; Verma, A.; Singh, H. Elucidating stress proteins in rice (Oryza sativa L.) genotype under elevated temperature: A proteomic approach to understand heat stress response. 3 Biotech 2017, 7, 205. [Google Scholar] [CrossRef]
  61. Liao, J.L.; Zhou, H.W.; Peng, Q.; Zhong, P.A.; Zhang, H.Y.; He, C.; Huang, Y.J. Transcriptome changes in rice (Oryza sativa L.) in response to high night temperature stress at the early milky stage. BMC Genom. 2015, 16, 18. [Google Scholar] [CrossRef]
  62. Miyazaki, M.; Araki, M.; Okamura, K.; Ishibashi, Y.; Yuasa, T.; Iwaya-Inoue, M. Assimilate translocation and expression of sucrose transporter, OsSUT1, contribute to high-performance ripening under heat stress in the heat-tolerant rice cultivar Genkitsukushi. J. Plant Physiol. 2013, 170, 1579–1584. [Google Scholar] [CrossRef]
  63. Nakata, M.; Fukamatsu, Y.; Miyashita, T.; Hakata, M.; Kimura, R.; Nakata, Y.; Kuroda, M.; Yamaguchi, T.; Yamakawa, H. High temperature-induced expression of rice α-amylases in developing endosperm produces chalky grains. Front. Plant Sci. 2017, 8, 2089. [Google Scholar] [CrossRef]
  64. Wang, X.; Xue, L.; Sun, J.; Zuo, J. The Arabidopsis BE1 gene, encoding a putative glycoside hydrolase localized in plastids, plays crucial roles during embryogenesis and carbohydrate metabolism. J. Integr. Plant Biol. 2010, 52, 273–288. [Google Scholar] [CrossRef] [PubMed]
  65. Wang, X.; Xu, C.; Cai, X.; Wang, Q.; Dai, S. Heat-responsive photosynthetic and signaling pathways in plants: Insight from proteomics. Int. J. Mol. Sci. 2017, 18, 2191. [Google Scholar] [CrossRef] [PubMed]
  66. Mathur, S.; Agrawal, D.; Jajoo, A. Photosynthesis: Response to high temperature stress. J. Photoch. Photobiol. B 2014, 137, 116–126. [Google Scholar] [CrossRef]
  67. Ashraf, M.; Harris, P.J.C. Photosynthesis under stressful environments: An overview. Photosynthetica 2013, 51, 163–190. [Google Scholar] [CrossRef]
  68. Ashraf, M. Some important physiological selection criteria for salt tolerance in plants. Flora 2014, 199, 361–376. [Google Scholar] [CrossRef]
  69. Sailaja, B.; Subrahmanyam, D.; Neelamraju, S.; Vishnukiran, T.; Rao, Y.V.; Vijayalakshmi, P.; Voleti, S.R.; Bhadana, V.P.; Mangrauthia, S.K. Integrated physiological, biochemical, and molecular analysis identifies important traits and mechanisms associated with differential response of rice genotypes to elevated temperature. Front. Plant Sci. 2015, 6, 1044. [Google Scholar] [CrossRef]
  70. Hüve, K.; Bichele, I.; Rasulov, B.; Niinemets, Ü. When it is too hot for photosynthesis: Heat-induced instability of photosynthesis in relation to respiratory burst, cell permeability changes and H2O2 formation. Plant Cell Environ. 2011, 34, 113–126. [Google Scholar] [CrossRef]
  71. Wang, Q.L.; Chen, J.H.; He, N.Y.; Guo, F.Q. Metabolic reprogramming in chloroplasts under heat stress in plants. Int. J. Mol. Sci. 2018, 19, 849. [Google Scholar] [CrossRef]
  72. Deng, F.; Li, Q.; Chen, H.; Zeng, Y.; Li, B.; Zhong, X.; Wang, L.; Ren, W. Relationship between chalkiness and the structural and thermal properties of rice starch after shading during grain-filling stage. Carbohydr. Polym. 2021, 252, 117212. [Google Scholar] [CrossRef]
  73. Yang, L.; Sun, M.; Zhang, P.; Bai, Y.; Xu, C.; Tang, Q.; She, D. Effect of temperature and light on grain quality of medium Japonica hybrid rice 80You121. Hybrid Rice 1998, 13, 23–28. (In Chinese) [Google Scholar]
  74. Pietrzykowska, M.; Suorsa, M.; Semchonok, D.A.; Tikkanen, M.; Boekema, E.J.; Aro, E.M.; Jansson, S. The light-harvesting chlorophyll a/b binding proteins Lhcb1 and Lhcb2 play complementary roles during state transitions in Arabidopsis. Plant Cell 2014, 26, 3646–3660. [Google Scholar] [CrossRef] [PubMed]
  75. Ballottari, M.; Dall’Osto, L.; Morosinotto, T.; Bassi, R. Contrasting behavior of higher plant photosystem I and II antenna systems during acclimation. J. Biol. Chem. 2007, 282, 8947–8958. [Google Scholar] [CrossRef] [PubMed]
  76. Sato, R.; Ito, H.; Tanaka, A. Chlorophyll b degradation by chlorophyll b reductase under high-light conditions. Photosyn. Res. 2015, 126, 249–259. [Google Scholar] [CrossRef] [PubMed]
Figure 1. Chalky grain rate (A) and chalkiness degree (B) of different rice varieties under different durations of high temperature during grain filling stage. CK, rice varieties grown under optimum temperature. Data are shown as mean ± standard error of triplicate measurements. Different letters are marked above the standard deviation to express significant differences (p < 0.05).
Agronomy 15 00668 g001
Figure 2. Amylose content (A), gelatinization temperature (B), gel consistency (C), head rice length (D), cooked rice length (E), and cooked rice elongation (F) were analyzed in rice varieties treated with different durations of high temperature during grain filling stage. Data are shown as mean ± standard error of triplicate measurements. Different letters are marked above the standard deviation to express significant differences (p < 0.05).
Agronomy 15 00668 g002
Figure 3. Principal component analysis of 8XR274 and 5W0076 samples. HT14_076_1, HT14_076_2, and HT14_076_3 were 5W0076 samples under high-temperature treatment for 14 days; CT14_076_1, CT14_076_2, and CT14_076_3 were 5W0076 samples under optimum temperature control; HT14_274_1, HT14_274_2, HT14_274_3 were 8XR274 samples under high-temperature treatment for 14 days; CT14_274_1, CT14_274_2, CT14_274_3 were 8XR274 samples under optimum temperature control.
Agronomy 15 00668 g003
Figure 4. Statistical analysis of DEGs between 8XR274 and 5W0076. (A) The volcano diagram shows the relationship between the fold change of DEGs in 8XR274 (HT14_274 vs. CT14_274) and 5W0076 (HT14_076 vs. CT14_076) and the false discovery rate (FDR). The green dots indicate the down-regulated DEGs, the red dots indicate the up-regulated DEGs, and the blue dots indicate unaltered genes. (B) Venn diagram comparison of 8XR274 and 5W0076 total DEGs.
Agronomy 15 00668 g004
Figure 5. GO enrichment analysis of DEGs in the heat-sensitive variety 8XR274 (A) and heat-tolerant variety 5W0076 (B). The color of the column represents the p value; the smaller the p value, the closer the color is to red. The length of the column reflects the relative number of DEGs associated with each pathway. Enrichment comparison of KEGG pathways in 8XR274 (C) and 5W0076 (D). The point color represents the padj; the smaller the padj, the closer the color is to red. The size of the points reflects the relative number of DEGs associated with each pathway.
Agronomy 15 00668 g005
Figure 6. The heatmaps depict the expression level of DEGs enriched in “carbohydrate” (A) and “photosynthesis” (B). A heatmap was constructed using the log2 fold change values of all samples. Gene expression levels are represented by blue to red spectra, representing low to high expression, respectively. (C) The gene expression level changes (log2 FC values) of OsR498G0204464600.01, OsR498G0917611900.01, OsR498G0100034600.01, OsR498G1221059300.01, OsR498G0713493200.01, and OsR498G0917206700.01 in qRT-PCR and RNA-Seq. Data are given as means ± SD, n = 3.
Agronomy 15 00668 g006
Table 1. Setting of high-temperature period in an artificial climate chamber.
TimeTemperature (°C)Humidity Level (%)
24:00–3:002965
3:00–6:003065
6:00–9:003265
9:00–12:003665
12:00–15:003865
15:00–18:003665
18:00–21:003165
21:00–24:003065
Table 2. Setting of optimum temperature period in artificial climate chamber.
TimeTemp (°C)Humidity Level (%)
9:00–17:003065
17:00–9:002565
Table 3. Effect of HT treatment with different durations on RVA profile characteristics of test varieties in grain filling stage.
VarietyHigh-Temperature TreatmentPeak Viscosity
(cP)
Hot Paste Viscosity
(cP)
Cool Paste Viscosity
(cP)
Peak Time (min)Peak Temperature (°C)Breakdown Value
(cP)
Setback Value
(cP)
Recovery Value
(cP)
8XR274CK1243.0 c1109.0 c2094.5 b6.01 b88.38 a134.0 c851.5 a985.5 b
7 d1885.0 b1533.5 b2686.5 ab5.93 a82.30 a351.5 ab801.5 a1153.0 ab
14 d2397.5 a1999.0 a3198.5 a6.10 ab81.55 a398.5 a801.0 a1199.5 a
21 d1924.0 b1735.0 b2822.5 a6.40 b85.63 a189.0 bc898.5 a1087.5 ab
HuazhanCK2773.0 b1786.5 ab2431.0 c5.54 a84.78 a986.5 b−342.0 a644.5 c
7 d3218.5 a1921.0 a3001.0 a5.50 a85.63 a1297.5 ab−217.5 a1080.0 a
14 d2895.5 b1665.0 b2566.0 bc5.57 a86.85 a1230.5 ab−329.5 a901.0 b
21 d3458.5 a1977.0 a2814.5 ab5.65 a74.40 a1481.5 a−644.0 b837.5 b
5W0076CK2575.5 b2405.5 ab3549.5 b6.54 a87.50 a170.0 b974.0 a1144.0 c
7 d2789.5 b2432.0 a3565.0 b6.60 a87.08 a357.5 b775.5 b1133.0 c
14 d3184.5 a2288.0 bc3849.5 a6.57 a85.63 a896.5 a665.0 b1561.5 a
21 d3326.0 a2257.5 c3567.0 b6.60 a84.80 a1068.5 a241.0 c1309.5 b
ZH535CK2475.0 a1501.5 a2659.5 b6.30 a85.88 a973.5 b184.5 c1158.0 c
7 d1745.5 c1059.5 b1866.5 c5.67 a84.00 a686.0 d121.0 c807.0 d
14 d2136.5 b1340.0 a2761.5 b6.17 a84.35 a796.5 c625.0 a1421.5 b
21 d2657.5 a1453.5 a3113.5 a5.83 a83.18 a1204.0 a456.0 b1660.0 a
HuanghuazhanCK2290.0 c1915.0 b2910.0 b5.84 a84.78 a375.0 b620.0 a995.0 b
7 d3117.5 a2641.0 a3424.0 a5.94 a78.38 b476.5 b306.5 b783.0 b
14 d2755.5 b1877.0 b3335.5 a5.84 a80.40 ab878.5 a580.0 a1458.5 a
21 d2852.0 ab1611.0 b3224.0 ab5.87 a82.35 ab1241.0 a372.0 b1613.0 a
R751CK2721.0 b1767.0 b3007.0 b5.77 a87.18 a954.0 b195.5 b1240.0 b
7 d2298.0 c1524.0 c2847.0 b5.84 a85.98 a774.0 c549.0 a1323.0 ab
14 d2463.5 bc1692.0 b2968.5 b5.93 a85.98 a771.5 c523.0 a1276.5 ab
21 d3298.5 a2076.5 a3494.0 a5.87 a81.53 b1222.0 a487.0 a1417.5 a
R313CK2716.0 b2061.0 b3367.5 b5.87 a86.83 a655.0 b651.5 a1306.5 ab
7 d3048.0 a2524.5 a3630.0 a6.50 a87.05 a523.5 bc582.0 ab1105.5 b
14 d2804.0 b2369.5 a3220.5 c6.57 a85.50 a434.5 c416.5 c851.0 c
21 d3041.0 a2087.5 b3529.0 a6.47 a80.80 b953.5 a488.0 bc1441.5 a
YWSMCK3039.5 c2197.0 a3386.5 b6.04 a87.95 a842.5 c347.0 a1189.5 bc
7 d3635.0 a2237.0 a3899.0 a6.00 a85.58 a1398.0 a264.0 ab1662.0 a
14 d3350.5 b2283.0 a3549.0 b6.17 a79.55 b1067.5 b198.5 bc1266.0 b
21 d2919.0 c2042.5 b3073.0 c6.44 a79.18 b876.5 c154.0 c1030.5 c
Data are shown as mean ± standard error of triplicate measurements. Letters represent the differences of three values under three temperature treatments of the same variety in the same column. Different letters follow standard deviations to express significant differences (p < 0.05).
Disclaimer/Publisher’s Note: The statements, opinions and data contained in all publications are solely those of the individual author(s) and contributor(s) and not of MDPI and/or the editor(s). MDPI and/or the editor(s) disclaim responsibility for any injury to people or property resulting from any ideas, methods, instructions or products referred to in the content.

