Abstract
While soil responses to organic and inorganic phosphorus (P) fertilizers have been widely studied, plant physiological and molecular responses remain insufficiently characterized. Such an understanding is necessary to develop sustainable P fertilization strategies that enhance plant performance in soils with P limitations. This study investigated the impact of poultry manure (PM) and its combination with phytase enzyme on molecular plant responses involved in P use efficiency (PUE) of ryegrass plants growing on a P-deficient Andisol. A greenhouse experiment under controlled conditions was performed to evaluate soil properties, plant biomass, P uptake, plant performance, and the expression of P transporters under the following P treatments: P deficiency (PD), mineral fertilizers (F), PM alone, and PM combined with phytase. The combination of PM and phytase enhanced soil P availability by 60% and increased soil P enzyme activities 2.6-fold, facilitating the mineralization of organic P. This resulted in a 63% increase in shoot P concentration and a 35% enhancement in shoot biomass. Additionally, oxidative stress markers decreased, with lipid peroxidation in roots reduced up to five-fold, while antioxidant activity increased 1.6-fold. Molecular analysis revealed that the expression of the P transporter gene LpPHT1;4 was upregulated 9.3-fold, indicating an improved capacity for P acquisition and utilization. These findings suggest that phytase-mediated hydrolysis of organic P and the activation of plant P transporters are key mechanisms driving enhanced P uptake and efficiency in P-deficient soils.
1. Introduction
Phosphorus (P) is a critical macronutrient for plant growth, playing a key role in energy transfer, photosynthesis, and signaling pathways. However, many soils are P-deficient, particularly volcanic-origin Andisols, which are characterized by a high P-fixation capacity due to their unique mineral composition [1,2]. This limitation reduces P use efficiency (PUE) in crops to just 10 to 30%, leading to significant P losses and greater reliance on chemical fertilizers. Enhancing PUE is crucial for sustainable agriculture and meeting the rising global food demand, which requires a 68–81% increase in PUE [3]. Moreover, fertilizer inputs, in particular P, a limited resource, are crucial for biomass production on P-deficient soils such as Andisols rich in organic matter (SOM) and short-range-order minerals, which lead to P fixation [4]. Even though traditional chemical fertilizers have been widely used to enhance crop yields, they can lead to environmental issues such as nutrient leaching, soil degradation, and greenhouse gas emissions [5]. Consequently, there is increasing interest in the use of organic amendments and biostimulants to enhance soil nutrient cycling and plant growth sustainably [6]. Indeed, organic soil amendments such as poultry manure (PM) have a high nutrient content, particularly nitrogen (N) and P, and an ability to improve soil structure and microbial activity [7] through increasing SOM, microbial biomass, and physical soil properties, while having positive effects on plant growth [8,9]. PM applications have also been shown to promote soil C sequestration through improved soil microbial functioning and allocation of C to protected soil pools [10].
In the same context, it has been previously demonstrated that livestock manure in combination with phytase greatly improved soil P availability in Andisols [11]. The mechanism underlying this benefit lies in the ability of phytase to hydrolyze organic P compounds such as phytate from the amendment or/and the soil, which are otherwise unavailable to plants, thereby increasing the pool of plant-available P [12]. This enzymatic process accelerates the mineralization of organic P and mobilizes previously inaccessible P forms in the soil, improving nutrient uptake by plants [13]. Studies have reported that combining phytase with livestock manure not only increases P availability but also enhances microbial activity and diversity, further contributing to improved nutrient cycling and soil biochemical functions [11,14]. Such combined treatments can significantly increase plant biomass production, as the improved nutrient status reduces plant stress and promotes a more efficient allocation of resources to growth and development [15,16,17]. These findings highlight the potential of enzyme-enhanced organic amendments to optimize PUE and promote sustainable soil fertility management in P-deficient systems, offering a promising alternative to conventional P fertilizers [18].
Achieving the goal of increasing PUE requires not only improvements in agricultural management practices but also a deeper understanding of the biological mechanisms that control P uptake and PUE in plants. In this context, P transporters are essential for P uptake, translocation, and mobilization within plants, including species like ryegrass [19,20]. Two main families of P transporters—PHT1 and PHO1—are involved in the regulation of P acquisition and/or P translocation between cells or tissues and direct P efflux from cells and loading into xylem [21]. Among them, LpPHT1;4 has been identified as a key high-affinity transporter in ryegrass, particularly active in response to P deficiency, facilitating P uptake and remobilization [20,22]. Once absorbed, P is mobilized to shoots and other organs, where PHO1 transporters, such as LpPHO1;2, play a critical role in long-distance transport of P [23]. By efficiently managing P acquisition and distribution, they play a pivotal role in optimizing PUE under low-P conditions, making them a critical target for developing sustainable fertilization strategies in agricultural systems [24].
This study addressed the critical challenge of improving P use efficiency (PUE), and ryegrass (Lolium perenne L.) was selected due to its agronomic importance as a widely cultivated forage species in Andisol-dominated regions, its high nutrient demand, and its known responsiveness to P fertilization strategies. This research investigated the short-term effects of poultry manure amendment, and its combination with phytase, on soil structure, nutrient cycling, plant performance, and molecular processes related to PUE. We hypothesized that PM combined with enzyme amendments would enhance soil fertility and ryegrass production in P-deficient Andisols compared to PM alone or conventional fertilizers due to the upregulation of key P transporter genes (LpPHT1;4 and LpPHO1;2), leading to increased PUE and greater plant performance under P-deficient conditions.
2. Materials and Methods
2.1. Soil, Poultry Manure, and Phytase Characterization
An Andisol was collected from Barros Arana (39°00′141″ S, 72°52′037″ W. The phytase enzyme was purchased from ENCIPHARM Ltda. as Quantum Blue EXP (Escherichia coli with 6-phytase activity containing 1.66 × 10⁴ nKat g−1), which is commonly used as a feed additive in broiler production (where 1 nKat = 1 × 10⁻⁹ mol of product released per second). Poultry manure (PM) was purchased from JPP company SpA. After oven-drying at 60 °C until constant dry weight, sieving, and grinding (60 µm), it was mixed homogeneously with the phytase enzyme before soil application. Physicochemical properties of the soil and PM are summarized in Table 1.

Table 1.
Chemical characteristics of the soil and poultry manure used in the greenhouse experiment. ± means standard deviation value.
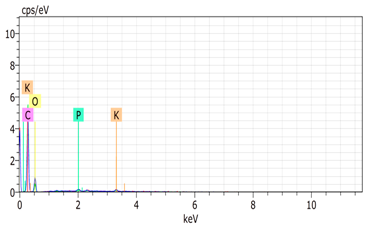
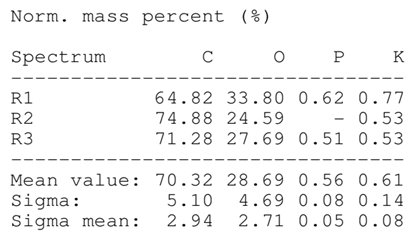
The mixture contained 1.00 g of PM expressed in dry weight (DW) and a phytase concentration of 8.33 nKat g−1 (E2). This phytase dose was selected from a previous study indicating its effectiveness to increase soil P availability in Andisols [25]. Two additional phytase concentrations consisting of 4.17 (E1) and 16.66 nKat g−1 per g of PM (E3) were also tested. Scanning electron microscope (SEM) analysis was used to analyze the surface morphology of each amendment at a magnification of 100×, showing the textural differences and structural composition.
2.2. Greenhouse Experiment
A greenhouse experiment under controlled conditions was performed to investigate the short-term effect of PM alone and combined with phytase on soil parameters and plant performance. Perennial ryegrass (Lolium perenne cv. Base) was selected, because this P-efficient forage species is widely used in permanent pastures and is easy to establish and manage [26]. In brief, 100 seeds of ryegrass were sown in pots containing 2 kg of soil. After emergence, plants were thinned to ensure 70 plants per pot. The treatments consisted of plants growing managed with the following treatments: P deficiency (PD; without P fertilizer addition), mineral fertilization (F; application of 100 mg P kg−1 in the form of triple superphosphate), composted poultry manure alone (PM), and PM in combination with three doses of the phytase enzyme (PM + E1, PM + E2, and PM + E3). The PM dose was 6 Mg ha−1 in equivalence to the P added in the F treatment. In addition, to ensure nutrient balance, urea and SulPoMag fertilizers were applied to the PD and F treatments in equivalent amounts of N and K provided by the PM amendment. The experiment was set up as a factorial experimental design, completely randomized, with four replicates per treatment. Plants were harvested after seven weeks of growth at 30 cm plant height to perform soil and plant analyses.
2.3. Soil Parameters
At the end of the experiment, physicochemical analyses were performed on soil samples. Soil aggregates were determined using particle-size distribution analysis through a laser diffraction technique as described by Poblete-Grant et al. [9]. Additionally, soil aggregates were semi-quantitatively analyzed by variable-pressure scanning electron microscope (VP-SEM), with transmission module STEM and detectors of energy-dispersive X-ray spectroscopy (EDX) (SU3500 Hitachi, Chiyoda, Japan) analysis to generate information about the chemical composition of the sample. Soil pH, SOM, and available P were characterized chemically according to Sadzawka et al. [27]. Total C and N were analyzed by dry combustion using a CHN auto-analyzer (Eurovector EA 3000, Italy). Soil available P was extracted with sodium bicarbonate [28]. Moreover, P from labile and non-labile pools was fractionated according to the sequential Hedley P methodology modified by Velásquez et al. [4]. We focused on the most available plant P in soil fractions (readily and moderately), and extracted 1 g of soil with H2O, 0.5 M NaHCO3, and 0.1 M NaOH. In brief, P extracted with H2O represents soluble P in the soil solution, which is immediately available for plant uptake. NaHCO3-extractable P corresponds to weakly adsorbed P on soil particles and P bound to organic matter, serving as a readily exchangeable P reserve, where the above fractions corresponded to the readily available P fraction (see Table S1). In contrast, P extracted with NaOH represents P bound to aluminum (Al) and iron (Fe) oxides in acidic soils, such as Andisols, constituting a moderately stable P pool (moderately available fraction) that is not immediately available but can become accessible over time through chemical processes or microbial activity [29]. Total P was determined by taking aliquots from supernatants for digestion using potassium persulfate (K2S2O8) and 2.5 M sulphuric acid (H2SO4). Inorganic P and total P corresponding to each fraction were measured by spectrophotometry at 800 nm using the methodology of Murphy and Riley [30]. Organic P was then calculated by the difference of total P and inorganic P determinations for each fraction.
In addition, soil enzymes involved in P mineralization were assessed. Acid phosphatase activity (APase) was determined according to the methodology of Tabatabai [31] as modified by Rubio et al. [32], wherein soil was incubated with buffered (pH 6.5) sodium p-nitrophenyl phosphate solution and toluene. Samples were analyzed by spectrophotometry at 400 nm. Phytase activity was determined as the inorganic P released by hydrolysis of phytate [33]. In brief, 1 g of soil was incubated for 1 h at 37 °C with 0.2 M sodium acetate (pH 4.5). The reaction was stopped by adding 0.5 mL 10% of trichloroacetic acid. Then samples were centrifuged for 10 min at 10,000 g, and the inorganic P was measured in the supernatant. APase and phytase activity were expressed in nKat (i.e., moles of substrate hydrolyzed per second) on a dry-weight-soil basis.
2.4. Plant Biomass Production and P Use Efficiency
At harvest, shoots and roots were collected and oven-dried at 65 °C for 48 h to determine dry biomass. In addition, fresh shoots and roots samples were collected and stored at either −20 or −80 °C for further biochemical and molecular analyses. The concentration of P in plant tissues was determined by the muffle furnace calcination (550 °C) of 0.5 g of dry material of shoots or roots contained in crucibles. Then, the tissues were digested on a hot plate by adding 5 mL of 0.5 M HCl. Extracts were filtered into a volumetric flask of 25 mL and raised with distilled water. Finally, an aliquot of 1 mL was mixed with molybdovanadate reagent, where P was spectrophotometrically determined at 466 nm [34]. In addition, plant P uptake (mg pot−1) was calculated as the product of shoot or root P concentrations (mg g−1) and shoot or root biomass (g). For each experimental treatment, plant P use efficiency (%) was calculated according to Baligar et al. [35], using the following equation:
2.5. Plant Biochemical and Molecular Assessment
To test the impact of the different treatments on ryegrass biochemical and molecular processes, lipid peroxidation, antioxidant activity, and total phenol concentration, as well as the expression of P transporter genes were analyzed. Lipid peroxidation was measured using 0.1 g of fresh shoots and roots material macerated with 2.5 mL of trichloroacetic acid (TCA) (0.1% m/v). Next, 500 µL of the extract was taken and mixed with 2 mL of TCA (20% m/v) plus thiobarbituric acid (TBA) (0.5% m/v). Samples were incubated in a hot plate (95 °C) for 30 min. Lipid peroxidation concentration was determined through the spectrophotometric measurement of the thiobarbituric-acid-reactive substances at 532, 600, and 440 nm and expressed in nmol of malondialdehyde acid (MDA) according to Du and Bramlage [36]. The antioxidant activity of the fresh material of roots and shoots was analyzed by the method described by Chinnici et al. [37], using DPPH (2,2-diphenyl-1-picrylhydrazyl) radical and Trolox as standard. Next, 0.1–0.15 g of plant sample was macerated with liquid nitrogen and mixed with 2 mL of ethanol (80% v/v). Then, 200 µL of extracts was combined with 100 µL of ethanol (80% v/v) and 1 mL of DPPH solution. The absorbance of samples was measured in a spectrophotometer at 515 nm. Total soluble phenol concentration was determined by weighing 0.1 g of fresh shoots and roots material and milled with liquid nitrogen and macerated in methanol. Then, 50 µL of the sample was mixed with 100 µL of folin reagent, 550 µL of distilled water, and (after 5 min) 300 µL of Na2CaO3 (7% m/v). The concentration of total phenols was determined in a spectrophotometer at 765 nm and calculated using chlorogenic acid as a standard (CAE), according to the method of Slinkard and Singleton [38]. Furthermore, gene expression of P transporters LpPHT1;4 (GeneBank accession MF966999) and LpPHO1;2 (GeneBank accession OP856692) was analyzed by quantitative real-time polymerase chain reaction (qPCR) using the specific primers previously designed by Parra-Almuna et al. [22] and Pontigo et al. [20], respectively. Total RNA was extracted from roots using the Plant Total RNA Mini Kit (Geneaid Biotech Ltd., New Taipei City, Taiwan), and cDNA was synthesized from 1 µg of total RNA using the High-Capacity cDNA Reverse Transcription Kit (Invitrogen, Carlsbad, CA, USA). The transcript levels of P transporters were determined on three biological replicates with three technical replicates using the PowerUp™ SYBR™ Green Master Mix (Applied Biosystems, Thermo Fisher Scientific Inc., Austin, TX, USA) and a QuantStudio 3 Real-Time PCR System (Thermo Fisher Scientific Inc., Austin, TX, USA). Cycling conditions were 10 min at 95 °C, then 40 cycles at 95 °C for 30 s, 59 °C for 1 min, and 72 °C for 5 s. Two housekeeping genes, eEF1α(h) (GeneBank accession GO924753) and eEF1α(s) (GeneBank accession GO924801), were used as internal control. The relative expression of P transporter genes was determined by using the delta–delta Ct method as described by Livak and Schmittgen [39].
2.6. Data Analysis
Data were checked for normality (Shapiro–Wilk test) and homogeneity of variance (Levene test). Statistical differences of means (95% significance level) were analyzed using one-way analyses of variance (one-way ANOVA). Post hoc tests with the function Tukey-test were conducted for the explanatory variables independently when the ANOVA detected significant differences, and effects were considered significant at p ≤ 0.05. The relationships between two response variables were tested by Pearson correlation analyses. Finally, we conducted a principal component analysis (PCA) to determine the response variables that most effectively explained the effects of the treatments on soil health and plant performance. This analysis was carried out using the R packages “factoextra”, “devtools”, and “ade4”. Statistical testing was performed using the statistical program R Foundation for Statistical Computing Version 4.4.1 (R Development Core Team 2024).
3. Results
3.1. Characterization of Poultry Manure Alone, Phytase, and Their Mixture
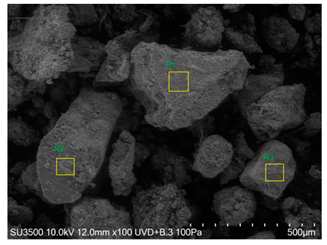
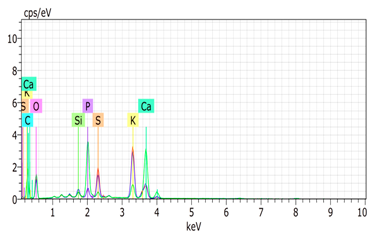
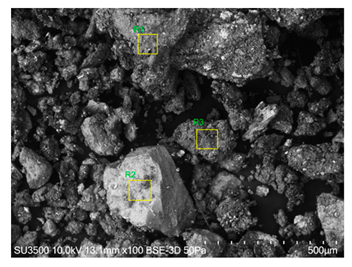
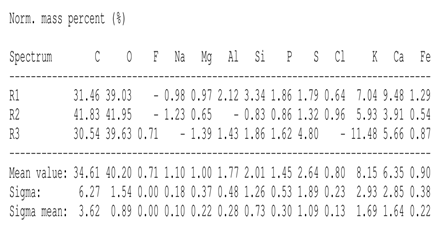
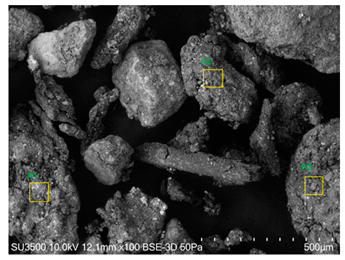
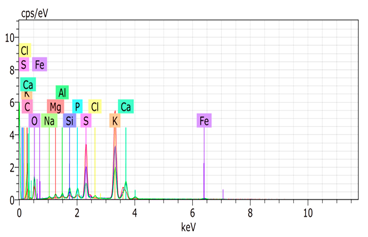
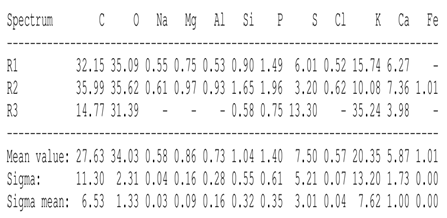
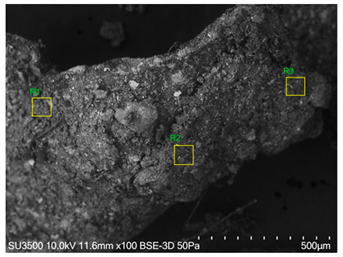
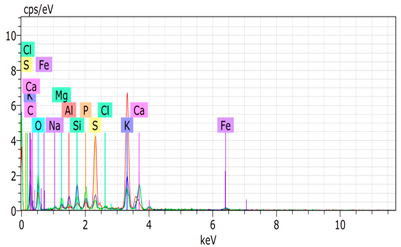
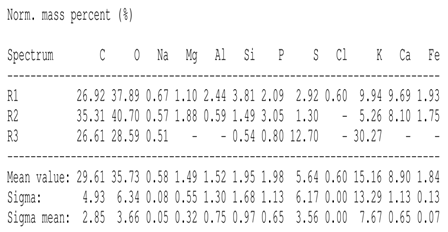
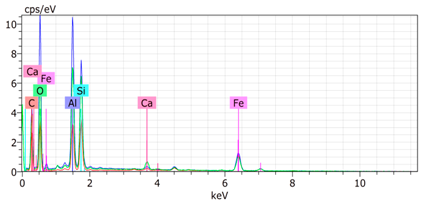
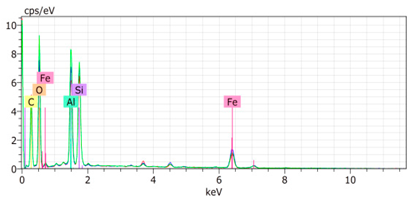
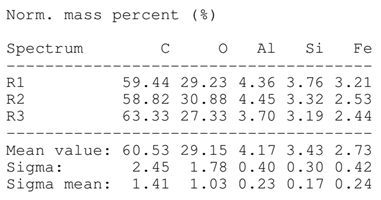
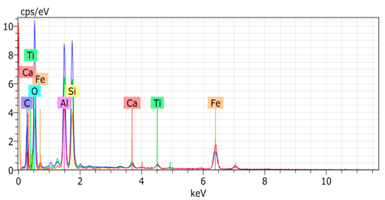
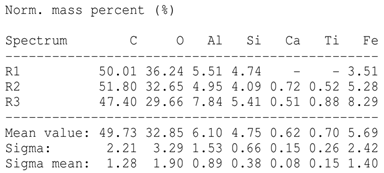
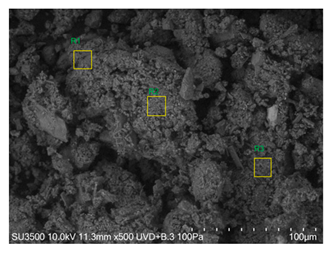
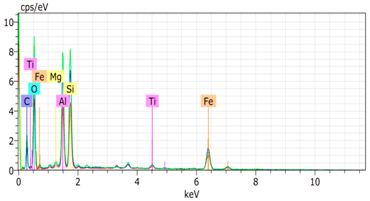
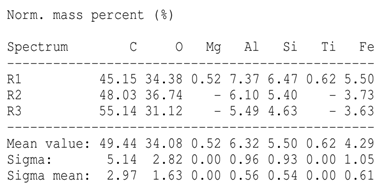
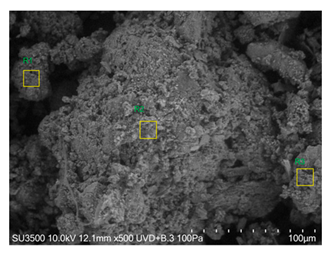
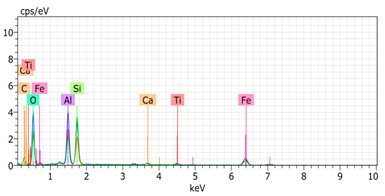
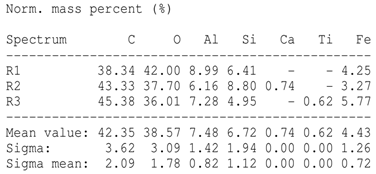
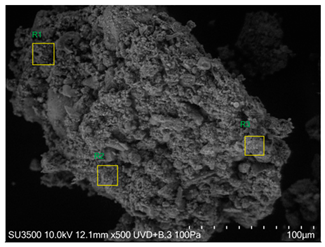
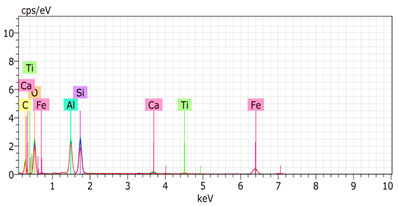
SEM analysis showed that PM exhibited a heterogeneous mixture of particles with irregular shapes and varying sizes, indicating a complex structure (Table 2). Phytase enzyme material appeared as larger and more cohesive aggregates with smoother surfaces, suggesting a more uniform texture. The combinations of PM and phytase (PM + E1, E2, E3) displayed varying degrees of particle aggregation and surface roughness, with PM + E1 showing a moderately aggregated structure, PM + E2 having larger and more distinct particles, and PM + E3 presenting a mix of fine and coarse particles with noticeable surface irregularities. The energy-dispersive X-ray spectroscopy (EDX) analysis of amendments provided the elemental composition in mass percentages for C, P, and K, among other elements, depicted in bar graphs for selected regions within each sample. We also observed that PM exhibited high amounts of C (64.68%), followed by K (5.84%), Ca (4.96%), S (2.70%), and P (2.19%), also including silicon (0.64%). Phytase material comprised mainly C (70.32%), K (0.61%), and P (0.56%). The mixture revealed more elements such as magnesium (Mg), iron (Fe), aluminum (Al), sodium (Na), chloride (Cl), and fluorine (F) in different concentrations.
Table 2.
Images from a scanning electron microscope (SEM) of each material amendment before the greenhouse experiment: poultry manure (PM), phytase, and their combination as PM + E1, PM + E2, and PM + E3. Additionally, the table includes energy-dispersive X-ray spectroscopy (EDX) analysis of the selected regions, detailing the elemental composition in mass percentages. Magnification of 100×.
3.2. Soil Response to Poultry Manure Alone and Enhanced by Phytase Enzyme
Mineral P fertilization treatments (F) showed a soil pH of 5.12, which was slightly lower than that of the P deficiency (PD) treatment, which was 5.22 (Figure 1A). The application of PM increased the soil pH to 5.40, representing an increase of 0.3 units compared to F. When PM was combined with phytase enzyme, the soil pH further increased to 5.48 and 5.53 in PM + E1 and E2 treatments, respectively. The soil available P in F was 23.07 mg kg−1, which represented a significant increase from PD (6.74 mg kg−1) (Figure 1B). The PM treatment further increased soil available P to 28.59 mg kg−1. The phytase enzyme treatments resulted in even higher levels of available P between 23.14 mg kg−1 and 36.78 mg kg−1. SOM in F amounted to 12.22%, being higher than in PD treatment (Figure 1C). PM treatment increased SOM to 16.64%. The phytase enzyme further enhanced SOM levels to 18.09%, 18.91%, and 18.75% in PM + E1, E2, and E3 treatments, respectively. The SOC in F was 7.09 g kg−1, which was slightly higher than recorded for the PD treatment (6.35 g kg−1) (Figure 1D). The PM treatment significantly increased SOC to 9.65 g kg−1, representing a 36% increase compared to F. Phytase enzyme enrichment further enhanced SOC levels to 10.50 g kg−1 (PM + E1), 10.97 g kg−1 (PM + E2), and 10.88 g kg−1 (PM + E3).
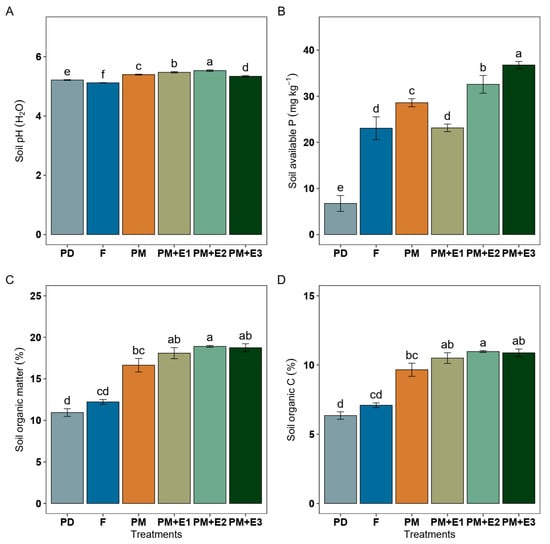
Figure 1.
Soil pH (A), available phosphorus (B), organic matter (C), and organic carbon (D) from ryegrass plants growing under different treatments: P deficiency conditions (PD), P sufficiency using mineral fertilizers (F), poultry manure alone (PM), and poultry manure combined with phytase enzyme at three different rates (PM + E1, E2, E3). The error bars denote the standard error of the mean. Different lowercase letters indicate significant differences among treatments (p ≤ 0.05).
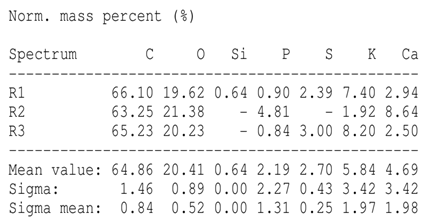
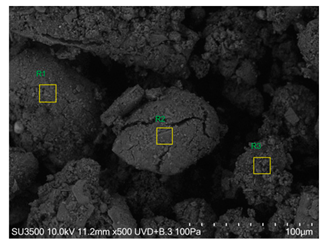
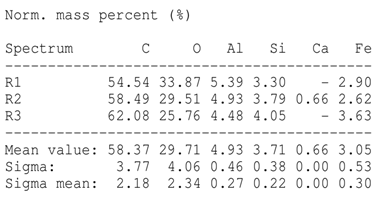
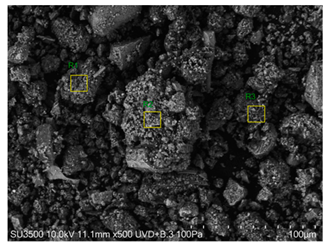
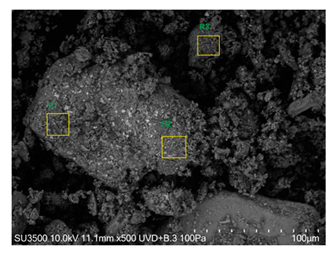
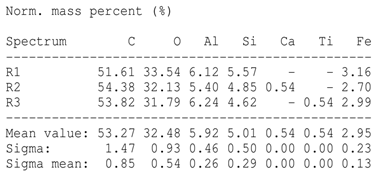
The SEM images revealed notable differences in the soil aggregate sizes and structures among the various treatments at the end of the experiment (Table 3). In the F-treated soils, the aggregates appeared small, relatively compact, and uniform compared to PD. The PM treatments showed larger and more porous aggregates compared to F. The addition of phytase enzymes to PM treatments resulted in further improvements in soil structure. The PM + E1 treatment showed moderately increased aggregate size compared to PM. The PM + E2 and PM + E3 treatments exhibited even larger aggregates, with PM + E3 showing the most significant improvement. The EDX analysis provided a detailed elemental composition of the soil aggregates, highlighting the impact of each treatment on the presence of nutrients (Table 3). The EDX results for PD-treated soils showed a lower concentration of elements, such as Ca, compared to the other treatments. In the F treatment, Ca was not detected, and Si and Al were slightly decreased as compared to PD. In the PM-treated soils, the EDX results indicated increased levels of Fe and Si as well as the presence of Ca and Mg (Table 3).
Table 3.
Images from a scanning electron microscope (SEM) of soil samples treated with different fertilization methods, including phosphorus deficiency (PD), P sufficiency supplied by mineral fertilizers (F), poultry manure alone (PM), and PM combined with varying concentrations of phytase enzyme (PM + E1, PM + E2, PM + E3). Additionally, the table includes energy-dispersive X-ray spectroscopy (EDX) analysis of the selected regions, detailing the elemental composition in mass percentages. Magnification of 500×.
Readily available inorganic P (Figure 2A) in F accounted for approximately 37 mg kg−1, showing a 4.6-fold higher concentration than PD (8 mg kg−1). The application of PM further increased the inorganic P in this fraction to about 49 mg kg−1. When PM was combined with phytase enzyme, the inorganic P showed further enhancements. In particular, PM + E2 increased the concentration to around 61 mg kg−1, and PM + E3 achieved the highest concentration at around 64 mg kg−1. Organic P from the readily available soil fraction (Figure 2B) in F showed a concentration of 47 mg kg−1, being slightly higher than that of PD (45 mg kg−1). PM alone or in combination with E1 and E2 raised this fraction similarly to about 55 mg kg−1, while the combination of PM with E3 treatment resulted in higher concentrations between 61 and 66 mg kg−1. Inorganic P from the moderately available soil fraction ranged between 424 and 703 mg P kg−1 (Figure 2C). It was higher in F than PD. PM addition induced substantial enhancement, and its combination with phytase showed the highest concentrations. This indicates the efficiency of treatments amended with PM and/or PM + phytase in improving the availability of P in this soil fraction. Organic P from the moderately available soil fraction ranged between 503 and 861 mg P kg−1 (Figure 2D). It increased in the order F = PD < PM < PM + E1 < PM + E2 < PM + E3, highlighting the substantial benefits of these combined treatments.
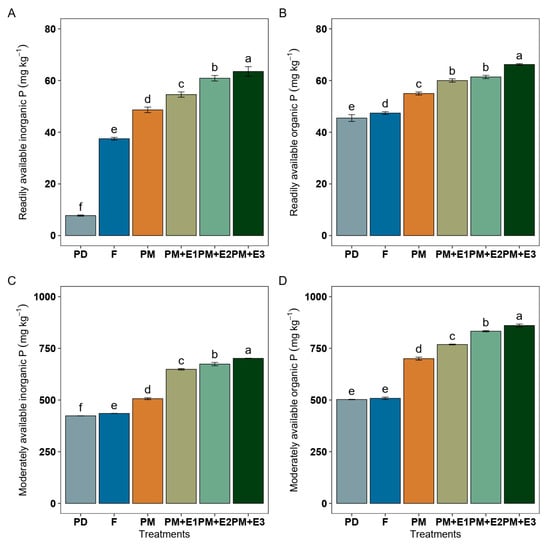
Figure 2.
Phosphorus (P) concentrations of inorganic (A) and organic (B) form from the readily (sum of the P extracted with H2O and NaHCO3) and moderately available (P extracted with NaOH) (C,D) available soil fraction under different treatments: P deficiency (PD), P sufficiency applied by mineral fertilizers (F), poultry manure alone (PM), and PM combined with phytase at different rates (E1, E2, and E3). The error bars denote the standard error of the mean. Different lowercase letters indicate significant differences among treatments (p ≤ 0.05).
Under F treatment, soil acid phosphatase (APase) activity accounted for approximately 727 nkat g−1. This was lower than that recorded for PD, which had around 1139 nkat g−1 (Figure 3A). The application of PM alone showed a higher APase activity than F. When PM was combined with enzyme treatments, there were even more significant enhancements in APase activity, particularly with PM + E3, which obtained the highest activity at approximately 1904 nkat g−1, representing a 2.6-fold increase over F, followed by PM + E2, which showed APase activity at around 1329 nkat g−1. Soil phytase activity in F showed an activity of 126 nkat g−1, showing similar values compared to PD (123 nkat g−1) (Figure 3B). PM alone enhanced phytase activity to around 236 nkat g−1, and addition of PM with phytate led to the highest activities, from 303 to 335 nkat g−1.
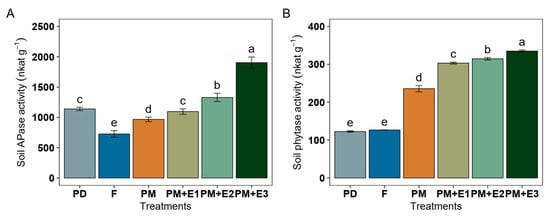
Figure 3.
Soil phosphatase activity (APase) (A) and phytase activity (B) following various treatments: phosphorus deficiency (PD), P sufficiency supplied by mineral fertilizers (F), poultry manure alone (PM), and PM combined with phytase at different rates (E1, E2, and E3). The error bars denote the standard error of the mean. Different lowercase letters indicate significant differences among treatments (p ≤ 0.05).
3.3. Effects of Poultry Manure Alone and Enhanced by Phytase Enzyme on Plant Production
All P treatments, including F, PM alone, and its combination with phytase, exhibited non-statistical differences in increasing shoot dry weight (DW) biomass (approximately 1.04 g pot−1) compared to PD (Figure 4A). Root DW biomass was 0.32 g pot−1 under F treatment, was increased to 0.41 g pot−1 with PM alone, and was 0.36 g pot−1 with PM + E1 (Figure 4B). We observed non-differences in root DW biomass in plants amended with PM + E2 compared to F, and PM + E3 exhibited values similar to those of PD.
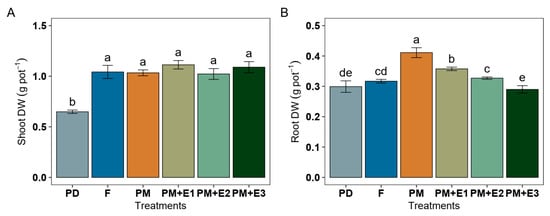
Figure 4.
Dry biomass shoot (A) and root (B) of ryegrass plants following various treatments: P deficiency (PD), P sufficiency supplied by mineral fertilizers (F), poultry manure alone (PM), and PM combined with phytase at different rates (E1, E2, and E3). The error bars denote the standard error of the mean. Different lowercase letters indicate significant differences among treatments (p ≤ 0.05).
Shoot P concentration treated with both F and PM alone increased similarly from 8.48 to 19.90 and 23.04 mg P g−1, respectively, being 2.5-fold that of PD. PM combined with phytase led to a further increase to 27.29 mg P g−1 (mean), being 1.18-fold over F and PM alone (Figure 5A). Shoot P uptake in F resulted in around 20.68 mg P pot−1, which was significantly higher than in PD (around 5.48 mg P pot−1) (Figure 5B). P uptake in shoots accounted for 23.83 mg P pot−1 following PM alone, exhibiting similar values to F. The phytase enzyme further enhanced P uptake, with PM + E1, E2, and E3 resulting in P uptakes of around 29.33 mg P pot−1, representing a 1.41-fold increase over F. Shoot PUE in F was around 15%, which was slightly increased by PM to about 18% (Figure 5C). The phytase enzyme treatments PM + E1, E2, and E3 showed significant improvements in shoot PUE, reaching approximately 27 to 30% and representing a 1.8- and 2.0-fold increase over F, respectively. Root P concentration was increased under PM alone to 10.09 mg P g−1, being 1.42-fold that of F (7.68 mg P g−1). PM combined with phytase increased it to 10.75, 12.16, and 15.19 mg g−1 the root P concentration compared to F, values which were statistically similar to those of PM alone (Figure 5D). Root P uptake under F was about 2.43 mg pot−1, while PD treatment showed the lowest root P uptake, roughly 0.47 mg pot−1, meaning a 5.19-fold decrease (Figure 5E). The PM treatment increased root P uptake to around 4.15 mg pot−1, approximately 1.70-fold that of F. The PM + E1 and E2 values were lower than that of PM alone, showing values of 3.84 and 3.98 mg pot−1 of root P uptake, respectively. On the other hand, root PUE in plants of F treatments exhibited values of around 1.90%, while using PM alone increased PUE 1.90-fold (3.62%) (Figure 5F). Furthermore, ryegrass amended with PM+ E3 highly increased root PUE 2.04-fold, showing values of 3.88%.
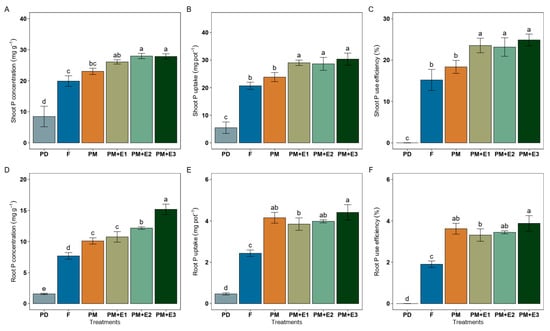
Figure 5.
Phosphorus concentration, uptake, and P use efficiency in shoots (A–C) and roots (D–F) of ryegrass plants following various treatments: P deficiency (PD), P sufficiency supplied by mineral fertilizers (F), poultry manure alone (PM), and PM combined with phytase at different rates (E1, E2, and E3). The error bars denote the standard error of the mean. Different lowercase letters indicate significant differences among treatments (p ≤ 0.05).
3.4. Effects of Poultry Manure Alone and Enhanced by Phytase Enzyme on Plant Performance
For ryegrass responses, in F, the shoot lipid peroxidation was 20.4 nmol MDA g−1 FW (Table 4). This represented a significant reduction from PD, which showed levels of 28.4 nmol MDA g−1 FW. PM further reduced shoot oxidative damage to 10.5 nmol MDA g−1 FW, a 1.9-fold decrease compared to F. When PM was combined with phytase enzyme, shoot oxidative damage exhibited decreases with PM + E1 treatment, obtaining 13.6 nmol MDA g−1 FW. In roots of SF treatments, lipid peroxidation was 11.6 nmol MDA g−1 FW, being reduced when PM was combined with PM + E1, PM + E2, and PM + E3 to 4.6, 2.4, and 2.3 nmol MDA g−1 FW, respectively. On the other hand, antioxidant activity decreased in F shoots 1.8-fold compared to PD, while this activity was highly increased in PM treatment, 1.6-fold compared to F (Table 4). The phytase enzyme treatments resulted in varying effects of shoot antioxidant activity. For root antioxidant activity, F exhibited similar values compared to PD; however, root antioxidant activity decreased 1.3-fold in PM treatments, and around 1.6-fold in PM + E1, PM + E2, and PM + E3 treatments. Shoot phenols decreased by about 3.46% in F as compared to PD, while PM increased shoot phenols by 5.63% over F, maintaining concentrations similar to those obtained with PD (Table 4). In general, non-variations between phytase enzyme treatment and F were found. Root phenols decreased by around 15% in SF as compared to PD. PM and PM + E1 lowered the value by 9.78%. Moreover, PM + E2 and PM + E3 showed further decreases in root phenol concentration of about 20 to 30%.
Table 4.
Performance response of ryegrass plants following various treatments: P deficiency conditions (PD), P sufficiency supplied by mineral fertilizers (F), poultry manure alone (PM), and PM combined with phytase at different rates (E1, E2, and E3).
The expression level of LpPHT1;4 in the root was significantly increased in ryegrass fertilized with PM, with an over 2.8-fold increase compared to F and 19.0-fold compared to PD (Figure 6A). When PM was combined with enzymes (PM + E1, E2, E3), the expression of LpPHT1;4 decreased compared to PM alone. In particular, the combination PM + E3 showed the highest expression of LpPHT1;4 among the PM + phytase treatments, being almost 9.3-fold the expression level of PD. An increase in LpPHO1;2 expression was also observed after PM amendment compared to F and PD (Figure 6B). In addition, the transcript levels of this gene decreased with PM + E1 compared to both F and PD, while PM + E2 exhibited higher values than those obtained by F.
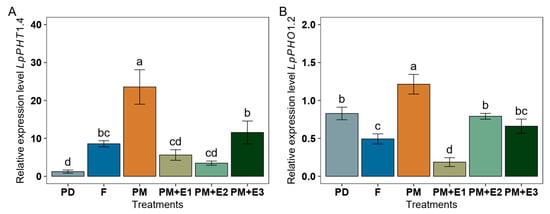
Figure 6.
Relative expression level of inorganic phosphorus (P) transporters in roots belonging to LpPHT1;4 (A) and LpPHO1;2 (B) of ryegrass plants following various treatments: P deficiency (PD), P sufficiency supplied by mineral fertilizers (F), poultry manure alone (PM), and PM combined with phytase at different rates (E1, E2, and E3). Values represent the fold change relative to the control treatment (PD). All data were normalized to the geometric mean of the housekeeping genes LpeEF1α(h) and LpeEF1α(s). The error bars denote the standard error of the mean. Different lowercase letters indicate significant differences among treatments (p ≤ 0.05).
3.5. Relationship Between Plant and Soil Parameters Under P Deficiency, Optimal Growth Conditions, and Organic Sources (Poultry Manure Alone and Combined with Phytase Enzyme)
The results presented in the PCA biplot revealed distinct differences in the responses of various treatments (Figure 7). The primary axis (Dim1) accounted for 62.6% of the total variance, while the secondary axis (Dim2) explained an additional 16.8%, together capturing a significant portion (79.4%) of the overall variability in the data. PM, PM + E1, PM + E2, and PM + E3 were positioned towards the right side of the plot, primarily associated with higher contributions to root and shoot DW biomass, soil P availability (Pi-NaOH, Pi-NaHCO3), soil P enzymes activities, and P uptake efficiency (P uptake and PUE). The addition of phytase enzyme in the PM treatments (PM + E1, PM + E2, PM + E3) further highlighted these effects, as seen in the separation of these treatments from the base PM treatment. In contrast, F treatment was located on the opposite side of the plot, indicating a divergence in the response compared to the PM treatments. The F treatment was closely associated with root lipid peroxidation (MDA) as well as to shoot antioxidant capacity and showed a weaker association with the biomass and P availability variables that characterized the PM treatments with and without enzyme addition. PD was situated on the far left of the plot, being associated with shoot antioxidant activity and variables related to oxidative damage, such as root phenols and root lipid peroxidation. The PCA biplot also highlighted the role of inorganic P transporters, specifically LpPHT1;4 and LpPHO1;2, in distinguishing the treatments. These transporters were represented by vectors on the right side of the plot, oriented towards the PM and enzyme-enhanced PM treatments (PM + E1, E2, E3). In contrast, the F and PD treatments were positioned far from these P transporters.
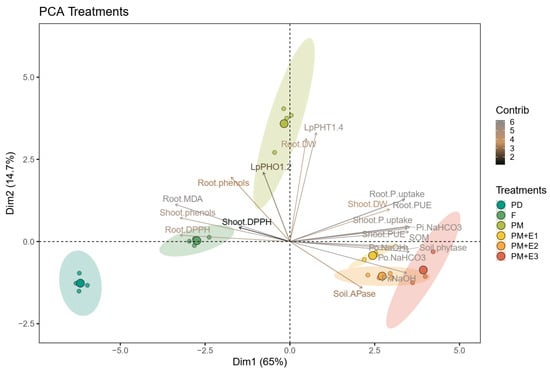
Figure 7.
Principal component analysis (PCA) biplot illustrating the relationships between soil and plant health parameters under different fertilization treatments: P deficiency (PD), P sufficiency supplied by mineral fertilizers (F), poultry manure (PM), and PM combined with phytase (PM + E1, PM + E2, and PM + E3). Ellipses represent the 95% confidence intervals for the treatment groups, showing the clustering of similar treatments.
The correlation matrix revealed a strong positive relationship between soil APase activity and inorganic P across soil fractions, particularly in the readily and moderately available soil fractions (Figure 8). Similarly, soil phytase activity was positively correlated with organic P in both soil fractions. A strong positive correlation was also observed between soil available P and shoot DW biomass. Additionally, the positive correlation between SOM and shoot DW biomass and both shoot and root PUE highlighted the crucial role of organic matter in promoting plant growth. Consistent with shoot biomass, soil available P was also strongly correlated with root biomass. Furthermore, there was a significant positive correlation between APase and phytase activity and both shoot and root PUE. A robust positive correlation was found between plant PUE, shoot P uptake, soil available P, and SOC. In contrast, LpPHO1;2 was positively correlated with shoot and root antioxidant activity and phenol concentration. LpPHT1;4, on the other hand, was negatively correlated with shoot lipid peroxidation and positively correlated with root phenols, biomass, and P uptake.
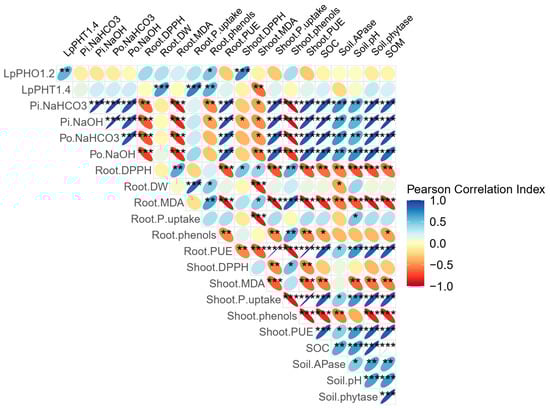
Figure 8.
Correlation matrix involving soil chemical and biological properties with ryegrass plant yield and performance parameters following different treatments: P deficiency (PD), P sufficiency supplied by mineral fertilizers (F), poultry manure (PM), and PM combined with phytase (PM + E1, PM + E2, and PM + E3). The Pearson correlation coefficients are depicted, with the ellipse size and direction indicating the strength and nature of the correlations. Significant correlation coefficients are marked with asterisks (* p ≤ 0.05, ** p ≤ 0.01, *** p ≤ 0.001).
4. Discussion
4.1. Phytase-Enriched Poultry Manure Promotes Soil Aggregation and P Availability Through Stimulating Soil Enzyme Activities
In soils fertilized with inorganic sources (F), we observed small and poorly formed aggregates that appeared relatively compact and uniform, as evidenced by SEM analysis. These results are similar to those reported in other studies, where inorganic fertilizers have been shown to lead to the development of smaller, less stable aggregates due to the absence of organic binding agents. The observed improvements in soil aggregation likely reflect short-term changes due to organic matter inputs, which may promote aggregate formation temporarily. For instance, the study performed by Fang et al. [40] revealed that long-term application of inorganic fertilizers resulted in compact soil microstructures with reduced porosity and aggregate stability. Similarly, Yang et al. [41] demonstrated that inorganic fertilizers alone contribute to soil compaction and diminished aggregate formation due to their lack of soil organic matter. The compacted and uniform soil aggregates associated with F may lead to reduced soil porosity, impeding root growth and slowing water infiltration [42]. Over time, these structural changes can exacerbate soil compaction, reduce aeration, and decrease the soil’s capacity to retain water, ultimately diminishing soil health and crop productivity. Additionally, the lack of organic matter inputs in F-treated soils limits the development of microbial communities and reduces the production of polysaccharides and other binding agents essential for stable aggregate formation [43]. This absence of organic contributions hinders the natural processes that improve soil aggregation and resilience to erosion. Furthermore, the prolonged use of F has been linked to soil degradation, loss of soil biodiversity, and negative impacts on plant performance due to nutrient imbalances and soil acidification [44,45].
In contrast, organic amendments or combined approaches that include organic matter can counteract these effects in the long term by fostering biological activity and enhancing soil structure [46]. In fact, we observed larger and more porous aggregates in PM-treated soils, likely due to higher SOM, which improved soil aeration, water infiltration, and microbial activity, essential for sustainable soil management [9,47]. Even though we assessed in the short-term the promotion of soil aggregation due to PM fertilization, our findings align with those of Poblete-Grant et al. [9], who reported that pasture soils under long-term organic amendments exhibited improved soil structure. By enhancing soil fertility and reducing the reliance on inorganic fertilizers, PM and phytase treatments support sustainable agricultural practices, promote a circular nutrient economy, and address these challenges while maintaining crop productivity.
A crucial aspect of P fertilization in Andisols is their high P retention capacity, primarily due to the presence of short-range-order minerals such as allophane and imogolite, which strongly bind P and reduce its leaching potential [1,2,4]. While the addition of PM improved P bioavailability, it is essential to consider long-term soil P saturation risks associated with continuous organic amendment applications. Furthermore, our results demonstrated significant improvements in soil P availability, enzyme activities, and plant performance with the use of PM, either alone or in combination with phytase enzyme, compared to inorganic P fertilization and P-deficient treatments. This improvement can be attributed to the addition of phytase enzymes, which accelerated the breakdown of organic P compounds by enhancing microbial activity [11]. Likewise, we observed a positive correlation between SOM, plant biomass, and PUE, highlighting the critical role of SOM in enhancing plant growth by improving soil structure and nutrient availability, leading to better root development and productivity [48].
Additionally, PM enhanced SOM, improving soil fertility by providing a continuous nutrient supply and enhancing soil structure, which promoted microbial activity, as evidenced by increases in APase and phytase activities [49]. Notably, soil APase and phytase activity, which are crucial for P mineralization, were greatly increased by PM and further increased by adding phytase. These results are particularly relevant in Andisols, which are naturally rich in organic matter but have high P fixation, limiting P bioavailability to plants [1,2,4,10]. Moreover, improvements in soil P availability and consequent increases of plant uptake suggest that phytase enzymes effectively mobilize P from organic sources in the soil, contributing to more sustainable and efficient nutrient cycling. This was further supported by the strong positive correlations between soil APase and phytase activity and the inorganic and organic P in soil fractions, indicating that higher APase activity enhances the conversion of organic P to inorganic forms, thereby increasing soil P availability [50,51]. Likewise, we found a strong positive correlation between soil available P, soil APase activity, and both shoot and root biomass, confirming that increased bioavailable P directly promotes greater plant growth, biomass production, and robust root development, essential for overall plant performance [52]. This enzymatic action releases inorganic P from organic sources, making it accessible for plant uptake and significantly improving PUE [53,54]. In fact, in this study, we observed an enhancement in PUE, underscoring the potential of PM and its combination with phytase to maximize nutrient use while minimizing environmental impact [55,56,57].
Even though our study focused on the short-term promotion of soil aggregation due to PM fertilization, our findings align with those of Poblete-Grant et al. [10], who demonstrated that long-term organic amendment applications in pasture soils improve soil structure and enhance nutrient cycling. These benefits reinforce the potential of integrating organic fertilizers into soil fertility management strategies to reduce reliance on synthetic fertilizers while improving soil physicochemical and biological properties. In this context, the use of organic amendments like PM presents a viable alternative, as it not only provides essential nutrients, such as P, in a more sustainable manner but also enhances soil functions by improving SOM content, microbial activity, and soil structure [9,10,57]. Phytase addition further amplified these effects by accelerating the mineralization of organic P, resulting in enhanced nutrient uptake and improved plant growth. While our study focused on ryegrass grown in Andisols, the findings provide valuable insights into P acquisition mechanisms that can be tested in other soil–plant systems. Future research should explore the effects of these treatments in a broader range of soil types and crop species to validate their applicability in sustainable agriculture.
4.2. Phytase-Enriched Poultry Manure Modulates P Transporters, Improving P Use Efficiency and Plant Performance
Ryegrass plants grown under P deficiency (PD) exhibited reduced shoot and root dry weight (DW), lower P uptake, and increased lipid peroxidation. These outcomes confirm the detrimental effects of P scarcity on plant physiological functions, as previously reported in acidic soils where low P availability and aluminum (Al) toxicity impair crop yields [58,59]. P deficiency is associated with elevated oxidative stress due to reactive oxygen species (ROS) production, leading to cellular damage and impaired plant growth [60]. Moreover, we observed that PCA analysis showed that under P deficiency, plants exhibited the highest oxidative damage, following a negative direction in plant biomass, PUE, and soil enzyme activity, which may highlight the detrimental impact of P deficiency on soil and plant performance, and reinforcing the importance of effective P fertilization management [61]. In addition, ryegrass growth under P deficiency conditions (PD) exhibited a significant reduction of P uptake, underscoring the importance of adequate P supply for optimal plant performance [62]. However, the availability of P in soil is often limited due to its tendency to form insoluble compounds [63]. On the other hand, we observed that plants under inorganic P fertilization significantly alleviated shoot oxidative damage and reduced the need to enhance shoot antioxidant activity and plant phenol concentration compared to those growing under P deficiency. This demonstrates the critical role of sufficient P availability in mitigating stress responses and maintaining a biochemical balance in plants [64]. However, long-term reliance on inorganic fertilizers can lead to inefficiencies, with much of the applied P becoming immobilized in forms unavailable to plants, contributing to “legacy P” accumulation in soils [65]. This highlights the need for environmentally friendly strategies to enhance P bioavailability and utilization.
We found that plants amended with PM, both alone and in combination with phytase enzymes, decreased oxidative damage induced by low P availability. Notably, shoot and root lipid peroxidation were significantly reduced with PM alone, and this effect was further amplified with the addition of enzyme treatments, which also elevated antioxidant activity and phenolic content in shoots compared to ryegrass treated with inorganic fertilizers. Thus, PM treatments, through enhancing shoot antioxidant activity, might strengthen the plant’s defense mechanisms against abiotic stress, leading to improved plant performance and productivity [66,67]. The use of PM, both alone and in combination with phytase enzymes, as an alternative to conventional fertilizers is especially relevant given the imminent scarcity of phosphate rock resources. Similar stress-alleviating effects have been observed with phosphobacteria inoculation, which reduces ROS-induced damage by enhancing antioxidant enzyme expression [17]. The observed reductions in oxidative stress are attributed to improved P availability and the consequent restoration of metabolic balance in plants. Furthermore, the improvements in soil fertility translated into higher shoot and root P uptake and PUE, demonstrating the synergistic benefits of PM and phytase on plant performance and soil fertility [67]. This enhanced nutrient availability aligns with the critical roles of P transporters like LpPHT1;4 and LpPHO1;2, which ensure efficient acquisition and distribution of inorganic P within the plant. Specifically, LpPHT1;4 facilitates inorganic P uptake at the root surface, while LpPHO1;2 drives its effective translocation to shoots, collectively maintaining P homeostasis, supporting growth, and enhancing the tolerance to P deficiency [21]. These transporters play crucial roles in P uptake and translocation, as observed in other grasses such as Oryza sativa and Hordeum vulgare [68,69]. Similar upregulation patterns have been reported under P deficiency and aluminum toxicity in ryegrass, highlighting their importance in adapting to nutrient stress [22]. A novel aspect of this study is the molecular evidence showing the upregulation of P transporters, LpPHT1;4 and LpPHO1;2, in response to PM and phytase treatments. Notably, PM alone as a P source upregulated the expression of both P transporters under a P-deficient soil, with the most pronounced effect observed for LpPTH1;4. The addition of enzyme also modulated the expression of these genes. Accordingly, an induction of LpPHT1;4 with PM + E3 was found, while a downregulation of LpPHO1;2 was detected with PM + E1. Thus, while enzyme supplementation induced a contrasting expression of P transporters, the PM-alone treatment showed the highest increase of both genes. These findings were supported by PCA, which demonstrated a strong association between P transporters and P uptake, suggesting that PM can stimulate P acquisition mediated by those transporters. The upregulation observed in this study suggests that PM and phytase treatments trigger molecular mechanisms that enhance P use efficiency, providing critical insights for sustainable nutrient management. Studies on P transporters in plants fertilized with organic sources are scarce, making this study a pioneering molecular approach of revealing the effect of PM alone or combined with phytase on P acquisition in ryegrass growing in an Andisol. Maintaining a balance between P inputs and plant uptake capacity is key to avoiding P accumulation in soils that may eventually contribute to runoff and eutrophication risks in agricultural landscapes. Our findings reinforce the importance of site-specific nutrient management strategies to ensure that organic fertilization enhances soil fertility without compromising environmental quality.
5. Conclusions
Our study demonstrated that, in the short term, poultry manure (PM) and phytase maintained or increased plant biomass production to levels comparable to those achieved with inorganic fertilizers while enhancing P use efficiency, soil aggregation, enzyme activities, organic carbon, and nutrient availability. This is the first study to report the upregulation of P transporters in ryegrass under PM and phytase, highlighting their molecular role in P acquisition. By improving nutrient availability and reducing reliance on chemical inputs, these treatments support sustainable agriculture by utilizing locally available organic resources. PM and phytase-enhanced PM could help close the nutrient loop, reducing dependency on inorganic fertilizers while converting waste into valuable fertilizer. Further studies could explore their long-term impacts on soil functions and crop yields, optimize application rates, investigate potential runoff and eutrophication risks, and evaluate interactions with different soil types and climatic conditions to refine recommendations for diverse agricultural systems.
Supplementary Materials
The following supporting information can be downloaded at: https://www.mdpi.com/article/10.3390/agronomy15030660/s1, Table S1: Phosphorus (P) concentrations of inorganic and organic form from the readily (sum of the P extracted with H2O and NaHCO3) and moderately available soil fraction (P extracted with NaOH) under different treatments: P deficiency (PD), P sufficiency applied by mineral fertilizers (F), poultry manure alone (PM), and PM combined with phytase at different rates (E1, E2, and E3).
Author Contributions
P.P.-G.: conceived the ideas, collected and analyzed the samples, prepared the figures, and wrote the manuscript. P.P.-G. and P.C.: designed the experiment, supervision, writing—review and editing, project administration, and funding acquisition. L.P.-A. and S.P.: analyzed the samples, writing—review and editing. C.R. and M.d.L.L.M.: supervision, writing—review and editing. P.P.-G.: project administration. P.P.-G. and P.C.: funding acquisition. All authors have read and agreed to the published version of the manuscript.
Funding
We are grateful for the financial support of the Fondo Nacional de Desarrollo Científico y Tecnológico (FONDECYT) in Chile (projects n° 3210228, 1241718, 1230084, 11240769, and 11240738).
Data Availability Statement
The data sets generated and/or analyzed during the current study are available from the corresponding author on reasonable request.
Acknowledgments
The authors acknowledge the support of the Scientific and Technological Bioresources Nucleus (BIOREN-UFRO), and the technical collaboration of Juan-Alejandro Norambuena.
Conflicts of Interest
The authors declare no conflicts of interest.
References
- Redel, Y.; Cartes, P.; Velásquez, G.; Poblete-Grant, P.; Poblete-Grant, P.; Bol, R.; Mora, M.L. Assessment of phosphorus status influenced by Al and Fe compounds in volcanic grassland soils. J. Soil Sci. Plant Nutr. 2016, 16, 490–506. [Google Scholar] [CrossRef]
- Borie, F.; Aguilera, P.; Castillo, C.; Valentine, A.; Seguel, A.; Barea, J.M.; Cornejo, P. Revisiting the Nature of Phosphorus Pools in Chilean Volcanic Soils as a Basis for Arbuscular Mycorrhizal Management in Plant P Acquisition. J. Soil Sci. Plant Nutr. 2019, 19, 390–401. [Google Scholar] [CrossRef]
- Walsh, M.; Schenk, G.; Schmidt, S. Realising the circular phosphorus economy delivers for sustainable development goals. NPJ Sustain. Agric. 2023, 1, 2. [Google Scholar] [CrossRef]
- Velásquez, G.; Calabi-Floody, M.; Poblete-Grant, P.; Rumpel, C.; Demanet, R.; Condron, L.; Mora, M.L. Fertilizer effects on phosphorus fractions and organic matter in Andisols. J. Soil Sci. Plant Nutr. 2016, 16, 294–304. [Google Scholar] [CrossRef]
- Tilman, D.; Cassman, K.G.; Matson, P.A.; Naylor, R.; Polasky, S. Agricultural sustainability and intensive production practices. Nature 2002, 418, 671–677. [Google Scholar] [CrossRef] [PubMed]
- Shu, X.; He, J.; Zhou, Z.; Xia, L.; Hu, Y.; Zhang, Y.; Zhang, Y.; Luo, Y.; Chu, H.; Liu, W.; et al. Organic amendments enhance soil microbial diversity, microbial functionality and crop yields: A meta-analysis. Sci. Total Environ. 2022, 829, 154627. [Google Scholar] [CrossRef]
- Kingery, W.L.; Wood, C.W.; Delaney, D.P.; Williams, J.C.; Mullins, G.L. Impact of Long-Term Land Application of Broiler Litter on Environmentally Related Soil Properties. J. Environ. Qual. 1994, 23, 139. [Google Scholar] [CrossRef]
- Eghball, B.; Power, J.F. Phosphorus- and Nitrogen-Based Manure and Compost Applications. Soil Sci. Soc. Am. J. 1999, 63, 895. [Google Scholar] [CrossRef]
- Poblete-Grant, P.; Suazo-Hernández, J.; Condron, L.; Rumpel, C.; Demanet, R.; Malone, S.L.; Mora, M.L. Soil available P, soil organic carbon and aggregation as affected by long-term poultry manure application to Andisols under pastures in Southern Chile. Geoderma Reg. 2020, 21, e00271. [Google Scholar] [CrossRef]
- Poblete-Grant, P.; Cartes, P.; Pontigo, S.; Biron, P.; De La, M.; Mora, L.; Rumpel, C. Phosphorus fertiliser source determines the allocation of root-derived organic carbon to soil organic matter fractions. Soil Biol. Biochem. 2022, 167, 108614. [Google Scholar] [CrossRef]
- Menezes-Blackburn, D.; Jorquera, M.A.; Gianfreda, L.; Greiner, R.; de la Luz Mora, M. A novel phosphorus biofertilization strategy using cattle manure treated with phytase–nanoclay complexes. Biol. Fertil. Soils 2014, 50, 583–592. [Google Scholar] [CrossRef]
- Rizwanuddin, S.; Kumar, V.; Singh, P.; Naik, B.; Mishra, S.; Chauhan, M.; Saris, P.E.J.; Verma, A.; Kumar, V. Insight into phytase-producing microorganisms for phytate solubilization and soil sustainability. Front. Microbiol. 2023, 14, 1127249. [Google Scholar] [CrossRef]
- Giles, C.D.; Hsu, P.C.; Richardson, A.E.; Hurst, M.R.H.; Hill, J.E. Plant assimilation of phosphorus from an insoluble organic form is improved by addition of an organic anion producing Pseudomonas sp. Soil Biol. Biochem. 2014, 68, 263–269. [Google Scholar] [CrossRef]
- Liu, X.; Han, R.; Cao, Y.; Turner, B.L.; Ma, L.Q. Enhancing Phytate Availability in Soils and Phytate-P Acquisition by Plants: A Review. Environ. Sci. Technol. 2022, 56, 9196–9219. [Google Scholar] [CrossRef]
- Bargaz, A.; Elhaissoufi, W.; Khourchi, S.; Benmrid, B.; Borden, K.A.; Rchiad, Z. Benefits of phosphate solubilizing bacteria on belowground crop performance for improved crop acquisition of phosphorus. Microbiol. Res. 2021, 252, 126842. [Google Scholar] [CrossRef] [PubMed]
- Mthiyane, P.; Aycan, M.; Mitsui, T. Integrating Biofertilizers with Organic Fertilizers Enhances Photosynthetic Efficiency and Upregulates Chlorophyll-Related Gene Expression in Rice. Sustainability 2024, 16, 9297. [Google Scholar] [CrossRef]
- Barra, P.J.; Pontigo, S.; Delgado, M.; Parra–Almuna, L.; Duran, P.; Valentine, A.J.; Jorquera, M.A.; de la Luz Mora, M. Phosphobacteria inoculation enhances the benefit of P–fertilization on Lolium perenne in soils contrasting in P–availability. Soil Biol. Biochem. 2019, 136, 107516. [Google Scholar] [CrossRef]
- George, T.S.; Brown, L.K.; Brown, M.M.; Gregory, P.J.; Richardson, A.E. Improving the Utilization of Legacy P in Animal Manured Soils Using Transgenic Plants that Express a Microbial Phytase. J. Soil Sci. Plant Nutr. 2024. [Google Scholar] [CrossRef]
- Parra-Almuna, L.; Pontigo, S.; Larama, G.; Cumming, J.R.; Pérez-Tienda, J.; Ferrol, N.; de la Luz Mora, M. Expression analysis and functional characterization of two PHT1 family phosphate transporters in ryegrass. Planta 2020, 251, 6. [Google Scholar] [CrossRef]
- Pontigo, S.; Parra-Almuna, L.; Luengo-Escobar, A.; Poblete-Grant, P.; Nunes-Nesi, A.; Mora, M.d.l.L.; Cartes, P. Biochemical and Molecular Responses Underlying the Contrasting Phosphorus Use Efficiency in Ryegrass Cultivars. Plants 2023, 12, 1224. [Google Scholar] [CrossRef]
- Wang, Y.; Wang, F.; Lu, H.; Liu, Y.; Mao, C. Phosphate Uptake and Transport in Plants: An Elaborate Regulatory System. Plant Cell Physiol. 2021, 62, 564–572. [Google Scholar] [CrossRef] [PubMed]
- Parra-Almuna, L.; Diaz-Cortez, A.; Ferrol, N.; Mora, M.-L. Aluminium toxicity and phosphate deficiency activates antioxidant systems and up-regulates expression of phosphate transporters gene in ryegrass (Lolium perenne L.) plants. Plant Physiol. Biochem. 2018, 130, 445–454. [Google Scholar] [CrossRef]
- Stefanovic, A.; Arpat, A.B.; Bligny, R.; Gout, E.; Vidoudez, C.; Bensimon, M.; Poirier, Y. Over-expression of PHO1 in Arabidopsis leaves reveals its role in mediating phosphate efflux. Plant J. 2011, 66, 689–699. [Google Scholar] [CrossRef]
- Yang, S.Y.; Lin, W.Y.; Hsiao, Y.M.; Chiou, T.J. Milestones in understanding transport, sensing, and signaling of the plant nutrient phosphorus. Plant Cell 2024, 36, 1504–1523. [Google Scholar] [CrossRef]
- Menezes-blackburn, D.; Jorquera, M.; Gianfreda, L.; Rao, M.; Greiner, R.; Garrido, E.; De, M.; Mora, L. Activity stabilization of Aspergillus niger and Escherichia coli phytases immobilized on allophanic synthetic compounds and montmorillonite nanoclays. Bioresour. Technol. 2011, 102, 9360–9367. [Google Scholar] [CrossRef] [PubMed]
- Rivero, M.J.; Balocchi, O.A.; Moscoso, C.J.; Siebald, J.A.; Neumann, F.L.; Meyer, D.; Lee, M.R.F. Does the “high sugar” trait of perennial ryegrass cultivars express under temperate climate conditions? Grass Forage Sci. 2019, 74, 496–508. [Google Scholar] [CrossRef] [PubMed]
- Sadzawka, A.; Carrasco, M.A.; Gez, R.; Mora, M.D.L.L.; Flores, H.; Neaman, A. Métodos de Análisis Recomendados para Los Suelos de Chile. Revision 2006; Instituto de Investigaciones Agropecuarias: Santiago, Chile, 2006; p. 164. [Google Scholar]
- Olsen, S.R.; Sommers, L.E. Phosphorus. In Methods of Soil Analysis: Part 2. Chemical and Microbiological Properties; Wiley: Hoboken, NJ, USA, 1982; pp. 403–427. [Google Scholar]
- Condron, L.M.; Newman, S. Revisiting the fundamentals of phosphorus fractionation of sediments and soils. J. Soils Sediments 2011, 11, 830–840. [Google Scholar] [CrossRef]
- Murphy, B.; Riley, J.P. A modified single solution method for the determination of phosphate in natural waters. Anal. Chim. Acta 1962, 27, 31–36. [Google Scholar] [CrossRef]
- Tabatabai, M.A. Soil enzymes. In Methods of Soil Analysis: Part 2. Microbiological and Biochemical Properties; Weaver, R.W., Angle, J.S., Bottomly, P.S., Eds.; Soil Science Society of America: Madison, WI, USA, 1994; pp. 775–833. [Google Scholar]
- Rubio, R.; Moraga, E.; Borie, F. Acid phosphatase activity and vesicular-arbuscular mycorrhizal infection associated with roots of four wheat cultivars. J. Plant Nutr. 1990, 13, 585–598. [Google Scholar] [CrossRef]
- Ramesh, A.; Sharma, S.K.; Joshi, O.P.; Khan, I.R. Phytase, Phosphatase Activity and P-Nutrition of Soybean as Influenced by Inoculation of Bacillus. Indian J. Microbiol. 2011, 51, 94–99. [Google Scholar] [CrossRef]
- Sadzawka, A.; Carrasco, M.; Demenet, R.; Flores, H.; Grez, R.; Mora, M.; Neaman, A. Metodos de analisis de tejidos vegetales. Ser. Actas INIA 2007, 40, 53. [Google Scholar]
- Baligar, V.C.; Fageria, N.K.; He, Z.L. Nutrient use efficiency in plants. Commun. Soil Sci. Plant Anal. 2001, 32, 921–950. [Google Scholar] [CrossRef]
- Du, Z.; Bramlage, W.J. Modified thiobarbituric acid assay for measuring lipid oxidation in sugar-rich plant tissue extracts. J. Agric. Food Chem. 1992, 40, 1566–1570. [Google Scholar] [CrossRef]
- Chinnici, F.; Bendini, A.; Gaiani, A.; Riponi, C. Radical scavenging activities of peels and pulps from cv. golden delicious apples as related to their phenolic composition. J. Agric. Food Chem. 2004, 52, 4684–4689. [Google Scholar] [CrossRef] [PubMed]
- Slinkard, K.; Singleton, V. Total phenol analysis: Automation and comparison with manual methods. Am. J. Enol. Vitic. 1977, 28, 49–55. [Google Scholar] [CrossRef]
- Livak, K.J.; Schmittgen, T.D. Analysis of relative gene expression data using real-time quantitative PCR and the 2−ΔΔCT method. Methods 2001, 25, 402–408. [Google Scholar] [CrossRef] [PubMed]
- Fang, H.; Liu, K.; Li, D.; Peng, X.; Zhang, W.; Zhou, H. Long-term effects of inorganic fertilizers and organic manures on the structure of a paddy soil. Soil Tillage Res. 2021, 213, 105137. [Google Scholar] [CrossRef]
- Yang, Q.; Zheng, F.; Jia, X.; Liu, P.; Dong, S.; Zhang, J.; Zhao, B. The combined application of organic and inorganic fertilizers increases soil organic matter and improves soil microenvironment in wheat-maize field. J. Soils Sediments 2020, 20, 2395–2404. [Google Scholar] [CrossRef]
- Bronick, C.J.; Lal, R. Soil structure and management: A review. Geoderma 2005, 124, 3–22. [Google Scholar] [CrossRef]
- Six, J.; Conant, R.T.; Paul, E.A.; Paustian, K. Stabilization mechanisms of SOM implications for C saturation of soils. Plant Soil 2002, 241, 155–176. [Google Scholar] [CrossRef]
- Singh, N.; Singh, C.A.K.; Singh, S. Stress physiology and metabolism in hybrid rice. II. Impact of organic manures on anthesis and grain growth under drought conditions. J. Crop Improv. 2020, 34, 715–739. [Google Scholar] [CrossRef]
- Zhu, J.; Li, M.; Whelan, M. Phosphorus activators contribute to legacy phosphorus availability in agricultural soils: A review. Sci. Total Environ. 2018, 612, 522–537. [Google Scholar] [CrossRef] [PubMed]
- Lal, R. Soil Erosion and Gaseous Emissions. Appl. Sci. 2020, 10, 2784. [Google Scholar] [CrossRef]
- Hodge, A.; Berta, G.; Doussan, C.; Merchan, F.; Crespi, M. Plant root growth, architecture and function. Plant Soil 2009, 321, 153–187. [Google Scholar] [CrossRef]
- Haynes, R.J.; Naidu, R. Influence of lime, fertilizer and manure applications on soil organic matter. Nutr. Cycl. Agroecosyst. 1998, 51, 123–137. [Google Scholar] [CrossRef]
- Lal, R. Restoring soil quality to mitigate soil degradation. Sustainability 2015, 7, 5875–5895. [Google Scholar] [CrossRef]
- Nannipieri, P.; Giagnoni, L.; Landi, L.; Renella, G. Role of Phosphatase Enzymes in Soil. In Phosphorus in Action; Bunemann, E., Oberson, A., Frossard, E., Eds.; Soil Biology; Springer: Berlin/Heidelberg, Germany, 2011; Volume 26, pp. 215–243. [Google Scholar] [CrossRef]
- Turner, B.L.; Papházy, M.J.; Haygarth, P.M.; McKelvie, I.D. Inositol phosphates in the environment. Philos. Trans. R. Soc. B 2002, 357, 449–469. [Google Scholar] [CrossRef]
- Fageria, N.K.; Moreira, A.; dos Santos, A.B. Phosphorus Uptake and Use Efficiency in Field Crops. J. Plant Nutr. 2013, 36, 2013–2022. [Google Scholar] [CrossRef]
- Han, Y.; White, P.J.; Cheng, L. Mechanisms for improving phosphorus utilization efficiency in plants. Ann. Bot. 2022, 129, 247–258. [Google Scholar] [CrossRef]
- Richardson, A.E.; Simpson, R.J. Soil Microorganisms Mediating Phosphorus Availability. Plant Physiol. 2011, 156, 989–996. [Google Scholar] [CrossRef]
- He, Z.; Honeycutt, C.W.; Cade-Menun, B.J.; Senwo, Z.N.; Tazisong, I.A. Phosphorus in Poultry Litter and Soil: Enzymatic and Nuclear Magnetic Resonance Characterization. Soil Sci. Soc. Am. J. 2008, 72, 1425. [Google Scholar] [CrossRef]
- He, Z.; Pagliari, P.H.; Waldrip, H.M. Applied and Environmental Chemistry of Animal Manure: A Review. Pedosphere 2016, 26, 779–816. [Google Scholar] [CrossRef]
- Bolan, N.S.; Szogi, A.A.; Chuasavathi, T.; Seshadri, B.; Rothrock, M.J.; Panneerselvam, P. Uses and management of poultry litter. Worlds. Poult. Sci. J. 2010, 66, 673–698. [Google Scholar] [CrossRef]
- Pradhan, A.K.; Shandilya, Z.M.; Sarma, P.; Bora, R.K.; Regon, P.; Vemireddy, L.N.R.; Tanti, B. Concurrent effect of aluminum toxicity and phosphorus deficiency in the root growth of aluminum tolerant and sensitive rice cultivars. Acta Physiol. Plant. 2023, 45, 33. [Google Scholar] [CrossRef]
- Borie, F.; Rubio, R. Effects of arbuscular mycorrhizae and liming on growth and mineral acquisition of aluminum-tolerant and aluminum-sensitive barley cultivars. J. Plant Nutr. 1999, 22, 121–137. [Google Scholar] [CrossRef]
- Hernández, I.; Munné-Bosch, S. Linking phosphorus availability with photo-oxidative stress in plants. J. Exp. Bot. 2015, 66, 2889–2900. [Google Scholar] [CrossRef]
- Shen, J.; Yuan, L.; Zhang, J.; Li, H.; Bai, Z.; Chen, X.; Zhang, W.; Zhang, F. Phosphorus Dynamics: From Soil to Plant. Plant Physiol. 2011, 156, 997–1005. [Google Scholar] [CrossRef]
- Pang, F.; Li, Q.; Solanki, M.K.; Wang, Z.; Xing, Y.X.; Dong, D.F. Soil phosphorus transformation and plant uptake driven by phosphate-solubilizing microorganisms. Front. Microbiol. 2024, 15, 1383813. [Google Scholar] [CrossRef]
- Veneklaas, E.J.; Lambers, H.; Bragg, J.; Finnegan, P.M.; Lovelock, C.E.; Plaxton, W.C.; Price, C.A.; Scheible, W.R.; Shane, M.W.; White, P.J.; et al. Opportunities for improving phosphorus-use efficiency in crop plants. New Phytol. 2012, 195, 306–320. [Google Scholar] [CrossRef]
- Bechtaoui, N.; Rabiu, M.K.; Raklami, A.; Oufdou, K.; Hafidi, M.; Jemo, M. Phosphate-Dependent Regulation of Growth and Stresses Management in Plants. Front. Plant Sci. 2021, 12, 679916. [Google Scholar] [CrossRef]
- Condron, L.M.; Spears, B.M.; Haygarth, P.M.; Turner, B.L.; Richardson, A.E. Commentary on “Tackling the phosphorus challenge: Time for reflection on three key limitations” by Ulrich et al. (in press). Role of legacy phosphorus in improving global phosphorus-use efficiency. Environ. Dev. 2013, 8, 147–148. [Google Scholar] [CrossRef]
- Hawkesford, M.J.; Araus, J.L.; Park, R.; Calderini, D.; Miralles, D.; Shen, T.; Zhang, J.; Parry, M.A.J. Prospects of doubling global wheat yields. Food Energy Secur. 2013, 2, 34–48. [Google Scholar] [CrossRef]
- Adesemoye, A.O.; Kloepper, J.W. Plant-microbes interactions in enhanced fertilizer-use efficiency. Appl. Microbiol. Biotechnol. 2009, 85, 1–12. [Google Scholar] [CrossRef]
- Rae, A.L.; Cybinski, D.H.; Jarmey, J.M.; Smith, F.W. Characterization of two phosphate transporters from barley; evidence for diverse function and kinetic properties among members of the Pht1 family. Plant Mol. Biol. 2003, 53, 27–36. [Google Scholar] [CrossRef] [PubMed]
- Młodzinska, E.; Zboinska, M. Phosphate Uptake and Allocation—A Closer Look at Arabidopsis thaliana L. and Oryza sativa L. Front. Plant Sci. 2016, 7, 1198. [Google Scholar] [CrossRef]
Disclaimer/Publisher’s Note: The statements, opinions and data contained in all publications are solely those of the individual author(s) and contributor(s) and not of MDPI and/or the editor(s). MDPI and/or the editor(s) disclaim responsibility for any injury to people or property resulting from any ideas, methods, instructions or products referred to in the content. |
© 2025 by the authors. Licensee MDPI, Basel, Switzerland. This article is an open access article distributed under the terms and conditions of the Creative Commons Attribution (CC BY) license (https://creativecommons.org/licenses/by/4.0/).