Article

Differential Effects of Inoculation with Earthworms and Phosphate-Solubilizing Bacteria on Phosphorus Adsorption Capacity of Soils with Different Phosphorus Contents

1
College of Land and Environment, Shenyang Agricultural University, Shenyang 110866, China
2
Department of Municipal and Environmental Engineering, Shenyang Urban Construction University, Shenyang 110167, China
3
Faculty of Urban Construction, Eastern Liaoning University, Dandong 118003, China
4
Shenyang Hengxin Technology Management Consulting Service Co., Ltd., Shenyang 110000, China
*
Author to whom correspondence should be addressed.
Agronomy 2025, 15(3), 659; https://doi.org/10.3390/agronomy15030659
Submission received: 11 February 2025 / Revised: 3 March 2025 / Accepted: 5 March 2025 / Published: 6 March 2025
(This article belongs to the Section Soil and Plant Nutrition)

Abstract

:
Due to the strong fixation and weak mobility of phosphorus (P) in the soil, P fertilizers can easily be left behind in the soil, which greatly increases the environmental pressure. To find a green and environmentally friendly method of P activation, this study evaluated the effects of inoculation with earthworms and phosphate-solubilizing bacteria (PSB) on the adsorption and desorption in low-phosphorus (LP) and high-phosphorus (HP) soils substrates. In LP soils, inoculation with earthworms or (and) PSB reduced the maximum P adsorption, P adsorption affinity constant and maximum buffering capacity by 3–12%, 7–19% and 10–28%, respectively, while the readily desorbed P, degree of P saturation and desorption rates were significantly higher in the inoculated treatments. In HP soils, treatments inoculated with earthworms significantly increased the P adsorption affinity constants (16–22%) and maximum buffer capacity (8–16%) and decreased the adsorption saturation and desorption rates compared to no inoculum. The results indicate that inoculation with earthworms or (and) PSB can effectively reduce the P adsorption capacity and increase the P desorption capacity of LP soils, thus increasing the available P content. However, in HP soils, inoculation with earthworms increased the P adsorption capacity and reduced the risk of P losses due to high-P soil content.

1. Introduction

Soil phosphorus (P) can be grouped as dissolved P, adsorbed (or exchangeable) P and mineral P. Dissolved P exists mainly as orthophosphate, which is directly available for plant uptake and utilization, but in very small amounts. Mineralized phosphorus consists of primary and secondary phosphate minerals with very low effectiveness. Adsorbed P refers to P adsorbed by clay minerals or metal (e.g., Fe, Al or Ca) oxides/hydroxides by anion exchange or ligand (e.g., -OH or -COOH) displacement. Most of the P fertilizers applied to soil are gradually converted to stable P and subsequently retained in the soil due to the tight adsorption [1]. The ability to adsorb P decreases with years of fertilizer application, even in soils with high P-fixing capacity, because soils have a limited ability to hold P [2,3]. Phosphorus accumulated in the soil is lost through surface runoff and subsurface leaching, which not only results in a waste of resources but also causes water quality and ecological problems in water bodies [4]. Therefore, if the legacy P in the soil can be effectively utilized, it will not only reduce fertilizer P inputs to a certain extent and alleviate the global shortage of P resources but also reduce environmental risks.
Phosphate-solubilizing bacteria (PSB) can solubilize insoluble forms of P in the soil and facilitate the P desorption process, thereby increasing the bioavailability of P organic acids (e.g., citric acid, gluconic acid and oxalic acid) secreted by PSB, which can lower environmental pH and promote the solubilization of insoluble P (Rawat et al., 2021) [5]. The decrease in soil pH also favors P desorption [6]. Hydroxyl and carboxylate anions in organic acids occupy adsorption sites for P in the soil or the chelate phosphate-bound cations and exchange ligands with them, thus releasing P [7]. It was shown that ligand exchange between hydroxyl and carboxylate anions and orthophosphate may be the main mechanism for P release [8]. Although some PSB do not produce acid directly, the carbonic acid produced by their respiration and the hydrogen ions released by their assimilation acidify the surrounding medium, which also contributes to the release of P [5,9]. The gut of the earthworm is a potential source for investigating PSB [10]. Efficient PSB isolated from the gut of earthworms, including Bacillus licheniformis and Pseudomonas aeruginosa, possess the potential to serve as biofertilizers [10,11]. Earthworms’ activities can also increase the content of humic acid in the soil, causing acidic ions or functional groups to compete with phosphate for the adsorption sites of P in the soil colloid, thus reducing the adsorption capacity of the soil for P and significantly increasing its desorption capacity [12,13]. Traditional amendment methods (e.g., application of organic fertilizers) can increase the availability of P, but inevitably bring in more P, leaving more P left in the soil and posing a threat to mineral P resources and the ecological environment. Previous research on the application of PSB and earthworms in soil has primarily concentrated on enhancing soil P effectiveness, with limited studies addressing the impact of earthworm inoculation and PSB on P adsorption characteristics in soil. In this study, the effect of inoculation with earthworms and phosphate solubilizing bacteria on P effectiveness and adsorption capacity in soil was investigated without additional P addition. The objectives of this study were (i) to determine the effects of inoculation with earthworms and PSB on the P adsorption and desorption characteristics of soils from facilities of different years and (ii) to identify the main factors affecting P adsorption and desorption under the inoculation treatments.

2. Materials and Methods

2.1. Preparation of Soil, Earthworms and PSB

The soil substrates was taken from the topsoil layer (0–20 cm) of two greenhouses in Liaoning Province, and the soil type was calcareous. The two soil substrates were (i) a low-phosphorus soil substrate, characterized by one year of tomato cultivation (LP), and (ii) a high-phosphorus soil substrate, resulting from 15 years of continuous tomato cultivation (HP). The properties of the two soil substrates are listed in Table 1. The adult earthworms (Eisenia fetida) (weight ~0.3 g) were sourced from a compost heap of cow manure used for earthworm farming at the research base of Shenyang Agricultural University, located in Shenyang, Liaoning Province, China (123°57′ E, 41°83′ N). The PSB were isolated from the gut of earthworms, with detailed procedures for isolation, purification and characterization provided in the Supplementary Material (Figure S1, Table S1) [14,15,16]. The16S rRNA gene sequencing revealed that the PSB (called Y-EB) was 99% similar to Aeromonas media (NR 119041.1).

2.2. Pot Experiment

A pot experiment was carried out in a greenhouse from March to July 2022 at the research base of Shenyang Agricultural University. Each pot (diameter 25 cm × height 30 cm) was filled with 12 kg of soil substrate and was planted with one tomato plant (Golden Crown 9). The experiment consisted of eight treatments: no inoculation (LCK/HCK), inoculation with earthworms (LE/HE), inoculation with PSB (LB/HB), and simultaneous inoculation with earthworms and PSB (LEB/HEB) for both the LP and HP soils. Each treatment was replicated six times. The tops of the planting pots were covered with nylon netting to prevent earthworms from escaping. In the earthworm-inoculated treatments, 36 adult earthworms were added to each pot and turned into the soil. The number of earthworms was determined by combining the nutrient status of the soil in this study with the actual earthworm biomass in the local field. For the PSB inoculated treatments, 60 mL of the bacterial solution (PSB was inoculated in Luria–Bertani medium for 24 h and then diluted to about 109 CFU mL−1 with sterile water) was added to each pot, while the other treatments were amended with an equal volume of sterile medium. The bacterial solution or sterile medium was irrigated at a 30-day interval. All treatments received N (0.15 g kg−1) and K2O (0.24 g kg−1) at the rate of 0.15 g kg−1 and 0.24 g kg−1 as urea (N 46%) and potassium sulfate (K2O 50%), respectively. Soil moisture was kept at 60–70% of field holding capacity during the period of the experiment.

2.3. Sample Collection and Analysis

Soil samples were collected after the tomato harvest. After removing earthworms and roots, a portion of the soil was naturally air-dried and then passed through a 1 mm sieve for the determination of soil physicochemical properties. The pH of the soil was determined using a pH meter (Thunder Magnetic, Shanghai, China) at a water to soil ratio of 2.5:1 (w:w). Available P (AP) was determined using the Mo-Sb colorimetric method. Total P (TP) was determined by H2SO4-HClO4 digestion and the Mo-Sb colorimetric method. Soil organic carbon (SOC) was determined using an elemental analyzer (Elementar, Hanau, Germany). The CaCO3 content was determined using acid–base titration. Microbial biomass P (MBP) was determined with the Mo-Sb colorimetric method after chloroform fumigation.
Tomato plants were dried and weighed separately for roots, stems, leaves and fruits. The dried tomato plants were ground, and the P content of each part was determined by digestion analysis [17]. The total P uptake of the tomato plants was determined as the sum of P content in each part.

2.4. Methods for Measuring Phosphorus Adsorption and Desorption

A series of standard P solutions with varying concentrations (0, 10, 20, 40, 80, 120 and 160 mg L−1) were prepared using 0.01 mol L−1 NaCl (pH = 7). Samples of 1.00 g air-dried soil were placed in 50 mL centrifuge tubes, and 30 mL of each P solution was added to the centrifuge tubes. To inhibit microbial activity, two droplets of toluene were added to the system. After shaking at 25 °C and 180 r min−1 for 24 h, the sample was centrifuged (10 min, 4000 r min−1) and the P concentration in the supernatant was determined with the Mo-Sb colorimetric method [18]. The amount of P adsorbed by the soil was calculated as the difference between the added P and the P in the equilibrium solution.
After the adsorption test, the soil sample was washed with 20 mL of saturated NaCl solution twice, and then the P desorption was performed. The 30 mL of 0.01 mol L−1 NaCl solution and 2 drops of toluene were added to each centrifuge tube, and these were shaken for 24 h at 25 °C and 180 r min−1. Finally, the tubes were centrifuged (10 min, 4000 r min−1) and the concentration of P in the supernatant was determined. The amount of P desorbed from the soil was calculated as the difference between the equilibrium solution and the initial solution.

2.5. Data Analysis

The adsorption data were fitted using Langmuir and Freundlich isotherm adsorption equations. Langmuir isotherm adsorption equations:
C/Q = C/Qm + 1/K1Qm
Freundlich isotherm adsorption equations:
Q = K2 C1/n
C is the P concentration of the equilibrium solution (mg L−1). Q is the P adsorption capacity (mg kg−1). Qm is the maximum P adsorption capacity of the soil (mg kg−1), which reflects the number of colloidal adsorption sites available in soil. K (K1 and K2) is the adsorption constant, which indicates the degree of affinity of soil colloids for phosphate ions. Finally, 1/n is the adsorption strength coefficient.
The readily desorbable P (RDP) is the amount of soil P in the solution when the P concentration in the adsorption test is 0. The maximum buffer capacity (MBC) of the soil reflects the ability of the soil to store P, MBC = K1 × Qm. The degree of P saturation (DPS) represents the amount of P adsorbed in soil, DPS = (Available P/Qm) × 100%. The Desorbable P ratio (DPR) is the ratio of the amount of P desorbed from the soil to the amount of P adsorbed.
To analyze the effects of inoculation with earthworm and PSB on P adsorption and desorption in the soil, the data were evaluated by a two-way analysis of variance (ANOVA) and a least significant difference (LSD) test using SPSS 26.0 (SPSS Inc., Chicago, IL, USA). Differences were considered significant at p < 0.05. Pearson’s correlation test was used to determine the significance of correlations between the soil characteristics and soil P adsorption–desorption parameters. All findings were obtained using Origin 8.0 software (Origin Lab, Northampton, MA, USA). Redundancy analyses between soil characteristics and soil phosphorus adsorption–desorption parameters were performed using Canoco 5 software (Microcomputer Power, Ithaca, NY, USA).

3. Results

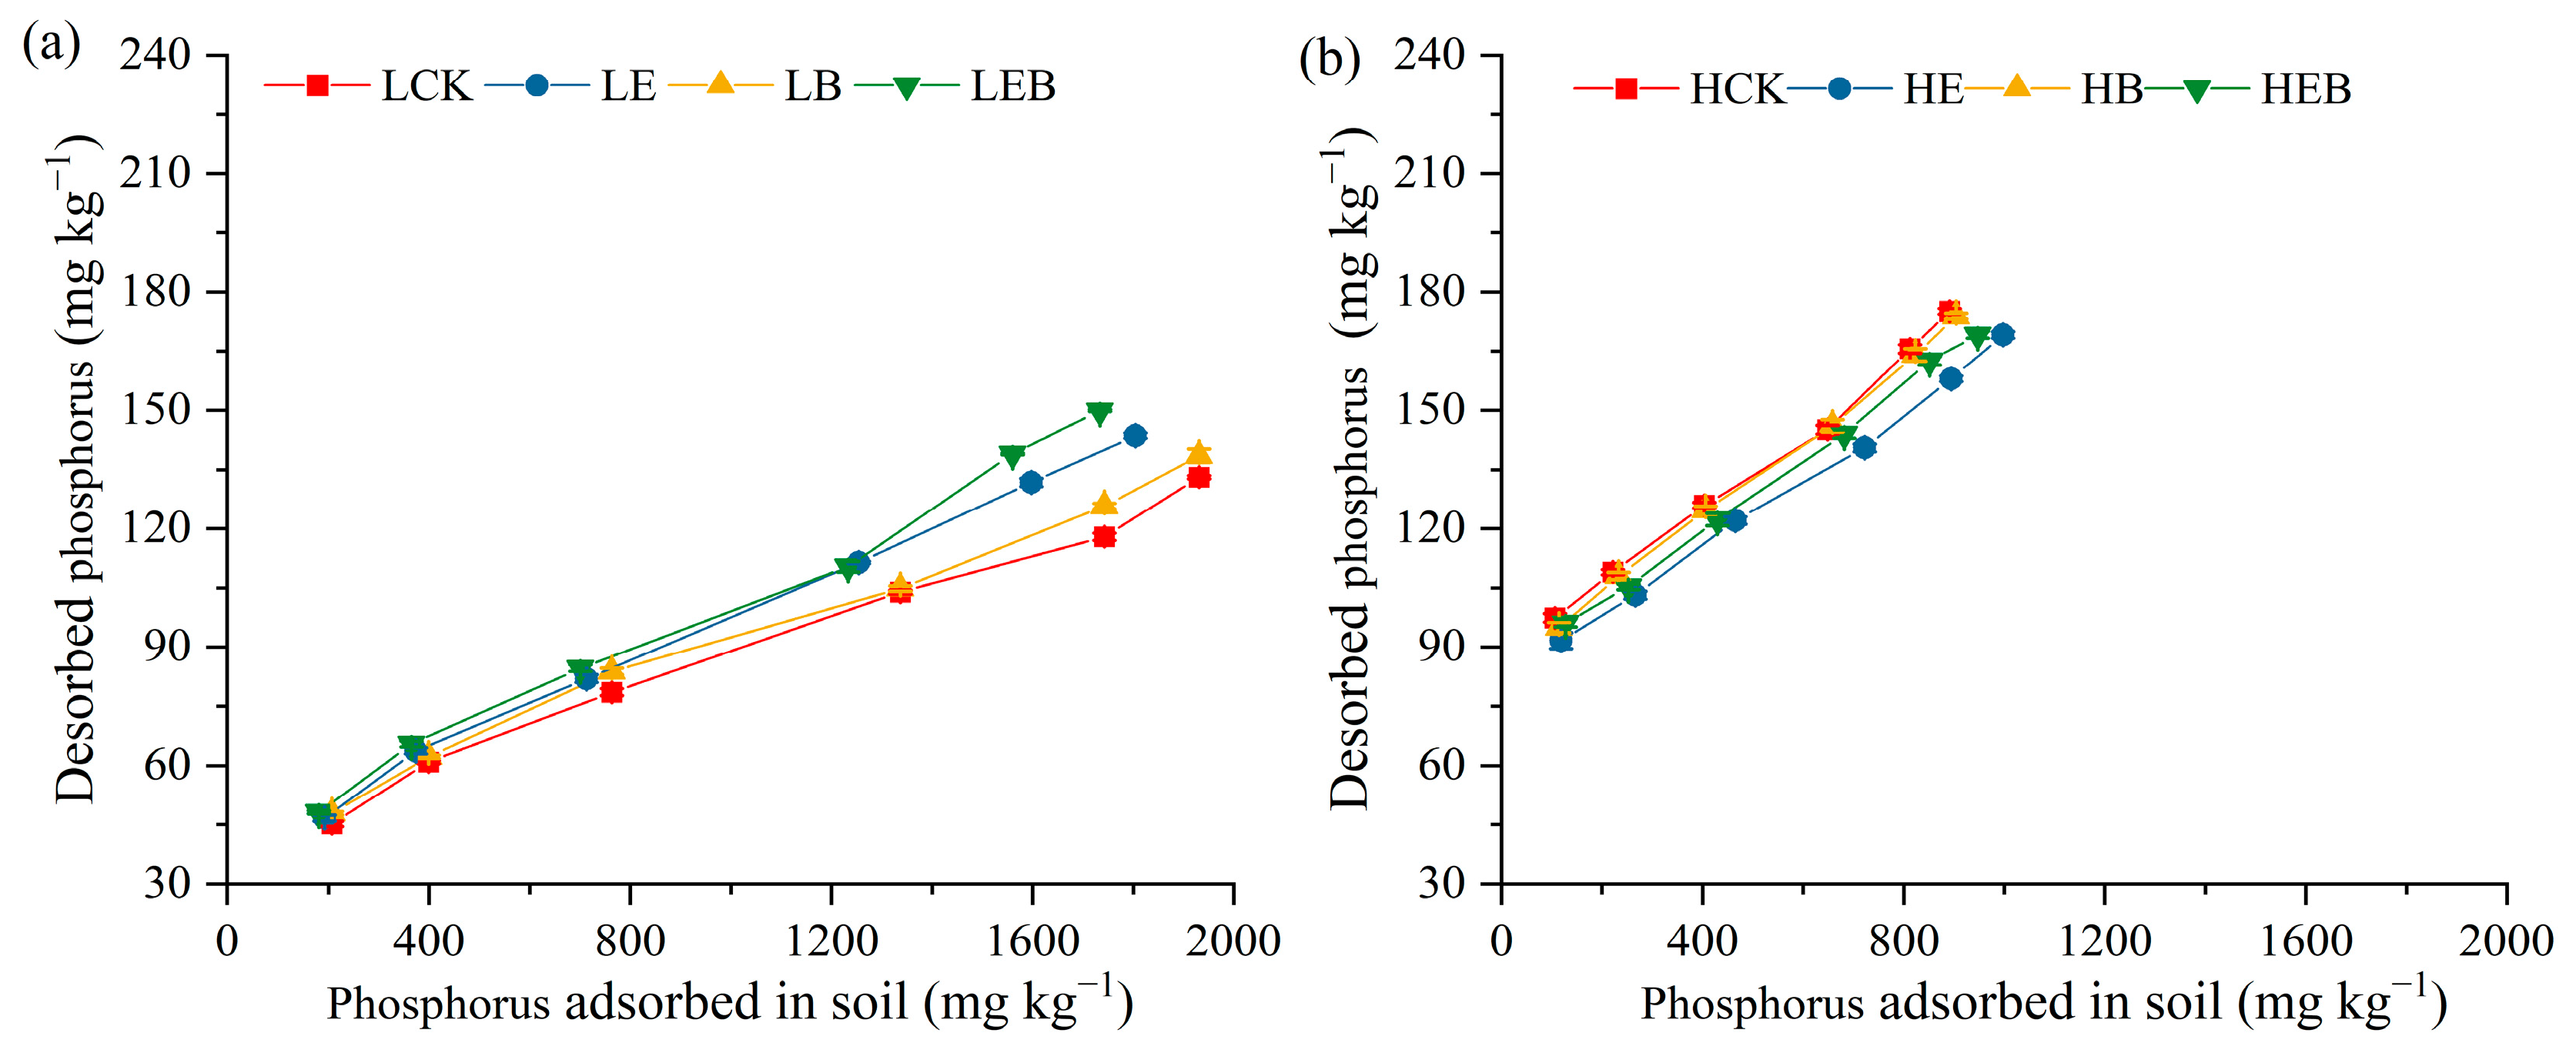
3.1. Effect of Inoculation with Earthworms and PSB on Soil P Adsorption

In LP soils, P adsorption increased with rising equilibrium P concentrations (Figure 1a). However, when the equilibrium P concentration exceeded 60 mg L−1, the adsorption rate notably slowed down. Compared to the LCK treatment, the LE, LB and LEB treatments significantly reduced P adsorption across different equilibrium P solution concentrations (p < 0.05), with P adsorption being approximately LCK > LB > LE > LEB. At an equilibrium phosphorus concentration of 160 mg L−1, P adsorption in soils treated with LE, LB and LEB was reduced by 11.86%, 5.67% and 15.29%, respectively, relative to the LCK treatment.
In HP soils, soil P adsorption increased with increasing equilibrium solution P concentration, but the rate of adsorption significantly slowed down when the soil equilibrium solution P concentration was greater than 30 mg L−1 (Figure 1b). The HE and HEB treatments significantly increased the amount of P adsorbed by the soil compared to HCK (p < 0.05). At an incorporated P concentration of 160 mg L−1, soil P adsorption was increased by 9.40% and 6.27% for the HE and HEB treatments, respectively, compared to the HCK treatment (891.10 mg kg−1).
The relationship between soil P adsorption and equilibrium solution P concentration under different inoculation treatments was fitted using Langmuir and Freundlich isothermal adsorption equations, and both equations were fitted to a significant level (Table 2). The R2 values for the Langmuir equation ranged from 0.990 to 0.999, while those for the Freundlich equation ranged from 0.960 to 0.988. The Langmuir equation exhibited a better fit for the isothermal adsorption curves of soil P in both LP and HP soils. Therefore, it was chosen for subsequent data analysis.

3.2. Effect of Inoculation with Earthworms and PSB on Soil P Adsorption Parameters

In LP soils, the LE, LB and LEB treatments significantly enhanced readily desorbable P by 15.50–20.83% relative to the L treatment, with no notable differences among the three inoculated treatments. In comparison to the LCK treatment, the Qm values for the LE, LB and LEB treatments diminished by 2.98–12.44% (Table 3), the K values reduced by 7.23–18.57% and the maximum buffer capacity declined by 10.01–28.14%. The Qm and maximum buffer capacity values for the LEB therapy were markedly lower than those for the LE and LB treatments. In comparison to LCK, the LE, LB and LEB treatments markedly enhanced the degree of P saturation of LP soils. Two-way ANOVA indicated that the inoculation of earthworms or PSB significantly influenced the soil’s readily desorbable P, Qm, K, maximum buffer capacity and degree of P saturation, with their interactions also significantly impacting K and maximum buffer capacity (Table 3).
In HP soils, the HE treatment resulted in increases of 4.57% in Qm, 22.36% in K and 28.21% in maximum buffer capacity when compared to HCK (p < 0.05, Table 3). The reduction in readily desorbable P and degree of P saturation were 3.68% and 7.55%, respectively. The HEB treatment resulted in increases of 15.53% in K and 16.18% in maximum buffer capacity. Two-way ANOVA indicated that the interaction between earthworms and PSB significantly influenced the adsorption parameters (Table 3).

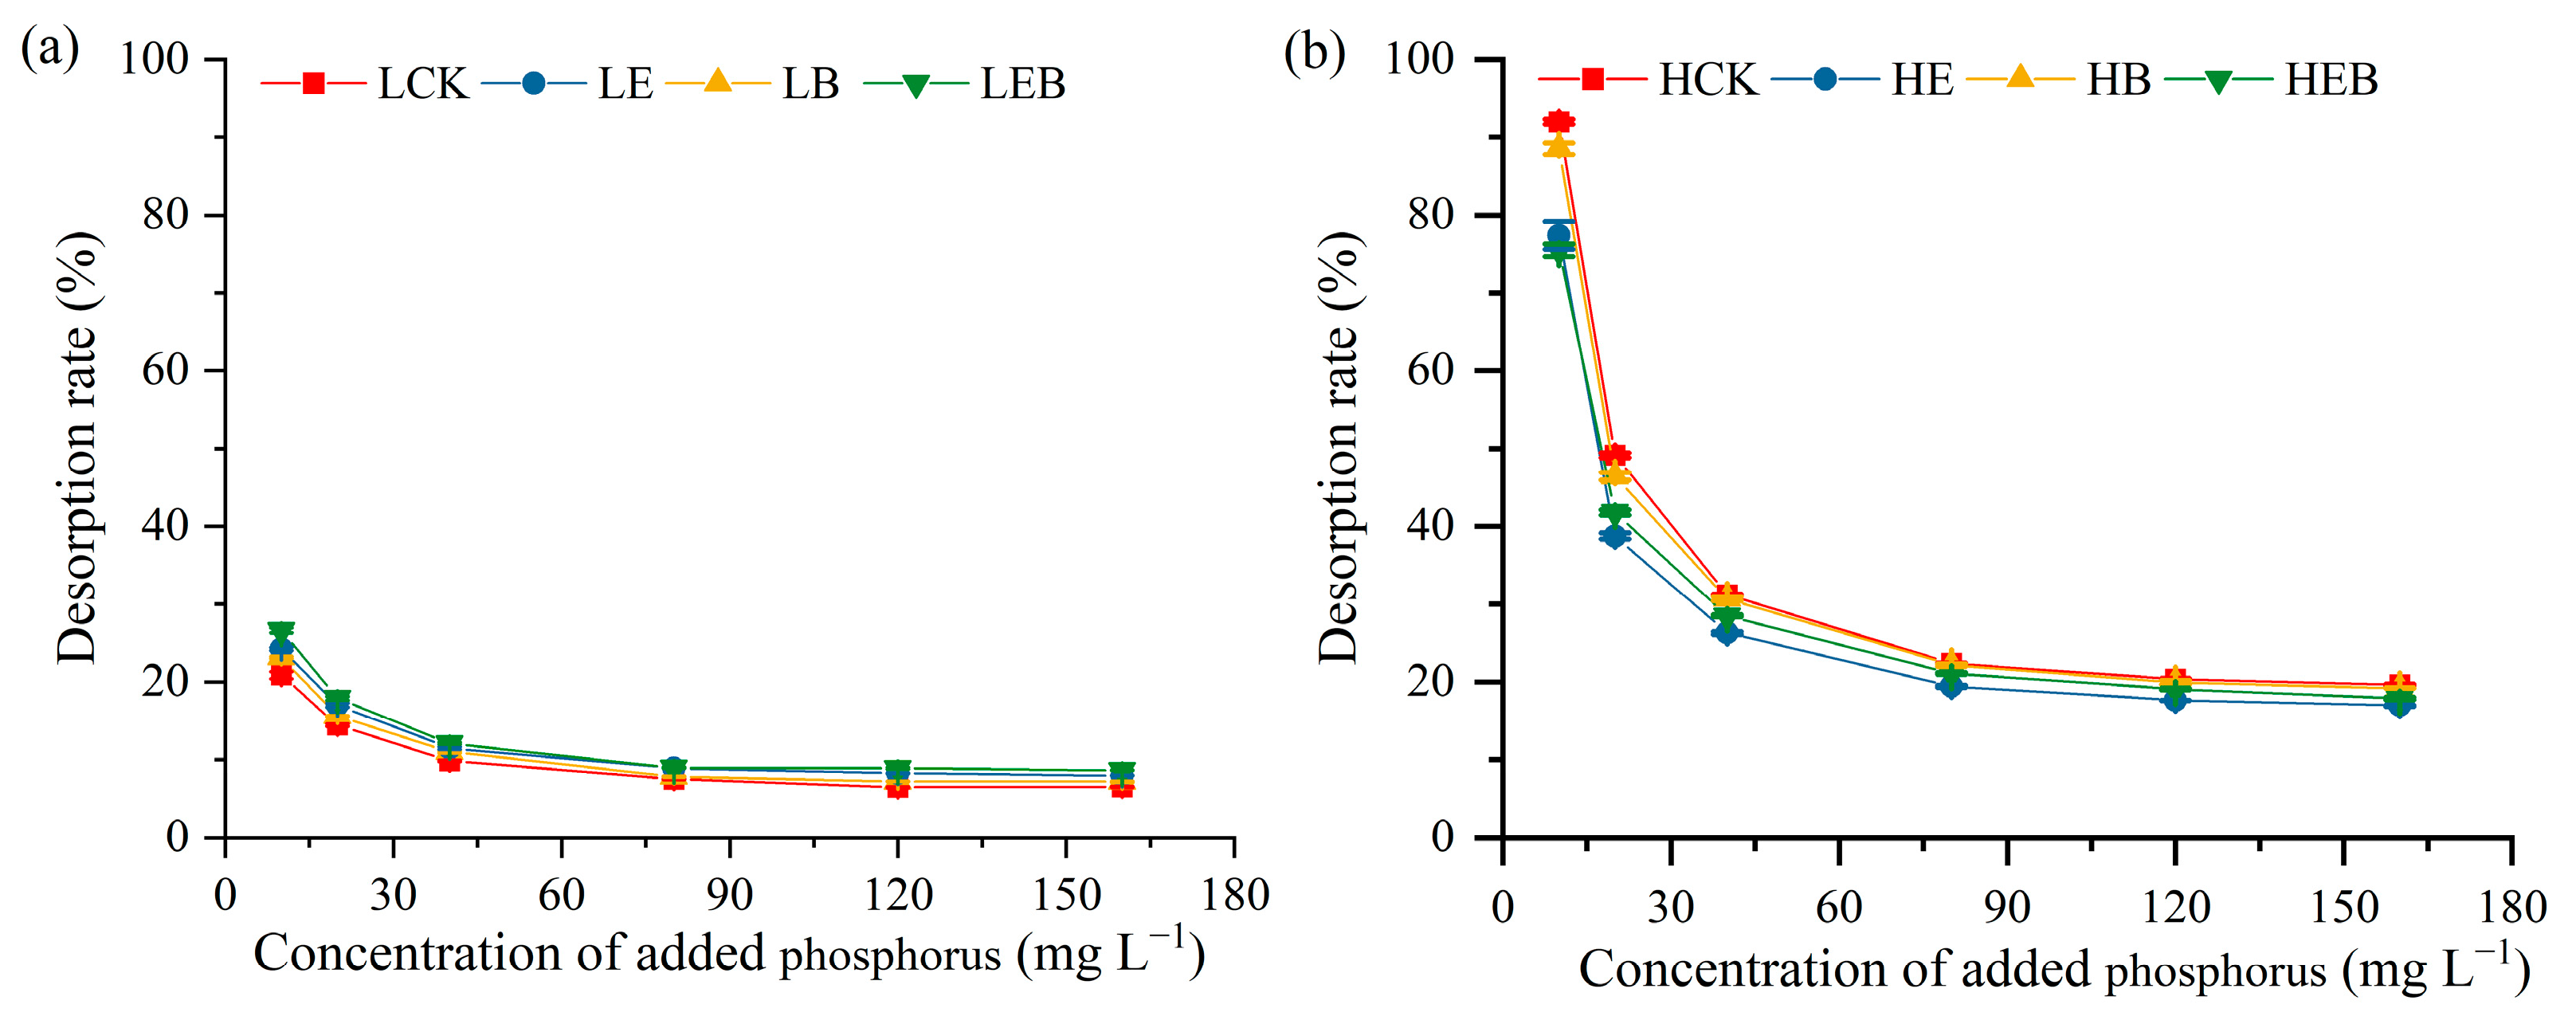
3.3. Effect of Inoculation with Earthworms and PSB on Soil P Desorption Characteristics

The graphs illustrate the variation in desorbed P in LP and HP soils following various inoculation treatments, indicating that an increase in adsorbed P corresponded with a rise in desorbed P (Figure 2). The rate of soil P desorption progressively diminished with an increase in the initial concentration of P in the solution. In LP soils, the average desorption rates of the LCK, LE, LB and LEB treatments were 10.94%, 12.98%, 11.99% and 13.85%, respectively (Figure 3). The inoculation treatments resulted in a significant increase in the soil P desorption rate (P < 0.05, Figure 3a). The average desorption rate increased by 0.34–2.29% in the LE treatment and 1.37–3.36% in the LB treatment and significantly increased by 1.44–5.74% in the LEB treatment compared to the LCK treatment. In HP soils, the average desorption rates for the HCK, HE, HB and HEB treatments were 39.12%, 32.74%, 37.83% and 33.96%, respectively (p < 0.05, Figure 3b). The HE and HEB treatments markedly decreased both the quantity of soil P desorbed and the desorption rate at all concentrations in comparison to HCK.

3.4. Effect of Inoculation with Earthworms and PSB on Soil Properties

In LP soils, the pH of LEB soil decreased by 0.29 relative to LCK. Inoculation treatment significantly decreased TP content in soil while increasing AP and MBP content (p < 0.05, Table 4). The LE treatment resulted in a significant increase in SOC and CaCO3 content by 5.85% and 7.56%, respectively, in comparison to LCK. Two-way ANOVA indicated that inoculation with earthworms or PSB independently had a significant impact on LP soils pH, TP, AP, MBP and CaCO3 content, whereas the interaction between the two factors was not significant (Table 4). Regarding HP soils, HE and HEB significantly increased soil SOC content and HEB also significantly decreased AP compared to HCK (p > 0.05).

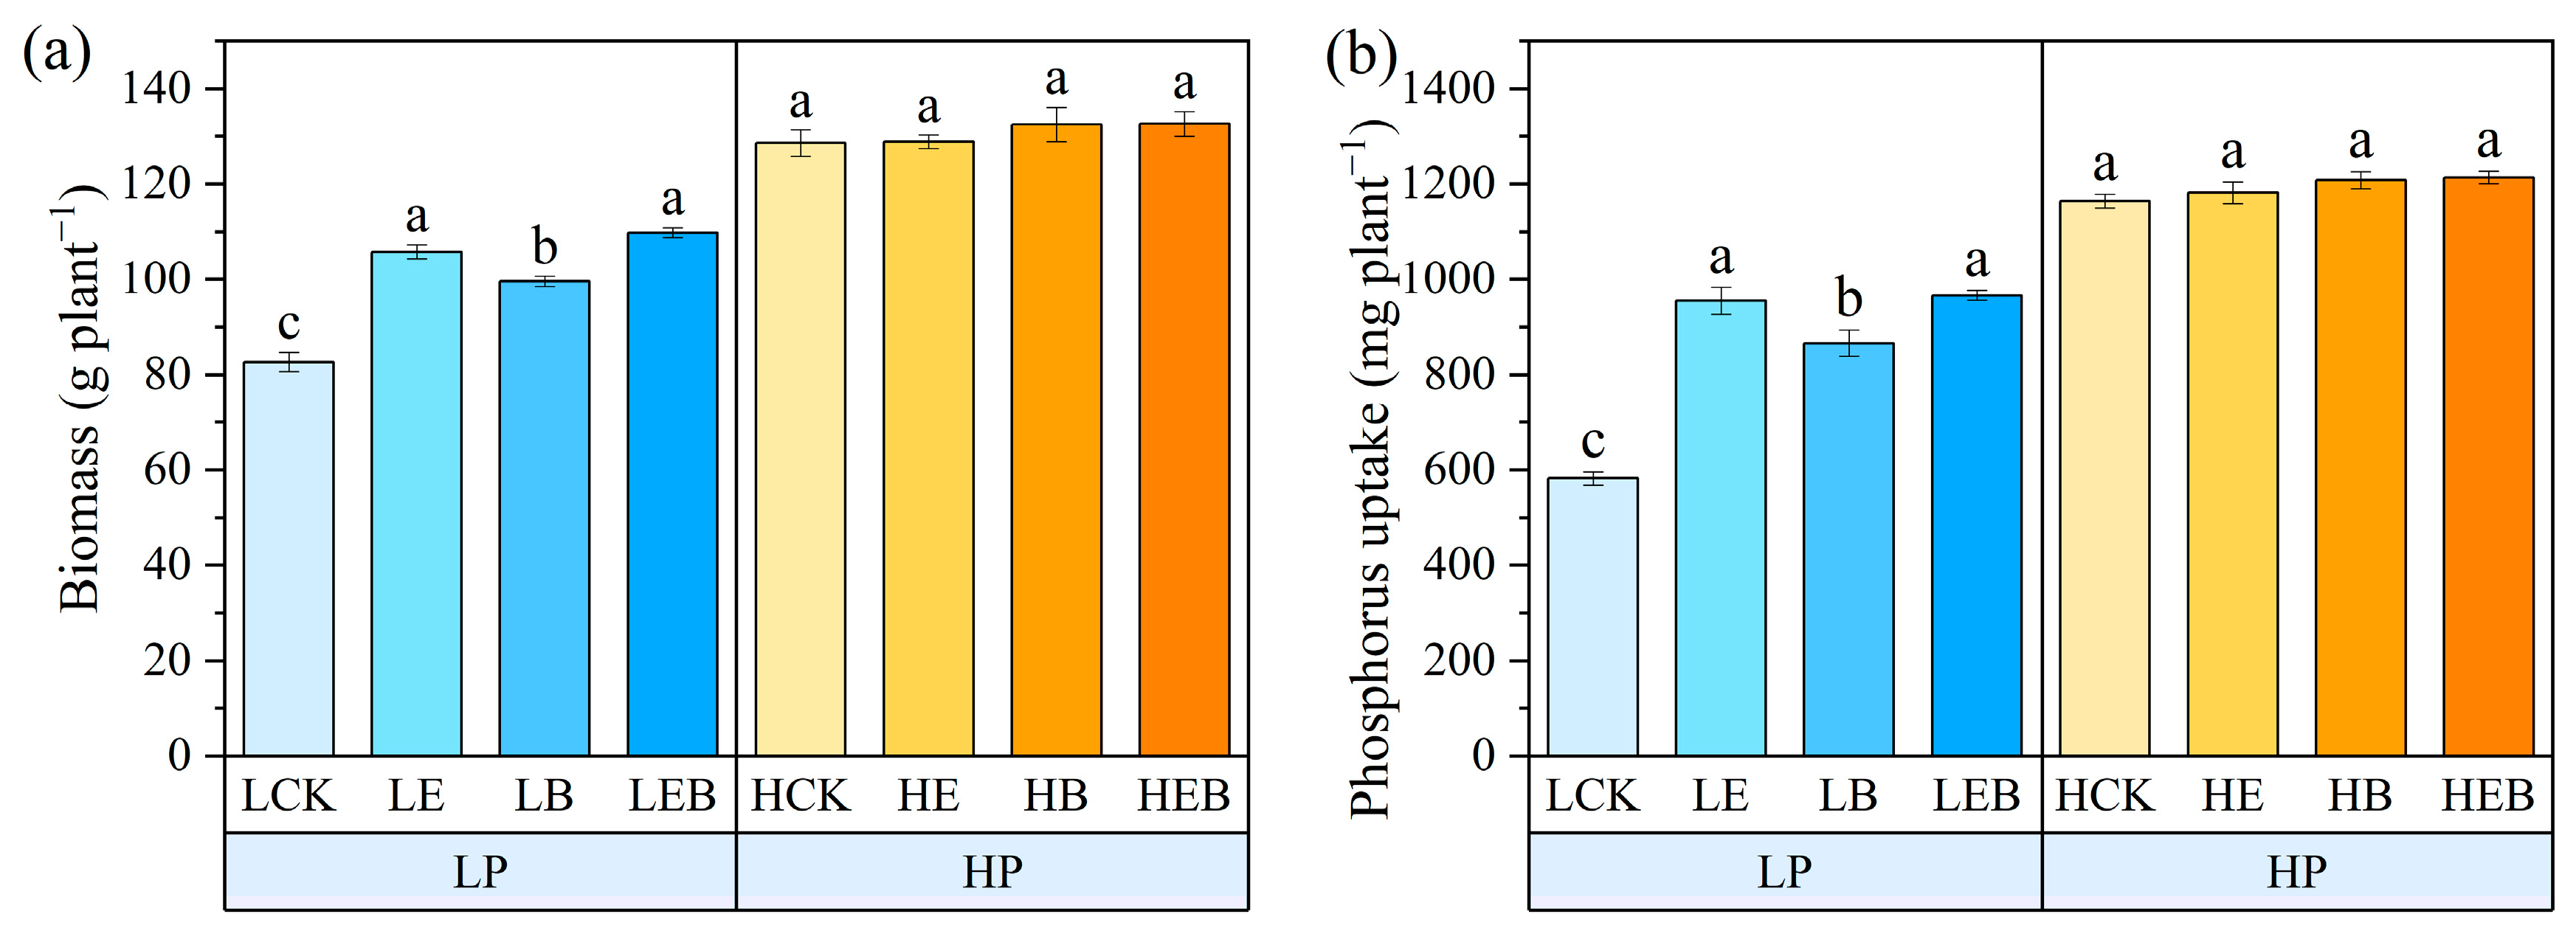
3.5. Effect of Inoculation with Earthworms and PSB on Tomato Biomass and Phosphorus Uptake

Compared to the LCK, inoculation treatments significantly enhanced the biomass and P uptake of tomato plants (p < 0.05, Figure 4). The biomass of tomato plants increased by 20.39–32.80% and P uptake increased by 28.92–40.84%. The total P uptake of tomato plants in the LEB treatment was significantly higher than that in the LE and LB treatments. The biomass and P uptake of tomato plants in HP soil did not differ significantly among all treatments (Figure 4).

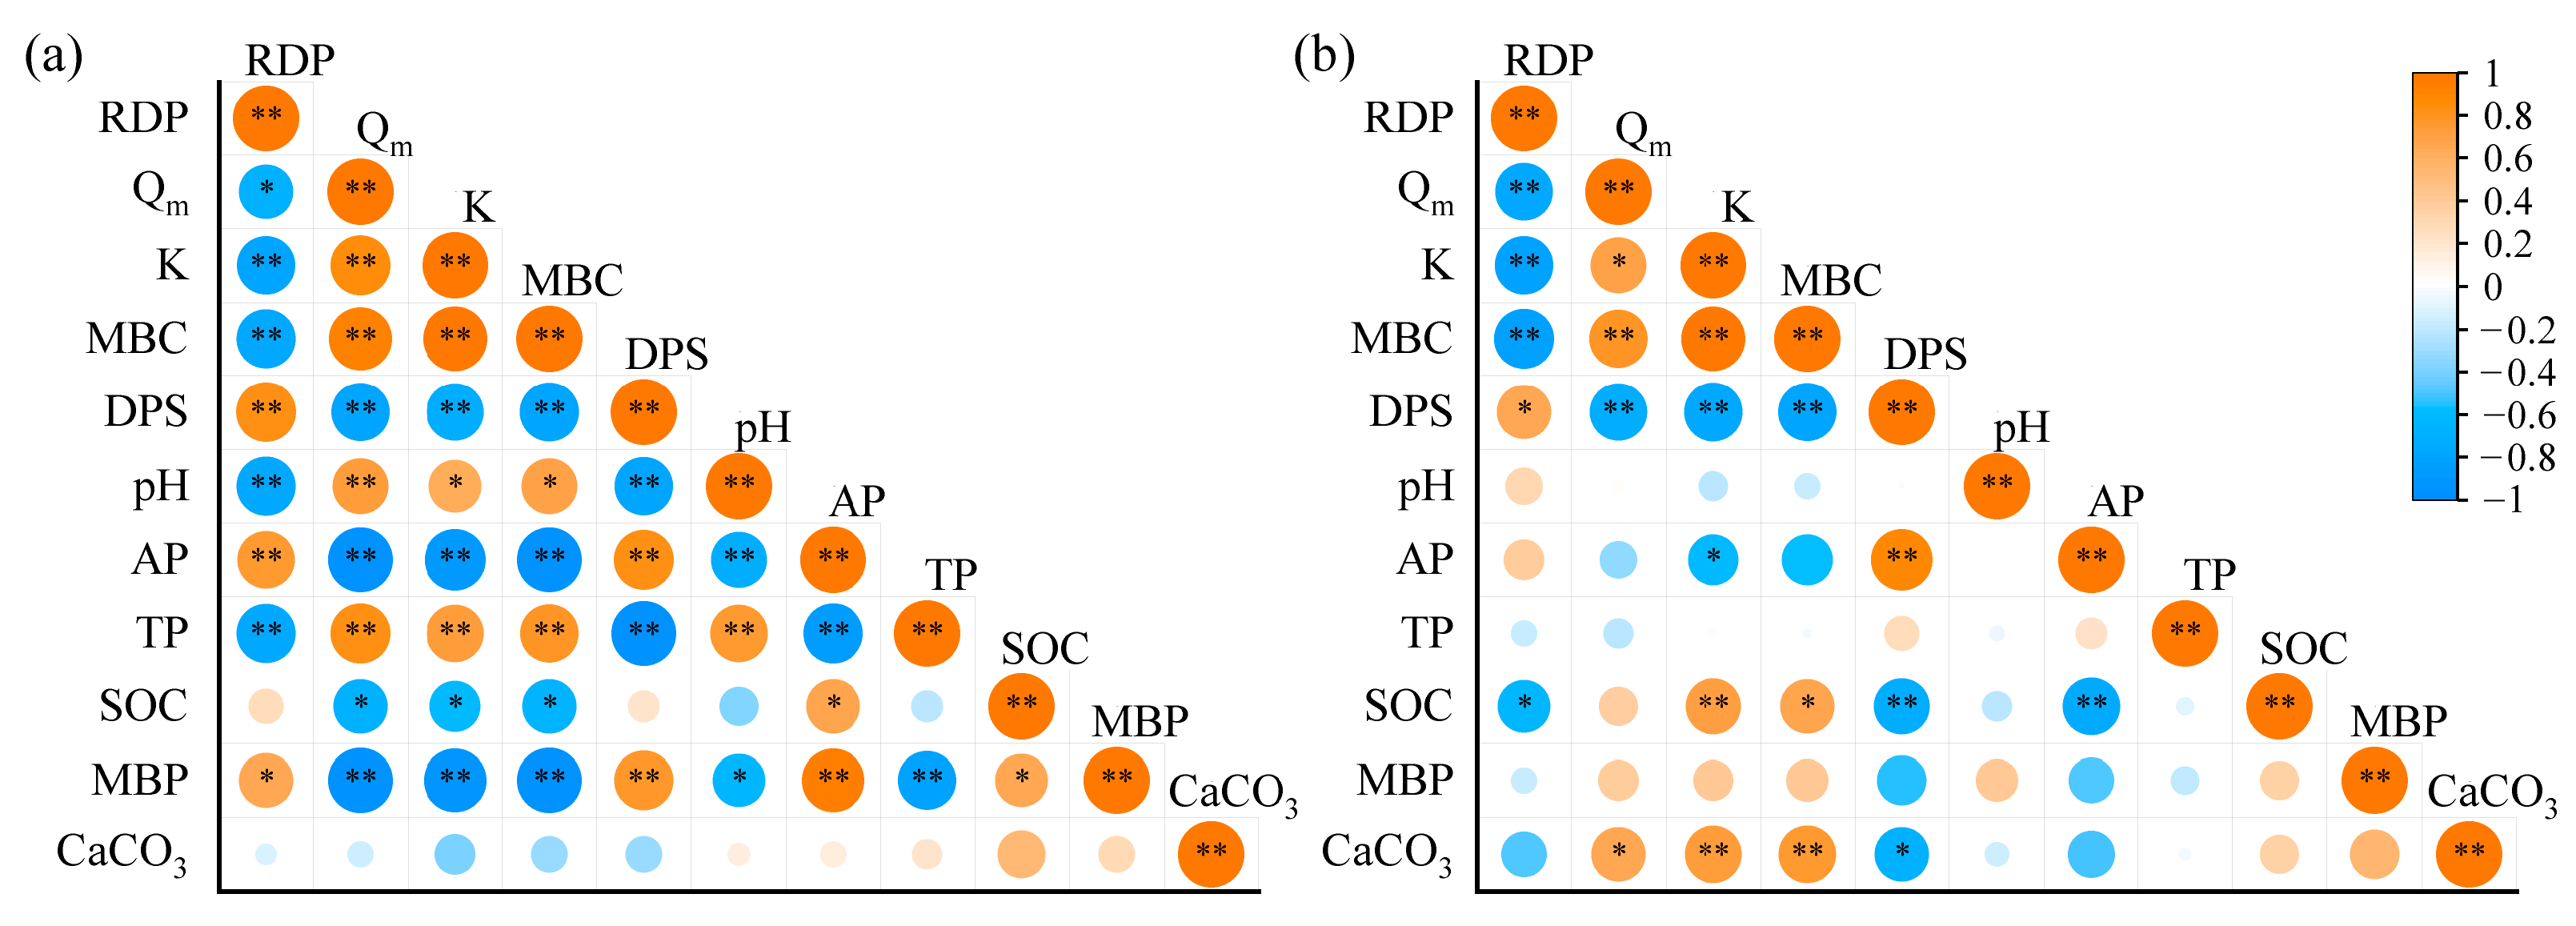
3.6. Adsorption–Desorption Properties of P in Response to Soil Properties

The results of correlation analysis between soil properties and phosphorus adsorption–desorption parameters are shown in Figure 5a. In LP soils, RDP and DPS exhibited significant positive correlations with AP and MBP, while showing significant negative correlations with pH and TP (p < 0.05). The relationships among Qm, K and MBC with these soil properties were inversely related to those of RDP. RDA analysis indicated that soil properties accounted for 94.20% of the total variation in phosphorus sorption parameters (Figure 6a). The initial redundancy factor (RDA1) accounted for 93.98% of the variation, primarily associated with AP and MBP content.
In HP soils, Qm, K and MBC exhibited a significant positive correlation with CaCO3 content, while DPS showed significant negative correlations with both SOC and CaCO3 content and a significant positive correlation with AP (Figure 5b). The RDA analysis indicated that soil properties accounted for 66.55% of the total variation in phosphorus sorption parameters (Figure 6b). The variations were primarily linked to alterations in soil CaCO3 content.

4. Discussion

4.1. Characteristics of Soil P Adsorption Differ for Different P Levels

The characteristics of P adsorption and desorption in soils are frequently utilized to forecast its mobility and effectiveness within these environments. The Qm (maximum P adsorption capacity of the soil), K (adsorption constants) and MBC (maximum buffer capacity) were lower in high-phosphorus (HP) soils than those in low-phosphorus (LP) soils, regardless of inoculation with earthworms or phosphate-solubilizing bacteria (PSB) (Table 3). This indicates that the adsorption capacity of high-phosphorus soils for phosphorus is much lower than that of low-phosphorus soils. This aligns with prior research, indicating that P in the soil accumulates annually with extended planting years, leading to a decrease in maximum P adsorption and maximum buffer capacity over time, while the saturation of P adsorption increases each year [19,20]. The maximum P adsorption capacity of soils denotes the quantity of effective P adsorption sites present in the soil. The maximum P adsorption capacity of high-phosphorus soils was reduced by 52.63–45.91% compared with that of low-phosphorus soils, reflecting the fact that long-term application of P fertilizers reduced the P pool capacity. Adsorption constants and maximum buffer capacity serve as indicators of soil adsorption strength and P storage capacity in soil, respectively. Higher adsorption constants and maximum buffer capacity increase the potential of soil to fix P. The adsorption constants and maximum buffer capacity of high-phosphorus soils were reduced by 44.86–17.23% and 74.11–55.32%, respectively, compared to low-phosphorus soils. The reduction in the adsorption capacity of P-rich soils is attributed to the finite availability of P adsorption sites within the soil matrix. In soils characterized by high adsorption capacity, prolonged excessive application of P fertilizers can lead to P accumulation and a decrease in available P adsorption sites [21]. The degree of P saturation (DPS) of high-phosphorus soils was significantly increased by 12.48–14.00% as compared to low-phosphorus soils. It serves as an effective indicator of soil P content, adsorption characteristics and the potential risk of P release [22]. An increase in the degree of P saturation is associated with a reduction in the soil’s capacity to adsorb P, resulting in a greater amount of P entering the soil liquid phase. Research indicates that elevated soil P levels reduce the soil’s capacity to retain P [23], thereby heightening the risk of P loss.
Desorption of P from soil is typically regarded as the inverse of adsorption and entails the reutilization of adsorbed P [24]. The quantity and rate of desorption diminish as adsorption capacity increases. Table 3 indicates that the P adsorption capacity of high-phosphorus soils is lower than that of low-phosphorus soils; however, the desorption amount is higher than that of low-phosphorus soils, which negatively impacts P storage in the soil. The effect of soil P levels on the adsorption and desorption characteristics of soil P is primarily due to an increase in effective P, which enhances the saturation of P adsorption in the soil, reduces the fixation rate of P and facilitates its desorption [25]. Soils with elevated P levels typically exhibit increased P adsorption at the surface sites of secondary clay minerals, leading to the gradual saturation of these adsorption sites [26]. Consequently, only a limited portion of the adsorbed P is available for desorption. Chrysostome et al. identified a degree of P saturation of 15% as the critical threshold for soil P loss [27]. This study found that the degree of P saturation in high-phosphorus soils ranged from 13.95% to 14.98%, indicating a high risk of P loss.

4.2. Effects of Inoculation with Earthworms or PSB on Soil P Adsorption and Desorption Characteristics

In low-phosphorus soils, inoculation with earthworms or (and) PSB significantly reduced the Qm (maximum P adsorption capacity of the soil), K (adsorption constants) and MBC (maximum buffer capacity). The reduction in maximum P adsorption capacity, adsorption constants and maximum buffer capacity indicated that the inoculation treatments reduced the ability of the soil to adsorb P. The reduction in adsorption capacity in low-phosphorus soils may be associated with the increase in AP, SOC and MBP (Figure 6). This is similar to the findings of Jalali and Jalali that the adsorption and desorption characteristics of P in calcareous soils are related to a number of factors such as soil P levels, organic matter content and calcium content [28]. The inoculation of earthworms enhanced the AP content, which occupied the adsorption sites on the soil’s colloidal surface. This process reduced the adsorption capacity and increased the adsorption saturation of the soil for P [29]. The intestines of earthworms facilitate the decomposition of slow-growing fungi and promote the proliferation of faster-growing bacteria, thereby enhancing the rate of P mineralization and catabolic capacity [30]. The slime produced by earthworms stimulates dormant microorganisms in the soil, thus promoting the activation of microbial populations and contributing to MBP [30]. Earthworm activity can reduce P adsorption by enhancing organic matter content in the soil [31]. This enhancement facilitates complex chelating reactions between organic matter and metal oxides or obscures soil adsorption sites for P [13,32]. Regelink et al. and Nobile et al. found that the adsorption affinity of soil clay mineral surfaces for P diminishes as SOC increases [33,34]. Inoculation with PSB may reduce the soil’s adsorption capacity for P by increasing the content of AP and MBP (Figure 5 and Figure 6), aligning with the findings of Shi et al. [35]. PSB may facilitate the dissolution and mineralization of mineral phosphates in the soil by producing protons, secreting organic and inorganic acids and releasing phosphatases [36]. Additionally, they can promote the release of phosphate ions through the chelation of metal cations by organic acids [5,32]. The released effective P occupies adsorption sites on the soil’s colloidal surface, thereby diminishing the capacity and strength of soil P adsorption. The reduction in soil adsorption capacity may be associated with the decline in soil pH (Figure 6). Research indicates that maximum P adsorption capacity of soil declines as pH decreases [2,6]. A decrease in pH in calcareous soils can diminish P adsorption by soil colloids and enhance P utilization in the soil [37]. This study found that inoculation treatment in low-phosphorus soils decreased soil P adsorption capacity while enhancing P desorption and desorption rate. The reduction in P adsorption sites and the decrease in adsorption strength (maximum P adsorption capacity and adsorption constants) indicated that P was more easily desorbed [38]. This outcome aligns with the results reported by Li et al. [39] and Shi et al. [35].
In HP soils, inoculation with earthworms resulted in significant increases in maximum P adsorption capacity, adsorption constants and maximum buffer capacity, as well as enhancements in P reservoir capacity and P storage capacity. Correlation and RDA analyses demonstrated that the rise in CaCO3 content significantly contributed to the improved P adsorption capacity in earthworm-inoculated treated soils. Calcium glands in earthworms favor an increase in soil calcium content [39], leading to the adsorption of P on calcium carbonate and thus affecting the adsorption–desorption process [40]. In calcareous soils, when P in the soil solution attains a specific concentration, phosphate displaces the ligand groups of soil colloids or clay minerals on the surface of calcium, resulting in adsorption [41,42]. The precipitation reaction between CaCO3 and P may predominate in soil P adsorption at elevated P concentrations [42]. Adsorbed P undergoes transformation by amorphous calcium phosphate over an extended duration, resulting in the formation of crystalline or more stable P. Earthworms increase the stability of soil aggregates by engulfing, mixing and squeezing the soil and producing mucins and mucopolysaccharides to cement the soil [43,44,45]. Improving the stability of soil aggregates enhances the soil’s ability to fix P and reduces the risk of P loss from the soil [46].

5. Conclusions

The maximum P adsorption capacity, adsorption constants and maximum buffer capacity of high-phosphorus soil substrates were much lower than those of low-phosphorus soil substrates, while the P desorption rate was greatly increased. This implies that high-phosphorus soil substrates have a lower capacity to adsorb P and a higher capacity to desorb it. Inoculation with earthworms and phosphate-solubilizing bacteria reduced the maximum P adsorbed, adsorption constant and maximum buffer capacity, whereas it increased the soil’s readily desorbed P and P desorption rate in low-phosphorus soil substrates. Co-inoculation with earthworms and phosphate-solubilizing bacteria was even more effective. Inoculation with earthworms and phosphate-solubilizing bacteria may have reduced soil P adsorption by increasing the available P and microbial phosphorus content of low-phosphorus soil substrates. Inoculation with earthworms increased the maximum P adsorbed, adsorption constant and maximum buffer capacity while decreasing the soil P desorption rate in high-phosphorus soil substrates. The free CaCO3 content is the main factor affecting the P adsorption and desorption capacity of high-phosphorus soils.

Supplementary Materials

The following supporting information can be downloaded at: https://www.mdpi.com/article/10.3390/agronomy15030659/s1. Figure S1 Phylogenetic tree based on 16S rRNA genes. Table S1 Characteristics of phosphate-solubilizing bacteria.

Author Contributions

Conceptualization, L.Y. (Lijuan Yang) and F.D.; Data curation, L.Y. ( Leixin Yu) and Y.J.; Formal analysis, F.D., T.W. and L.Y. (Leixin Yu); Funding acquisition, L.Y. (Lijuan Yang); Investigation, F.D., T.W. and Y.J.; Validation, Y.J. and Q.Y.; Methodology, L.Y. (Leixin Yu) and Q.Y; Project administration, L.Y. (Lijuan Yang) and C.Y.; Resources, L.Y. (Lijuan Yang); Software, F.D. and T.W.; Supervision, C.Y. and Q.Y.; Visualization, Q.Y. and F.D.; Writing—original draft, F.D.; Writing—review and editing, L.Y. (Lijuan Yang) and F.D. All authors have read and agreed to the published version of the manuscript.

Funding

This research was financially supported by the Program of Distinguished Professor of Liaoning Province, China (01062920001).

Data Availability Statement

The original data presented in the study are included in the article. Further inquiries can be directed at the corresponding authors.

Acknowledgments

The authors thank all those who provided helpful suggestions on this manuscript.

Conflicts of Interest

Author Chuang Yang was employed by the company Shenyang Hengxin Technology Management Consulting Service Co., Ltd. The remaining authors declare that the research was conducted in the absence of any commercial or financial relationships that could be construed as a potential conflict of interest.

References

  1. Adesemoye, A.O.; Kloepper, J.W. Plant-microbes interactions in enhanced fertilizer-use efficiency. Appl. Microbiol. Biotechnol. 2009, 85, 1–12. [Google Scholar] [CrossRef] [PubMed]
  2. Guo, S.; Dang, T.; Hao, M. Phosphorus changes and sorption characteristics in a calcareous soil under long-term fertilization. Pedosphere 2008, 18, 248–256. [Google Scholar] [CrossRef]
  3. Mejías, J.H.; Alfaro, M.; Harsh, J. Approaching environmental phosphorus limits on a volcanic soil of Southern Chile. Geoderma 2013, 207, 49–57. [Google Scholar] [CrossRef]
  4. Vandermoere, S.; Ralaizafisoloarivony, N.A.; Van Ranst, E.; De Neve, S. Reducing phosphorus (p) losses from drained agricultural fields with iron coated sand (- glauconite) filters. Water Res. 2018, 141, 329–339. [Google Scholar] [CrossRef]
  5. Rawat, P.; Das, S.; Shankhdhar, D.; Shankhdhar, S.C. Phosphate-solubilizing microorganisms: Mechanism and their role in phosphate solubilization and uptake. J. Soil Sci. Plant Nutr. 2021, 21, 49–68. [Google Scholar] [CrossRef]
  6. Wisawapipat, W.; Kheoruenromne, I.; Suddhiprakarn, A.; Gilkes, R.J. Phosphate sorption and desorption by Thai upland soils. Geoderma 2009, 153, 408–415. [Google Scholar] [CrossRef]
  7. Kishore, N.; Pindi, P.K.; Reddy, S.R. Phosphate-solubilizing microorganisms: A critical review. In Plant Biology and Biotechnology; Bahadur, B., Venkat Rajam, M., Sahijram, L., Krishnamurthy, K., Eds.; Springer: New Delhi, India, 2015; pp. 307–333. [Google Scholar]
  8. Teng, Z.; Zhu, J.; Shao, W.; Zhang, K.; Li, M.; Whelan, M.J. Increasing plant availability of legacy phosphorus in calcareous soils using some phosphorus activators. J. Environ. Manag. 2020, 256, 109952. [Google Scholar] [CrossRef]
  9. Gaind, S. Phosphate dissolving fungi: Mechanism and application in alleviation of salt stress in wheat. Microbiol. Res. 2016, 193, 94–102. [Google Scholar] [CrossRef]
  10. Bhakta, J.N.; Balaram, S.; Pallabi, B. Isolation and characterization of potential phosphate solubilizing bacteria from earthworm (metaphire posthuma) for applying as biofertilizer. Org. Agric. 2022, 12, 431–444. [Google Scholar] [CrossRef]
  11. Biswas, J.K.; Banerjee, A.; Rai, M.; Naidu, R.; Meers, E. Potential application of selected metal resistant phosphate solubilizing bacteria isolated from the gut of earthworm (metaphire posthuma) in plant growth promotion. Geoderma 2018, 330, 117–124. [Google Scholar] [CrossRef]
  12. Ros, M.B.H.; Hiemstra, T.; van Groenigen, J.W.; Chareesri, A.; Koopmans, G.F. Exploring the pathways of earthworm-induced phosphorus availability. Geoderma 2017, 303, 99–109. [Google Scholar] [CrossRef]
  13. Wandruszka, R.V. Phosphorus retention in calcareous soils and the effect of organic matter on its mobility. Geochem. Trans. 2006, 7, 6. [Google Scholar] [CrossRef] [PubMed]
  14. Fernández, L.; Agaras, B.; Zalba, P.; Wall, L.G.; Valverde, C. Pseudomonas spp. isolates with high phosphate-mobilizing potential and root colonization properties from agricultural bulk soils under no-till management. Biol. Fertil. Soils 2012, 48, 763–773. [Google Scholar] [CrossRef]
  15. Patten, C.L.; Glick, B.R. Bacterial biosynthesis of indole-3-acetic acid. Can. J. Microbiol. 1996, 42, 207–220. [Google Scholar] [CrossRef]
  16. Lane, D.J. 16S/23S rRNA sequencing. In Nucleic Acid Techniques in Bacterial Systematics; Stackebrandt, E., Goodfellow, M., Eds.; John Wiley & Sons: Chichester, UK, 1991; pp. 115–175. [Google Scholar]
  17. Okalebo, J.R.; Gathua, K.W.; Woomer, P.L. Laboratory Methods of Soil and Plant Analysis: A Working Manual, 2nd ed.; Sacred Africa, Nairobi Office: Nairobi, Kenya, 2002; pp. 41–47. [Google Scholar]
  18. Abdala, D.B.; Ghosh, A.K.; Silva, I.R.D.; Novais, R.F.D.; Venegas, V.H.A. Phosphorus saturation of a tropical soil and related P leaching caused by poultry litter addition. Agric. Ecosyst. Environ. 2012, 162, 15–23. [Google Scholar] [CrossRef]
  19. Chakraborty, R.; Sharma, V.K.; Das, D.; Biswas, D.R.; Mahapatra, P.; Shahi, D.K.; Barman, M.; Chobhe, K.A.; Chakraborty, D. Change in phosphorus availability, fractions, and adsorption-desorption by 46-years of long-term nutrient management in anAlfisol of eastern India. Soil Tillage Res. 2024, 236, 105940. [Google Scholar] [CrossRef]
  20. Zhang, Y.H.; Huang, S.M.; Bao, D.J. Phosphorus adsorption and desorption characteristics of different textural fluvo-aquic soils under long-term fertilization. J. Soils Sediments 2019, 19, 1306–1318. [Google Scholar] [CrossRef]
  21. Sharma, S.; Kaur, P. Rice straw management options impact soil phosphorus adsorption-desorption, kinetics and thermodynamics in rice-wheat system of north-western india. Soil Tillage Res. 2025, 248, 106403. [Google Scholar] [CrossRef]
  22. Pautler, M.C.; Sims, J.T. Relationships between soil test phosphorus, soluble phosphorus and phosphorus saturation in Delaware soils. Soil Sci. Soc. Am. J. 2000, 64, 765–773. [Google Scholar] [CrossRef]
  23. Nyamaizi, S.; Messiga, A.J.; Cade-Menun, B.; Cornelis, J.T.; Smukler, S.M. Environmental phosphorus risk classes for silage corn in the fraser valley, canada. Agric. Ecosyst. Environ. 2025, 381, 109423. [Google Scholar] [CrossRef]
  24. Heidari, S.; Reyhanitabar, A.; Oustan, S. Kinetics of phosphorus desorption from calcareous soils using DGT technique. Geoderma 2017, 305, 275–280. [Google Scholar] [CrossRef]
  25. Siddique, M.T.; Robinson, J.S. Phosphorus sorption and availability in soils amended with animal manures and sewage sludge. J. Environ. Qual. 2003, 32, 1114–1121. [Google Scholar] [CrossRef] [PubMed]
  26. Wang, R.; Guo, S.L.; Li, N.N.; Zhang, Y.J.; Jiang, J.S.; Wang, Z.Q.; Liu, Q.F.; Wu, D.F.; Sun, Q.Q.; Du, L.L.; et al. Phosphorus accumulation and sorption in calcareous soil under long-term fertilization. PLoS ONE 2015, 10, e0135160. [Google Scholar] [CrossRef] [PubMed]
  27. Chrysostome, M.; Nair, V.D.; Harris, W.G.; Rhue, R.D. Laboratory validation of soil phosphorus storage capacity predictions for use in risk assessment. Soil Sci. Soc. Am. J. 2007, 71, 1564–1569. [Google Scholar] [CrossRef]
  28. Jalali, M.; Jalali, M. Relation between various soil phosphorus extraction methods and sorption parameters in calcareous soils with different texture. Sci. Total Environ. 2016, 566–567, 1080–1093. [Google Scholar] [CrossRef] [PubMed]
  29. Getie, A.; Kiflu, A.; Meteke, G. Phosphorus sorption characteristics of luvisols and nitisols in north ethiopian soils. Appl. Environ. Soil Sci. 2021, 2021, 1–7. [Google Scholar] [CrossRef]
  30. Sun, M.; Chao, H.; Zheng, X.; Deng, S.; Hu, F. Ecological role of earthworm intestinal bacteria in terrestrial environments: A review. Sci. Total Environ. 2020, 740, 140008. [Google Scholar] [CrossRef]
  31. Martin, A. Short- and long-term effects of the endogeic earthworm Millsonia anomala(Omodeo)(Megascolecidae, Oligochaeta) of tropical savannas on soil organic matter. Biol. Fertil. Soils 1991, 11, 234–238. [Google Scholar] [CrossRef]
  32. Abdala, D.B.; da Silva, I.R.; Vergütz, L.; Sparks, D.L. Long-term manure application effects on phosphorus speciation, kinetics and distribution in highly weathered agricultural soils. Chemosphere 2015, 119, 504–514. [Google Scholar] [CrossRef]
  33. Regelink, I.C.; Weng, L.; Lair, G.J.; Comans, R.N.J. Adsorption of phosphate and organic matter on metal (hydr) oxides in arable and forest soil: A mechanistic modelling study. Eur. J. Soil Sci. 2015, 66, 867–875. [Google Scholar] [CrossRef]
  34. Nobile, C.M.; Bravin, M.N.; Becquer, T.; Paillat, J.M. Phosphorus sorption and availability in an andosol after a decade of organic or mineral fertilizer applications: Importance of pH and organic carbon modifications in soil as compared to phosphorus accumulation. Chemosphere 2020, 239, 124709. [Google Scholar] [CrossRef]
  35. Shi, X.K.; Ma, J.J.; Liu, L.J. Effects of phosphate-solubilizing bacteria application on soil phosphorus availability in coal mining subsidence area in Shanxi. J. Plant Interact. 2017, 12, 137–142. [Google Scholar] [CrossRef]
  36. Bashan, Y.; Kamnev, A.A.; de-Bashan, L.E. Tricalcium phosphate is inappropriate as a universal selection factor for isolating and testing phosphate-solubilizing bacteria that enhance plant growth: A proposal for an alternative procedure. Biol. Fertil. Soils 2013, 49, 465–479. [Google Scholar] [CrossRef]
  37. Penn, C.J.; Camberato, J.J. A critical review on soil chemical processes that control how soil ph affects phosphorus availability to plants. Agriculture 2019, 9, 120. [Google Scholar] [CrossRef]
  38. Bhattacharyya, P.; Nayak, A.K.; Shahid, M.; Tripathi, R.; Mohanty, S.; Kumar, A.; Raja, R.; Panda, B.; Lal, B.; Gautam, P.; et al. Effects of 42-year long-term fertilizer management on soil phosphorus availability, fractionation, adsorption-desorption isotherm and plant uptake in flooded tropical rice. Crop J. 2015, 5, 387–395. [Google Scholar] [CrossRef]
  39. Li, Y.P.; Wang, J.; Shao, M.A. Earthworm inoculation and straw return decrease the phosphorus adsorption capacity of soils in the Loess region, China. J. Environ. Manag. 2022, 312, 114921. [Google Scholar] [CrossRef] [PubMed]
  40. Cheekilote, N.; Samant, P.K.; Dwibedi, S.K.; Jena, B.; Mohapatra, K.K.; Nayak, H.S.; Garnaik, S. Exploring phosphorous dynamics within soil aggregate after 17 years long-term manuring in lateritic inceptisols in rice paddies. Geoderma Reg. 2025, 40, e00908. [Google Scholar] [CrossRef]
  41. Freeman, J.S.; Rowell, D.L. The adsorption and precipitation of phosphate onto calcite. Soil Sci. 1981, 32, 75–84. [Google Scholar] [CrossRef]
  42. Mclaughlin, M.J.; Mcbeath, T.M.; Smernik, R.; Stacey, S.P.; Ajiboye, B.; Guppy, C. The chemical nature of P accumulation in agricultural soils-implications for fertiliser management and design: An australian perspective. Plant Soil 2011, 349, 69–87. [Google Scholar] [CrossRef]
  43. Bossuyt, H.; Six, J.; Hendrix, P.F. Protection of soil carbon by micro-aggregates within earthworm casts. Soil Biol. Biochem. 2005, 37, 251–258. [Google Scholar] [CrossRef]
  44. Mcinerney, M.; Little, D.J.; Bolger, T. Effect of earthworm cast formation on the stabilization of organic matter in fine soil fractions. Eur. J. Soil Biol. 2001, 37, 251–254. [Google Scholar] [CrossRef]
  45. Schrader, S.; Rogasik, H.; Onasch, I.; Jégou, D. Assessment of soil structural differentiation around earthworm burrows by means of X-ray computed tomography and scanning electron microscopy. Geoderma 2007, 137, 378–387. [Google Scholar] [CrossRef]
  46. Li, J.; Yuan, X.; Ge, L.; Li, Q.; Liu, Y. Rhizosphere effects promote soil aggregate stability and associated organic carbon sequestration in rocky areas of desertification. Agric. Ecosyst. Environ. 2020, 304, 107126. [Google Scholar] [CrossRef]
Figure 1. Isothermal adsorption curves of phosphorus in soils with different inoculation treatments. The isothermal adsorption curves of soil phosphorus under different treatments for low-phosphorus soils (LP) and high-phosphorus soils (HP) are represented in (a,b), respectively.
Agronomy 15 00659 g001
Figure 2. Phosphorus desorption curves of soils with different inoculation treatments. (a,b) are phosphorus desorption curves under different treatments for low-phosphorus soils (LP) and high-phosphorus soils (HP), respectively.
Agronomy 15 00659 g002
Figure 3. Phosphorus desorption rate characteristics of soils with different inoculation treatments. (a,b) show the phosphorus desorption rate curves of soil under different inoculation treatments for low-phosphorus soils (LP) and high-phosphorus soils (HP), respectively.
Agronomy 15 00659 g003
Figure 4. Biomass (a) and phosphorus uptake (b) of tomato plants under different inoculation treatments. LP, low-phosphorus soils; HP, high-phosphorus soils. Different lowercase letters for the same assay are significant differences between treatments at p < 0.05 in LP and HP soils, respectively.
Agronomy 15 00659 g004
Figure 5. Correlation analysis between adsorption–desorption characteristics of soil phosphorus and soil properties; (a,b) are correlation analyses of phosphorus adsorption–desorption properties with soil properties for low-phosphorus soils (LP) and high-phosphorus soils (HP), respectively. TP, total phosphorus; SOC, soil organic carbon; AP, available phosphorus; MBP, microbial biomass phosphorus. Qm, maximum P adsorption capacity of the soil; K, adsorption constants; RDP readily desorbable P; MBC, maximum buffer capacity; DPS, degree of P saturation. The colors represent the strength of correlation coefficients, with blue denoting positive correlations and red indicating negative correlations. * and ** denote statistical significance at p < 0.05 and p < 0.01, respectively.
Agronomy 15 00659 g005
Figure 6. Redundancy analysis of adsorption–desorption parameter sets related to soil properties. (a,b) are redundancy analyses of phosphorus adsorption–desorption properties and soil properties for low- and high-phosphorus soils, respectively. TP, total phosphorus; SOC, soil organic carbon; AP, available phosphorus; MBP, microbial biomass phosphorus. Qm, maximum P adsorption capacity of the soil; K, adsorption constants; RDP, readily desorbable P; MBC, maximum buffer capacity; DPS, degree of P saturation.
Agronomy 15 00659 g006
Table 1. Properties of the two soil substrates.
Soil
Substrate
pHEc
(µS cm−1)
Clay
(%)
Silt
(%)
Sand (%)SOC
(g kg−1)
TN
(g kg−1)
TP
(g kg−1)
CaCO3
(g kg−1)
AP
(mg kg−1)
LP7.7324213.3725.6261.0111.441.170.5715.2430.61
HP7.411312.6420.4333.8545.7233.763.742.1317.61206.51
LP, low-phosphorus soil substrate; HP, high-phosphorus soil substrate; Ec, SOC, soil organic carbon; TN, total nitrogen; TP, total phosphorus; AP, available P.
Table 2. Isothermal adsorption equations for soil phosphate under different inoculation treatments.
TreamentLangmuir ModelFreundlich Model
C/Q = C/Qm + 1/K1QmR2Q = K2C1/nR2
LPLCKC/Q = 0.000351C + 0.012040.999Q = 126.009C0.6600.984
LEC/Q = 0.000370C + 0.016870.999Q = 104.332C0.6550.983
LBC/Q = 0.000358C + 0.013880.999Q = 148.454C05930.967
LEBC/Q = 0.000379C + 0.018150.998Q = 96.481C0.6520.978
HPHCKC/Q = 0.000750C + 0.047370.999Q = 47.56C0.60920.981
HEC/Q = 0.000727C + 0.035380.990Q = 61.20C0.59030.960
HBC/Q = 0.000752 + 0.044680.999Q = 53.70C0.59090.978
HEBC/Q = 0.000743C + 0.040590.999Q = 40.51C0.68390.988
LP, low-phosphorus soil substrate; HP, high-phosphorus soils.
Table 3. Parameters of soil phosphorus adsorption characteristics and two-factor ANOVA results of different treatments.
TreamentReadily Desorbable P
(mg kg−1)
Qm
(mg kg−1)
KMaximum Buffer Capacity
(mg kg−1)
Degree of P Saturation (%)
LPLCK9.38 ± 0.17 b2835.71 ± 20.00 a0.0292 ± 0.0004 a82.85 ± 0.53 a1.09 ± 0.03 d
LE10.78 ± 0.43 a2587.63 ± 25.62 c0.0238 ± 0.0004 c61.55 ± 0.37 c1.28 ± 0.04 c
LB10.83 ± 0.13 a2751.27 ± 23.17 b0.0271 ± 0.0005 b74.56 ± 0.7 b1.55 ± 0.05 b
LEB11.33 ± 0.22 a2483.06 ± 24.89 d0.0240 ± 0.0002 c59.53 ± 0.17 d1.72 ± 0.03 a
Earthworms**********
PSB*********
Earthworms × PSBnsns***ns
HPHCK82.80 ± 0.72 a1333.77 ± 8.35 b0.0161 ± 0.0002 c21.45 ± 0.18 d15.09 ± 0.24 a
HE79.75 ± 0.49 b1394.77 ± 7.08 a0.0197 ± 0.0002 a27.50 ± 0.17 a13.95 ± 0.13 b
HB82.80 ± 0.27 a1342.17 ± 6.45 b0.0165 ± 0.0002 c22.13 ± 0.15 c14.93 ± 0.21 a
HEB81.67 ± 0.59 a1343.19 ± 6.85 b0.0186 ± 0.0001 b24.92 ± 0.06 b14.20 ± 0.27 b
Earthworms*********
PSBns****ns
Earthworms × PSB********ns
LP, low-phosphorus soils; HP, high-phosphorus soils. Qm is the maximum P adsorption capacity of the soil; K is the adsorption constant. Different lowercase letters for the same assay are significant differences between treatments at p < 0.05 in LP and HP soils, respectively. * represents p < 0.05, ** represents p< 0.01 and ns represents no significant difference.
Table 4. Effect of different inoculation treatments on physicochemical properties associated with the adsorption and desorption of soil phosphorus.
TreatmentpHTP
(mg kg−1)
AP
(mg kg−1)
MBP
(mg kg−1)
SOC
(g kg−1)
CaCO3
(mg kg−1)
LPLCK7.75 ± 0.05 a518.11 ± 1.14 a30.95 ± 0.61 d23.03 ± 0.16 d12.14 ± 0.22 b15.34 ± 0.25 b
LE7.62 ± 0.05 ab507.10 ± 1.27 b40.03 ± 0.94 b25.43 ± 0.22 b12.85 ± 0.11 a16.50 ± 0.22 a
LB7.60 ± 0.04 ab505.19 ± 1.46 c35.33 ± 0.82 c23.66 ± 0.17 c12.01 ± 0.21 b13.85 ± 0.23 c
LEB7.46 ± 0.05 b493.40 ± 1.35 d42.82 ± 0.92 a26.23 ± 0.15 a12.60 ± 0.16 ab14.87 ± 0.51 bc
Earthworms********
PSB******ns*
Earthworms × PSBnsns ns nsns ns
HPHCK7.22 ± 0.04 a2028.54 ± 2.04 a201.15 ± 2.51 a37.93 ± 0.17 b34.63 ± 0.61 b17.44 ± 0.20 b
HE7.21 ± 0.05 a2028.63 ± 2.51 a194.62 ± 2.73 ab38.46 ± 0.20 ab36.95 ± 0.40 a18.42 ± 0.26 a
HB7.24 ± 0.04 a2029.88 ± 3.21 a200.38 ± 1.85 a38.36 ± 0.23 ab35.63 ± 0.76 ab17.10 ± 0.28 b
HEB7.20 ± 0.04 a2028.50 ± 2.27 a190.62 ± 2.70 b38.71 ± 0.22 a37.45 ± 0.52 a18.25 ± 0.16 a
Earthwormsnsns*ns**
PSBnsnsnsnsnsns
Earthworms × PSBnsnsnsnsnsns
LP, Low-phosphorus soils; HP, high-phosphorus soils. TP, total phosphorus; SOC, soil organic carbon; AP, available phosphorus; MBP, microbial biomass phosphorus. Different lowercase letters for the same assay are significant differences between treatments at p < 0.05 in LP and HP soils, respectively. * represents p < 0.05, ** represents p < 0.01 and ns represents no significant difference.
Disclaimer/Publisher’s Note: The statements, opinions and data contained in all publications are solely those of the individual author(s) and contributor(s) and not of MDPI and/or the editor(s). MDPI and/or the editor(s) disclaim responsibility for any injury to people or property resulting from any ideas, methods, instructions or products referred to in the content.

