Article

Moderate P Fertilizer Promotes Cucumber Yields and Modulates Bacterial Community in the Wheat Cover Crop System

Department of Horticulture, Northeast Agricultural University, Harbin 150030, China
*
Author to whom correspondence should be addressed.
Agronomy 2025, 15(3), 624; https://doi.org/10.3390/agronomy15030624
Submission received: 30 January 2025 / Revised: 20 February 2025 / Accepted: 27 February 2025 / Published: 28 February 2025
(This article belongs to the Section Innovative Cropping Systems)

Abstract

The over-reliance on phosphorus (P) fertilizers in intensive agriculture has led to the depletion of phosphate resources and soil health deterioration, with continuous cropping systems further exacerbating these issues. However, strategies to reduce phosphorus inputs and simultaneously maintain soil health in the wheat cover crop system remain underexplored. With the aim to address this gap, a pot trial was conducted with five P application levels: 100%, 75%, 50%, 25%, and 0% of the conventional application amount (17.42 g·superphosphate·pot−1). For each P level, a corresponding no cover crop treatment was set up. The results demonstrated that wheat cover crop enhanced cucumber growth compared to not applying wheat cover crop, and it also stimulated the proliferation of plant growth-promoting bacteria. More importantly, in wheat cover crop systems, 50% of the conventional P fertilizer rate illustrated the best performance, including the highest value of dry biomass, yield, and soil enzyme activity. This treatment further enriched the beneficial microbial taxa, such as Burkholderiaceae, Rhodobacteriaceae, LWQ8, and Alkalinaceae, optimizing microbial community structure and plant-microbe interactions (p < 0.05). Thus, reducing phosphorus fertilizer to 8.71 g·pot−1 was optimal for achieving soil functions and crop productivity in this study, highlighting the importance of optimizing P fertilizer in cover crop systems.

1. Introduction

Cucumber (Cucumis sativus L.), as one of the main facility vegetables, is widely cultivated in a protected environment [1]. However, the long-term intensive cropping mode of facility vegetables leads to a series of tricky problems regarding soil obstacles, including compaction, nutrient imbalances, and reduced microbial diversity, which degrade soil fertility and productivity [2]. A habitual reliance on excessive use of chemical fertilizers during production to maintain a sustainable high yield with considerable economic benefits exacerbates these issues, causing soil degradation, reduced crop yield, and quality decline [3,4]. These challenges demand sustainable solutions to prevent the deterioration of soil quality from irrational agricultural practices, such as reducing mineral fertilizer input, adopting cover crops, as well as improving nutrient management to safeguard soil health and ensure the sustainability of agricultural productivity [5,6].
Cover crops perform as one of the most promising agronomic practices to control the adverse influences of continuous cropping on soil health by growing plants to improve soil eco-environment, and have garnered wide attention globally [7]. By using living mulch and green manure, they play a positive role in improving crop yield, enhancing soil nutrient availability, regulating soil enzyme activity, and promoting microbial community structure [8,9]. For example, oats and cereal rye reduce soil nitrogen loss through biological fixation and elevate the availability of phosphorous by residue decomposition, directly supporting subsequent crop production [10,11]. Moreover, a medium-term experiment in Ontario indicated that cover crops increased tomato yield by 13% compared to the no cover crops system [12]. In a greenhouse study, wheat (Triticum aestivum L.) performed as a cover crop, enhanced cucumber seedling growth, improved the N, P, and K uptake of plants, increased bacterial and fungal diversity, and particularly promoted beneficial taxa such as Pseudomonas spp., Bacillus, and Pseudomonas spp. [13]. Furthermore, a plot experiment with tobacco also supported the constructive influence of wheat cover crop by increasing the soil organic matter, the activity of soil urease and invertase, as well as promoting the reproducing of plant growth-beneficial bacteria relative to soil nutrition cycling and toxics degradation [14]. Overall, these studies highlight the great potential of cover crops (such as wheat cover crop) in boosting plant growth, nutrition cycling, and improving microbial community structure, offering an ideal practice to secure a sustainable pathway to improve crop productivity at the next crop season with a healthy soil environment.
Phosphorus (P) is a vital macronutrient for plant growth and agricultural productivity, and the judicious application of phosphorus fertilizers can substantially improve the soil phosphorus status, thereby facilitating crop yield [15,16]. However, excessive use of P fertilizers, particularly in intensive vegetable production systems, poses a threat of resource depletion, environmental pollution, and reduced soil bio-availability due to fixation within soil particles [17,18]. This has become a common phenomenon in current agricultural production [19]. For instance, China consumes 22.5% of global P fertilizer with application rates exceeding recommendations by over five-fold in vegetable production [16,20]. Notably, there is growing evidence proving that cover crops can improve soil P cycling and availability as well as yield for subsequent crops by residue decomposition, promoting phosphatase activity and microbial activity [11,21]. For example, one experiment performed in California found that wheat cover crop took around 8–22% residue P of the soil and the residuals from wheat accounted for 20–40% of the P absorbed by wheat [22]. Lozier et al. [23] pointed out that the P pools of winter wheat, red clover, and oat turned out to have much more than when just leaving the fields, so that much of the P released from cover crops could be preserved in the fields. Some studies conducted in the area of northeast China revealed that the cover crops of Triticum aestivum L. and Medicago sativa L. could improve soil microbial biomass carbon and nitrogen content [24], and after straw returning, the key taxonomic groups of the phylum Actinobacteriota and Ascomycota in the microbial networks were altered significantly which led to a more efficient acquisition of soil nutrition for the plants [25]. Moreover, one study revealed a 60% reduction in chemical fertilizers combined with organic fertilizers, significantly increasing soil microbial activity and cotton yield [26]. These investigations indicate that cover crops have a great ability of increasing the availability of the soil P pools, providing an efficacious option to reduce mineral P fertilizer application in a conservation agro-production system.
Based on previous studies [13,14], wheat (Triticum aestivum L.) was utilized as a cover crop during the fallow period of cucumber cropping, and then the effect of the different phosphorus application regimes, combined with wheat cover crop on cucumber (Cucumis sativus L.) yields, enzyme activity, and microbial community dynamics, was assessed mainly in order to determine the optimal P input levels for sustainable greenhouse cucumber production in wheat cover crop systems. This research aimed to identify optimal P management practices that balance crop productivity with soil health, paving the way for more sustainable greenhouse cucumber production systems.

2. Materials and Methods

2.1. Experiment Site and Study Design

This experiment was carried out from May to August 2023 in the greenhouse of the Facility Horticulture Engineering Center of Northeast Agricultural University (45°41′ N, 126°37′ E). Soil that had been continuously used for cucumber cultivation for three years was selected in the study. The basic physicochemical characteristics of the soil were as follows: soil type—silty clay loam (Sand—16.23%, Silt—50.65%, Clay—33.12%), organic matter—18.75 g·kg−1, ammonia nitrogen—53.95 mg·kg−1, nitrate nitrogen 94.20—mg·kg−1, available phosphorus—103.83 mg·kg−1, available potassium—156.74 mg·kg−1, bulk density—1.13 g·cm−3, pH—6.78, EC—892.67 μs·cm−1. The cucumber variety used in the experiment was Cucumis sativus L. Degao C57, purchased from Shandong Degao Seed Industry Co., Ltd., (Dezhou City, China). Chemical fertilizers were used to support cucumber growth and development, including urea (46% N) from China National Petroleum Corporation (Beijing, China), superphosphate (7% P) from Hubei Fengle Ecological Fertilizer Co., Ltd., (Zhongxiang City, China), and potassium sulfate (43% K) from Guotou Xinjiang Lop Nur Potassium Salt Co., Ltd., (Korla, China).
The pot trial was started with 40–45 grains of wheat sown in each pot (20 cm × 15 cm; diameter × height) filled with 2.5 kg cucumber continuous cropping soil (soil moisture content was 16.33%), following the methodology described by Gao et al. [13]. Wheat seedlings were harvested when they reached a height of 20–30 cm and then were cut into small pieces and mixed into the soil for decomposition. Chemical fertilizers were applied to the pots before transplanting the cucumber seedlings. The fertilizer application design was based on conventional practices used by local farmers, corresponding to a planting density of 49,500 plants per hectare (Harbin, China). The standard fertilization regime included 116.85 kg·ha−1 of urea (46% N), 862.35 kg·ha−1 of superphosphate (7% P), and 297 kg·ha−1 potassium sulphate (43% K). Accordingly, the basal application per pot (plant) was calculated as 2.36 g urea, 17.42 g superphosphate, and 6.00 g potassium sulfate.
In order to explore the optimized P application amount for cucumber production under wheat cover crop systems, five P application rates were designed, while nitrogen (N) and potassium (K) application rates remained constant. For each P level, a corresponding no cover crop treatment was set up to further verify the positive benefits of wheat cover crop. Briefly, there were 20 pots for each treatment with a random arrangement resulting in 200 pots in total. The specific experimental arrangements are shown in (Table 1). The three-true leaf seedlings were transplanted in the pots mentioned above. Six uniform individual plants were marked as samples for each treatment. Congruent management practices such as irrigation and pest control were strictly applied consistently among treatments until the experiment ended.

2.2. Plants and Soil Sampling

On the 35th day after transplanting, plants with uniform growth were selected to assess their height and stem thickness (diameter). One entire plant was sampled to determine dry biomass. At the same time, rhizosphere soil was carefully collected by gently brushing it off from the roots after shaking off the large soil blocks. The soil was then sieved through a 2 mm sieve to remove root residuals and tiny rocks. After preparations, the soil was immediately put in a sterile bag and stored in an ice box. The rhizosphere soil was divided into two parts: one part was air-dried for analysis of the soil enzyme activity, while the other part was stored in a freezer at −80 °C for soil micro-bacterial sequencing assay. For all assay indicators, three individual samples were collected for each treatment, and the average of these sample values was used for analysis.

2.3. Measurement of Cucumber Morphological Features and Yield

The plant height from the rhizome to the apical of plants was measured with a pocket tape, and the stem thickness (diameter of the rhizome) with a vernier caliper. Dry biomass was obtained in an oven at 105 °C for 30 min, followed by drying at 75 °C until a constant weight was achieved. The plants used for statistical yield data were randomly marked and then harvested in each treatment, and the determination of accumulative production was successively conducted from the time the first cucumber ripened until the end of the experiment. The total cumulative yield for each treatment was calculated and subsequently converted into individual plant yield.

2.4. Measurement of Soil Enzyme Activity

The activity of soil urease was determined using the sodium benzoate–sodium hypochlorite colorimetric method, following Ge et al. [27]. Invertase activity was analyzed using the 3,5-dinitrosalicylic acid colorimetric method, while alkaline phosphatase activity was assessed using the disodium phenyl phosphate colorimetric method, based on the protocol by Li et al. [28].

2.5. Soil DNA Extraction and High Throughput Sequencing

Soil DNA was extracted from 0.25 g rhizosphere soil using the PowerSoil DNA Isolation Kit (MO BIO laboratories, Garlsbad, CA, USA), referring to the kit instructions. Each composite soil DNA sample was extracted three times, and the three samples were mixed to make the composite DNA samples. The high-throughput sequencing of bacteria was conducted by Majorbio Bio-Pharm Technology Co., Ltd. (Shanghai, China). The V3–V4 variable region of bacteria 16S rDNA genes was amplified by using 338F/806R primer [29]. Each sample was amplified in triplicate, and the PCR products were pooled. Amplified products were verified on a 2% agarose gel under UV light and purified using the AxyPrep DNA Gel Purification Kit (AXYGEN). Based on preliminary gel results, PCR products were quantified using the QuantiFluor™-ST Blue Fluorescence Quantitation System (Promega, Madison, WI, USA) and subsequently sequenced by the Illumina Miseq platform (Majorbio BioPharm Technology Co., Ltd., Shanghai, China). The raw data were quality-filtered with fastp (v19.6), spliced with FLASH (v1.2.7), and denoised using DADA2 (v1.8). After these preparations, the reference database SILVA 138 (http://www.arb-silva.de, accessed on 30 January 2025) and a Naive Bayes classifier were performed to align with the sequences and cluster amplicon sequence variants (ASVs) to provide taxonomic annotations, respectively (97% similarity). To avoid biases caused by uneven sequencing depths, all samples were subsampled to the minimum bacterial sequencing depth for the study, and ASVs with relative abundance greater than 0.01% were retained.

2.6. Statistical Analysis

Data statistics was conducted using IBM SPSS Statistics 27.0. A Two–way ANOVA was performed to evaluate the overall effects of wheat cover crop and phosphorus (P) application on cucumber growth and soil properties. For multiple comparisons among treatments, Tukey’s HSD (p < 0.05) test was applied to assess significant differences in cucumber growth and soil enzyme activities. Since the assumption of normality was not met for α-diversity indices of soil bacterial communities, the Kruskal–Wallis rank-sum test was used for their comparisons Additionally, Welch’s t–test (p < 0.05) was applied to identify differential bacterial species influenced by the wheat cover crop and phosphorus application, considering its robustness against unequal variances. Graphical representations of plant growth and soil enzyme activity were generated using GraphPad Prism 9.5.1. Figures related to soil bacterial composition, α-diversity indices, principal coordinate analysis (PCoA), correlation heatmaps, and differential bacterial families were produced using the Majorbio cloud platform (https://cloud.majorbio.com, accessed on 30 January 2025). The visualization of differential enrichment of ASVs presented by volcano plots was performed with the packages “ggplot2” and “ggrepel” on R program 4.4.0 [30].

3. Results

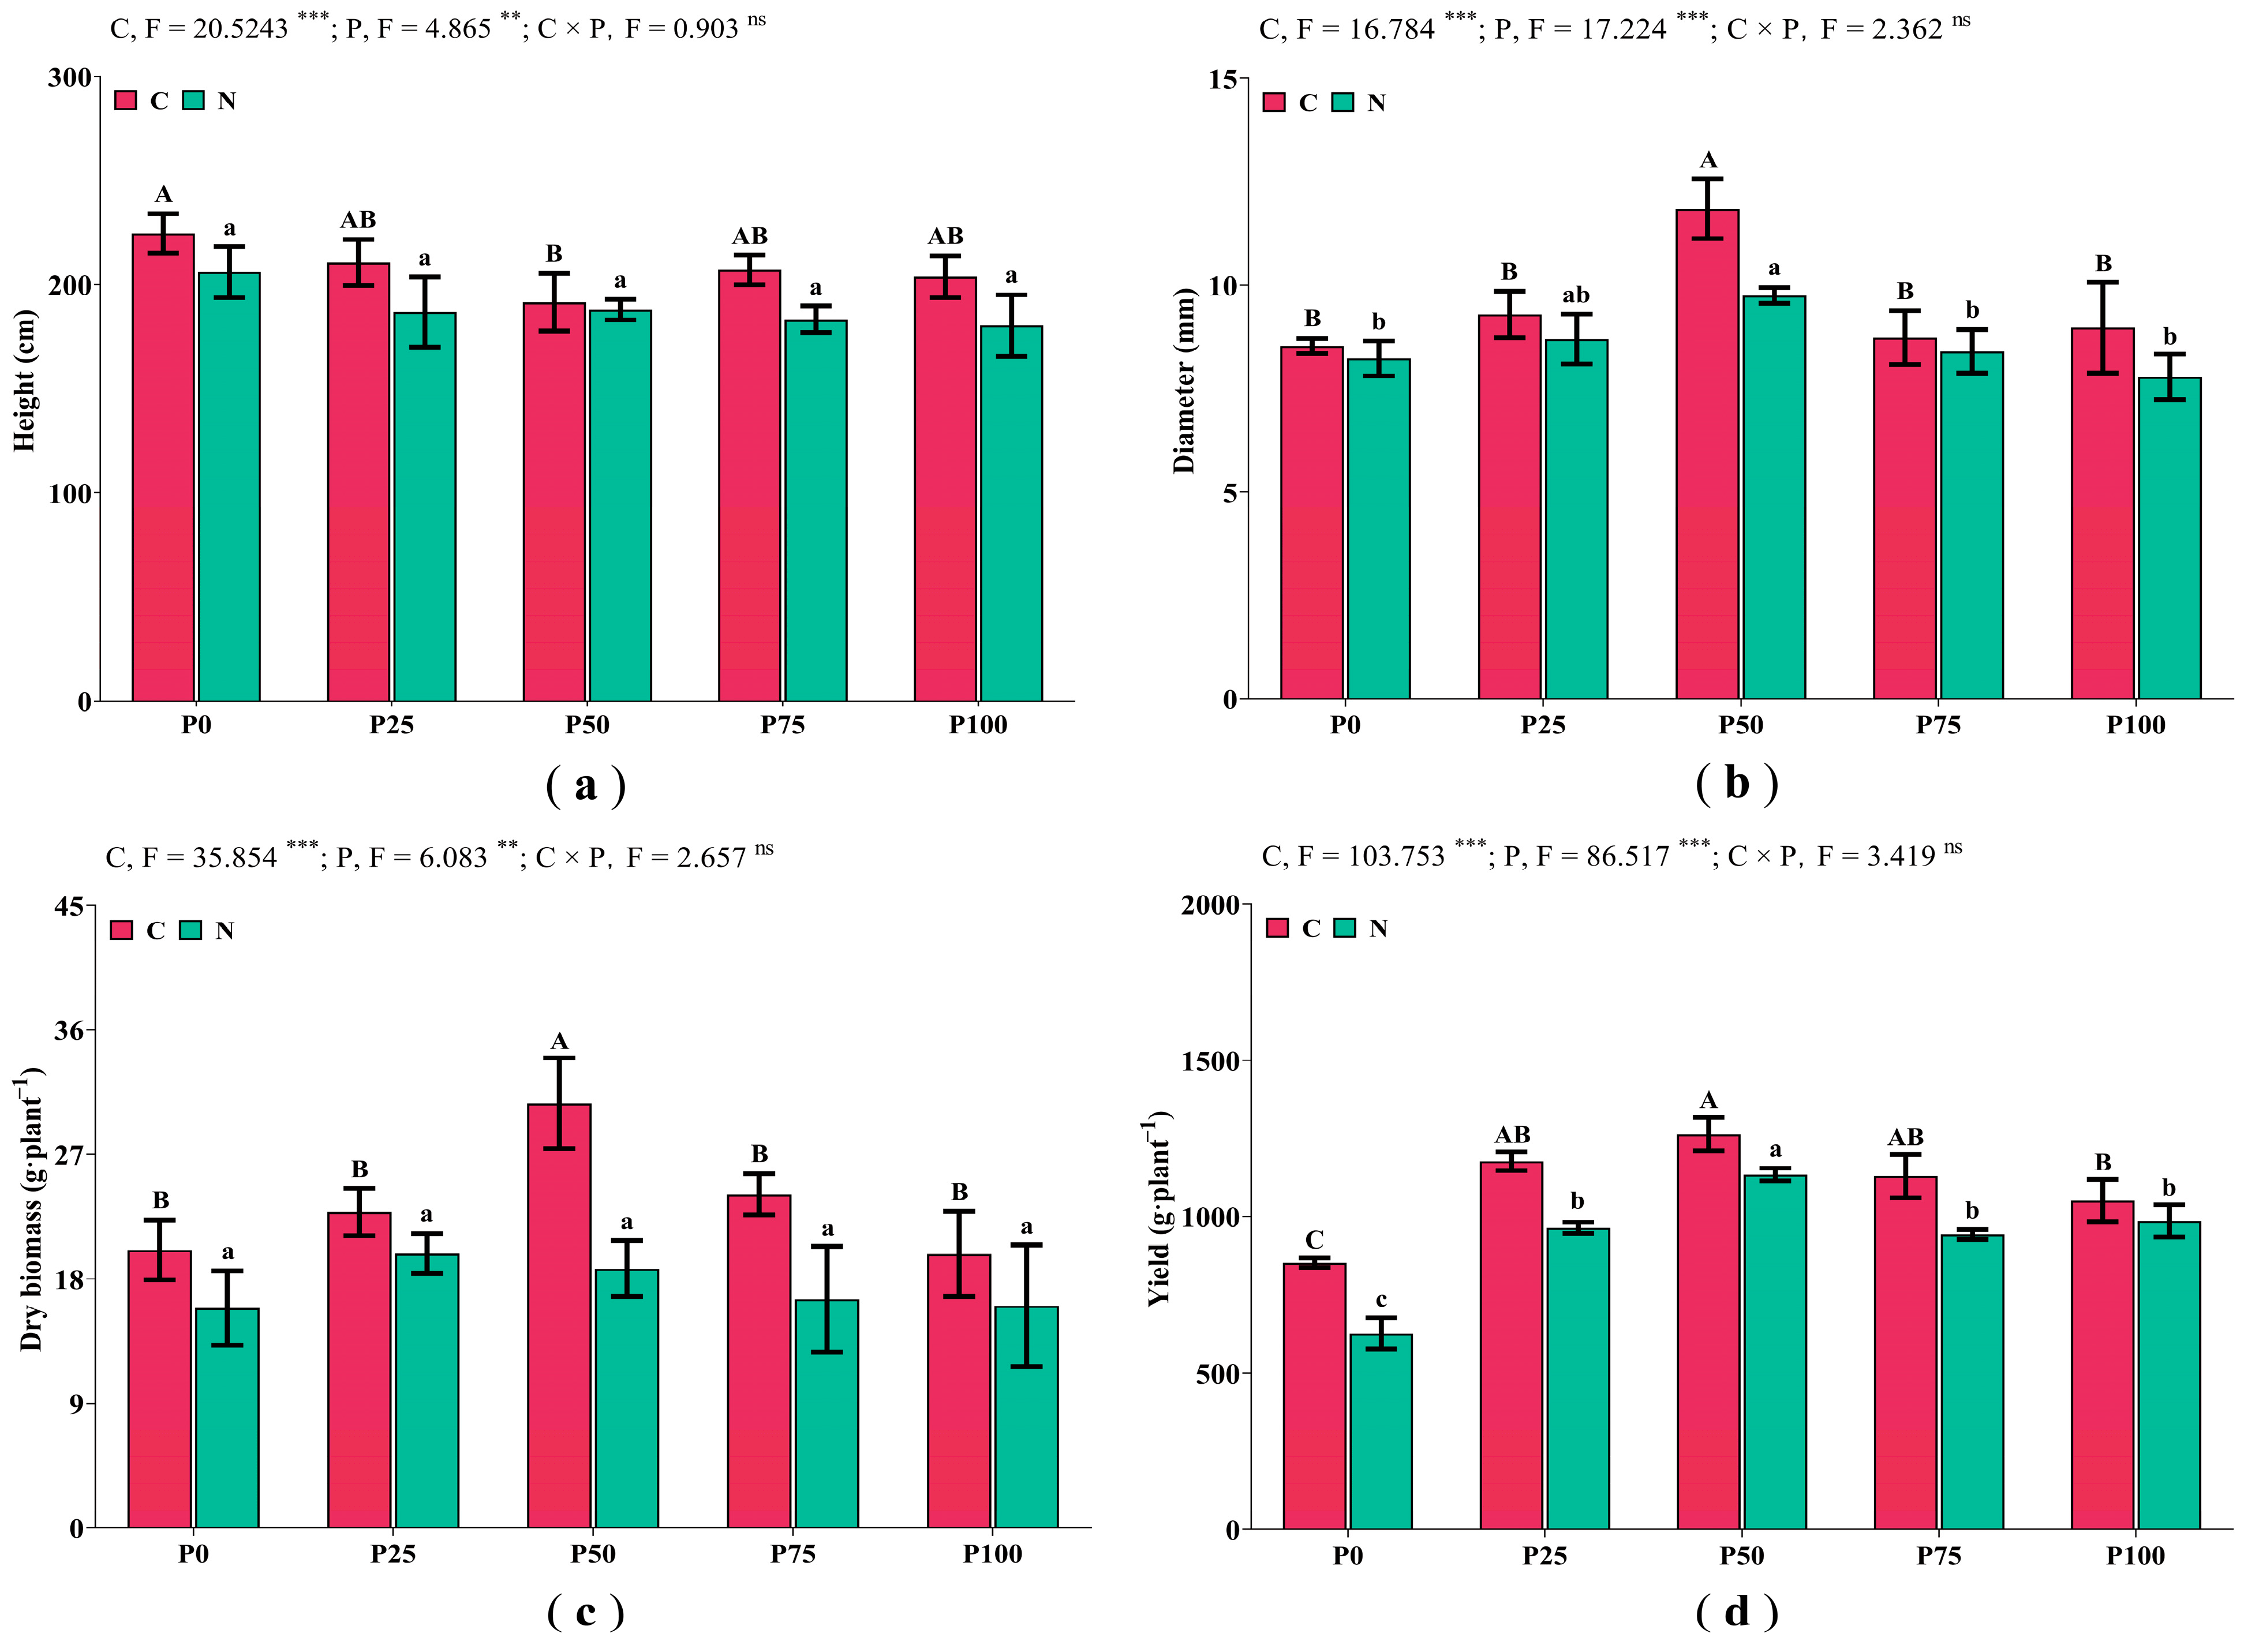
3.1. Cucumber Morphological Features and Yield

The P application and wheat cover crop both had significant effects on cucumber morphological features and yield (p < 0.05). However, the interaction between wheat cover crop and phosphorus application did not have a significant impact on cucumber growth and yield (p > 0.05). Across all phosphorus application levels, the wheat cover crop exhibited positive effects of enhancing cucumber growth and yield (Figure S1), with a particularly notable increase of stem diameter (21.54%), total dry biomass (63.49%), and yield (11.49%) for the P50 treatment (Figure 1b–d), and plant height (7.53%), total dry biomass (45.56%), and yield (19.82%) for the P75 treatment (Figure 1a,c,d) (p < 0.05). This showed that reducing 25% or 50% of phosphorus application was more beneficial for plant-promoting growth effects of the wheat cover crop. Additionally, among the wheat cover crop treatments, applying half of the conventional P amount (P50) recorded the highest values of stem thickness (11.85 mm) and dry biomass of the plants (30.67 g). Also, it reached the highest yield, an increase of 48.04% in comparison to the P0, to 1263.43 g·plant−1 (p < 0.05). Accordingly, the 50% of the habitual P amount exhibits the best growth-promoting effects of wheat cover crop on cucumber growth and helps maintain cucumber productivity.

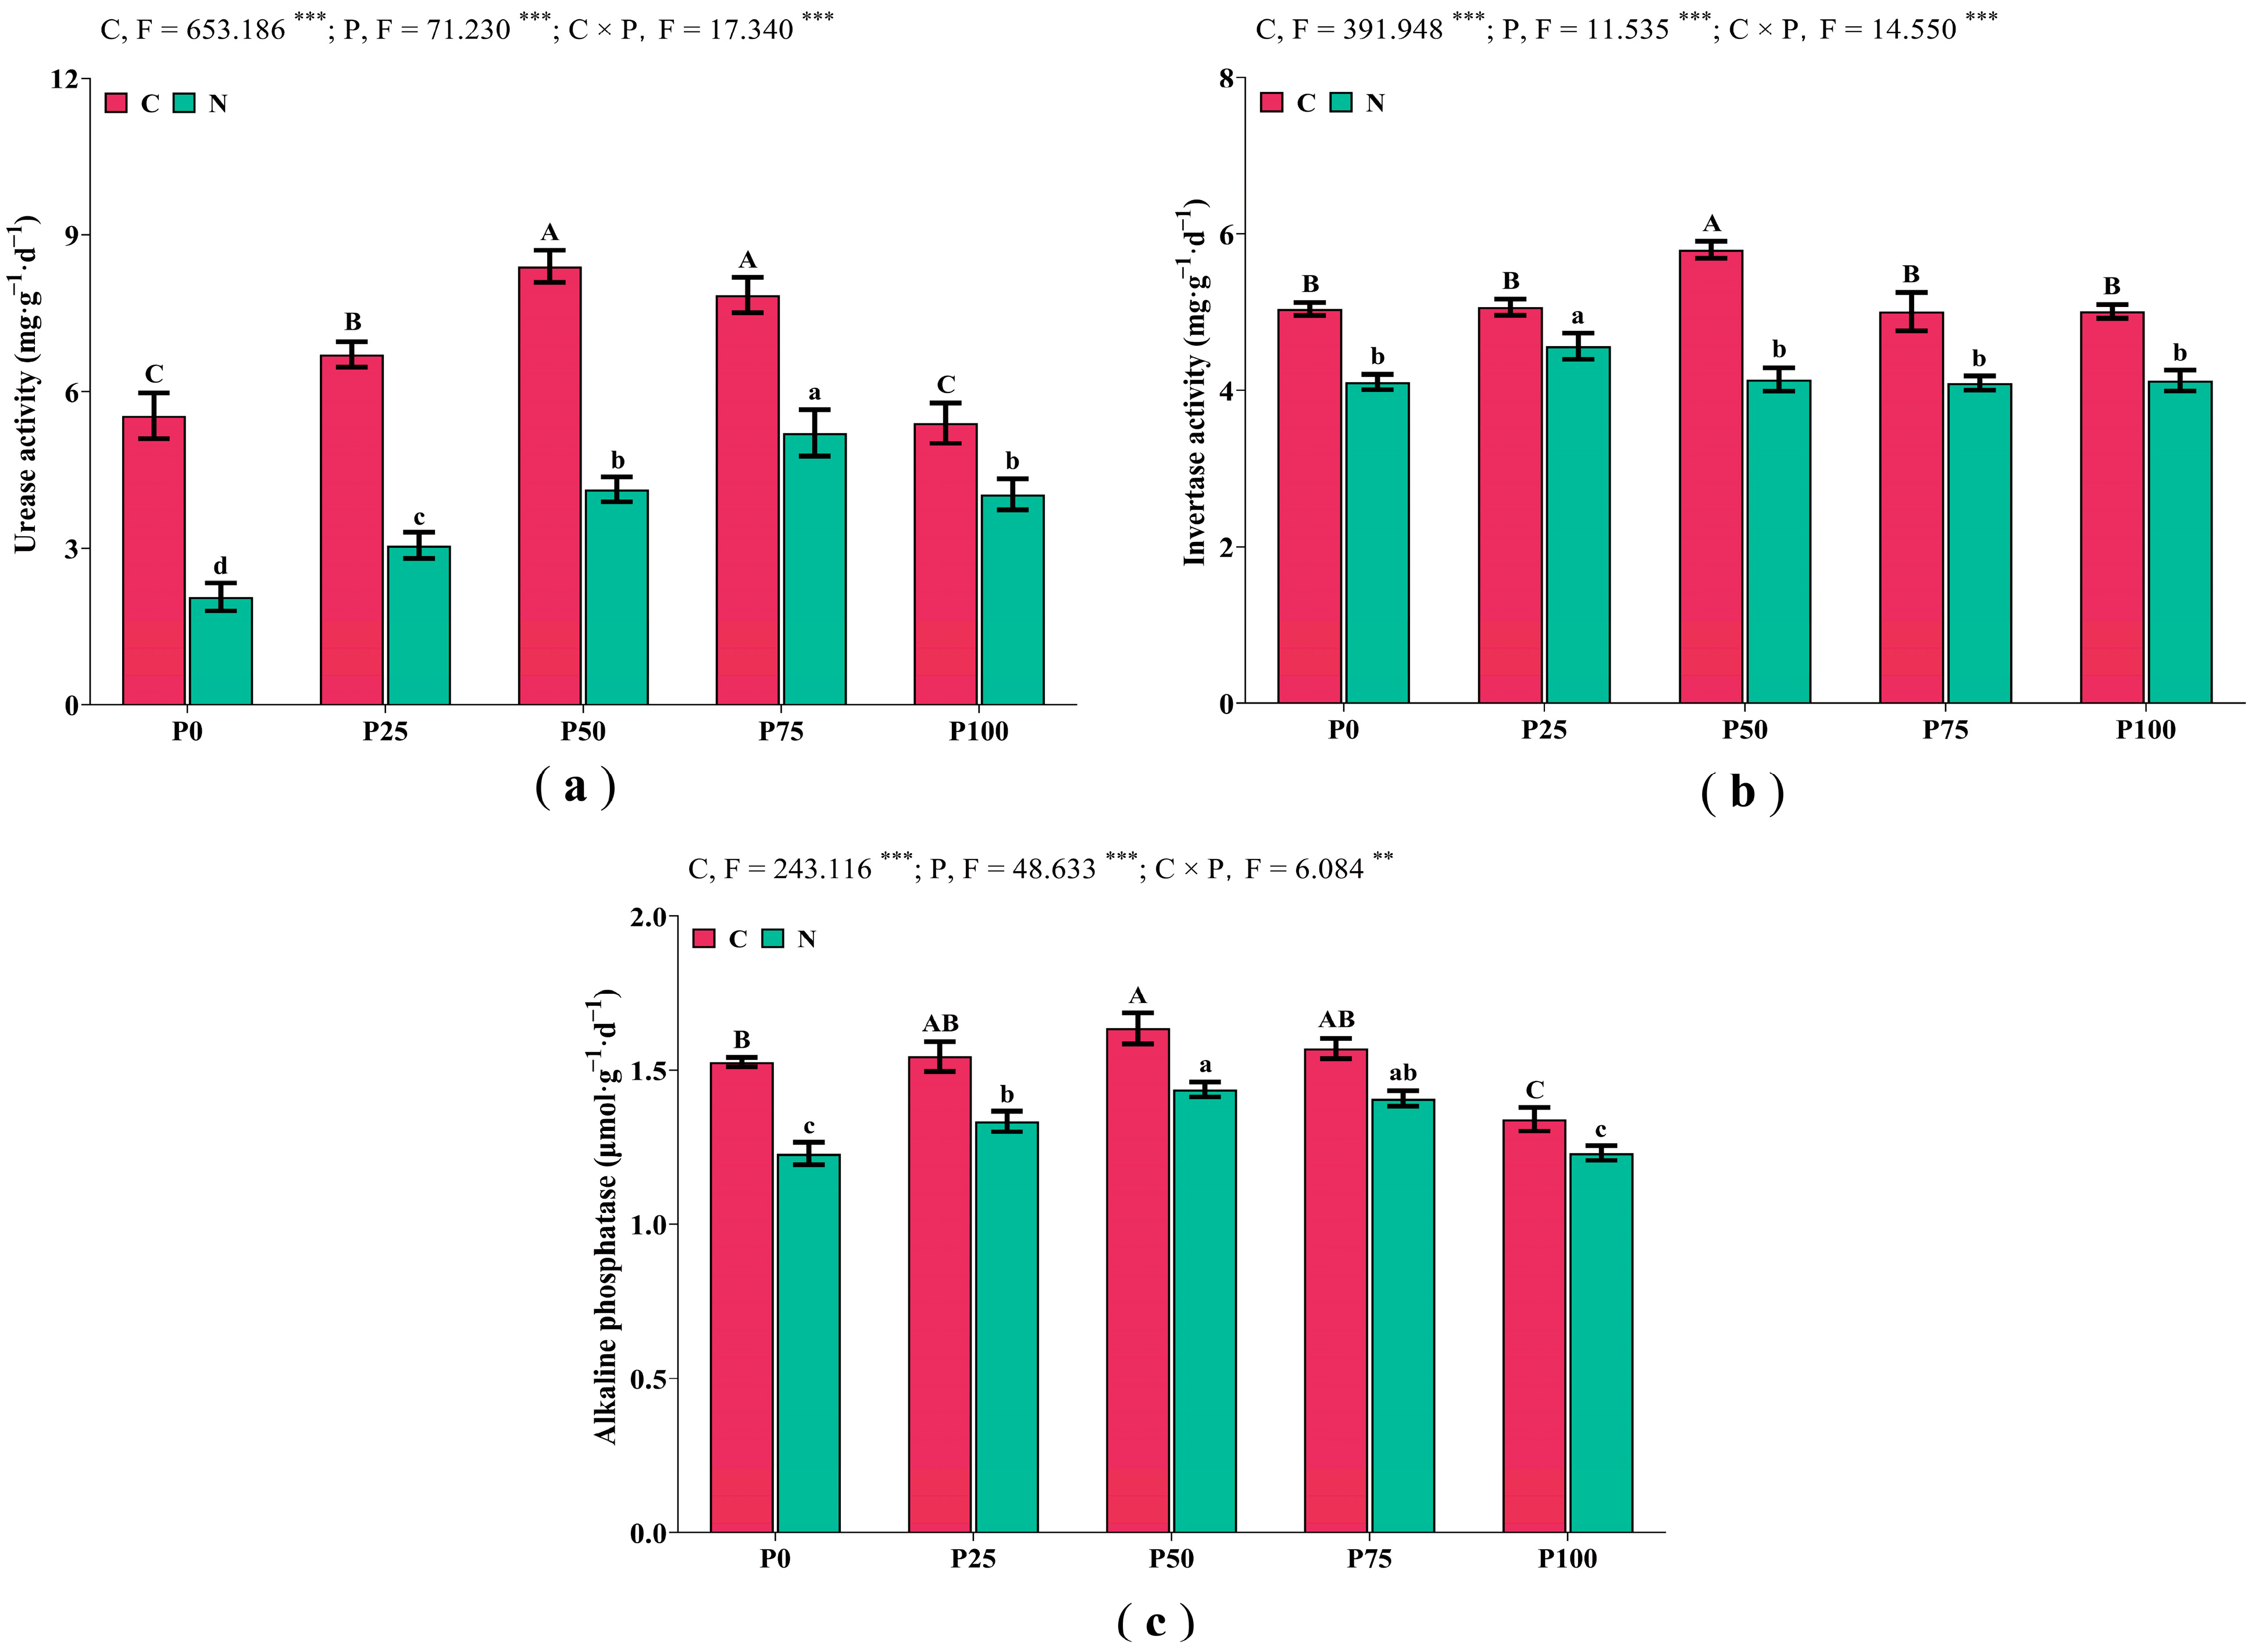
3.2. Soil Enzyme Activities

Both phosphorus application and wheat cover crop had substantial effects on soil enzyme activities (p < 0.05). The interaction between wheat cover crop and phosphorus application also has a significant impact on enzyme activities (p < 0.05) (Figure 2). With the P rates increasing, the activities of the soil enzymes exhibited a dynamic pattern of peak-like shape trend. Moreover, the soil enzyme activities were significantly higher after applying wheat cover crop regardless of the amounts of phosphorus application (p < 0.05) (Figure S2). More importantly, within wheat cover crop systems, reducing 50% of the conventional P application rate demonstrated the highest enzyme activity levels, which were significantly increased at p < 0.05 level compared to the P0. Specifically, the P50 increased 51.62% for urease activity, 15.08% for sucrase activity and 7.19% for alkaline phosphatase activity. Conversely, the P100 led to a reduction in soil enzyme activities relative to the P0, with alkaline phosphatase activity exhibiting a statistically significant decrease of 12.42% compared to the P0 (p < 0.05) (Figure 2c). Consequentially, integrating 50% of the normal P application amount with wheat cover crop benefits the soil enzyme activity most in continuous cucumber cropping systems.

3.3. Effects on Soil Bacterial Community Composition

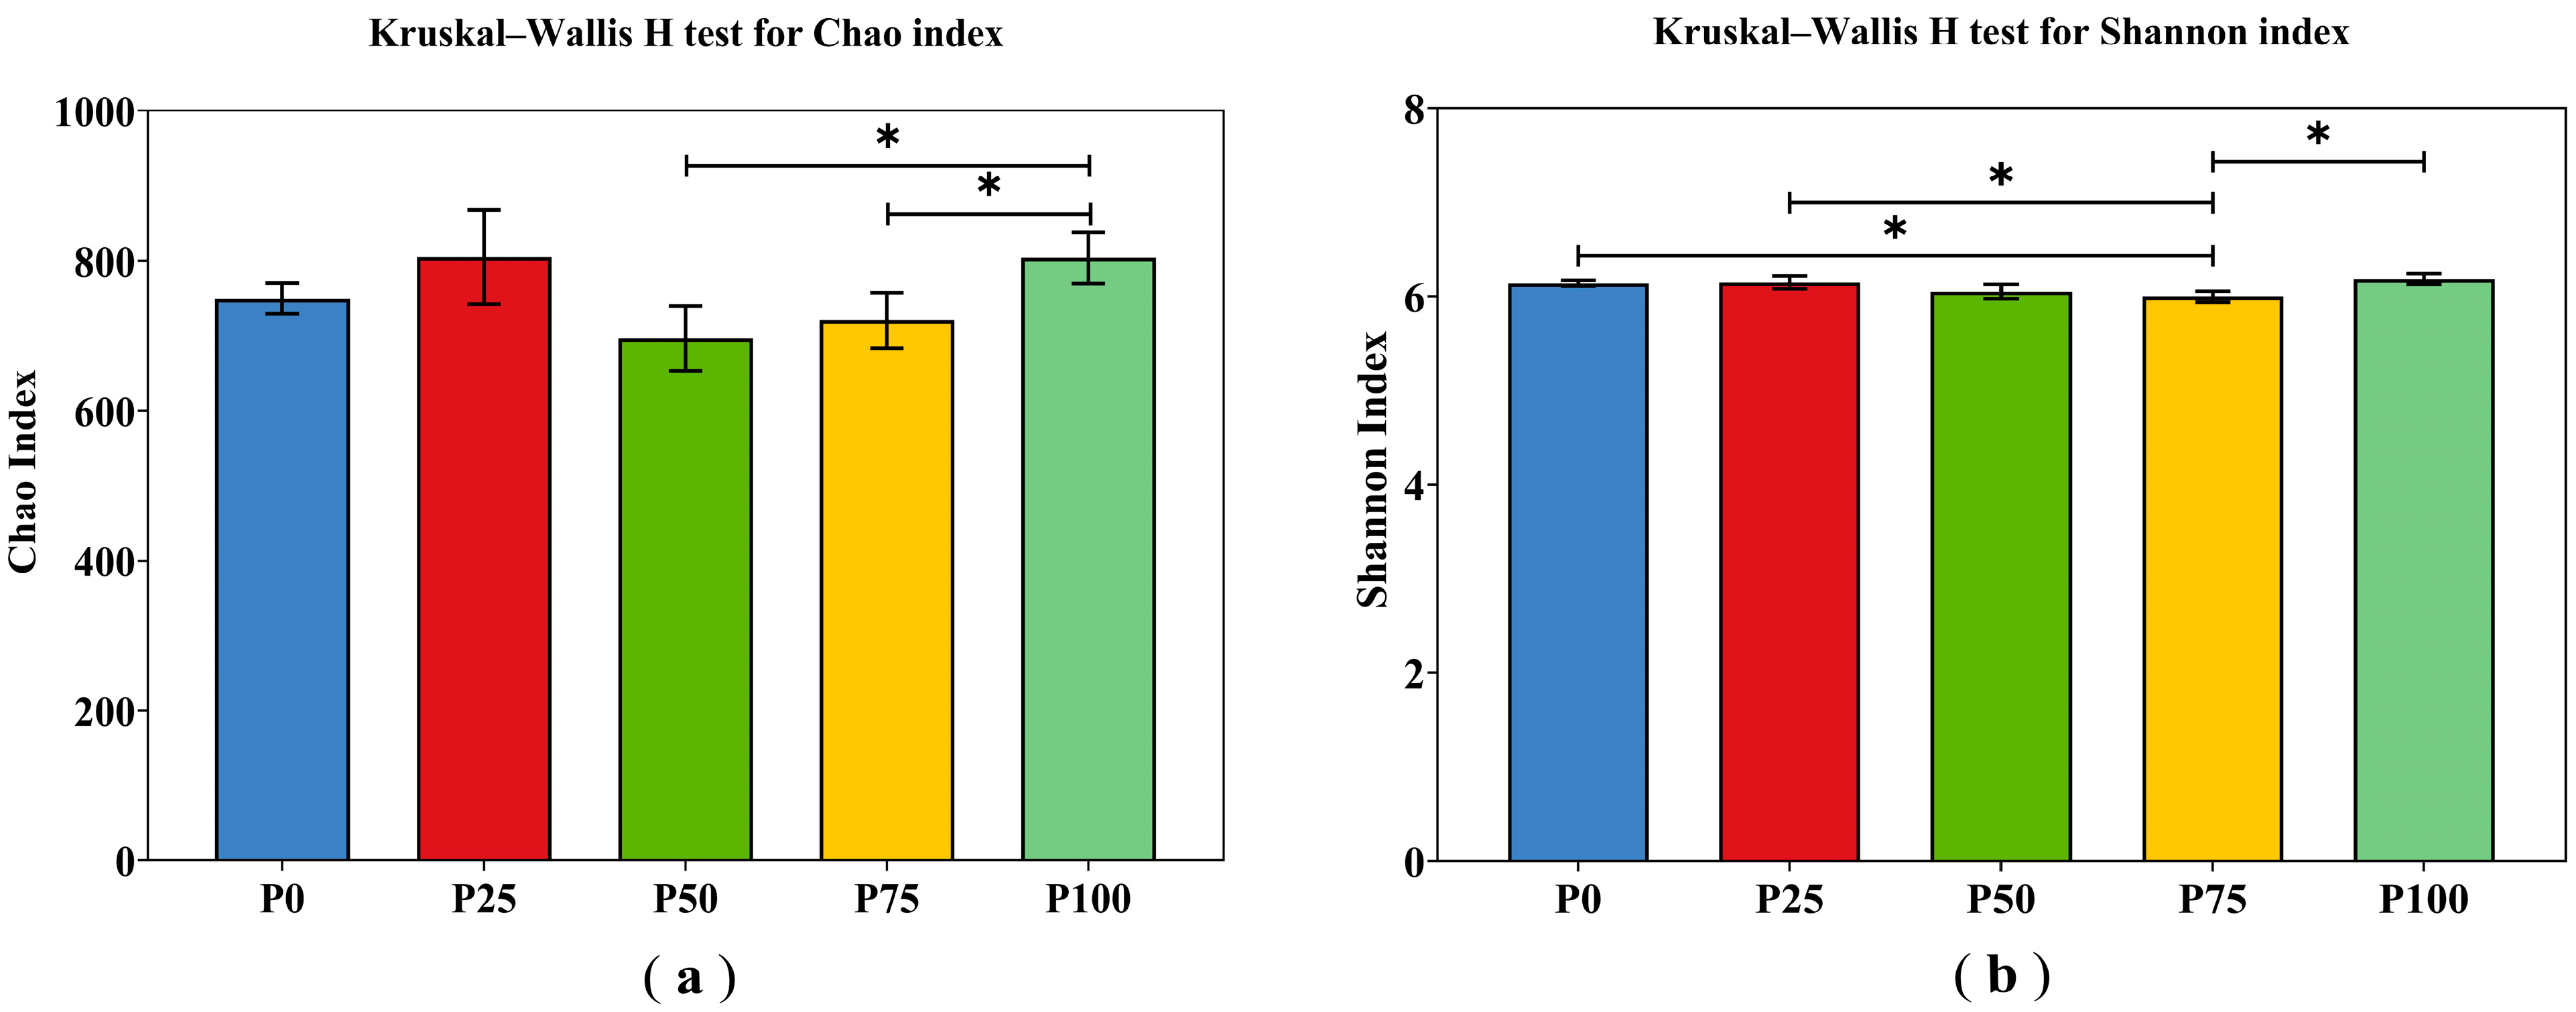
3.3.1. Alpha and Beta Diversity Analysis

The alpha diversity of soil bacterial communities among treatments was expressed by the Chao index and Shannon index, which represent species richness and diversity, respectively. As shown in Table 2, the wheat cover crop does not exhibit significant influences on the alpha diversity (p > 0.05). Whereas the P application notably influences the Chao and Shannon Index (p < 0.05). Furthermore, the interaction between wheat cover crop and phosphorus application level does not have significant impacts on the Chao and Shannon Index (p > 0.05). In the wheat cover crop system, the P100 significantly increased the Chao index compared to P50 and P75; it implied that the abundance of species of the P100 was much higher that than that of the P50 and P75. The Shannon index of P75 was significantly lower than that of the P0 and P100, which meant that the diversity of species in the P75 was significantly lower than that of the P0 and P100 (Figure 3). Additionally, the PCoA based on the Bray–Curtis and Adonis tests found that both wheat cover crop (PERMANOVA, R2 = 0.1029, p = 0.001) and phosphorous application (PERMANOVA, R2 = 0.3506, p = 0.001) significantly altered the composition of the soil micro-bacterial community (Figure S3). Therefore, it becomes meaningful to explore the specific changes occurring in the soil micro-bacterial composition caused by wheat cover crop and phosphorus application.

3.3.2. Soil Micro-Bacterial Community Composition and Correlation Analysis

Among the bacterial families, a total of 33 bacterial families exhibited relative abundances exceeding 1%, collectively accounting for over 75% of the total bacterial composition. These families were considered the dominant families across all treatments. Notably, some members showed a higher relative abundance: Sphingomonadaceae accounted for 8.77% to 11.20% of the total community, Rhodanobacteraceae accounted for 3.39% to 7.90% of the total, Gemmatimonadaceae accounted for 4.30% to 5.73% of the total, while Rhizobiaceae ranged from 3.82% to 5.78% of the total, and Chitinophagaceae contributed between 2.35% and 6.11% of the total (Figure S4).
For a better understanding of the relation between the cucumber morphological features, soil enzyme activities, and dominant bacterial families, we further conducted a correlation analysis of these indicators. The results showed that there were 3 taxa strongly correlated with plant height, 12 taxa correlated with plant dry biomass, 14 taxa correlated with cucumber yield, 17 taxa correlated with urease activity, 4 taxa correlated with invertase activities, and 14 taxa correlated with alkaline phosphatase activity (p < 0.05). To be more specific, the Methylophilaceae and Comamonadaceae were both negatively correlated with plant biomass, yield, and soil enzyme activities, while the LWQ8, norank_o__Gaiellielales, Rhodanobacteraceae, and Chitinophagaceae were all positively correlated with plant biomass, yield, urease, and alkaline phosphatase activities. More details are shown in Figure 4.

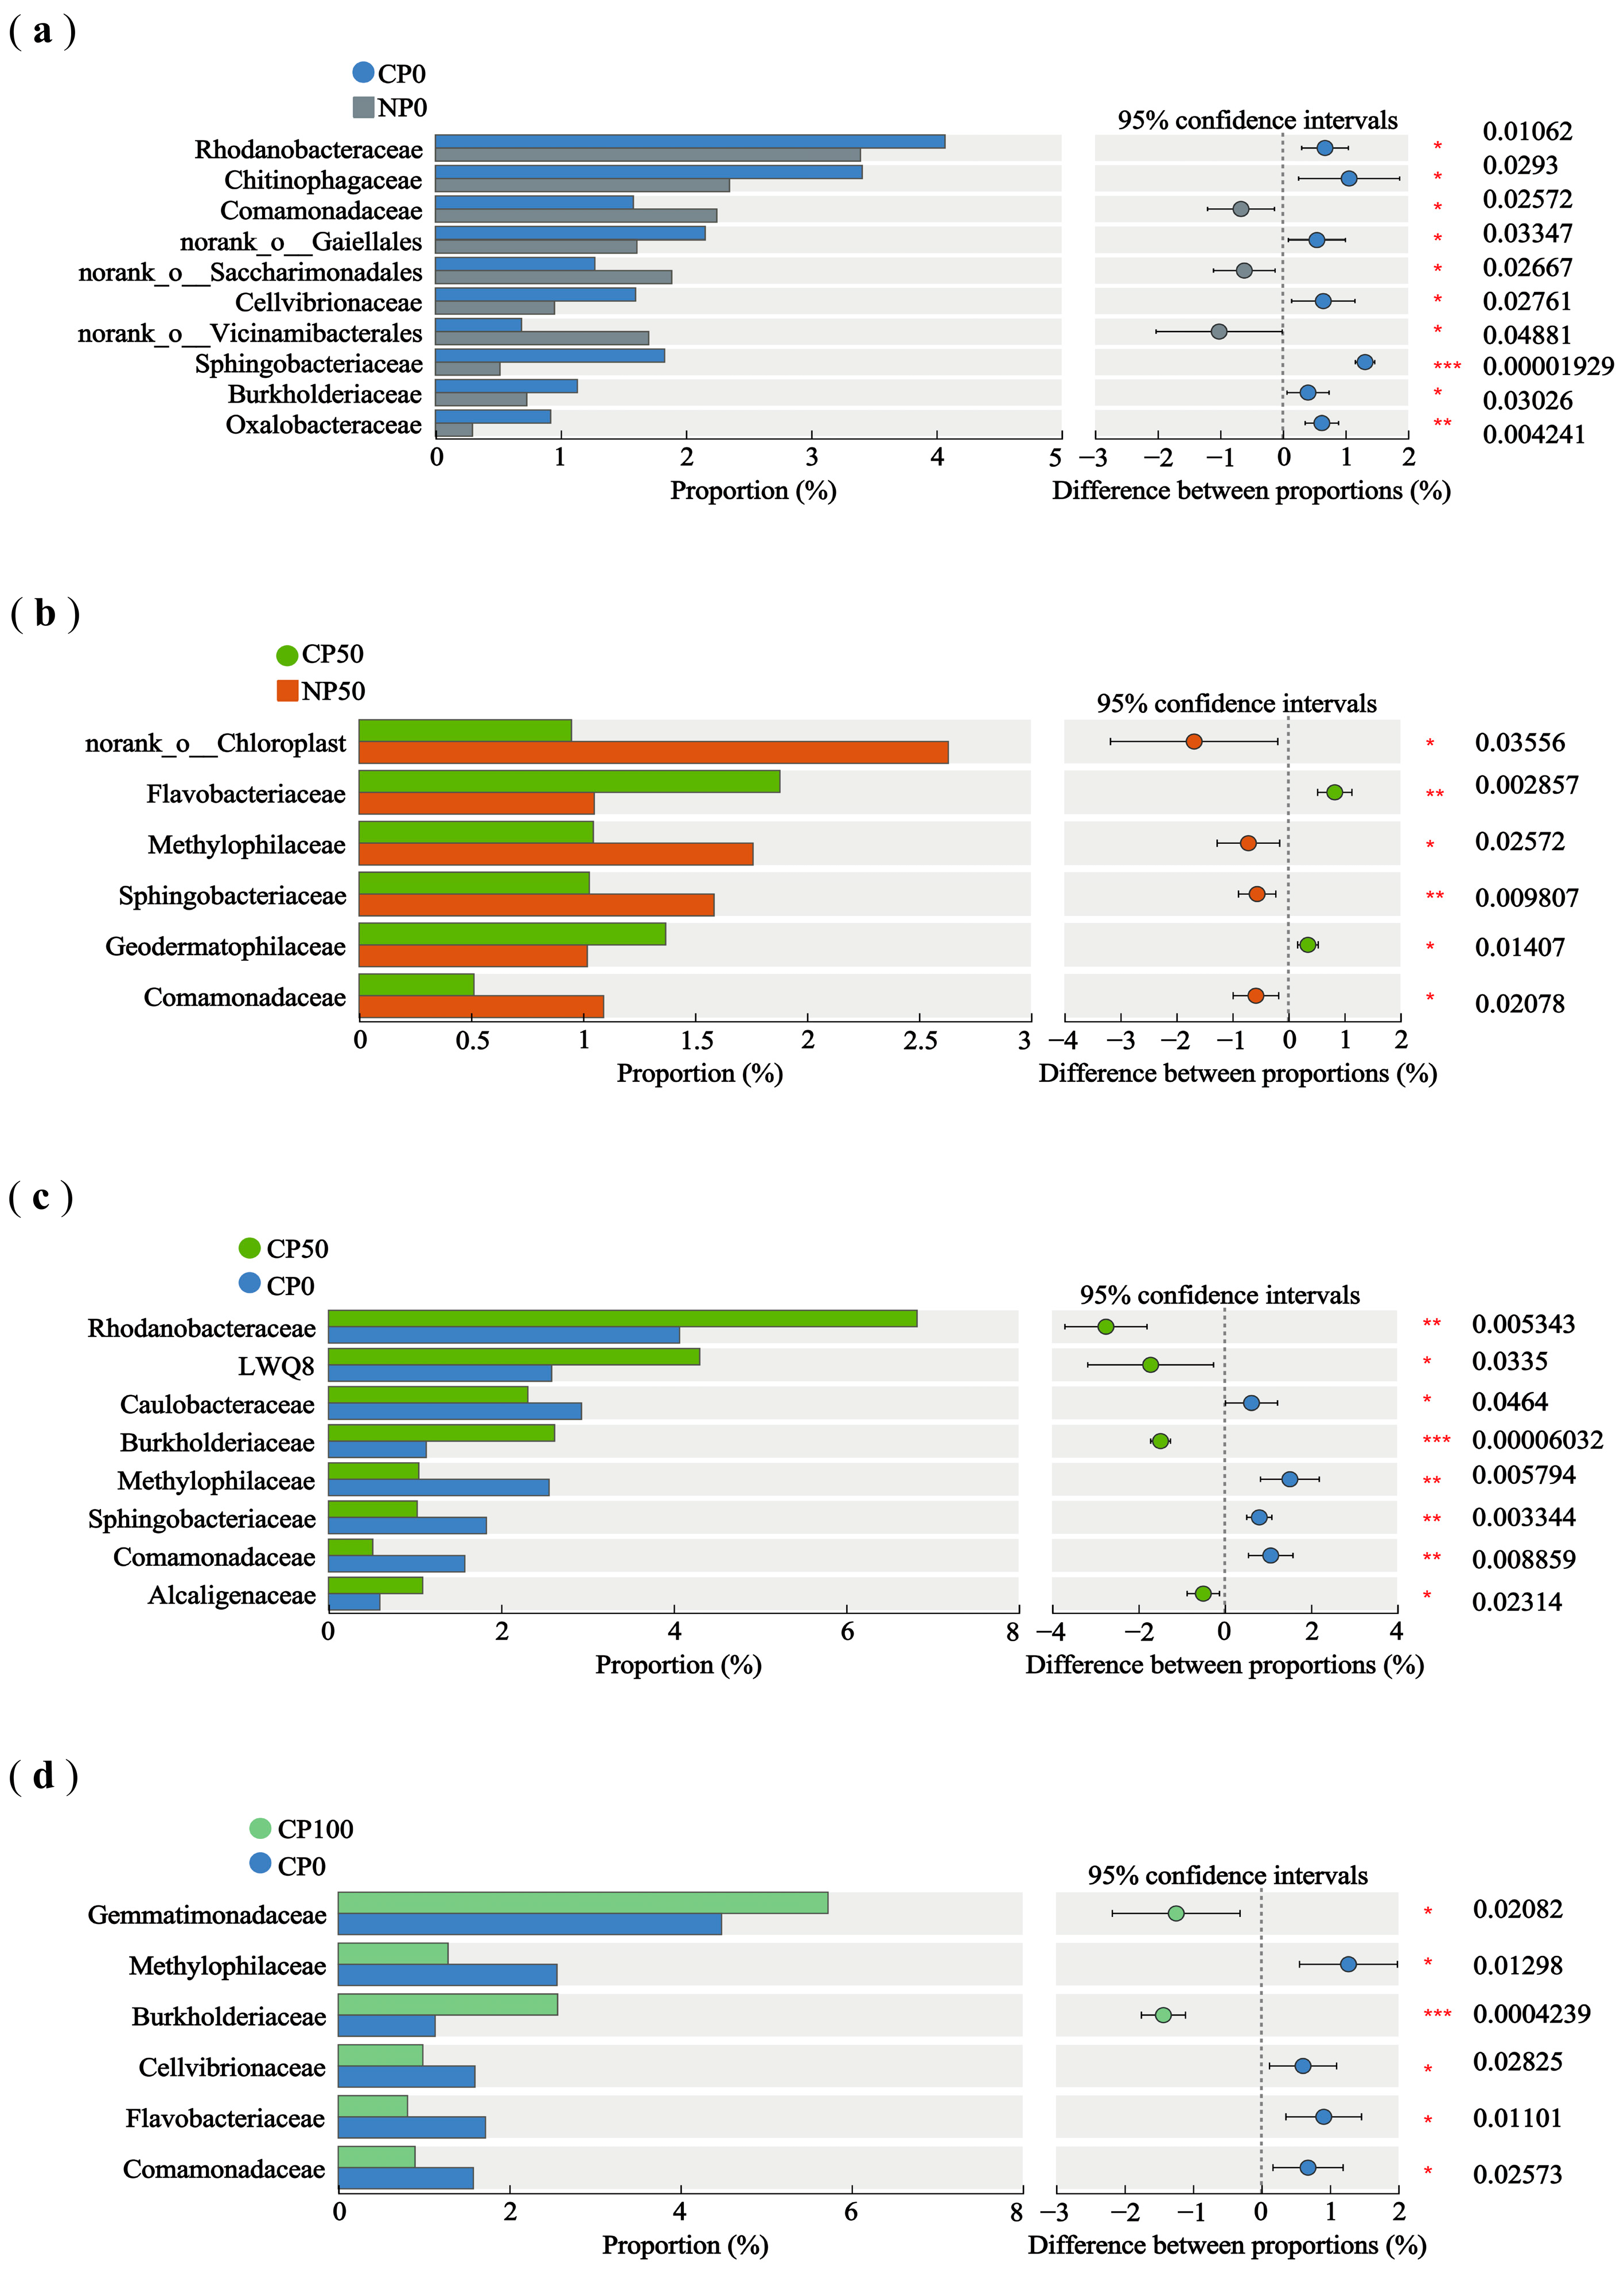
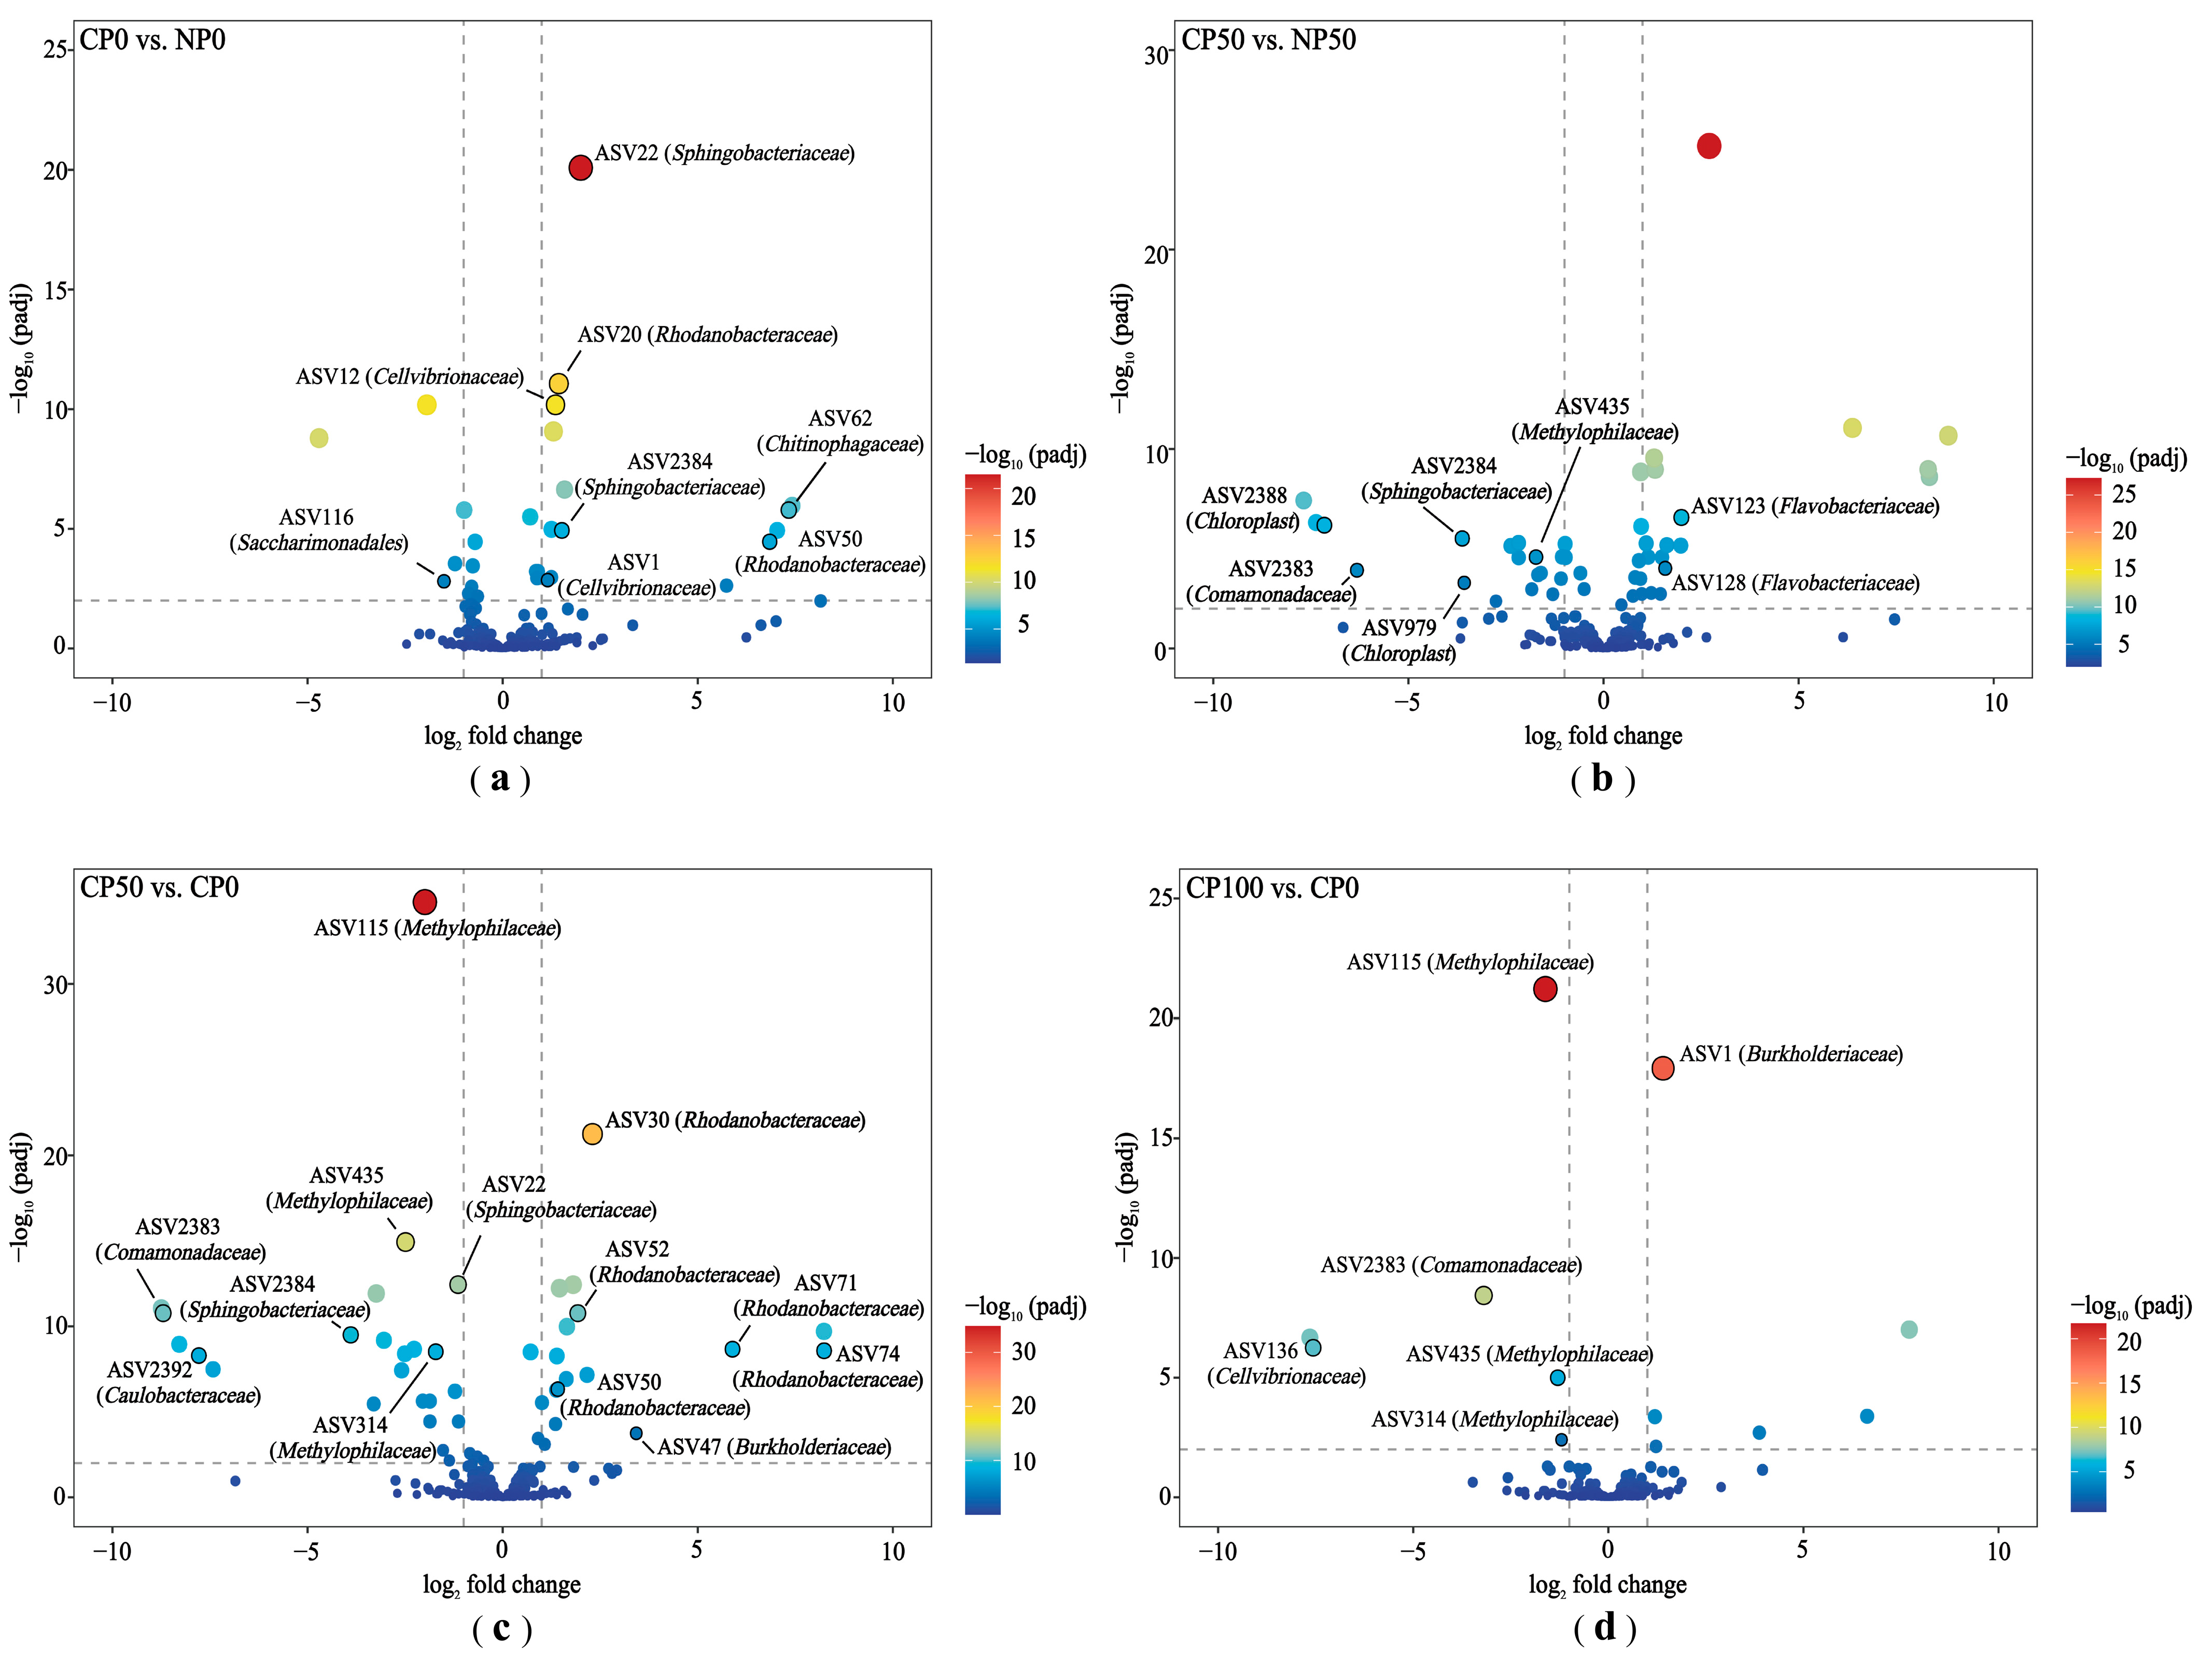
3.3.3. Differential Species of Soil Bacterial Community

In order to identify specific bacterial species affected by the wheat cover crop and the phosphorous application, we mainly focused on three representative phosphorus levels: P0, P50, and P100, based on the experimental data above. It was illustrated that both CP0 and CP50 markedly reduced the relative abundance of Comamonadaceae by 29.78% and 53.21%, compared to NP0 and NP50, respectively (Welch’s t test, p < 0.05) (Figure 5a,b). Notably, ASV2383 in Comamonadaceae was down-regulated in the CP50 (Figure 6b). Additionally, the CP0 further increased the relative abundance of Rhodobacteraceae, Chitinophagaceae, Sphingobacteraceae, Burkholderiaceae, etc., (Figure 5a). Specifically, ASV20 and ASV50 in Rhodobacteraceae, ASV62 in Chitinophagaceae, and ASV1 and ASV12 in Cellvibriaceae were significantly up-regulated (p value-adjusted < 0.01, log2 fold change value > 1) (Figure 6a), while the CP50 further boosted Flavobacteriaceae and Geodermophiliaceae, up-regulating ASV123 and ASV128 in Flavobacteriaceae (Figure 5b and Figure 6b). Conversely, after applying a relatively higher amount of P fertilizer (P100), wheat cover crop did not influence any dominant species at the family level (p > 0.05) or the ASVs (p value-adjusted > 0.01). This result indicates that a reasonable reduction in phosphorus fertilizer is beneficial for cover crops to enhance soil microbial community structure, whereas the positive influence is diminished when high amounts of phosphorus fertilizer are applied. Within the wheat cover crop treatments (Figure 5c,d), both the CP50 and CP100 substantially increased the relative abundance of Burkholderiaceae by 131.86% and 126.55%, respectively, compared to the CP0. At the same time, they reduced the abundance of Methylophilaceae by 58.95% (CP50) and 50.00% (CP100), and Comamonadaceae by 67.72% (CP50) and 43.04% (CP100). Furthermore, the CP50 also increased the relative abundance of Rhodobacteraceae, LWQ8 and Alcaligenaceae (Figure 5c), up-regulating ASV30, ASV50, ASV52, ASV71, and ASV74 in Rhodobacteraceae. In contrast, the CP100 treatment merely increased the relative abundance of Gemmatimonadaceae (Figure 5d). Overall, in the wheat cover crop system, reducing 50% of the conventional P rate combined with the wheat crop gains a better functional bacterial community than was found with a higher P input treatment.

4. Discussion

Cover crops cultivation can help promote the growth of subsequent cash plants and increase yields [9,13]. Consistent with previous studies, across all levels of phosphorus applications in this study, the promotion effect of wheat cover crop on plant height, diameter, dry biomass, and cucumber yield was remarkable, such as in the P50 and P75 level. Cover crops can serve as green manure or straw residues, which, on decomposition, release nutrients such as nitrogen and phosphorus and consequently allow for improved growth of plants and reduced use of P fertilizers [31,32]. Wang et al. [33] reported that straw return practices increased crop yields and phosphorus uptake, enabling a 14–32% reduction in P fertilizer use in a rice–rapeseed cropping system. In our study, reducing 50% of the conventional P application rate reached the peak values of stem thickness (11.85 mm), biomass (30.67 g), as well as cucumber yield (1263.43 g·plant−1) after applying wheat cover crop. Overall, reducing conventional phosphorus application by 25% or 50% can maximize the positive effects of wheat cover crop on cucumber growth. Wheat cover crop combined with a 50% reduction of habitual phosphorus application rate is thought to be the best mixed method to maintain cucumber productivity in this study.
Soil enzymes play a vital role in nutrient cycling. Research has emphasized the significant influence of cover crops on regulating soil enzyme activity [34]. A long-term study (20 years) demonstrated that fields treated with winter rye exhibited substantially higher enzyme activities, with urease activity five times and alkaline phosphatase activity four times greater than fields without cover crops [8]. Also, when combined with fertilizers, cover crops further enhanced soil enzyme activity [35,36]. Consistent with these findings, wheat cover crop significantly improved soil enzyme activity across various phosphorus application rates in this study. Furthermore, reducing a half of the habitual P application (P2) combined with wheat cover crop reached the highest activities of all three enzymes. Overall, it is meaningful to explore integrating cover crops and optimized fertilization regimes with the aim of achieving a balance between the benefits of cover crops and chemical fertilizers.
In our study, the wheat cover crop did not significantly influence the alpha diversity (Chao and Shannon index) after applying chemical fertilizers, which is consistent with previous studies [37,38], whereas the influence of P fertilizer addition on alpha diversity indices was more significant [39,40]. One study conducted by Fernandez et al. [41] reported that the improvement of soil alpha diversity can be obtained by cover crops after multiple cropping seasons. Therefore, a long-term experiment needs to be conducted to track the impact of wheat cover crop on alpha-diversity under varying P application levels. Following the application of wheat as a cover crop, the Chao and Shannon index significantly decreased in the P50 and P75 compared to the P100. This observation is consistent with the finding by Wang et al. [42], who reported that a reduction in fertilizer inputs led to a reduction of species abundance and diversity, and this decrease was probably caused by the enhanced competition for nutrient uptake between bacteria and crops. Additionally, P75 significantly decreased the Shannon index compared to not applying phosphorus fertilizers, and this alteration was presumably caused by the acidification of the soil (such as the application of superphosphate) which is closely related to the reduction of soil bacterial community diversity [43].
The positive changes in micro-bacterial community composition are functionally crucial for maintaining good soil health. Our study found that reducing amounts of P application could improve the functional effect of wheat cover crop on increasing the proliferation of beneficial bacterial groups (Figure 4 and Figure 5a,b), such as Sphingobacteriaceae [44,45], Burkholderiaceae [46,47], as well as Chitinophahaceae [48], and it also reduced some bacterial taxa, which were negatively correlated with cucumber yield and soil enzyme activities, such as Methylophilaceae and Comamonadaceae (Figure 4). However, at a higher phosphorus application rate (P100), the mineral fertilizer diminished the positive impacts of cover crops on bacterial compositions, hardly altering the bacterial structure. This aligns with the findings from Jiao et al. [49], who reported that long-term chemical fertilizer application with straw incorporation failed to alter soil bacterial communities despite enriching soil fertility. Therefore, reducing phosphorus application to an appropriate level is vital for the functional performance of cover crops on regulating micro-bacterial structure. Notably, applying 50% conventional phosphorus fertilizer after wheat cover cropping significantly increased the abundance of Burkholderiaceae, Rhodobacteraceae, LWQ8, and Alcaligenaceae compared to the P-free treatment, and which were positively correlated with cucumber yield and soil enzyme activities. Numerous research studies also have confirmed the positive role of these bacterial taxonomic groups in soil nutrient cycling and plant growth; for example the members of Rhodobacteraceae play a vital role in organic matter degradation near the rhizosphere and in nutrient absorption in plants [50,51]. Similarly, Alcaligenaceae are well recognized for their abilities to solubilize phosphorus, adsorb heavy metals like arsenic, and promote nutrition (N, P, K) uptake in maize, thus contributing to better growth and yield [52,53]. Overall, these results showed that the efficiency of wheat cover cropping on improving soil bacterial community structure was influenced by fertilizer input. More importantly, in the wheat cover crop system, a half of the conventional phosphorous application exhibited a superior enhancement on soil nutrition cycling by optimizing the micro-bacterial community.

5. Conclusions

This study evaluated the feasibility and effectiveness of reducing phosphorous fertilizer application in the wheat cover crop system. Results demonstrated that across all levels of P application, the promoting effect of wheat cover crop was still pronounced including improved plant height, stem diameter, total dry biomass, cucumber yields, and enzyme activity. However, the wheat cover crop did not alter the bacterial diversity (Chao and Shannon Index) in the presence of chemical fertilizers, but it significantly changed the composition of the bacteria. More importantly, in wheat cover crop systems, halving phosphorous fertilizer obtained peak values of stem thickness, biomass, cucumber yield, as well as soil enzyme activities, and it further promoted beneficial bacterial families. These were strongly positively correlated with cucumber yield, soil urease, and alkaline phosphatase activity, such as Burkholderiaceae (up-regulating ASV47), Rhodobacteraceae (up-regulating ASV30, ASV50, ASV52, ASV71, and ASV74), LWQ8, and Alcaligenaceae, compared to not applying P fertilizers. These changes contributed to a more functional soil microbiome, enhancing nutrient cycling and fostering plant growth. Overall, under the wheat cover crop system, reducing phosphorus fertilizer to 8.71 g·pot−1 was optimal for achieving soil functions and crop productivity in this study, highlighting the importance of optimizing P fertilizer in cover crop systems.

Supplementary Materials

The following supporting information can be downloaded at: https://www.mdpi.com/article/10.3390/agronomy15030624/s1, Figure S1: the differences in cucumber morphological characteristics and yield caused by planting patterns at five different phosphorus levels; Figure S2: the differences in soil enzyme activity caused by planting patterns at five different phosphorus levels; Figure S3: the principal coordinate analysis (PCoA) of soil bacterial community composition under different phosphorus application levels and planting patterns based on Bray-Curtis and Adonis test; Figure S4: the composition of soil bacterial community species at family level (the relative abundance > 1%).

Author Contributions

Investigation, K.C., M.I., L.Z. and Y.Z.; data curation, K.C.; data analysis, K.C.; writing—original draft preparation, K.C.; writing—review and editing, K.C., A.U., M.I. and L.Z.; visualization, K.C.; supervision, S.L.; project administration, D.G. and X.Z.; funding acquisition, S.L. and F.W. All authors have read and agreed to the published version of the manuscript.

Funding

This study was supported by the Heilongjiang Courtyard Economy Modern Agricultural Technology Cooperative Innovation and Extension System (China) and the China Agriculture Research System (CARS-23-B09).

Data Availability Statement

Data will be made available on request.

Acknowledgments

We appreciate that Eman Saad reviewed the manuscript for valuable suggestions for its improvement. The details are as follows: Eman Saad (saade2872@gmail.com), Department of Biology and Geology, Alexandria University, Alexandria, Egypt.

Conflicts of Interest

The authors declare no conflicts of interest.

References

  1. Gao, X.; Li, S.; He, Y.; Yang, Y.; Tian, Y. Spectrum imaging for phenotypic detection of greenhoue vegetables: A review. Comput. Electron. Agric. 2024, 225, 109346. [Google Scholar] [CrossRef]
  2. Zhou, X.; Wu, F. Soil phenolics in a continuously mono-cropped cucumber (Cucumis sativus L.) system and their effects on cucumber seedling growth and soil microbial communities. Eur. J. Soil Sci. 2012, 63, 332–340. [Google Scholar] [CrossRef]
  3. Ju, X.; Kou, C.L.; Christie, P.; Dou, Z.; Zhang, F. Changes in the soil environment from excessive application of fertilizers and manures to two contrasting intensive cropping systems on the North China Plain. Environ. Pollut. 2007, 145, 497–506. [Google Scholar] [CrossRef] [PubMed]
  4. Pahalvi, H.N.; Rafiya, L.; Rashid, S.; Nisar, B.; Kamili, A.N. Chemical fertilizers and their impact on soil health. In Microbiota and Biofertilizers; Springer: Cham, Switzerland, 2021; Volume 2, pp. 1–20. [Google Scholar] [CrossRef]
  5. Lacey, C.; Nevins, C.; Camberato, J.; Kladivko, E.; Sadeghpour, A.; Armstrong, S. Carbon and nitrogen release from cover crop residues and implications for cropping systems management. J. Soil Water Conserv. 2020, 75, 505–514. [Google Scholar] [CrossRef]
  6. Wittwer, R.A.; van der Heijden, M.G.A. Cover crops as a tool to reduce reliance on intensive tillage and nitrogen fertilization in conventional arable cropping systems. Field Crops Res. 2020, 249, 107736. [Google Scholar] [CrossRef]
  7. Romdhane, S.; Spor, A.; Busset, H.; Falchetto, L.; Martin, J.; Bizouard, F.; Bru, D.; Breuil, M.-C.; Philippot, L.; Cordeau, S. Cover crop management practices rather than composition of cover crop mixtures affect bacterial communities in No-Till agroecosystems. Front. Microbiol. 2019, 10, 1618. [Google Scholar] [CrossRef]
  8. Feng, H.; Sekaran, U.; Wang, T.; Kumar, S. On-farm assessment of cover cropping effects on soil C and N pools, enzyme activities, and microbial community structure. J. Agric. Sci. 2021, 159, 216–226. [Google Scholar] [CrossRef]
  9. Peng, Y.; Wang, L.; Jacinthe, P.A.; Ren, W. Global synthesis of cover crop impacts on main crop yield. Field Crops Res. 2024, 310, 109343. [Google Scholar] [CrossRef]
  10. O’reilly, K.A.; Lauzon, J.D.; Vyn, R.J.; Van Eerd, L.L. Nitrogen cycling, profit margins and sweet corn yield under fall cover crop systems. Can. J. Soil Sci. 2012, 92, 353–365. [Google Scholar] [CrossRef]
  11. Dube, E.; Chiduza, C.; Muchaonyerwa, P. High biomass yielding winter cover crops can improve phosphorus availability in soil. S. Afr. J. Sci. 2014, 110, 1–4. [Google Scholar] [CrossRef]
  12. Chahal, I.; Van Eerd, L.L. Cover crops increase tomato productivity and reduce nitrogen losses in a temperate humid climate. Nutr. Cycl. Agroecosyst. 2021, 119, 195–211. [Google Scholar] [CrossRef]
  13. Gao, D.; Zhou, X.; Duan, Y.; Fu, X.; Wu, F. Wheat cover crop promoted cucumber seedling growth through regulating soil nutrient resources or soil microbial communities? Plant Soil 2017, 418, 459–475. [Google Scholar] [CrossRef]
  14. Qi, G.; Chen, S.; Ke, L.; Ma, G.; Zhao, X. Cover crops restore declining soil properties and suppress bacterial wilt by regulating rhizosphere bacterial communities and improving soil nutrient contents. Microbiol. Res. 2020, 238, 126505. [Google Scholar] [CrossRef]
  15. Ortas, I.; Islam, K.R. Phosphorus Fertilization Impacts on Corn Yield and Soil Fertility. Commun. Soil Sci. Plant Anal. 2018, 49, 1684–1694. [Google Scholar] [CrossRef]
  16. Luo, L.; Zhang, X.; Zhang, M.; Wei, P.; Chai, R.; Wang, Y.; Zhang, C.; Siddique, K.H.M. Improving Wheat Yield and Phosphorus Use Efficiency through the Optimization of Phosphorus Fertilizer Types Based on Soil P Pool Characteristics in Calcareous and Non-Calcareous Soil. Agronomy 2023, 13, 928. [Google Scholar] [CrossRef]
  17. Kalkhajeh, Y.K.; Huang, B.A.; Sorensen, H.; Holm, P.E.; Hansen, H.C.B. Phosphorus accumulation and leaching risk of greenhouse vegetable soils in Southeast China. Pedosphere 2021, 31, 683–693. [Google Scholar] [CrossRef]
  18. Hynšt, J.; Urbánková, E.; Obdržálková, E.; Jančíková, S.; Smatanová, M. Effect of increasing rate of P fertilization on available P content in soil and plant uptake: Implications for P management. J. Plant Nutr. 2024, 47, 1834–1849. [Google Scholar] [CrossRef]
  19. Szigeti, N.; Hermann, T.; Juhos, K.; Tóth, G. Distribution pattern of major crops and their cultivation intensity indicated by soil phosphorus concentrations in Europe. J. Agron. 2023, 115, 1678–1693. [Google Scholar] [CrossRef]
  20. Huang, S.; Tang, J.W.; Li, C.; Zhang, H.; Yuan, S. Reducing potential of chemical fertilizers and scientific fertilization countermeasure in vegetable production in China. Plant Nutr. Fert. Sci. 2017, 23, 1480–1493. [Google Scholar] [CrossRef]
  21. Christensen, J.T.; Hansen, E.M.; Kandeler, E.; Hallama, M.; Christensen, B.T.; Rubæk, G.H. Effect of soil P status on barley growth, P uptake, and soil microbial properties after incorporation of cover crop shoot and root residues. J. Plant. Nutr. Soil Sci. 2021, 184, 657–667. [Google Scholar] [CrossRef]
  22. Maltais-Landry, G.; Frossard, E. Similar phosphorus transfer from cover crop residues and water-soluble mineral fertilizer to soils and a subsequent crop. Plant Soil 2015, 393, 193–205. [Google Scholar] [CrossRef]
  23. Lozier, T.M.; Macrae, M.L.; Brunke, R.; Van Eerd, L.L. Release of phosphorus from crop residue and cover crops over the non-growing season in a cool temperate region. Agric. Water Manag. 2017, 189, 39–51. [Google Scholar] [CrossRef]
  24. Li, Y.; Zhu, Q.; Zhang, Y.; Liu, S.; Wang, X.; Wang, E.C. Impact of Winter Cover Crops on Total and Microbial Carbon and Nitrogen in Black Soil. Agronomy 2024, 14, 603. [Google Scholar] [CrossRef]
  25. Chen, X.; Shi, C.; Han, X.; Wang, X.; Guo, Z.; Lu, X.; Zou, W.; Yan, J. Microbial Responses of Soil Fertility to Depth of Tillage and Incorporation of Straw in a Haplic Chernozem in Northeast. Chin. Geogr. Sci. 2023, 33, 693–707. [Google Scholar] [CrossRef]
  26. Wang, N.; Nan, H.; Feng, K. Effects of reduced chemical fertilizer with organic fertilizer application on soil microbial biomass, enzyme activity and cotton yield. Chin. J. Appl. Ecol. 2020, 311, 173–181. [Google Scholar]
  27. Ge, Y.; Wang, Q.; Liu, W.; Liu, X.; Huang, Y.; Christie, P. Response of Soil Enzymes and Microbial Communities to Root Extracts of the Alien Alternanthera philoxeroides. Arch. Agron. Soil Sci. 2017, 64, 708–717. [Google Scholar] [CrossRef]
  28. Li, C.; Dong, Y.; Yi, Y.; Tian, J.; Xuan, C.; Wang, Y.; Wen, Y.; Cao, J. Effects of phosphogypsum on enzyme activity and microbial community in acid soil. Sci. Rep. 2023, 13, 6189. [Google Scholar] [CrossRef]
  29. Zeng, Q.; An, S. Identifying the Biogeographic Patterns of Rare and Abundant Bacterial Communities Using Different Primer Sets on the Loess Plateau. Microorganisms 2021, 9, 139. [Google Scholar] [CrossRef]
  30. Han, G.; Yang, G.; Hao, D.; Lu, Y.; Thein, K.; Simpson, B.; Chen, J.; Sun, R.; Alhalabi, O. 9p21 loss confers a cold tumor immune microenvironment and primary resistance to immune checkpoint therapy. Nat. Commun. 2021, 12, 5606. [Google Scholar] [CrossRef]
  31. Wang, Y.; Wang, Z.; Yang, G.; Wang, L.; Zheng, Y. Effects of crop stubble on physicochemical properties of continuous cropping soil and cucumber yield and quality. Nat. Resour. 2012, 3, 88–94. [Google Scholar] [CrossRef]
  32. Wang, K.; Ren, T.; Yan, J.; Zhu, D.; Liao, S.; Zhang, Y.; Lu, Z.; Cong, R.; Li, X.; Lu, J. Straw returning mediates soil microbial biomass carbon and phosphorus turnover to enhance soil phosphorus availability in a rice-oilseed rape rotation with different soil phosphorus levels. Agric. Ecosyst. Environ. 2022, 335, 107991. [Google Scholar] [CrossRef]
  33. Wang, K.; Ren, T.; Cong, R.; Lu, Z.; Li, X.; Lu, J. Reduction of chemical phosphate fertilizer application in a rice–rapeseed cropping system through continuous straw return. Field Crops Res. 2024, 312, 109399. [Google Scholar] [CrossRef]
  34. Tyler, H.L. Winter cover crops and no till management enhance enzyme activities in soybean field soils. Pedobiologia 2020, 81, 150666. [Google Scholar] [CrossRef]
  35. Zheng, W.; Zhao, Z.; Gong, Q.; Li, Z. Effects of cover crop in an apple orchard on microbial community composition, networks, and potential genes involved with degradation of crop residues in soil. Biol. Fertil. Soils. 2018, 54, 743–759. [Google Scholar] [CrossRef]
  36. Brennan, E.B.; Acosta-Martinez, V. Cover Crops and Compost Influence Soil Enzymes during Six Years of Tillage-Intensive, Organic Vegetable Production. Soil Sci. Soc. Am. J. 2019, 83, 624–637. [Google Scholar] [CrossRef]
  37. Yu, D.; Wen, Z.; Li, X.; Song, X.; Wu, H.; Yang, P. Effects of straw return on bacterial communities in a wheat-maize rotation system in the North China Plain. PLoS ONE 2018, 13, e0198087. [Google Scholar] [CrossRef]
  38. Rutan, J.; Rosenzweig, N.; Steinke, K. Impact of Cover Crops and Nitrogen Management on Soil Bacterial Alpha Diversity. Commun. Soil Sci. Plant Anal. 2023, 54, 2113–2125. [Google Scholar] [CrossRef]
  39. Cheng, H.; Yuan, M.; Duan, Q.; Sun, R.; Shen, Y.; Yu, Q.; Li, S. Influence of phosphorus fertilization patterns on the bacterial community in upland farmland. Ind. Crops Prod. 2020, 155, 112761. [Google Scholar] [CrossRef]
  40. Chen, Y.; Sun, R.; Sun, T.; Liang, Y.; Jiang, Y.; Sun, B. Organic amendments shift the phosphorus-correlated microbial co-occurrence pattern in the peanut rhizosphere network during long-term fertilization regimes. Appl. Soil Ecol. 2018, 124, 229–239. [Google Scholar] [CrossRef]
  41. Fernandez, A.; Sheaffer, C.; Wyse, D.; Staley, C.; Gould, T.; Sadowsky, M. Structure of bacterial communities in soil following cover crop and organic fertilizer incorporation. Appl. Microbiol. Biotechnol. 2016, 100, 9331–9341. [Google Scholar] [CrossRef]
  42. Wang, X.; Xie, L.; Xu, L. Soil Bacterial Community Structure and Function under the Substitution of Chemical Fertilizer with Maize Straw. Agronomy 2023, 13, 1404. [Google Scholar] [CrossRef]
  43. Dai, Z.; Su, W.; Chen, H.; Barberán, A.; Zhao, H.; Yu, M.; Yu, L.; Brookes, P.C.; Schadt, C.W.; Chang, S.; et al. Long-term nitrogen fertilization decreases bacterial diversity and favors the growth of Actinobacteria and Proteobacteria in agro-ecosystems across the globe. Glob. Change Biol. 2018, 24, 3452–3461. [Google Scholar] [CrossRef] [PubMed]
  44. Asaf, S.; Numan, M.; Khan, A.L.; Al-Harrasi, A. Sphingomonas: From diversity and genomics to functional role in environmental remediation and plant growth. Crit. Rev. Biotechnol. 2020, 40, 138–152. [Google Scholar] [CrossRef] [PubMed]
  45. Figueiredo, G.; Gomes, M.; Covas, C.; Mendo, S.; Caetano, T. The Unexplored Wealth of Microbial Secondary Metabolites: The Sphingobacteriaceae Case Study. Microb. Ecol. 2022, 83, 470–481. [Google Scholar] [CrossRef]
  46. Estrada-de los Santos, P.; Rojas-Rojas, F.U.; Tapia-García, E.Y.; Vásquez-Murrieta, M.S.; Hirsch, A.M. To split or not to split: An opinion on dividing the genus Burkholderia. Ann. Microbiol. 2015, 66, 1303–1314. [Google Scholar] [CrossRef]
  47. Javed, Z.; Tripathi, G.D.; Mishra, M.; Dashora, K. Actinomycetes-The microbial machinery for the organic-cycling, plant growth, and sustainable soil health. Biocatal. Agric. Biotechnol. 2020, 31, 101893. [Google Scholar] [CrossRef]
  48. Carrión, V.J.; Pérez-Jaramillo, J.E.; Cordovez, V.; Tracanna, V.; de Hollander, M.; Ruiz-Buck, D.; Mendes, L.W.; van Ijcken, W.F.; Gomez-Exposito, R.; Elsayed, S.S. Pathogen-induced activation of disease-suppressive functions in the endophytic root microbiome. Science 2019, 366, 606–612. [Google Scholar] [CrossRef]
  49. Jiao, F.; Zhang, D.; Chen, Y.; Wu, J.; Zhang, J. Effects of Long-Term Straw Returning and Nitrogen Fertilizer Reduction on Soil Microbial Diversity in Black Soil in Northeast China. Agronomy 2023, 13, 2036. [Google Scholar] [CrossRef]
  50. Wang, K.; Song, Z.; Rong, C.; Hao, L.; Lai, Q.; Li, S.; Xu, Y. Kandeliimicrobium roseum gen. nov., sp. nov., a new member of the family Rhodobacteraceae isolated from mangrove rhizosphere soil. Int. J. Syst. Evol. Microbiol. 2018, 68, 2158–2164. [Google Scholar] [CrossRef]
  51. Peng, W.; Li, X.; Song, J.; Jiang, W.; Liu, Y.; Fan, W. Bioremediation of cadmium-and zinc-contaminated soil using Rhodobacter sphaeroides. Chemosphere 2018, 197, 33–41. [Google Scholar] [CrossRef]
  52. Felestrino, É.; Assis, R.; Lemes, C.; Cordeiro, I.; Fonseca, N.; Villa, M.; Vieira, I.; Kamino, L.; Carmo, F.; Moreira, L. Alcaligenes faecalis associated with Mimosa calodendron rizhosphere assist plant survival in arsenic rich soils. J. Soil Sci. Plant Nutr. 2017, 17, 1102–1115. [Google Scholar] [CrossRef]
  53. Hussain, A.; Ahmad, M.; Mumtaz, M.; Ali, S.; Sarfraz, R.; Naveed, M.; Jamil, M.; Damalas, C. Integrated Application of Organic Amendments with Alcaligenes sp. AZ9 Improves Nutrient Uptake and Yield of Maize (Zea mays). J. Plant Growth Regul. 2020, 39, 1277–1292. [Google Scholar] [CrossRef]
Figure 1. Cucumber morphological features and yields under different phosphorus application rates and planting patterns: (a), (b), (c), and (d), respectively, represent the influences of wheat cover crop and phosphorus application on cucumber height, stem diameter, the total dry biomass, as well as the cucumber yield. The error line is the two standard errors of the mean (n = 3) ± standard deviation (SD). **; p < 0.01; ***; p < 0.001; ns, not significant. Lowercase letters indicate differences among the five phosphorus levels under the no wheat cover crop system, capital letters indicate differences among the five phosphorus levels under the wheat cover crop system (p < 0.05). P0, P25, P50, P75, and P100 represent five different P fertilization amounts. C and N represent the wheat cover crop and no wheat crop, respectively. P represent the phosphorus application and C × P represents the interaction of wheat cover crop and phosphorus application.
Agronomy 15 00624 g001
Figure 2. Soil urease, invertase, and alkaline phosphatase activities under different phosphorus application rates and planting patterns: (a) the soil urease activity; (b) the soil invertase; (c) the soil alkaline phosphatase. Symbols and code explanations are the same as shown in Figure 1.
Agronomy 15 00624 g002
Figure 3. The influence of phosphorous application on alpha diversity of continuous cucumber soil in the wheat cover crop system: (a), Chao index; (b), Shannon index. The values are given as mean (n = 3) ± standard deviation (SD) and *, p < 0.05.
Agronomy 15 00624 g003
Figure 4. Spearman Correlation Heatmap revealing the correlation coefficients between relative abundance of dominant microbial families and cucumber morphological traits, yields, and soil enzyme activities. *, **, and *** indicate significance at p < 0.05, 0.01, and 0.001, respectively. Abbreviations: S-UE refers to the soil urease activity, S-Invertase refers to the soil invertase activity, and S-AKP refers to the soil alkaline phosphatase activity.
Agronomy 15 00624 g004
Figure 5. Differential species between two treatments: (a,b), species significantly varied due to wheat cover crop; (c,d), species significantly varied due to phosphorous application within the cover crop treatments. C (N) P0, C (N) P50, C (N) P100 represent three different P fertilization levels of P0, P50, and P100, respectively, under the wheat cover crop or no wheat cover crop. *, p < 0.05; **, p < 0.01; ***, p < 0.001. The numbers at the far right of the images represent the p-value.
Agronomy 15 00624 g005
Figure 6. ASVs that significantly varied (in terms of relative abundance > 0.1%) due to wheat cover crop and phosphorous application (the p value-adjusted < 0.01): (a,b), ASVs significantly varied due to wheat cover crop; (c,d), ASVs significantly varied due to phosphorous application within the cover crop treatments. C (N) P0, C (N) P50, C (N) P100 represent three different P fertilization levels of P0, P50, and P100, respectively, under the wheat cover crop or no wheat cover crop. The horizontal dashed line represents the p value-adjusted = 0.01. The vertical dashed lines represent log2 fold change value = −1 and 1, respectively.
Agronomy 15 00624 g006
Table 1. Amounts of five fertilization treatments under two different cultivation ways.
Planting PatternCode of P LevelAmount of Superphosphate Input (g·pot−1)
C (N)P00
P254.4
P508.71
P7513.07
P10017.42
In the table, C denotes the wheat cover crop, while N represents the no wheat cover crop. The codes of P0, P25, P50, P75, and P100 correspond to five different levels of phosphorus fertilizer application, as detailed in the above table.
Table 2. Effects of phosphorus application and wheat cover crop on α-diversity indices by two-way ANOVA.
Chao IndexShannon Index
F Valuesp ValuesF Valuesp Values
C (Wheat cover crop)1.9640.1761.0170.325
P (Phosphorus)3.5710.0246.1330.002
C × N (Wheat cover crop × Phosphorus)2.7390.0580.9490.457
Note: Bold font showed statistically significant values (p < 0.05).
Disclaimer/Publisher’s Note: The statements, opinions and data contained in all publications are solely those of the individual author(s) and contributor(s) and not of MDPI and/or the editor(s). MDPI and/or the editor(s) disclaim responsibility for any injury to people or property resulting from any ideas, methods, instructions or products referred to in the content.

