
Ecosystem Responses of Jerusalem Artichoke (Helianthus tuberosus L.) in Alpine Desert Environments in Northeastern Qinghai, Tibet Plateau, China
Abstract
1. Introduction
2. Materials and Methods
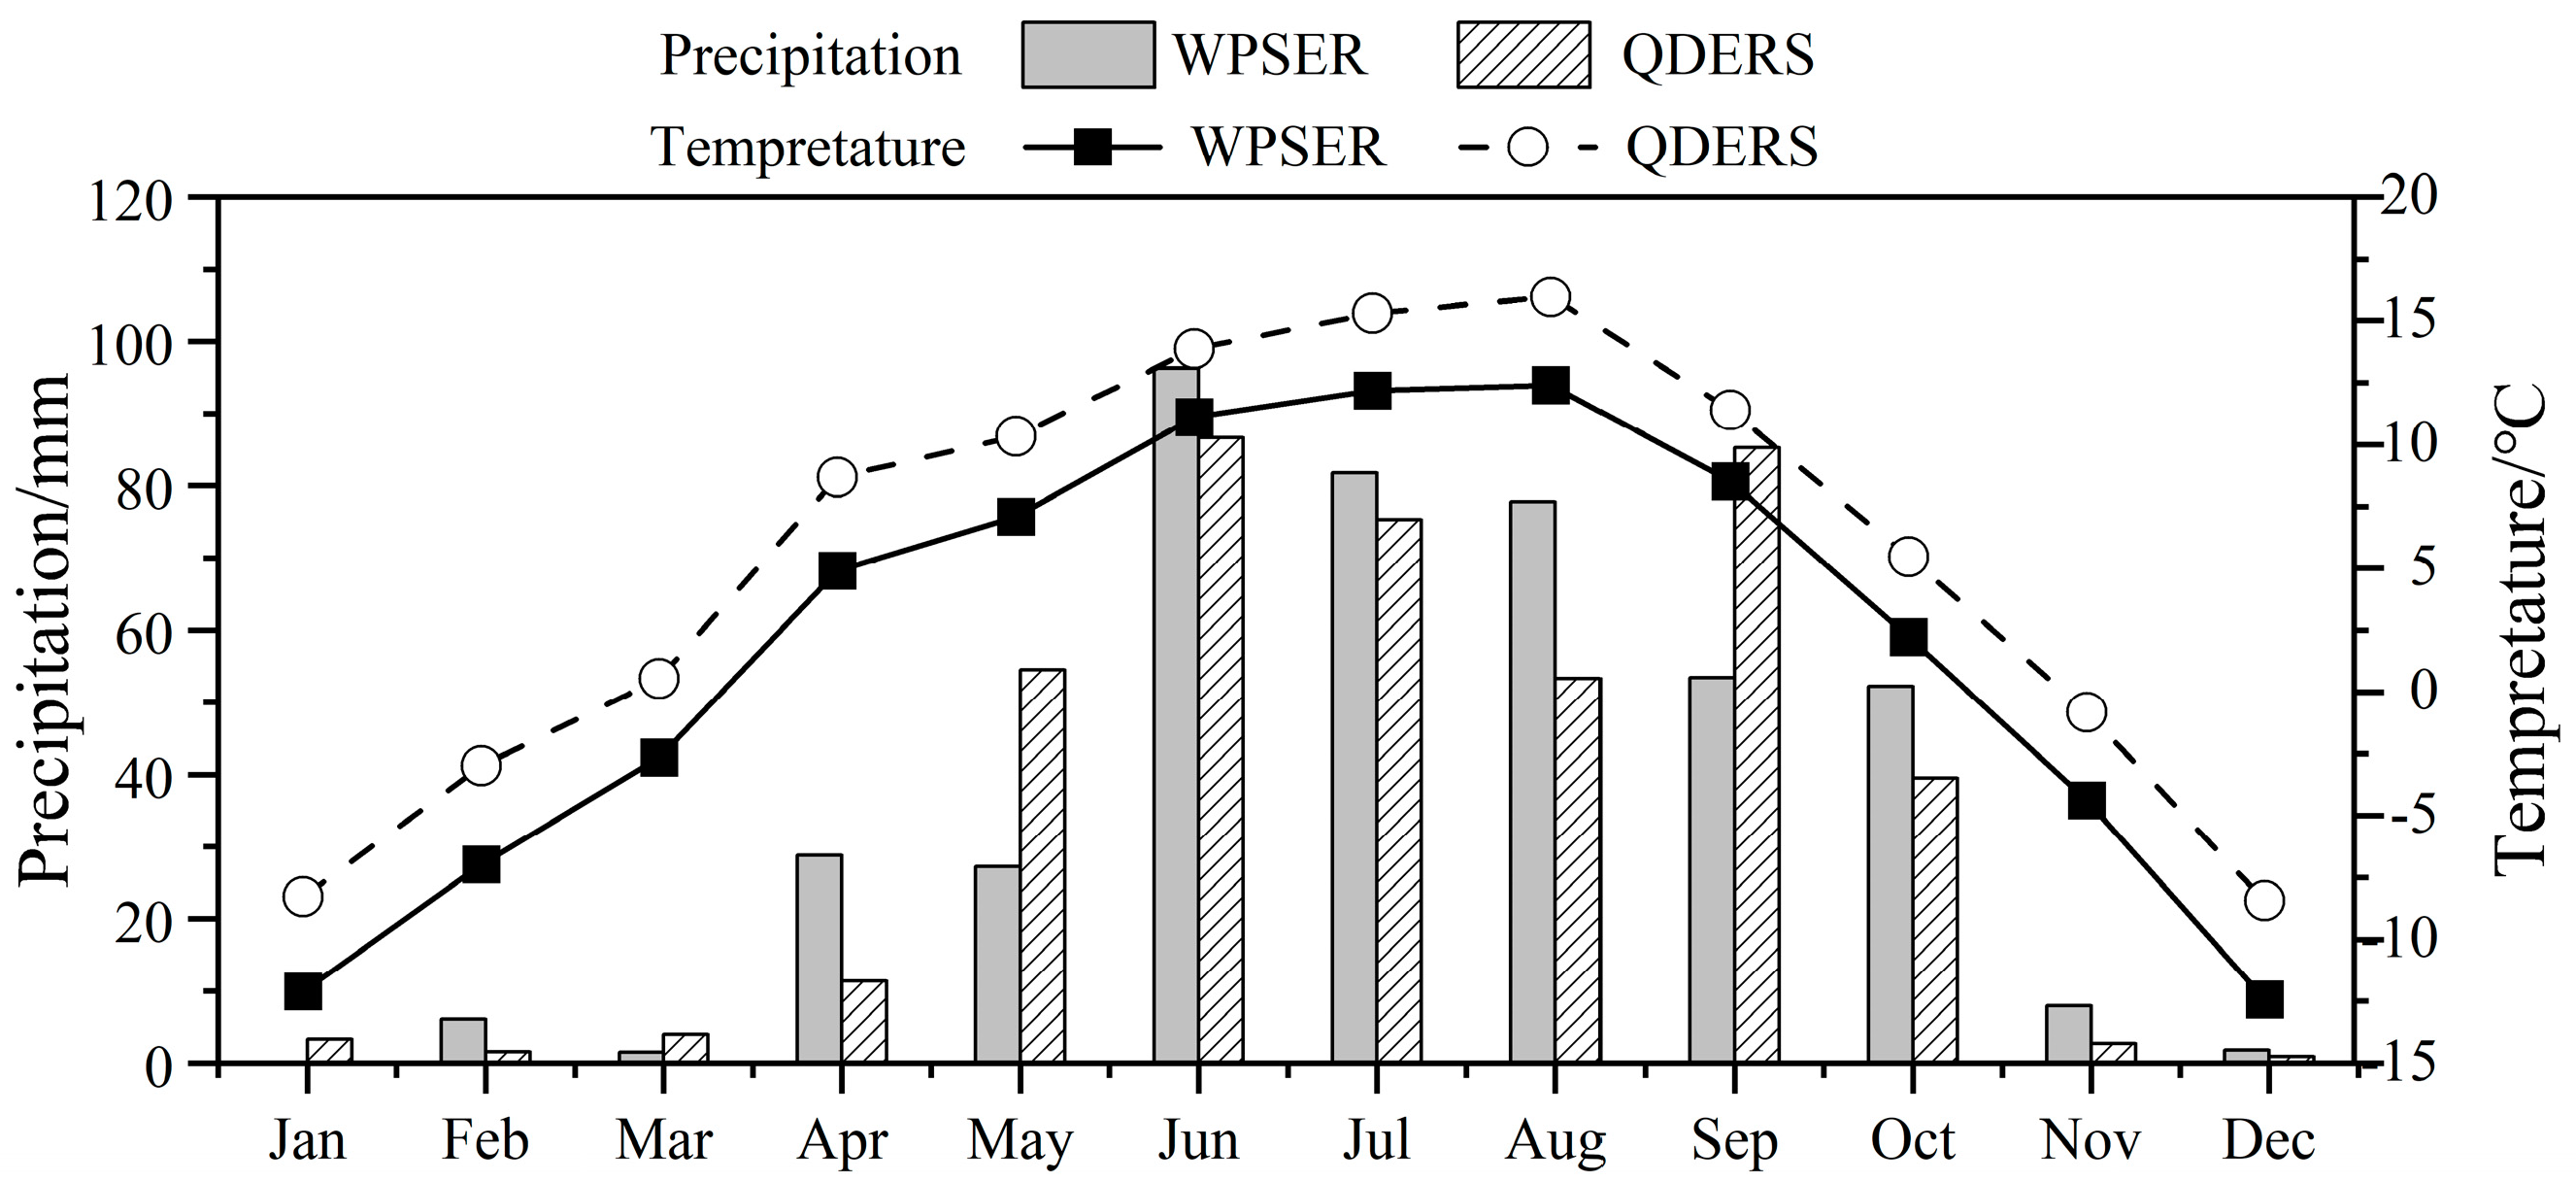
2.1. Study Sites
2.2. Materials
2.3. Methods
2.4. Data Analysis
3. Results
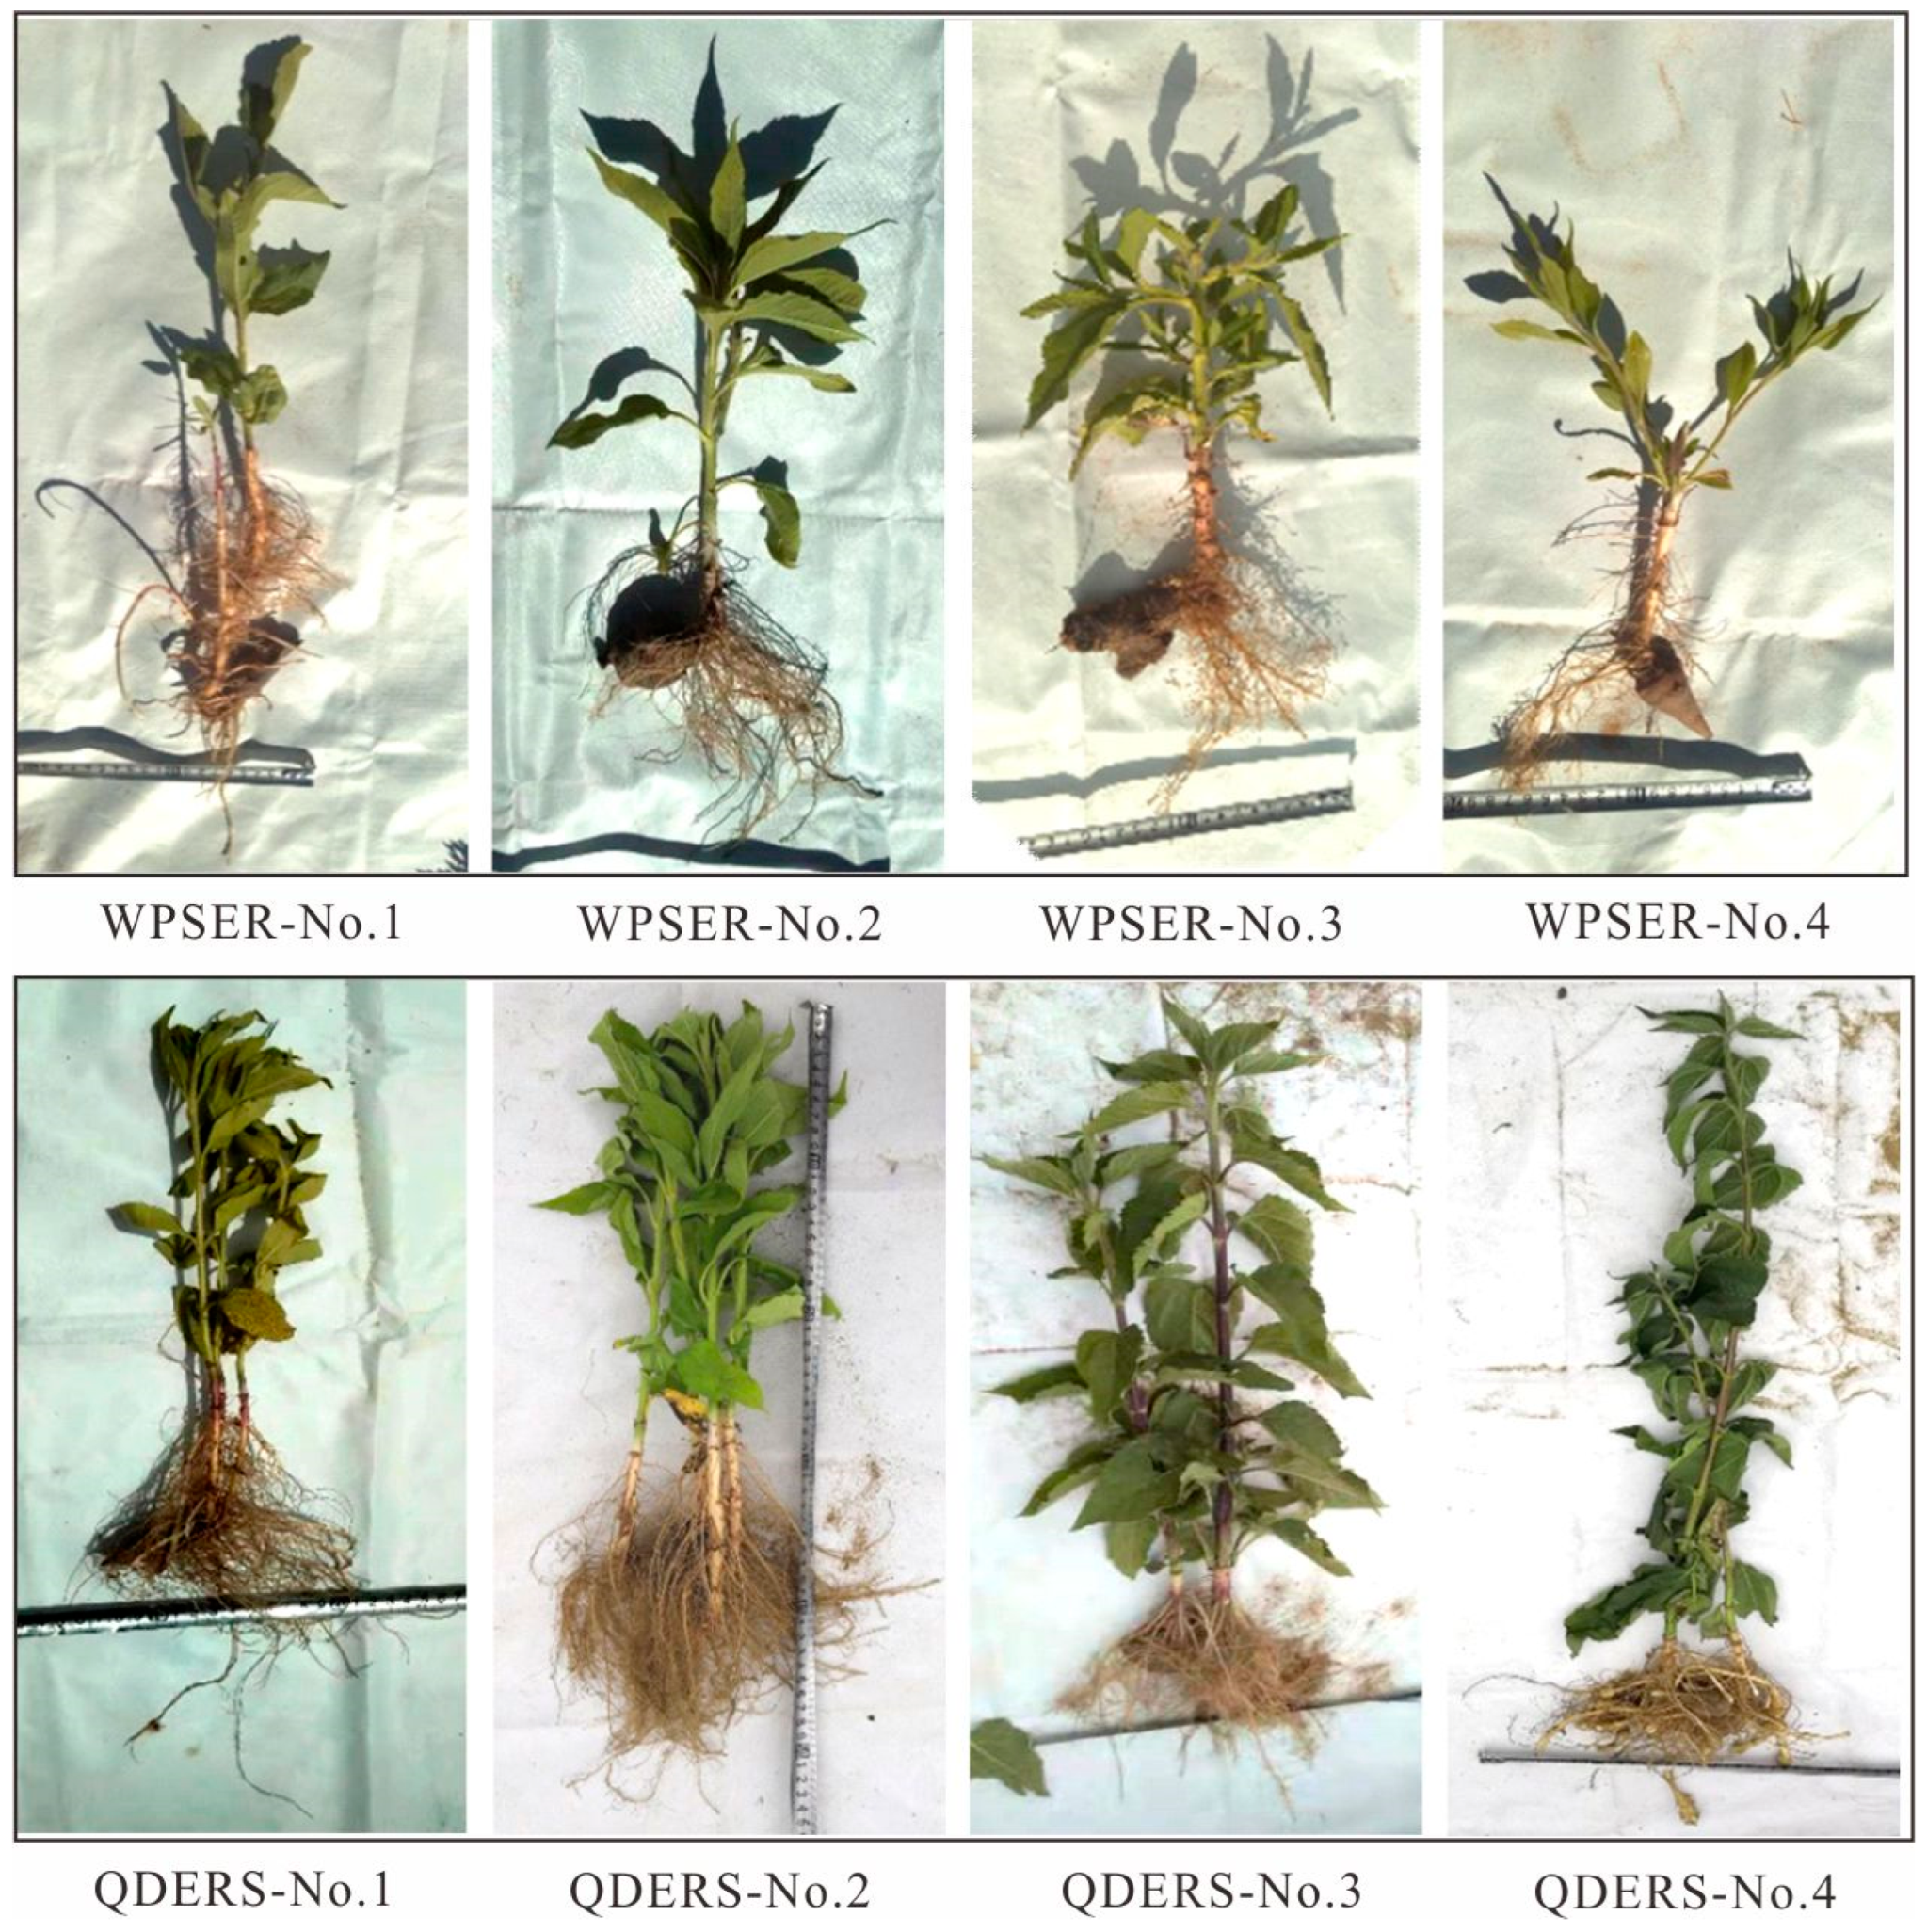
3.1. Growth Characteristics of Different Varieties of H. tuberosus
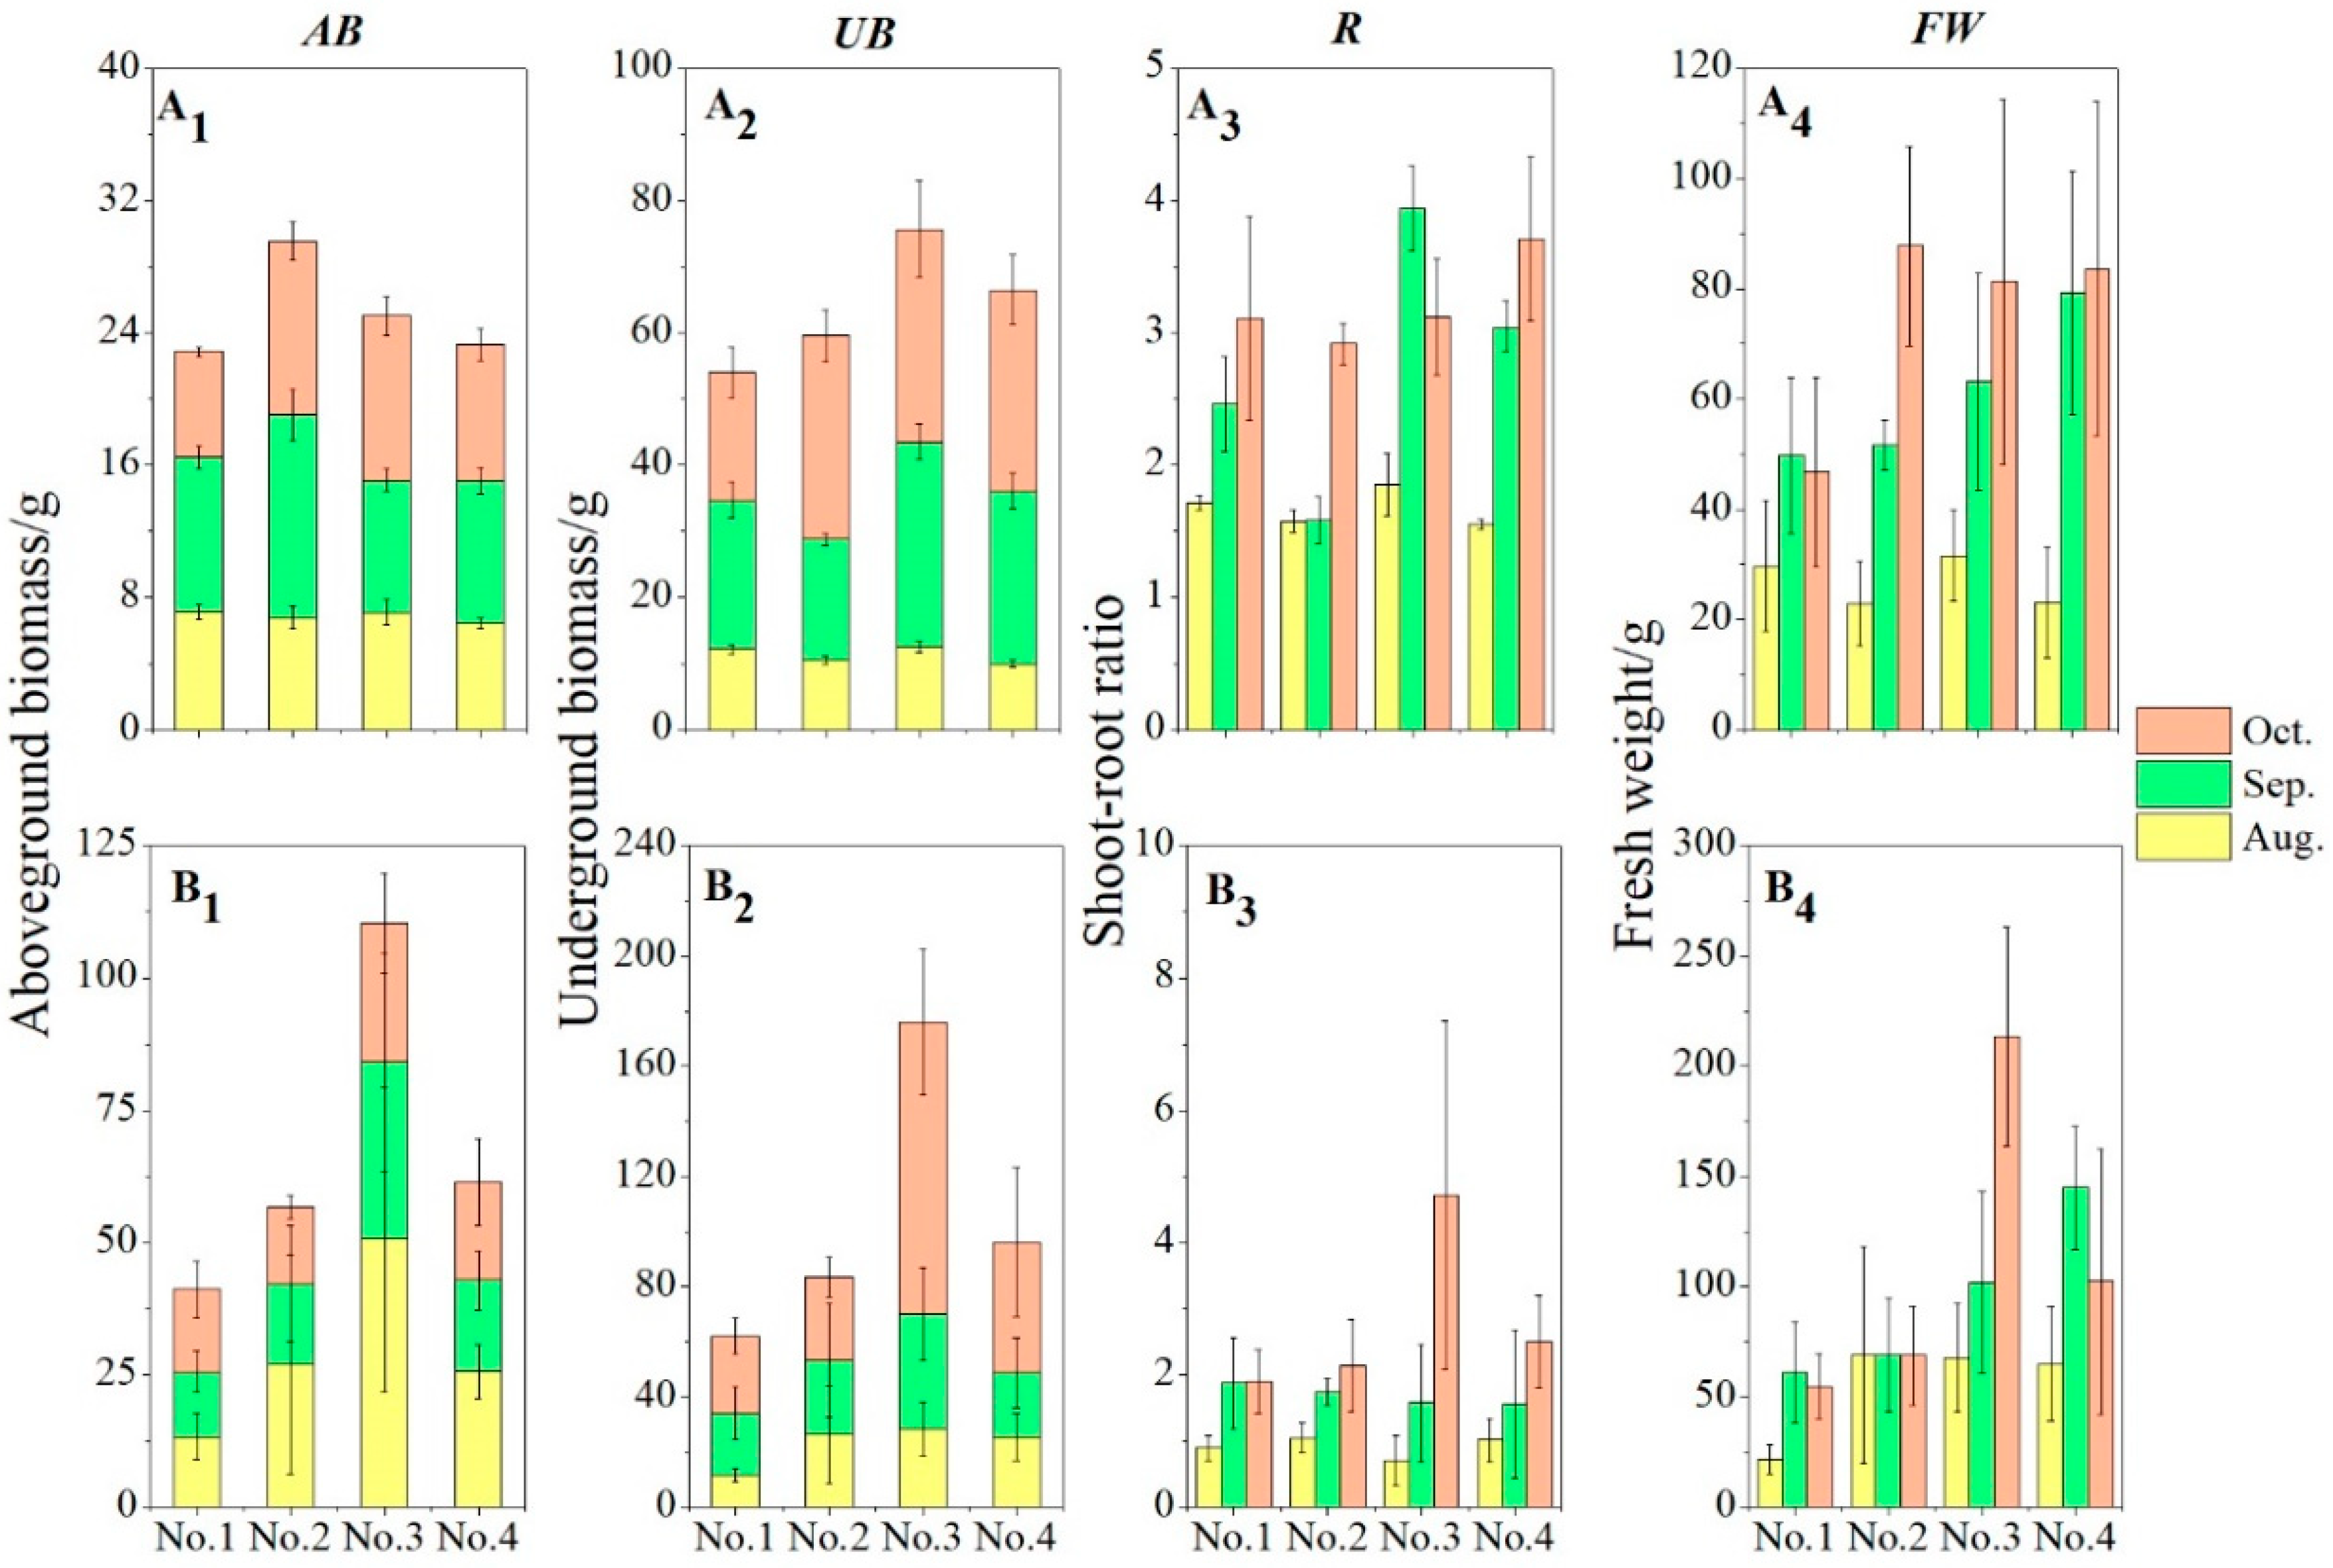
3.2. Biomass of Different Varieties of H. tuberosus
4. Discussion
4.1. Growth and Development of H. tuberosus and Its Influencing Factors
4.2. Relationship Between Soil Properties and Growth of H. tuberosus
4.3. Influence of Various Environmental Factors on the Growth Response of H. tuberosus
5. Conclusions
Author Contributions
Funding
Data Availability Statement
Acknowledgments
Conflicts of Interest
References
- D’Odorico, P.; Ridolfi, L.; Laio, F. Precursors of State Transitions in Stochastic Systems with Delay. Theor. Ecol. 2013, 6, 265–270. [Google Scholar] [CrossRef]
- Bao, Y.; Cheng, L.; Bao, Y.; Yang, L.; Jiang, L.; Long, C.; Kong, Z.; Peng, P.; Xiao, J.; Lu, Q. Desertification: China Provides a Solution to a Global Challenge. Front. Agric. Sci. Eng. 2017, 4, 402–413. [Google Scholar] [CrossRef]
- Lu, X.; Sheng, M.; Luo, M. Knowledge Mapping Analysis of Karst Rocky Desertification Vegetation Restoration in Southwest China: A Study Based on Web of Science Literature. Agronomy 2024, 14, 2235. [Google Scholar] [CrossRef]
- Wang, Z.; Hasi, E. Research on the Development of Deserticulture and Desertification Land Use Benefits Evaluation in Ordos City. Land 2023, 12, 1254. [Google Scholar] [CrossRef]
- Gao, X.; Liu, L.; Shang, Y.; Qi, F. Desert Ecological Control and Ecological Industrial Construction: Practice and Inspiration from China. Cjina Geol. 2024, 7, 596–600. [Google Scholar]
- Shao, M.; Wang, L.; Li, B.; Li, S.; Fan, J.; Li, C. Maxent Modeling for Identifying the Nature Reserve of Cistanche deserticola Ma under Effects of the Host (Haloxylon bunge) Forest and Climate Changes in Xinjiang, China. Forests 2022, 13, 189. [Google Scholar] [CrossRef]
- Ma, X.; Zhang, L.; Shao, H.; Xu, G.; Zhang, F.; Ni, F.; Brestic, M. Jerusalem Artichoke (Helianthus tuberosus), a Medicinal Salt-Resistant Plant Has High Adaptability and Multiple-Use Values. J. Med. Plants Res. 2011, 5, 1272–1279. [Google Scholar]
- Rossini, F.; Provenzano, M.E.; Kuzmanović, L.; Ruggeri, R. Jerusalem Artichoke (Helianthus tuberosus L.): A Versatile and Sustainable Crop for Renewable Energy Production in Europe. Agronomy 2019, 9, 528. [Google Scholar] [CrossRef]
- Jankowski, K.J.; Dubis, B.; Kozak, M. Sewage Sludge and the Energy Balance of Jerusalem Artichoke Production—A Case Study in North-Eastern Poland. Energy 2021, 236, 121545. [Google Scholar] [CrossRef]
- Ciccoli, R.; Sperandei, M.; Petrazzuolo, F.; Broglia, M.; Chiarini, L.; Correnti, A.; Farneti, A.; Pignatelli, V.; Tabacchioni, S. Anaerobic Digestion of the above Ground Biomass of Jerusalem Artichoke in a Pilot Plant: Impact of the Preservation Method on the Biogas Yield and Microbial Community. Biomass Bioenergy 2018, 108, 190–197. [Google Scholar] [CrossRef]
- Terzić, S.; Atlagić, J.; Maksimović, I.; Zeremski, T.; Zorić, M.; Miklič, V.; Balalić, I. Genetic Variability for Concentrations of Essential Elements in Tubers and Leaves of Jerusalem Artichoke (Helianthus tuberosus L.). Sci. Hortic. 2012, 136, 135–144. [Google Scholar] [CrossRef]
- Díaz, A.; García, M.A.; Dini, C. Jerusalem Artichoke Flour as Food Ingredient and as Source of Fructooligosaccharides and Inulin. J. Food Compos. Anal. 2022, 114, 104863. [Google Scholar] [CrossRef]
- López-Molina, D.; Navarro-Martínez, M.D.; Rojas-Melgarejo, F.; Hiner, A.N.P.; Chazarra, S.; Rodríguez-López, J.N. Molecular Properties and Prebiotic Effect of Inulin Obtained from Artichoke (Cynara Scolymus L.). Phytochemistry 2005, 66, 1476–1484. [Google Scholar] [CrossRef] [PubMed]
- Francavilla, M.; Marone, M.; Marasco, P.; Contillo, F.; Monteleone, M. Artichoke Biorefinery: From Food to Advanced Technological Applications. Foods 2021, 10, 112. [Google Scholar] [CrossRef] [PubMed]
- Liu, Z. Genetic Variation and Yield Performance of Jerusalem Artichoke Germplasm Collected in China. Agric. Sci. China 2011, 10, 668–678. [Google Scholar] [CrossRef]
- Lv, S.; Wang, R.; Xiao, Y.; Li, F.; Mu, Y.; Lu, Y.; Gao, W.; Yang, B.; Kou, Y.; Zeng, J.; et al. Growth, Yield Formation, and Inulin Performance of a Non-Food Energy Crop, Jerusalem Artichoke (Helianthus tuberosus L.), in a Semi-Arid Area of China. Ind. Crops Prod. 2019, 134, 71–79. [Google Scholar] [CrossRef]
- Puangbut, D.; Jogloy, S.; Vorasoot, N.; Patanothai, A. Responses of Growth, Physiological Traits and Tuber Yield in Helianthus tuberosus to Seasonal Variations under Tropical Area. Sci. Hortic. 2015, 195, 108–115. [Google Scholar] [CrossRef]
- Yang, S.; Sun, X.; Jiang, X.; Wang, L.; Tian, J.; Li, L.; Zhao, M.; Zhong, Q. Characterization of the Tibet Plateau Jerusalem Artichoke (Helianthus tuberosus L.) Transcriptome by de Novo Assembly to Discover Genes Associated with Fructan Synthesis and SSR Analysis. Hereditas 2019, 156, 9. [Google Scholar] [CrossRef]
- Zorić, M.; Terzić, S.; Sikora, V.; Brdar-Jokanović, M.; Vassilev, D. Effect of Environmental Variables on Performance of Jerusalem Artichoke (Helianthus tuberosus L.) Cultivars in a Long Term Trial: A Statistical Approach. Euphytica 2017, 213, 23. [Google Scholar] [CrossRef]
- Gatta, G.; Gagliardi, A.; Disciglio, G.; Lonigro, A.; Francavilla, M.; Tarantino, E.; Giuliani, M. Irrigation with Treated Municipal Wastewater on Artichoke Crop: Assessment of Soil and Yield Heavy Metal Content and Human Risk. Water 2018, 10, 255. [Google Scholar] [CrossRef]
- Long, X.; Huang, Z.; Huang, Y.; Kang, J.; Zhang, Z.; Liu, Z. Response of Two Jerusalem Artichoke (Helianthus tuberosus) Cultivars Differing in Tolerance to Salt Treatment. Pedosphere 2010, 20, 515–524. [Google Scholar] [CrossRef]
- Kong, K.; Nandintsetseg, B.; Shinoda, M.; Ishizuka, M.; Kurosaki, Y.; Bat-Oyun, T.; Gantsetseg, B. Seasonal variations in threshold wind speed for saltation depending on soil temperature and vegetation: A case study in the Gobi Desert. Aeolian. Res 2021, 52, 100716. [Google Scholar] [CrossRef]
- Dima, M.; Croitoru, M.; Drăghici, R.; Drăghici, I.; Ciuciuc, E.; Băjenaru, M.F. Researahs on the Behavior of Jerusalem Artichoke Varieties Grown on Sandy Soils in Terms of Nutritional Quality of Tubers. Sci. Pap. Ser. Manag. Econ. Eng. Agric. Rural Dev. 2021, 21, 309–316. [Google Scholar]
- Ping, X.; Jiang, Z.; Li, C. Status and future perspectives of energy consumption and its ecological impacts in the Qinghai–Tibet region. Renew. Sustain. Energy Rev. 2011, 15, 514–523. [Google Scholar] [CrossRef]
- Wu, W.; Zhang, D.; Tian, L.; Zhang, M.; Zhou, X. Morphologic Features and Forming Causes of Plant Sandpiles in Alpine Sand Land. Arid Zone Res. 2018, 35, 713–721. (In Chinese) [Google Scholar] [CrossRef]
- Yu, Y.; Jia, Z.; Zhu, Y.; Zhao, S.; Liu, H.; Li, Q.; Wei, D. Root Distribution of Salix cheilophila along a Chronosequence in High-Cold Sandland. J. Desert Res. 2014, 34, 67–74. (In Chinese) [Google Scholar]
- Li, L. Research on Jerusalem Artichoke; Qinghai People’s Publishing House: Qinghai, China, 2012. (In Chinese) [Google Scholar]
- Gebre, T.; Chinthapalli, B.; Anjulo, M.M.; Robinson, D. The Impacts of Post Plantation Management Practices on Growth and Survival Rate of Selected Tree Species in Mirab Abaya District, Southern Ethiopia: An Experimental Approach. J. Hortic. For. 2022, 14, 28–41. [Google Scholar] [CrossRef]
- Pnueli, L.; Hallak-Herr, E.; Rozenberg, M.; Cohen, M.; Goloubinoff, P.; Kaplan, A.; Mittler, R. Molecular and Biochemical Mechanisms Associated with Dormancy and Drought Tolerance in the Desert Legume Retama Raetam. Plant J. 2002, 31, 319–330. [Google Scholar] [CrossRef] [PubMed]
- Strelec, I.; Popović, R.; Ivanišić, I.; Jurković, V.; Jurković, Z.; Ugarčić-Hardi, Ž.; Sabo, M. Influence of Temperature and Relative Humidity on Grain Moisture, Germination and Vigour of Three Wheat Cultivars during One Year Storage. Poljoprivreda 2010, 16, 20–24. [Google Scholar]
- Kauth, P.J.; Biber, P.D. Moisture Content, Temperature, and Relative Humidity Influence Seed Storage and Subsequent Survival and Germination of Vallisneria Americana Seeds. Aquat. Bot. 2015, 120, 297–303. [Google Scholar] [CrossRef]
- Kaya, M.D.; Kulan, E.G. Effective Seed Priming Methods Improving Germination and Emergence of Sugar Beet Under Low-Temperature Stress. Sugar Tech. 2020, 22, 1086–1091. [Google Scholar] [CrossRef]
- Yang, Z.; Wang, L.; Zhang, X.; Shen, J.; Zhang, Y.; Li, X.; Zhang, B.; Niu, J. Seed Germination and Seedling Growth of Typical Sand-Fixing Plants in Response to Soil Moisture. Arid Zone Res. 2024, 41, 830–842. [Google Scholar] [CrossRef]
- Mao, L.; Chen, S.; Zhang, J.; Zhou, G. Altitudinal Patterns of Maximum Plant Height on the Tibetan Plateau. J. Plant Ecol. 2016, 11, 85–91. [Google Scholar] [CrossRef]
- Leduc, N.; Roman, H.; Barbier, F.; Péron, T.; Huché-Thélier, L.; Lothier, J.; Demotes-Mainard, S.; Sakr, S. Light Signaling in Bud Outgrowth and Branching in Plants. Plants 2014, 3, 223–250. [Google Scholar] [CrossRef] [PubMed]
- Zhang, H.; Liu, S.; Regnier, P.; Yuan, W. New Insights on Plant Phenological Response to Temperature Revealed from Long-Term Widespread Observations in China. Glob. Chang. Biol. 2018, 24, 2066–2078. [Google Scholar] [CrossRef] [PubMed]
- Wang, H.; Wang, H.; Ge, Q.; Dai, J. The Interactive Effects of Chilling, Photoperiod, and Forcing Temperature on Flowering Phenology of Temperate Woody Plants. Front. Plant Sci. 2020, 11, 443. [Google Scholar] [CrossRef] [PubMed]
- Zhao, M.; Guo, Y.; Sun, S.; Ren, Y. Evaluation of Cold Resistance of Four Jerusalem Artichoke (Helianthus tuberosus) under Low Temperature Stress. Plant Physiol. J. 2020, 56, 1419–1431. (In Chinese) [Google Scholar] [CrossRef]
- Li, C.; Zeng, F.; Zhang, B.; Liu, B.; Guo, Z.; Gao, H.; Tiyip, T. Optimal Root System Strategies for Desert Phreatophytic Seedlings in the Search for Groundwater. J. Arid Land 2015, 7, 462–474. [Google Scholar] [CrossRef]
- Gao, H.; Wang, Y.; Wang, F.; Jiang, B. Dynamics of root-shoot ratio and environmental effective factors of recovering Leymus chinensis steppe vegetation in Inner Mongolia, China. Acta Ecol Sin. 2008, 28, 4629–4634. [Google Scholar] [CrossRef]
- Lázaro-Nogal, A.; Matesanz, S.; Godoy, A.; Pérez-Trautman, F.; Gianoli, E.; Valladares, F. Environmental Heterogeneity Leads to Higher Plasticity in Dry-Edge Populations of a Semi-Arid Chilean Shrub: Insights into Climate Change Responses. J. Ecol. 2015, 103, 338–350. [Google Scholar] [CrossRef]
- Iijima, M.; Kato, J. Combined Soil Physical Stress of Soil Drying, Anaerobiosis and Mechanical Impedance to Seedling Root Growth of Four Crop Species. Plant Prod. Sci 2007, 10, 451–459. [Google Scholar] [CrossRef]
- Toillon, J.; Fichot, R.; Dallé, E.; Berthelot, A.; Brignolas, F.; Marron, N. Planting density affects growth and water-use efficiency depending on site in Populus deltoides × P. nigra. Forest Ecol. Manag. 2013, 304, 345–354. [Google Scholar] [CrossRef]
- Zhang, H.; Tian, L.; Hasi, E.; Zhang, D.; Wu, W. Vegetation–Soil Dynamics in an Alpine Desert Ecosystem of the Qinghai Lake Watershed, Northeastern Qinghai-Tibet Plateau. Front. Environ. Sci. 2023, 11, 1119605. [Google Scholar] [CrossRef]
- Müller, I.; Schmid, B.; Weiner, J. The Effect of Nutrient Availability on Biomass Allocation Patterns in 27 Species of Herbaceous Plants. Perspect. Plant Ecol. Evol. Syst. 2000, 3, 115–127. [Google Scholar] [CrossRef]
- Ruttanaprasert, R.; Jogloy, S.; Vorasoot, N.; Kesmala, T.; Kanwar, R.S.; Holbrook, C.C.; Patanothai, A. Effects of Water Stress on Total Biomass, Tuber Yield, Harvest Index and Water Use Efficiency in Jerusalem Artichoke. Agric. Water Manag. 2016, 166, 130–138. [Google Scholar] [CrossRef]
- Hutchings, M.J.; John, E.A. The Effects of Environmental Heterogeneity on Root Growth and Root/Shoot Partitioning. Ann. Bot. 2004, 94, 1–8. [Google Scholar] [CrossRef] [PubMed]
- Doust, J.L. Plant Reproductive Strategies and Resource Allocation. Trends Ecol. Evol. 1989, 4, 230–234. [Google Scholar] [CrossRef]
- Peng, X.; Yang, Y.; Yan, X.; Li, H. The Effects of Water Control on the Survival and Growth of Alternanthera philoxeroides in the Vegetative Reproduction and Seedling Stages. Sci. Rep. 2021, 11, 13556. [Google Scholar] [CrossRef] [PubMed]
- Eziz, A.; Yan, Z.; Tian, D.; Han, W.; Tang, Z.; Fang, J. Drought Effect on Plant Biomass Allocation: A Meta-Analysis. Ecol. Evol. 2017, 7, 11002–11010. [Google Scholar] [CrossRef] [PubMed]
- Zhou, G.; Zhou, X.; Nie, Y.; Bai, S.H.; Zhou, L.; Shao, J.; Cheng, W.; Wang, J.; Hu, F.; Fu, Y. Drought-Induced Changes in Root Biomass Largely Result from Altered Root Morphological Traits: Evidence from a Synthesis of Global Field Trials. Plant Cell Environ. 2018, 41, 2589–2599. [Google Scholar] [CrossRef]
- Islam, S.; Reza, M.N.; Chowdhury, M.; Chung, S.O.; Choi, I.S. A review on effect of ambient environment factors and monitoring technology for plant factory. Precis. Agric. 2021, 3, 83–98. [Google Scholar] [CrossRef]
- Kubota, C. Growth, development, transpiration and translocation as affected by abiotic environmental factors. In Plant Factory; Academic Press: Cambridge, MA, USA, 2016; pp. 151–164. [Google Scholar] [CrossRef]
- Maibam, A.; Nisar, S.; Zargar, S.M.; Mahajan, R. High-temperature response and tolerance in agronomic crops. In Agronomic Crops: Volume 3: Stress Responses and Tolerance; Springer: Singapore, 2020; pp. 173–190. [Google Scholar]
- Li, S.; Dong, S.; Fu, Y.; Zhou, B.; Liu, S.; Shen, H.; Xu, Y.; Gao, X.; Xiao, J.; Wu, S.; et al. Air or soil temperature matters the responses of alpine plants in biomass accumulation to climate warming. Sci. Total Environ. 2022, 844, 157141. [Google Scholar] [CrossRef] [PubMed]
- Jiao, S.; Zhang, M.; Wang, Y.; Liu, J.; Li, Y. Variation of soil nutrients and particle size under different vegetation types in the Yellow River Delta. Acta Ecol. Sin. 2014, 34, 148–153. [Google Scholar] [CrossRef]
- Chen, X.; Duan, Z.; Tan, M. Restoration affect soil organic carbon and nutrients in different particle-size fractions. Land Degrad. Dev. 2016, 27, 561–572. [Google Scholar] [CrossRef]
- Tian, H.; Liu, K.; Zhou, J.; Lu, L.; Hao, J.; Qiu, P.; Gao, J.; Zhu, C.; Wang, K.; Hua, S. Atmospheric Emission Inventory of Hazardous Trace Elements from China’s Coal-Fired Power Plants-Temporal Trends and Spatial Variation Characteristics. Environ. Sci. Technol. 2014, 48, 3575–3582. [Google Scholar] [CrossRef] [PubMed]
- Li, L.; Zhang, Y.J.; Novak, A.; Yang, Y.; Wang, J. Role of Biochar in Improving Sandy Soil Water Retention and Resilience to Drought. Water 2021, 13, 407. [Google Scholar] [CrossRef]


| Full Name | Abbreviation | Full Name | Abbreviation |
|---|---|---|---|
| Ketu Wind Prevention and Sand-fixation Experimental Range | WPSER | Qinghai Desert Ecosystem Research Station in Shazhuyu, Gonghe County | QDERS |
| Qingyu No. 1 | No. 1 | Qingyu No. 3 | No. 3 |
| Qingyu No. 2 | No. 2 | Qingyu No. 4 | No. 4 |
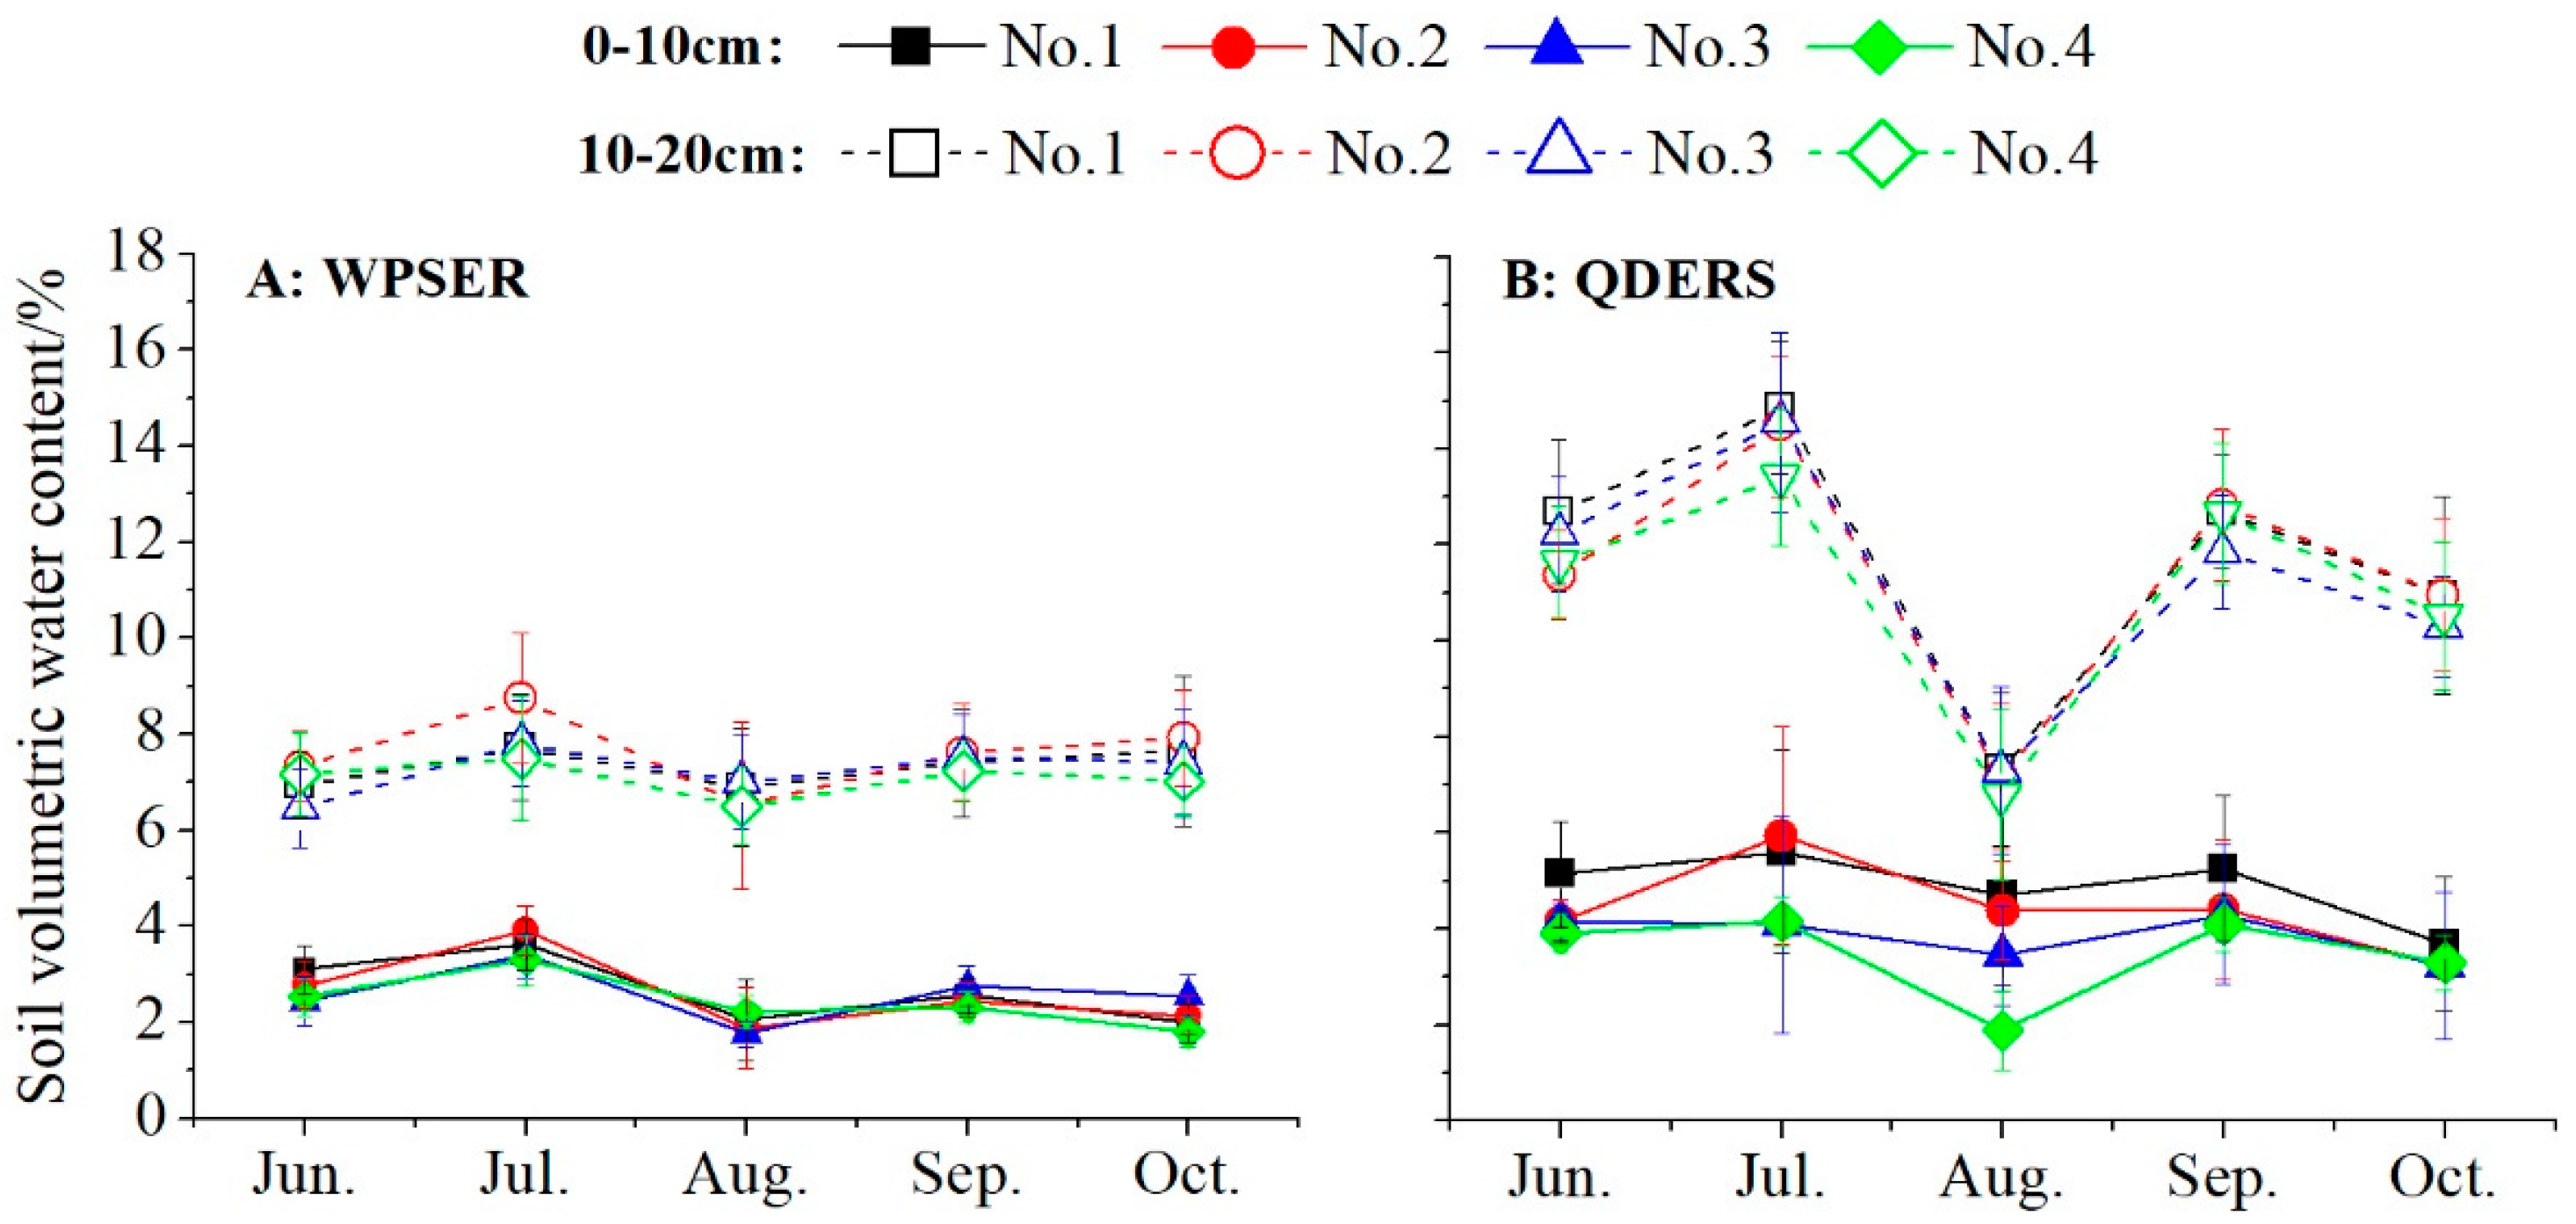
| Soil volumetric water content | SWC | Soil organic matter | SOM |
| Total nitrogen | TN | Total phosphorus pentoxide | TP2Q5 |
| Total potassium oxide | TK2O | Ammonium nitrogen | AHN |
| Available phosphorus | AP | Available potassium | AK |
| Electrical conductivity | EC | Survival rate | SR |
| Germination rate | GR | Number of branches | B |
| Plant height | H | Leaf area | LA |
| Base diameter | D | Above-ground biomass | AB |
| Undergroundbiomass | UB | Root–shoot ratio | R |
| Fresh weight | FW |
| Soil Depth/cm | Clay | Silt | Very Fine Sand | Fine Sand | Medium Sand | Coarse Sand | SOM | ||
|---|---|---|---|---|---|---|---|---|---|
| WPSER | 0~10 | 0.64 ± 0.28 | 5.97 ± 1.65 | 7.57 ± 2.37 | 29.58 ± 6.06 | 45.95 ± 2.52 | 10.29 ± 3.28 | 1.16 ± 0.28 | |
| 10~20 | 0.98 ± 0.12 | 7.48 ± 0.90 | 9.80 ± 2.40 | 33.55 ± 12.62 | 40.89 ± 8.31 | 7.31 ± 5.93 | 0.57 ± 0.12 | ||
| QDERS | 0~10 | 6.75 ± 0.11 | 47.83 ± 4.72 | 20.35 ± 3.44 | 19.50 ± 4.10 | 5.38 ± 3.94 | 0.20 ± 0.02 | 1.70 ± 0.22 | |
| 10~20 | 3.24 ± 1.03 | 39.63 ± 6.70 | 33.06 ± 3.92 | 21.23 ± 6.02 | 3.98 ± 2.17 | 0.16 ± 0.02 | 1.13 ± 0.15 | ||
| Soil depth/cm | TN | TP2O5 | TK2O | AHN | AP | AK | pH | EC | |
| WPSER | 0~10 | 0.36 ± 0.11 | 0.71 ± 0.13 | 18.15 ± 2.32 | 7 ± 1.45 | 2.1 ± 0.88 | 19 ± 3.17 | 8.83 ± 0.63 | 0.00 ± 0.004 |
| 10~20 | 0.30 ± 0.05 | 0.67 ± 0.06 | 16.18 ± 2.55 | 10 ± 1.98 | 3.2 ± 1.56 | 25 ± 3.39 | 8.82 ± 1.7 | 0.02 ± 0.007 | |
| QDERS | 0~10 | 0.30 ± 0.07 | 1.06 ± 0.13 | 19.12 ± 3.19 | 10 ± 1.02 | 3.1 ± 1.12 | 48 ± 3.02 | 8.95 ± 1.25 | 0.10 ± 0.02 |
| 10~20 | 0.44 ± 0.14 | 0.90 ± 0.12 | 17.21 ± 2.97 | 17 ± 2.84 | 2.0 ± 1.43 | 14 ± 2.85 | 8.98 ± 1.37 | 0.09 ± 0.05 | |
| Location | Indicator | NO.1 | NO.2 | NO.3 | NO.4 |
|---|---|---|---|---|---|
| WPSER | GR (%) | 74 ± 20 a | 36 ± 17 b | 76 ± 13 a | 79 ± 17 a |
| SR (%) | 76 ± 23 a | 83 ± 8 a | 78 ± 18 a | 54 ± 30 b | |
| QDERS | GR (%) | 83 ± 19 a | 88 ± 15 a | 68 ± 23 a | 83 ± 13 a |
| SR (%) | 88 ± 10 a | 88 ± 10 a | 88 ± 10 a | 83 ± 18 a |
| Location | Varieties | Height (H)/cm | Branches (B) /cm | Base Diameter (D)/cm | Leaf Area (LA)/cm2 |
|---|---|---|---|---|---|
| WPSER | No.1 | 33.40 ± 11.52 a | 3.40 ± 1.08 a | 0.80 ± 0.18 a | 21.89 ± 0.41 a |
| No.2 | 24.50 ± 9.86 a | 2.50 ± 1.64 a | 0.74 ± 0.19 a | 17.85 ± 0.26 a | |
| No.3 | 27.90 ± 4.79 a | 3.30 ± 1.25 a | 0.88 ± 0.23 a | 25.29 ± 0.23 a | |
| No.4 | 20.10 ± 12.07 b | 2.30 ± 1.92 a | 0.77 ± 0.24 a | 23.87 ± 0.40 a | |
| QDERS | No.1 | 46.70 ± 27.03 a | 1.50 ± 0.53 a | 0.85 ± 0.40 a | 29.71 ± 4.30 a |
| No.2 | 39.70 ± 14.64 a | 2.40 ± 1.07 a | 0.86 ± 0.13 a | 34.49 ± 1.95 a | |
| No.3 | 76.50 ± 28.87 b | 2.38 ± 1.19 a | 0.85 ± 0.40 a | 48.04 ± 2.68 b | |
| No.4 | 79.75 ± 23.47 b | 2.00 ± 1.12 a | 1.06 ± 0.39 a | 51.46 ± 0.79 b |
| AT | ST | SWC | SOM | SC | MSC | RH-S | TA | 8H | 9AB | 9UB | 10AB | 10UB | |
|---|---|---|---|---|---|---|---|---|---|---|---|---|---|
| AT | -- | ||||||||||||
| ST | 0.275 | -- | |||||||||||
| SWC | 0.533 | 0.139 | -- | ||||||||||
| SOM | 0.432 | 0.036 | 0.517 | -- | |||||||||
| SC | −0.840 ** | −0.431 | −0.751 * | −0.712 * | -- | ||||||||
| MSC | 0.648 | 0.364 | 0.809 * | 0.846 ** | −0.942 ** | -- | |||||||
| RH-S | −0.036 | 0.801 * | 0.108 | −0.411 | −0.069 | 0.011 | -- | ||||||
| TA | 0.698 | −0.225 | 0.445 | 0.829 * | −0.691 | 0.676 | −0.644 | -- | |||||
| 8H | 0.668 | −0.107 | 0.442 | 0.875 ** | −0.721 * | 0.726 * | −0.599 | 0.978 ** | -- | ||||
| 9AB | 0.752 * | −0.212 | 0.478 | 0.665 | −0.676 | 0.595 | −0.567 | 0.939 ** | 0.915 ** | -- | |||
| 9UB | 0.674 | −0.295 | 0.239 | 0.615 | −0.492 | 0.446 | −0.664 | 0.874 ** | 0.821 * | 0.753 * | -- | ||
| 10AB | 0.784 * | −0.085 | 0.555 | 0.721 * | −0.794 * | 0.713 * | −0.443 | 0.926 ** | 0.905 ** | 0.970 ** | 0.688 | -- | |
| 10UB | 0.596 | −0.329 | 0.200 | 0.396 | −0.402 | 0.267 | −0.552 | 0.768 * | 0.704 | 0.900 ** | 0.575 | 0.848 ** | -- |
Disclaimer/Publisher’s Note: The statements, opinions and data contained in all publications are solely those of the individual author(s) and contributor(s) and not of MDPI and/or the editor(s). MDPI and/or the editor(s) disclaim responsibility for any injury to people or property resulting from any ideas, methods, instructions or products referred to in the content. |
© 2025 by the authors. Licensee MDPI, Basel, Switzerland. This article is an open access article distributed under the terms and conditions of the Creative Commons Attribution (CC BY) license (https://creativecommons.org/licenses/by/4.0/).
Share and Cite
Wang, Q.; Tian, L.; Zhang, H.; Zhang, D.; Wang, H.; Wang, L. Ecosystem Responses of Jerusalem Artichoke (Helianthus tuberosus L.) in Alpine Desert Environments in Northeastern Qinghai, Tibet Plateau, China. Agronomy 2025, 15, 615. https://doi.org/10.3390/agronomy15030615
Wang Q, Tian L, Zhang H, Zhang D, Wang H, Wang L. Ecosystem Responses of Jerusalem Artichoke (Helianthus tuberosus L.) in Alpine Desert Environments in Northeastern Qinghai, Tibet Plateau, China. Agronomy. 2025; 15(3):615. https://doi.org/10.3390/agronomy15030615
Chicago/Turabian StyleWang, Qiaoyu, Lihui Tian, Hongwei Zhang, Dengshan Zhang, Haijiao Wang, and Lihui Wang. 2025. "Ecosystem Responses of Jerusalem Artichoke (Helianthus tuberosus L.) in Alpine Desert Environments in Northeastern Qinghai, Tibet Plateau, China" Agronomy 15, no. 3: 615. https://doi.org/10.3390/agronomy15030615
APA StyleWang, Q., Tian, L., Zhang, H., Zhang, D., Wang, H., & Wang, L. (2025). Ecosystem Responses of Jerusalem Artichoke (Helianthus tuberosus L.) in Alpine Desert Environments in Northeastern Qinghai, Tibet Plateau, China. Agronomy, 15(3), 615. https://doi.org/10.3390/agronomy15030615