Article

Unveiling the Nutrient Signatures in Corn (Zea mays L.) Grains: A Pivotal Indicator of Yield Potential

1
Center of Excellence in Soil and Fertilizer Research in Africa (CESFRA), Mohammed VI Polytechnic University (UM6P), Benguerir 43150, Morocco
2
Department of Soil Science and Agrifood Engineering, Laval University, Quebec, QC G1V 0A6, Canada
3
AgroBioSciences (AgBS), Mohammed VI Polytechnic University (UM6P), Benguerir 43150, Morocco
*
Author to whom correspondence should be addressed.
Agronomy 2025, 15(3), 597; https://doi.org/10.3390/agronomy15030597
Submission received: 10 September 2024 / Revised: 11 October 2024 / Accepted: 14 October 2024 / Published: 27 February 2025

Abstract

:
The composition simplex (N, P, K, Ca, and Mg) of the leaf is the main score used by different approaches, like the Diagnosis and Recommendation Integrated System and Compositional Nutrient Diagnosis, to study nutrient interactions and balance in plant leaves. However, the application and validation of these concepts to grain composition remains unexplored. Contrary to foliar analysis’s early intervention for nutrient deficiency detection and correction, applying this approach to seeds assesses diverse cultivars’ potential, enabling anticipation of their adaptation to climate conditions and informed selection for future crops. In the present study, a collected database of more than 924 scores, including the grain yield (kg ha−1) and the nutrient composition (mg kg−1) of different corn varieties, is used to develop a novel nutrient-based diagnostic approach to identify reliable markers of nutrient imbalance. A ‘nutrient signature’ model is proposed based on the impact of the environmental conditions on the nutrient indices and composition (N, P, K, Ca, and Mg) of the corn grains. The yield threshold used to differentiate between low- and high-yielding subpopulations is established at 12,000 kg ha−1, and the global nutrient imbalance index (GNII) of 2.2 is determined using the chi-square distribution function and validated by the Cate–Nelson partitioning method, which correlated yield data distribution with the GNII. Therefore, the nutrient compositions were classified into highly balanced (GNII ≤ 1.6), balanced (1.6 < GNII ≤ 2.2), and imbalanced (GNII > 2.2). In addition, we found that the Xgboost model’s predictive accuracy for the GNII is significantly affected by soil pH, organic matter, and rainfall. These results pave the way for adapted agricultural practices by providing insights into the nutrient dynamics of corn grains under varying environmental conditions.

1. Introduction

Plant mineral nutrition depends on the complex association between nutrient composition, also known as plant nutrient signatures [1,2], genetics [3], and adaptation to environmental factors [4]. The comprehension of this complex interaction between genotype and environment is challenging due to the variation in soil composition at multiple scales, particularly as certain nutrients, such as some macronutrients, become less available in highly acidic conditions, which can affect crop yield [5]. Such studies are fundamental to developing reliable markers of nutrient imbalance and signatures [6]. Such studies not only deepen our understanding of plant mineral dynamics but also provide vital insights into optimizing plant health and productivity under varying conditions.
Tissue diagnosis is a promising way to assess the seed mineral status before its integration into agrosystems. This profiling can successfully address the antagonisms among the five essential nutrients, N, P, K, Ca, and Mg, which are highly absorbed by corn. Early seed diagnosis enables a comprehensive assessment of the plant’s physiological and nutritional state [7], and it has been investigated in several research disciplines, including plant ecology [4], plant physiology [8], functional genetics [9], and agronomy [10]. In addition to N, P, K, Ca, and Mg, the simplex can include other micronutrients, such as iron (Fe), zinc (Zn), and copper (Cu); thus, to study the balance concept for the mango (Mangiferaindica) based on the nutrient diagnosis, Parent et al. [11] targeted a simplex of eleven macro- and micronutrient ions (N, P, K, S, Ca, Mg, Fe, Mn, Zn, Cu, B).
The importance of macronutrient and trace element balances has been highlighted in different studies [12], and the yield-related foliar standards were established on date palm trees ‘Deglet Nour’ [13] based on nine nutrients (N, P, K, Ca, Mg, Fe, Mn, Zn, and Cu) and sweet corn based on N, P, and K [14]. The nutrient signature was also examined on the nutritional balance of animal feed rations as there is evidence of the direct effect of feed mineral composition on animal nutrition and growth [15]. According to Robbins et al. [16] and Dussutour et al. [17], changes in plant mineral composition significantly affect the diets of herbivores and omnivores.
Despite being extensively used on leaves, the nutrient signature related to yield has never been explored on the plant’s edible parts, such as grains, even though it is the most influential organ for this purpose.
In the present study, to establish a nutrient signature for the grains, the maize (Zea mays L.) was chosen as a model because of the accessibility of the data and its important contribution to the world’s food calories, with 19%, and the annual food crop protein production, with 15% [18]. It was also reported to have a highly nutrient-demanding yield compared to other cereal crops and considerable adaptation to various environmental conditions, including tropical, subtropical, and temperate regions [19]. A collected database of about 924 scores, including the grain yield (kg ha−1) and the nutrient composition (mg kg−1) of different corn varieties, was exploited to propose the ‘nutrient signature’ model based on the impact of the environmental conditions on the nutrient indices and composition (N, P, K, Ca, and Mg) of the corn grains. The establishment of this nutrient signature can serve as a reliable marker for predicting corn yield across specific agricultural, soil, and climatic conditions.

2. Materials and Methods

2.1. Theoretical Approach

As delineated by Khiari et al. ([14]), the commonly analyzed composition of plant tissue is represented as a five-dimensional nutrient arrangement. This configuration, known as a simplex (S5), encompasses six nutrient proportions, which include five essential nutrients supplemented by a ‘filling value’ to complete the model (Equation (1)). This filling value is integral to the arrangement, ensuring a comprehensive representation of the nutrient composition.
S 5 = ( N , P , K , Ca , Mg , R 5 ) :   N > 0 , P > 0 , K > 0 ,   Ca > 0 , Mg > 0 , R 5 > 0 ; N + P + K + Ca + Mg + R 5 = 1000
where 1000 is the dry matter concentration ‰; N, P, K, Ca, and Mg are nutrient proportions expressed in ‰ or g kg−1; and R5 is called the filling simplex and computed as follows (Equation (2)):
R 5 = 1000 ( N + P + K + Ca + Mg )
This R5 value contains unknown information on sulfur, micronutrients, carbohydrates, and other undetermined components; however, the nutrient diagnosis norms (NDNs) only cover the five known parts.
In this study, numerical information is condensed and represented by a generic term, G, which denotes the geometric mean of the various components, including N, P, K, Ca, and Mg nutrients, and the filling value R5 (Equation (3)). The research uses the geometric mean to explore potential interactions between known and unknown grain components.
G   = ( N × P × K × Ca × Mg × R 5   ) 1 6
To precisely define the newly introduced centered log ratio variables, designated as CLRx, we propose a method where each nutrient is quantitatively characterized in relation to a generalized term, denoted as ‘G’. This approach is systematically applied to dissect and quantify the intricate interrelationships among the constituents of the selected S5 simplex, which is employed to represent the overall nutrient balance accurately. This methodology facilitates a comprehensive understanding of each nutrient’s role and elucidates the complex interplay between different nutrients within the system. The mathematical formalism of the six interactions is summarized as follows (Equation (4)):
CLR N = ln ( N G ) ,   CLR P = ln ( P G ) , CLR K = ln ( K G ) , CLR Ca = ln ( Ca G ) , CLR Mg = ln ( Mg G ) , CLR R 5 = ln ( R 5 G )
And, by definition, we can verify that the sum of the six CLRx is equal to 0 (Equation (5)).
CLR N +   CLR P + CLR K + CLR Ca + CLR Mg +   CLR R 5 = 0
Khiari et al. ([14,20]) established that for the high-yield subpopulation, the average values of the following six centered log ratios are essential for defining tissue compositional norms: CLR*N, CLR*P, CLR*K, CLR*Ca, CLR*Mg, and CLR*R5. These standards should also encompass the standard deviations of the respective ratios for the entire surveyed population. Specifically, this includes SDN, SDP, SDK, SDCa, SDMg, and SDR5. These standard deviations are essential to understand the population’s tissue composition variability. The row-centered log ratios give rise to the NDN indices (Equation (6)), abbreviated as IN for nitrogen, IP for phosphorus, IK for potassium, ICa for calcium, IMg for magnesium, and IR5. These NDN indices provide a standardized measure for each nutrient, facilitating comparative analysis and interpretation within the dataset.
I N = CLR N CLR N * SD N   ,   I P = CLR P CLR P * SD P ,   I K = CLR K CLR K * SD K ,   I Ca = CLR Ca CLR Ca * SD Ca   ,   I Mg = CLR Mg CLR Mg * SD Mg ,   I R 5 = CLR R 5 CLR R 5 * SD R 5
We utilize these six nutritional indices to compute the global nutritional imbalance index (GNII). This computation follows Equation (7), which integrates these individual indices into a comprehensive measure of the general nutritional imbalance index.
GNII = I N 2 + I P 2 + I K 2 + I Ca 2 + I Mg 2 + I R 5 2
Based on principles of probability theory, the GNII conforms to a χ2 (chi-squared) distribution with 6 degrees of freedom. This adherence to the χ2 distribution is attributed to the GNII, which is a cumulative sum of the squares of six independent, centered-reduced normal distributions that corresponds to the nutritional indices IN, IP, IK, ICa, IMg, and IR5.
The establishment of the robust nutrient signature supported by the theoretical principles, specifically the χ2 distribution law, makes the GNII an important tool to understand the nutritional status of maize, considering its agropedoclimatic conditions and implications in genetic selection.

2.2. Data Extraction

The macronutrient composition, N, P, K, Ca, and Mg, of different maize grains were extracted from 12 specific published studies. The database was accessed between February 2022 and March 2022. The data search focused on selecting articles conducted under similar climatic conditions, examining their effects on the same nutritional composition and yield. Using the ‘WebPlotDigitizer’ (https://automeris.io/WebPlotDigitizer) URL (accessed on 1 February 2022), the collected database included 924 data points (Table 1) such as the country of study, precipitation levels, geographical coordinates, and the maize cultivar used.
The dataset was enriched with detailed soil properties, including the organic matter content expressed in g kg−1 and the soil pH level. Additionally, soil textural groups were classified according to the Canadian soil texture classification system [21], namely, fine texture (G1), encompassing heavy clay, clay, silty clay, clay loam, silt-clay loam, sandy clay, and sandy clay loam; medium texture (G2), comprising silt, silt loam, and loam; and coarse texture (G3), consisting of sandy loam, loamy sand, and sand. The spreadsheet also distinguishes between greenhouse and field conditions under which this study was conducted. These variables, including soil properties, cultivation conditions, and geographical factors, are treated as inputs in our analysis due to their influence on grain yield and the macronutrient composition (N, P, K, Ca, and Mg) in maize. Each research paper in our study investigates the impacts of various phenomena—such as soil amendments, fertilizer use, farming practices, and plant variety—on these macronutrient levels in maize. The studies also examine their effects on grain yield, quantified in kilograms per hectare (kg ha−1). Additionally, it is essential to note that grain yield and macronutrient composition data have been normalized to a standard moisture content of 15% for comparison consistency and accuracy.
Table 1. Comprehensive overview of international literature data: nutrient composition of maize grains—details by country, locality, geo-referenced location, rainfall (mm), cultivar, and number of data points for database construction.
CountryLocationGeoreferenced LocationRainfall (mm)CultivarnReferences
ThailandBangkok14°04′52.5″ N 100°36′52.8″ E1207Nakhon Sawan 390[22]
Bangkok14.0785° N, 00.6140° E1207Kakhon Sawan 3114[23]
Pakchong14.5 N lat, 101 E1207Suwan1/Laposta Sequia/KTX2602/DK888162[24]
BangladeshGazipur-Joydebpur24°30′0″ N and 92°3′0″ E1493BARIHybrid Bhutta-9162[25]
CanadaLower Onslow45°22′56.4″ N 63°23′25.1″ W1513CV.Sunnyvee/CV. Pride and joy36[26]
Québec46°46′43.3″ N 71°16′06.5″ W1513Pionneer 3893/Dekalb DK22172[27]
USAMississippi State University33°27′19.5″ N 88°47′39.7″ W1419Pioneer brand cv. 3223/Pioneer1 brand cv. 31G9848[28]
Delaware, Massachusetts, Maryland, New Jersey, and Pennsylvania40°53′10.0″ N 73°54′37.0″ W1090Pioneer Hybrid Brand 339412[29]
Columbus39°51′48.4″ N 83°40′19.6″ W9543312 Et72[24]
3377
3422
3624
3750
4550
ChinaShaanxi34–49 N 108 11 E750Zhengdan 958132[30]
Beijing116°11 N, 40–8 E 24[31]
Total points924

2.3. Procedural Steps for Establishing Nutrient Signatures in Corn Kernels

In this study, to establish standards and a nutrient signature for corn grains, we adopt the Compositional Nutrient Diagnosis (CND) model, as detailed in the theoretical section (Equations (1)–(7)) ([14,20]). It has been previously demonstrated that the CND system has better accuracy in diagnosing the nutritional status of plant leaves and species in comparison to the Diagnostic and Recommendation Integrated System (DRIS) ([32]). Leveraging the CND framework, we quantify the nutritional signature by developing the global nutrient imbalance index (GNII), a new index that assesses nutritional balance in corn kernels.
The GNII serves as a vital indicator of nutrient status, with its value inversely related to the potential yield and suitability for introduction into the receiving agrosystem. A higher GNII suggests lower usefulness and yield potential, whereas a lower GNII indicates higher yield potential. The formulation of the GNII is structured in three key stages. (i) Select of the high-yielding population (pop (+)) to establish the nutrient diagnosis norms (NDNs). (ii) Calculate the theoretical, critical value of the GNII or ‘theoretical chi-squared χ2′. (iii) Validate of this critical GNII value. These stages enable the categorization of nutrient signature values, which are crucial for characterizing and optimizing maize management practices within their respective agrosystems.

2.3.1. Identifying the High-Yielding Corn Subpopulation

The detailed methodology of Khiari et al. [32] was adopted in this important step to distinguish the high-yielding subpopulation (Pop+) from the low-yielding one (Pop−).
The procedure involves the computation of six cumulative variance functions corresponding to the six transformed elements: CLRN, CLRP, CLRK, CLRCa, CLRMg, and CLRR5. These functions are then correlated with their respective yields to establish cutoff points. We plotted a sigmoid curve for each element and applied a five-parameter Richard’s equation for the fit. Richard’s equation is known for its adaptability, suitability in empirical fitting scenarios, and effectiveness in highlighting inflection points.
The determination of these inflection points is crucial as they represent a change in the conical cavity, providing insight into sigmoidal behavior. This helps us precisely differentiate between the high-yielding and low-yielding subpopulations. The robustness of this fitting approach was validated through the coefficient of determination (R2), ensuring the reliability of the subpopulation segmentation. Seven key phases have been applied to distinguish between high-yielding (Pop+) and low-yielding (Pop−) subpopulations in corn.
  • Data organization. Arrange the dataset by descending grain yield.
  • Transformation application. Implement the centered log ratio (CLR) transformation on the six-element fractions of the simplex S5, namely, CLRN, CLRP, CLRK, CLRCa, CLRMg, and CLRR5.
  • Transformation verification. Confirm that the total of the transformed fractions equals zero.
  • Variance ratio calculation. Compute the log-centered variance ratio values for each CLRx.
  • Cumulative variance function derivation. Develop the cumulative variance ratio functions FCi for each CLRx.
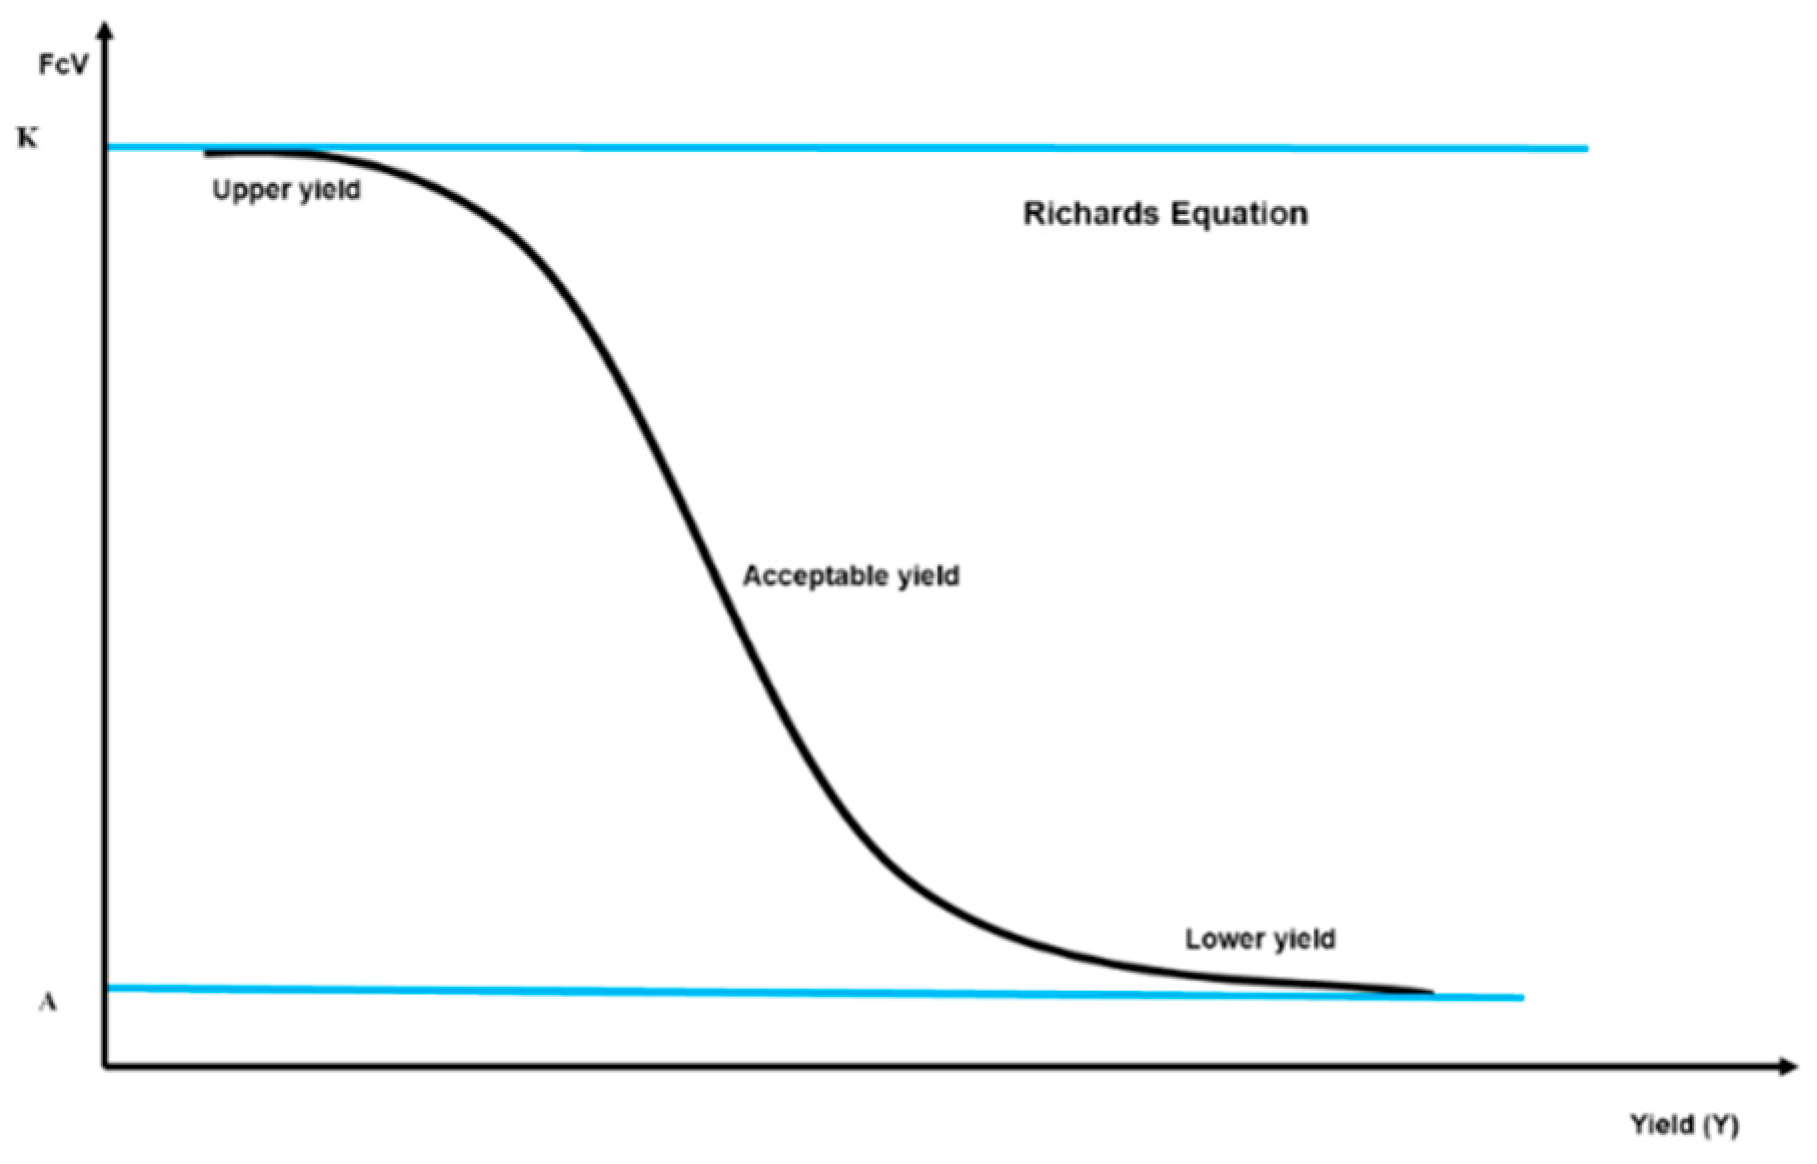
  • Yield variance correlation. Establish the correlation between the cumulative variance functions and grain yield, utilizing Richard’s equation.
  • Inflection point identification. Determine the inflection point for each element within the simplex. The mean of these inflection points across all macronutrients sets the yield threshold differentiating Pop+ from Pop−.

2.3.2. Calculating the Theoretical Global Nutrient Imbalance Index

The global nutrient imbalance index (GNII) is a comprehensive measure of crop nutrient disequilibrium calculated as the sum of the squared values of six individual indices: IN, IP, IK, ICa, IMg, and IR5. These indices are treated as a random, independent variable following a centered, normalized distribution. Consequently, the GNII adheres to a chi-square χ2 distribution with six degrees of freedom. This χ2 cumulative distribution function is utilized to transform the statistical value ‘p’, which represents the proportion of low-yielding (Pop−) observations in the total population into a critical chi-square threshold value ( χ Threshold ). For example, if the high-yielding subpopulation (Pop+) constitutes 30% of the total population, then ‘p’, denoting the 70% of the population that is less balanced regarding nutrients, marks the boundary beyond which the nutrient balance is considered statistically inadequate. By employing this chi-square distribution, we can determine the theoretical threshold for the GNII (GNIItheoretical), which is represented by the critical χ2 value or χ2threshold, as discussed in Khiari et al. [14]. This theoretical GNII value is instrumental in differentiating between balanced and imbalanced nutrient states in crop populations.

2.3.3. Validation of the Global Nutrient Imbalance Index Threshold
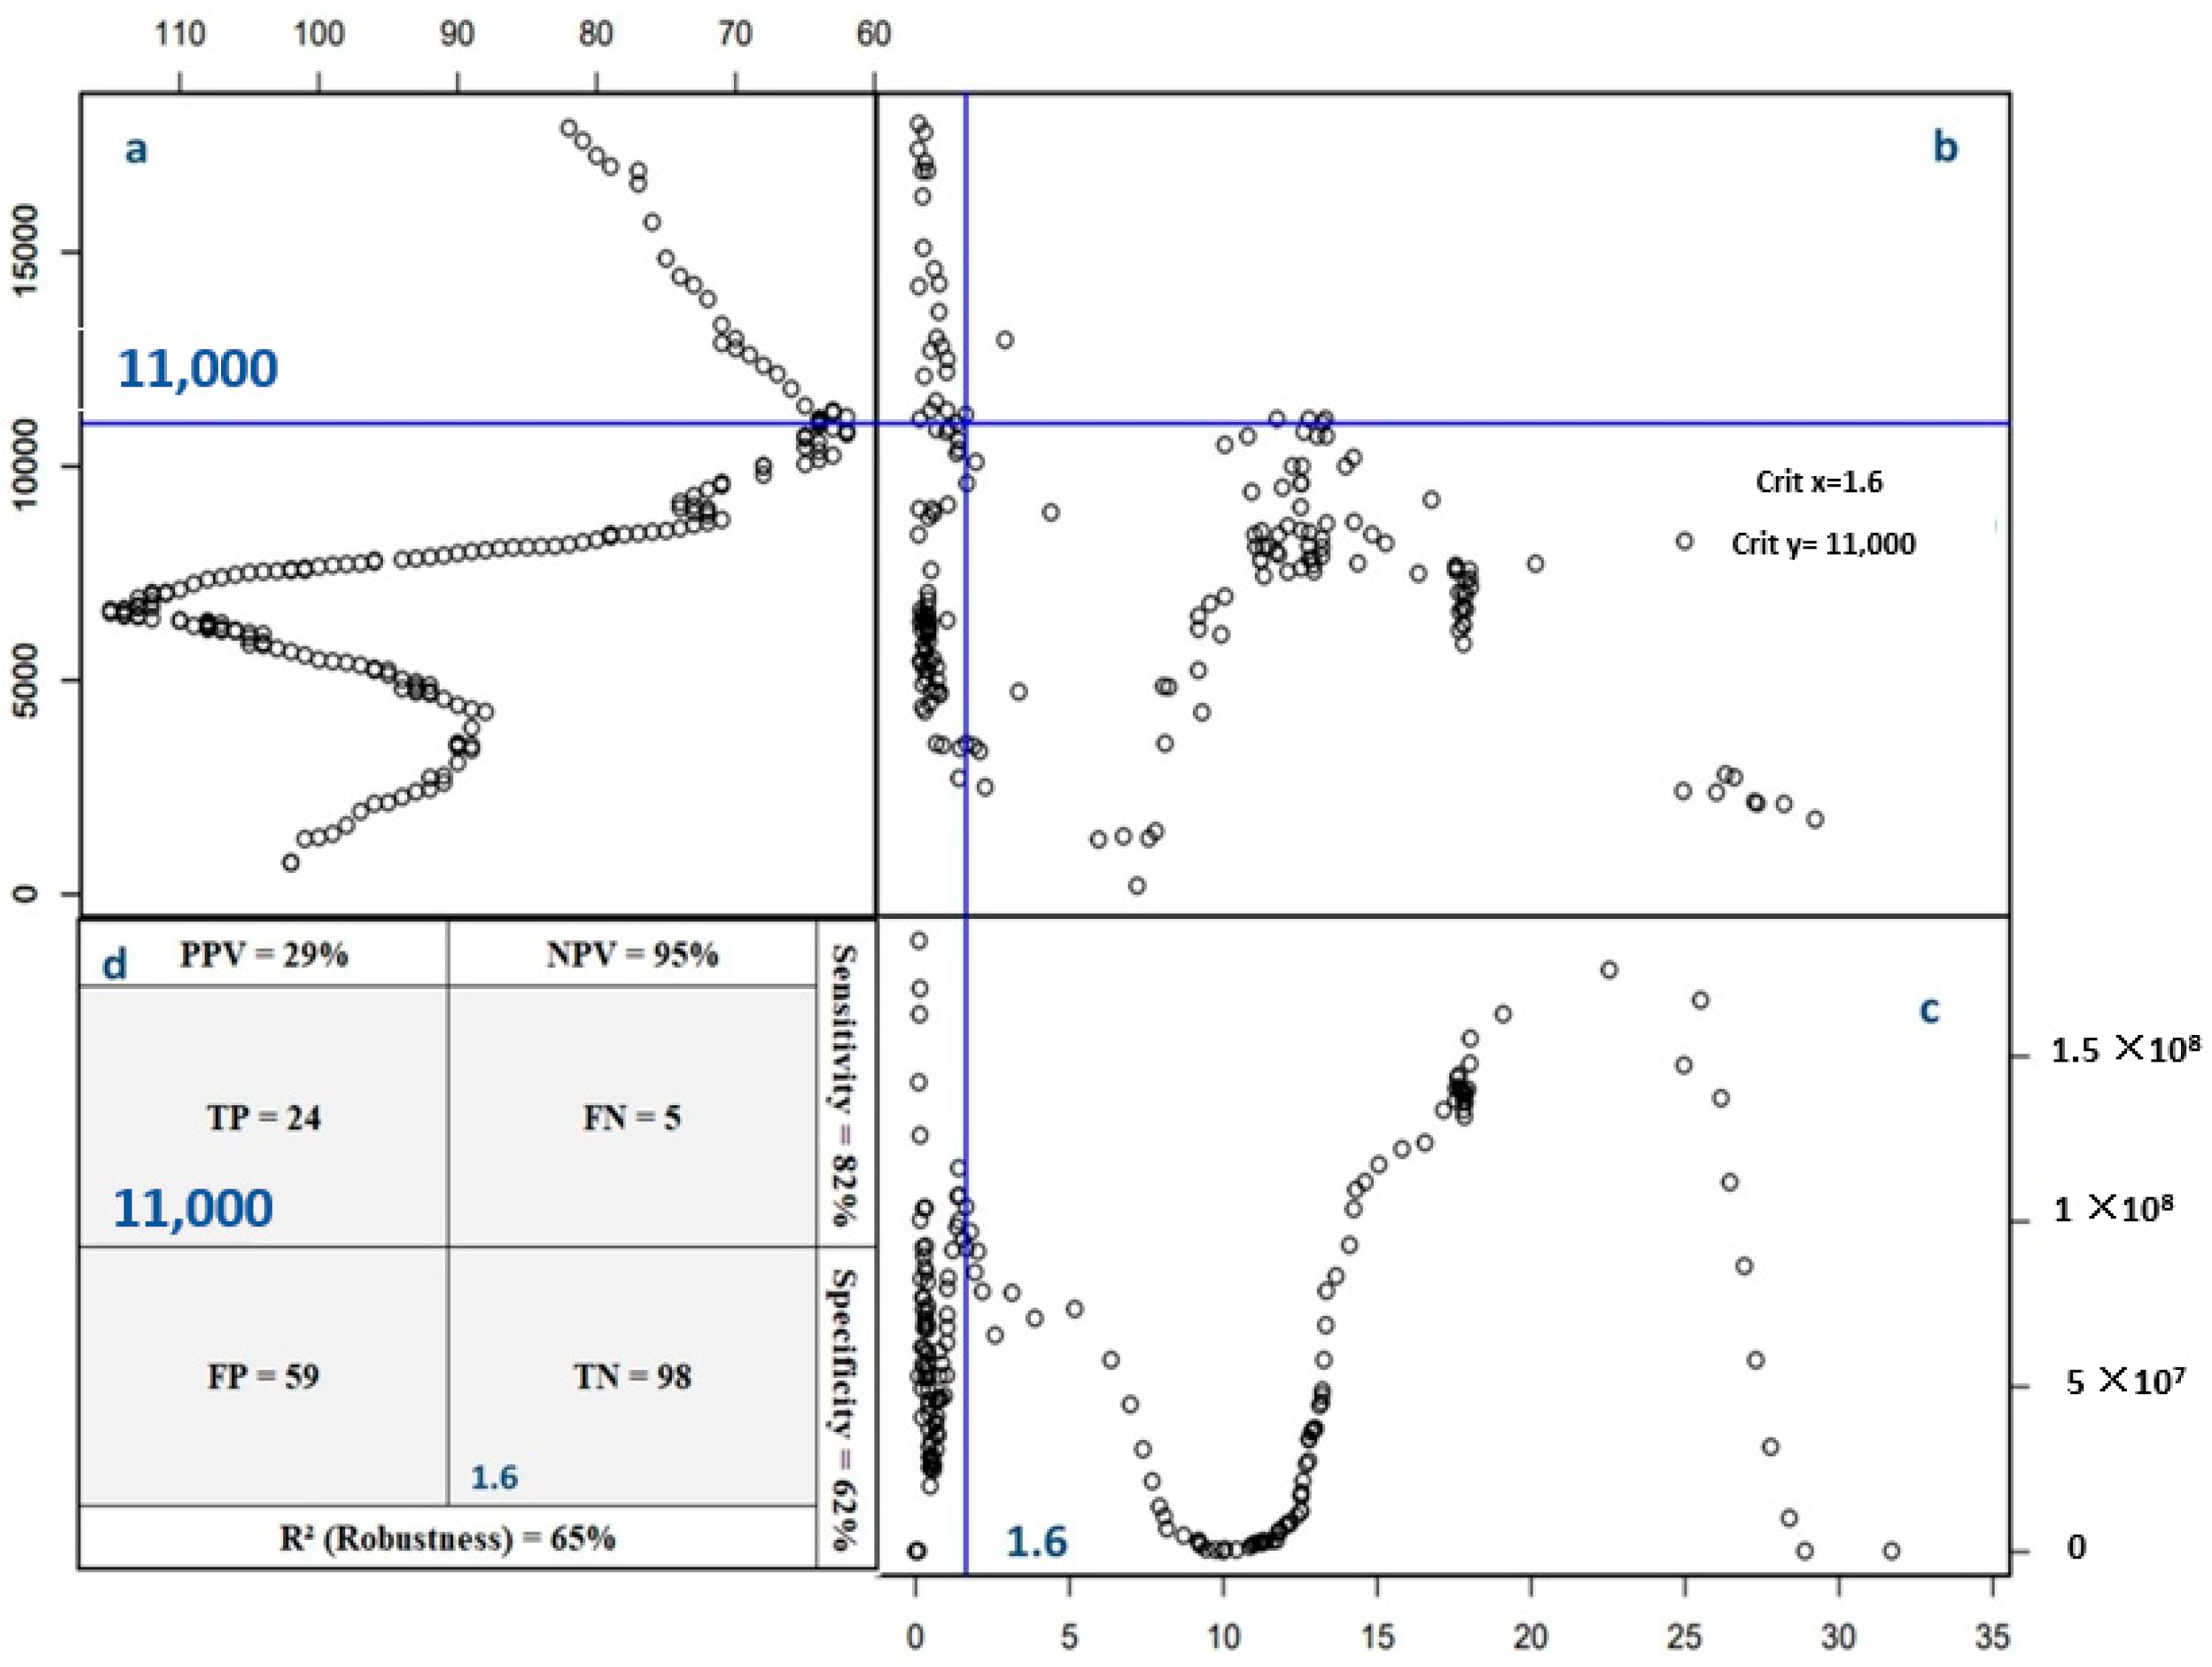
The validation process employs the Cate–Nelson two-group partitioning procedure applied to a two-dimensional diagram in which we apply the results from the identification of the high-yielding subpopulation (Pop+) and determine the theoretical GNII chi-square values. The diagram plots grain yield against the GNII, revealing critical intersecting values—a vertical line at the GNII value on the X-axis and a horizontal line at the gross corn yield on the Y-axis. This methodology successfully divides the studied population into four quadrants, each representing a different yield–GNII relationship: two quadrants for accurate predictions (VP: true positive, VN: true negative) and two for inaccuracies (FP: false positive, FN: false negative). Determining the yield threshold and validating the GNII value requires optimizing observations in the VP and VN quadrants while minimizing occurrences in the FP and FN quadrants. The effectiveness of Cate–Nelson partitioning is assessed by counting the number of data points in each of these four quadrantsm and its application in the present study is assessed using five key parameters.
  • Robustness (R2). Defined as R2 = TP + TN TP + TN + FP + FN × 100 , it measures the model’s overall accuracy in correctly identifying nutrient signatures. This represents the probability of making a correct diagnosis regarding the nutrient status.
  • Specificity. Calculated as TN TN + FP × 100 , specificity indicates the model’s ability to correctly identify cases of low yield potential when nutrient signatures exceed the critical threshold. It reflects the likelihood of accurately declaring a nutrient imbalance under conditions of poor yield.
  • Sensitivity. Given by TN TN + FP × 100 , this parameter represents the probability of correctly identifying high yield potential when nutrient signatures are below the critical threshold. It assesses the model’s effectiveness in detecting cases where the nutrient balance is favorable for high yields.
  • Positive predictive value (PPV). Defined as PPV = TP TP + FP × 100 , this metric estimates the likelihood of achieving good yield potential when the nutrient signature falls below the critical threshold.
  • Negative predictive value (NPV). Calculated as NPV = TN TN + FN × 100 , NPV denotes the probability of encountering lower yield potential when the nutrient signature exceeds the critical threshold.
These five parameters validate the GNII value and the yield threshold that differentiate the high-yielding subpopulation (Pop+) from the low-yielding subpopulation (Pop−), which reinforces the reliability of the nutrient signature and yield potential criteria for maize in the present study.

2.4. Statistical Analysis

The calculations for the nutrient diagnosis norms (NDNs) (Equations (1)–(7)) were performed using Microsoft Excel® 2010. Following the computation, we employed the Cate–Nelson method, which is known for its effectiveness in binary classification and is a critical step in this study. To implement this method, we utilize the ‘rcompanion’ package version 3.6.2 within R statistical software (RStudio-2022.07.1-554) [33].
In the present study, the Random Forest Regressor (RF) and Xgboost models of machine learning have been applied to unravel the complex factors influencing GNII prediction. The computational process was performed using Python 3.9.12, an interpreted programming language [34] for the implementation and the evaluation of RF and Xgboost models. The choice of these models was driven mainly by their ability to handle high-dimensional data and identify complex, non-linear relationships between variables. The RF Regressor, known for its performance in regression tasks, was pivotal in assessing the importance of various predictors in estimating the GNII. Meanwhile, Xgboost, a highly efficient implementation of gradient-boosted decision trees, offered a complementary approach with its handling of missing data and regularization capabilities to prevent overfitting. Through this analytical approach, this study sought to shed light on the critical determinants influencing the GNII. Understanding these key factors is crucial, as they play a significant role in dictating nutrient imbalances of the 5 essential nutrients (N, P, K, Ca, Mg), and consequently, the potential yield of crops.
To investigate the influence of the soil pH, soil organic matter (SOM), cultivar, rainfall, and country input variables on predicting the GNII for corn kernels, we utilized feature importance-based machine learning techniques to verify and validate reported findings. Utilizing feature selection methods has advantages, including that the model becomes more parsimonious, allowing for the reduction in efforts and resources required for data collecting, and that feature significance scores with feature selection give more accurate estimations [35].
The collected data were pre-processed and cleaned from inaccurate data, and then normalization was performed to establish distinct and dependable attributes. To ensure consistency and usability of the dataset, pre-processing and normalization steps were applied. First, categorical variables, specifically ‘Country’ and ‘Cultivar’, were transformed into numerical values using the OrdinalEncoder, assigning a unique integer to each category. This transformation was essential for the compatibility of categorical data with numerical analyses. Next, missing values were addressed through imputation using the KNNImputer with n_neighbors = 5n. This approach replaces missing data by averaging the values of the five nearest neighbors calculated based on Euclidean distance, thereby minimizing information loss while maintaining data coherence. After the pre-processing step, the data distribution was visualized to identify any correlations or patterns between the predictor variables (soil pH, soil organic matter (SOM), cultivar, rainfall, and country) and the response variable (GNII). The result showed significant patterns and associations that could help in understanding the impact of the input variables on the prediction of the GNII for corn kernels.
To calculate the importance score of each attribute, Xgboost and Random Forest algorithms have been compared to determine the best model. These two models have been commonly utilized in comparable studies and have demonstrated their effectiveness in feature importance analysis [36].
Thus, to evaluate the performance of the two models, the dataset was divided into a training dataset (70% of the observed data) and a testing dataset (30% of the observed data to validate the predictive abilities). The effectiveness of the two applied machine learning models was evaluated using statistical measures that include the following:
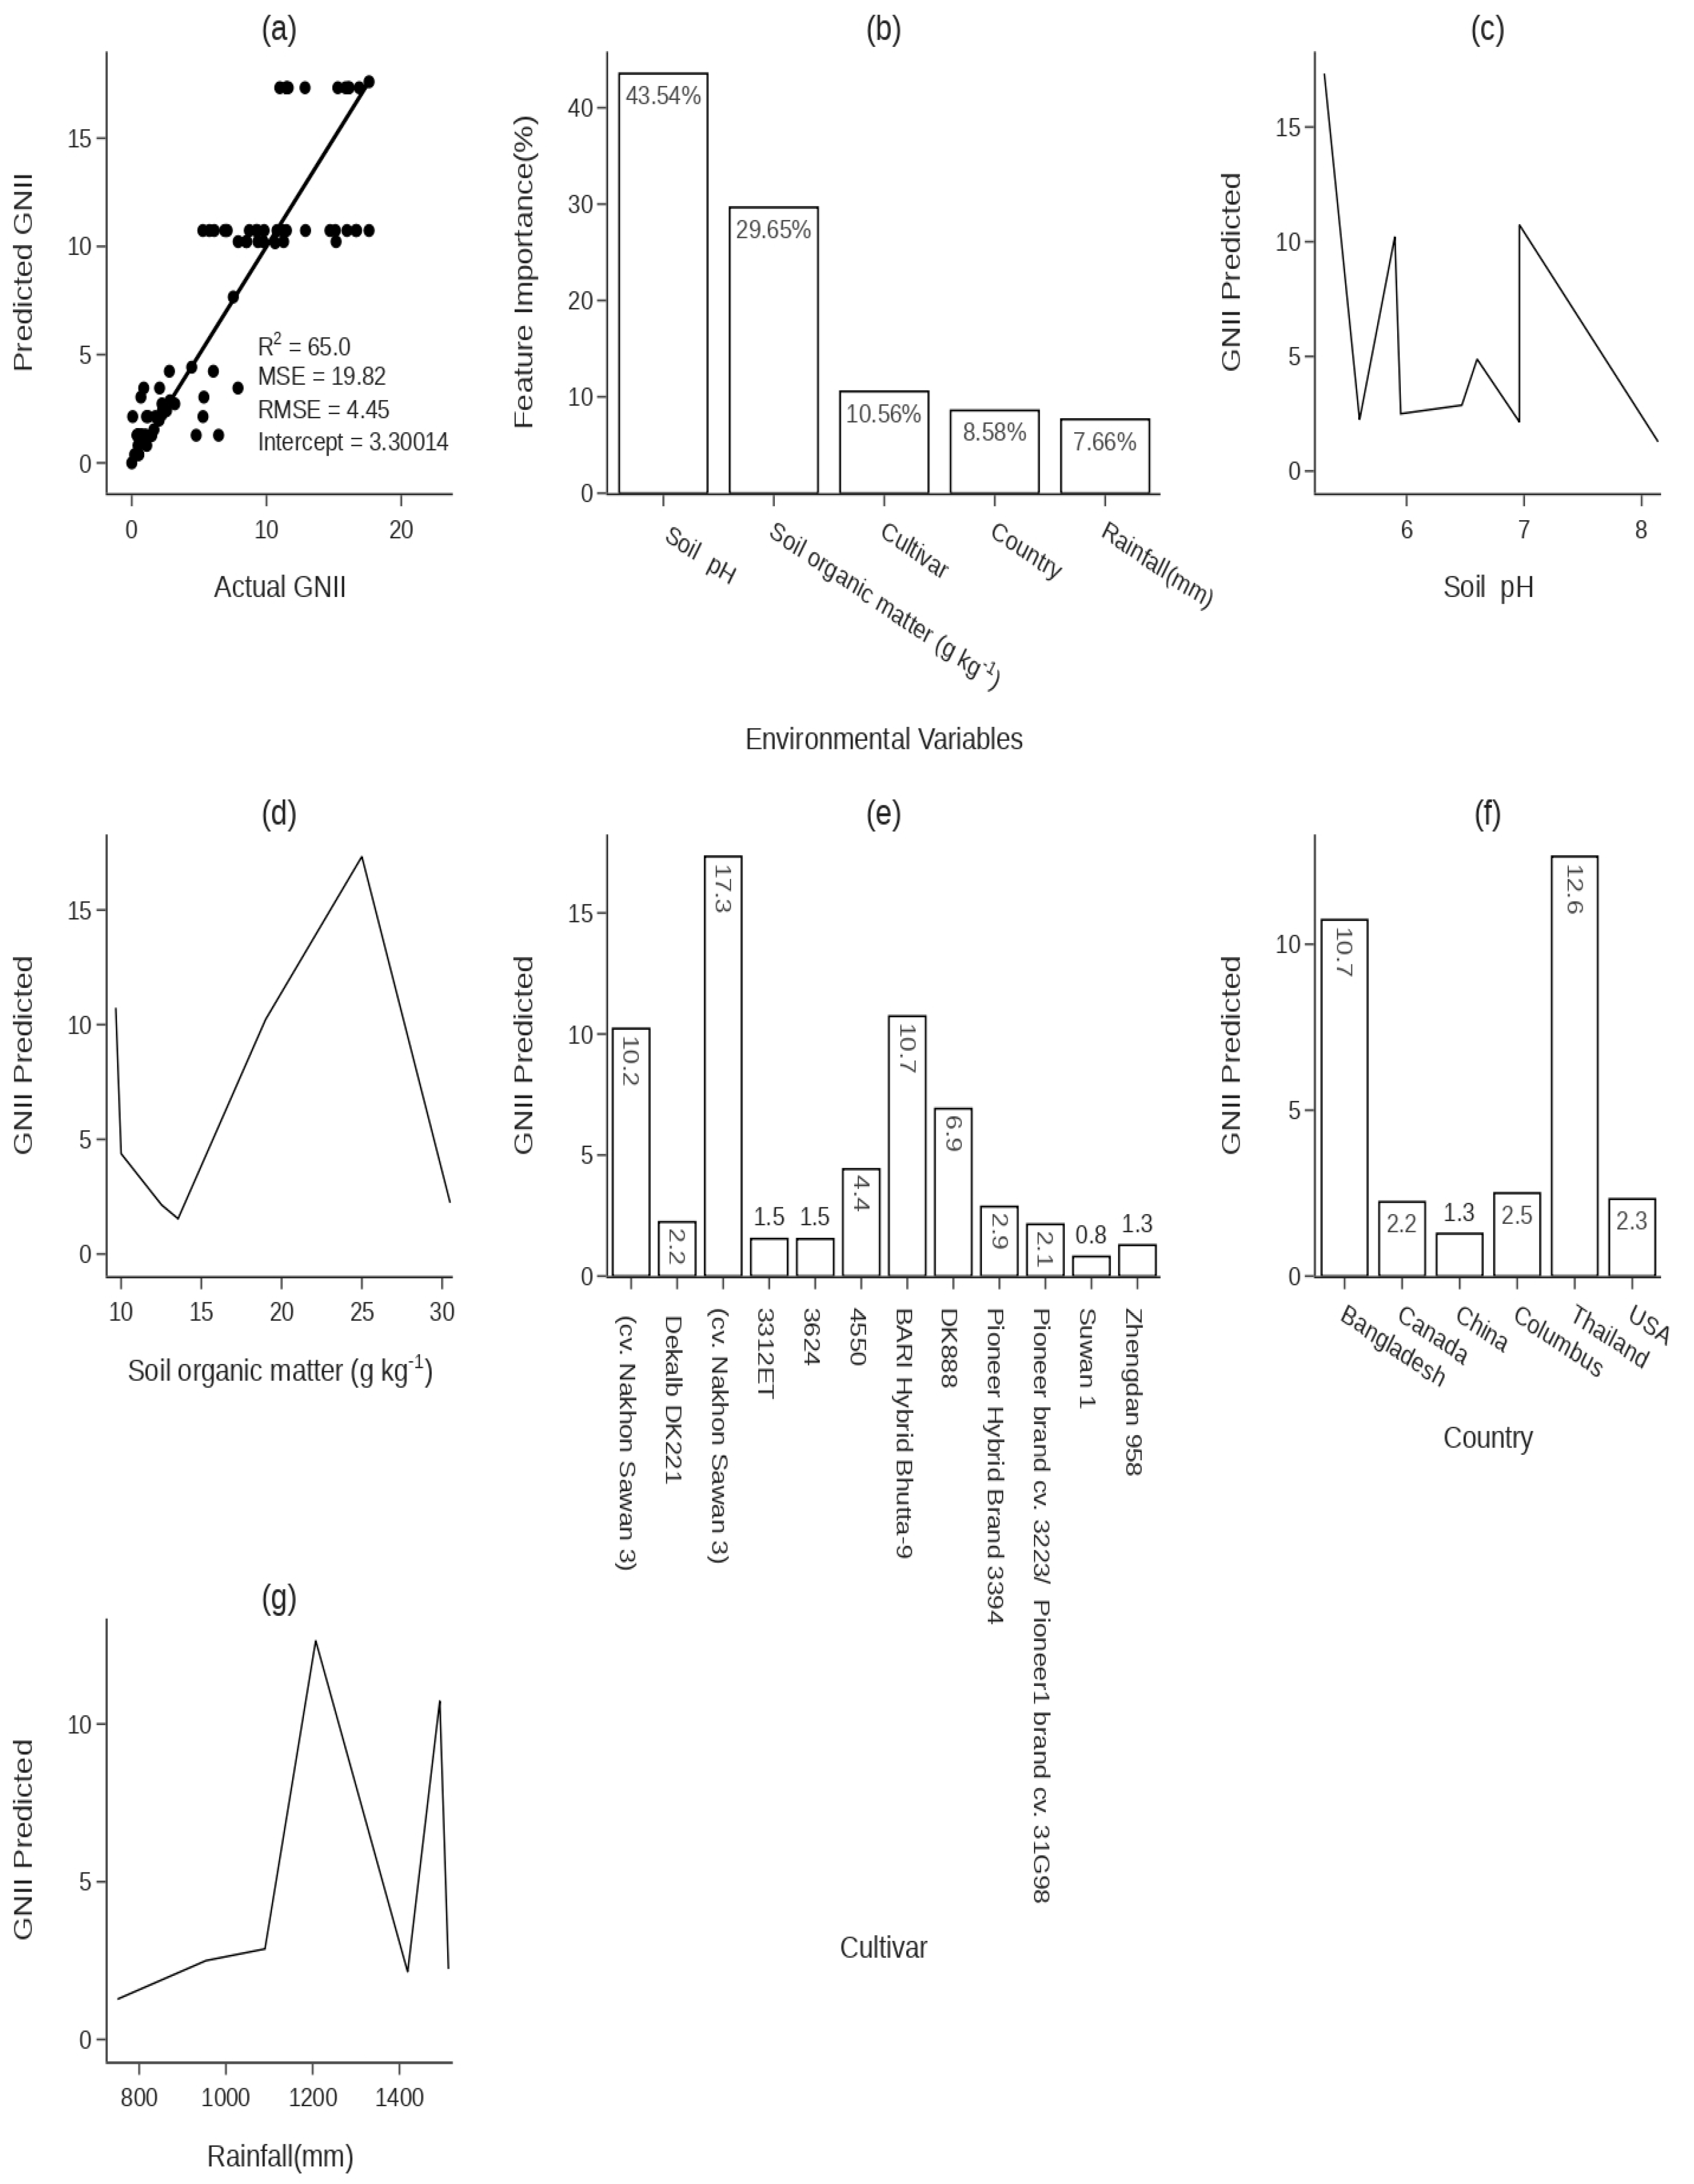
  • Robustness (R2). This metric, also known as the coefficient of determination, gauges the models’ ability to explain the variability in the GNII values. A higher R2 indicates a model with a greater explanatory power.
  • Accuracy (slope). We used the slope of the regression line between observed and predicted GNII values as a measure of model accuracy. An ideal model would have a slope of 1, indicating perfect predictions.
  • Sensitivity (intercept). The intercept of the regression line provides insights into the model’s sensitivity and reflects the inherent bias in the models, with an ideal intercept value being zero.
  • Root-Mean-Square Error (RMSE). The RMSE offers a clear indication of the prediction error magnitude. Lower RMSE values signify greater accuracy, as they indicate smaller deviations between predicted and actual GNII values.
To evaluate the significance and contribution of each predictor to GNII values, Scikit-Learn analysis has been applied to calculate the dependency score of each predictor, which reveals how much the model’s predictions rely on a particular variable. In addition, the feature importance aspect of these models, focusing on the training datasets, was used to help discern the relative importance of each input variable and provide valuable insights into their respective influences on the variation in corn kernel characteristics and GNII values.

3. Results

3.1. Selecting the High-Yielding Subpopulation from the Datasets

Richard’s equation was applied to fit sigmoidal curves with a sharp inflection point (Table 2). The correlation coefficients (R2 value) for these sigmoid fits ranged from 0.79 to 0.96, demonstrating a robust and reliable model fit. The six inflection points of the sigmoid curves, FCi (CLRN), FCi (CLRP), FCi (CLRK), FCi (CLRCa), FCi (CLRMg), and FCi (CLRR5), correspond to yield cutoff values that varied from 6564 to 15,172 kg ha−1, with an average of 11,956, which is close to 12,000 kg ha−1. This average yield cutoff of around 12,000 kg ha−1 was used as a limit to differentiate between the high-yielding and low-yielding maize populations. As this value will be considered as the limit beyond which we can speak of high-yielding subpopulations, diagnostic standards are consequently grounded in the average nutritional indices observed within the high-yielding subpopulation, surpassing the 12,000 kg ha−1 threshold. Based on this cutoff, we hypothesize that maize crops yielding above this threshold will demonstrate reduced variation in their nutrient diagnostic profiles, which implies that the yields superior to the established cutoff are associated with lower dispersion or variance in the nutrient diagnostics among these high-yielding crops. Essentially, as yield increases beyond this threshold, the consistency and predictability of nutrient status in the crops are expected to improve (Figure 1).
Figure 1. Yield Assessment through the Parameters of the Sigmoidal Richard’s Curve.
Agronomy 15 00597 g001
FcV ( y ) = a + K   +   A C + e B ( y M ) 1 v

3.2. Determining the Theoretical Threshold of the Global Nutrient Imbalance Index

The cutoff yield value of 12,000 kg ha−1 was used to classify 186 examined specimens into two distinct subpopulations: a productive subpopulation covering 19 specimens (10%) and a less productive subpopulation with 167 specimens (90%). This high prevalence in the less productive subpopulation indicates an unbalance in nutrient equilibrium or an elevated rejection rate of the nutrient balance. By employing the χ2 function with six degrees of freedom, this proportion of 90% yields a theoretical GNIItheoretical value of 2.2, which is of significant importance, as it offers valuable indications of potential nutritional imbalances within the studied population (Figure 2). When this nutrient signature exceeds the 2.2 GNII threshold, the specimen indicates an increased risk of nutritional imbalance and implies that the distribution pattern of the five nutrients in corn kernels may be inadequate, leading to reduced productivity.

3.2.1. Nutrient Imbalance Index Threshold Validation

By applying the Cate–Nelson partition method, a critical value of 11,000 kg ha−1 was identified, which corresponds to a GNII value of 1.6, allowing the splitting of the dataset into four quadrants (Figure 3). The four quadrants and their corresponding outcomes are (i) true positive (TP, n = 24), in which corn grains with high yields are correctly diagnosed with the global nutrient imbalance index (GNII). These grains exhibited high yields ≥ 11,000 g ha−1 and were accurately identified as nutrient balanced based on their GNII values ≤ 1.6, and (ii) true negative (TN, n = 98), in which corn grains with low yields are correctly diagnosed with the GNII. These grains had low yields of < 11,000 kg ha−1 and were accurately identified as having imbalanced nutrient compositions according to their GNII values > 1.6. (iii) False negative (FN, n = 5) is corn grains with high yields that are incorrectly diagnosed with the GNII. These grains had high yields ≥ 11,000 kg ha−1 but were mistakenly identified as having an imbalanced nutrient composition based on their GNII values > 1.6, when in fact, they were nutrient balanced. (iv) False positive (FP, n = 59) is corn grains with low yields that are incorrectly diagnosed with the GNII. These grains had low yields < 11,000 kg ha−1 but were wrongly identified as having nutrient balance based on their GNII values ≤ 1.6 when they had imbalanced nutrient compositions. The high limit of 11,000 kg ha−1 for corn grain yield was determined by minimizing the number of points in the error quadrants, which consist of FN and FP values. The combined points from these two quadrants reached a total of 64 out of the overall 186 points. The use of the GNII threshold, represented by the peak sum of squares (Figure 3c), enables a precise differentiation between balanced and imbalanced nutritional states, streamlining the identification of corn kernels with optimal nutrient composition and high yield potential. This classification is essential for making informed decisions on crop management and nutritional interventions to improve crop productivity and overall agricultural performance.
The proportion of points in the TP and TN quadrants compared to all points in the dataset measures the robustness of the Cate–Nelson procedure, which is expressed as = R2 with a calculated value of 65%. This value implies that 65% of the total population had a correctly identified balanced or imbalanced nutrient status, supporting the validity and reliability of the proposed Cate–Nelson model.
The positive predictive value (PPV) reflects the probability that a corn kernel is suitable for a balanced nutritional state with a GNII below 1.6. In this case, the PPV calculated value of 29% represents the chance that a corn kernel (GNII below 1.6) is balanced in terms of its nutritional status. Alternatively, PPV represents the proportion of true positives (correctly identified balanced kernels) out of all the grains placed as balanced by the model. With a PPV of 29%, the model has some limitations in accurately identifying truly balanced corn kernels, as there is a significant number of false positives (corn kernels identified as balanced but are unbalanced). Alternatively, the negative predictive value (NPV), which represents the probability of a low yield response to an imbalanced nutritional state of the grain (GNII > 1.6), was calculated at 95%, which represents the probability that a corn kernel (GNII greater than 1.6) will indeed show an imbalanced nutritional state and low yields.
Other parameters, such as sensitivity and specificity, have been calculated to evaluate the performance of the adapted Cate–Nelson model. The calculated sensitivity ([TP/(TP + FN)]) was 82%, which is the probability of making the right decision (GNII threshold) against all observations with a yield stability (yield cutoff). The calculated specificity of 62% represents the probability of lower corn grain yields with an imbalanced grain nutrient status (GNII > 1.6).
Figure 3c illustrates the fluctuation of the sum of squares, presenting an analysis of variance. It showcases a peak around 1.6, beyond which a transition occurs from significantly high yields to considerably low yields. This peak represents the optimal point to distinguish between a highly productive population and a less productive one. The validity of the yield cutoff value is supported by its nearness to the GNIITherotical value.
The 1.6 and 2.2 values enabled the classification of the specimens into three groups: a highly balanced composition where the GNII ≤ 1.6, a balanced range where 1.6 < GNII ≤ 2.2, and an imbalanced category where the GNII > 2.2.
These findings suggest that the variability observed in the Cate–Nelson four quadrants is intricately linked to the specimens under examination, displaying discernible variations attributed to environmental factors and the specific cultivar considered as a genetic factor. Soil pH, organic matter, and precipitation play crucial roles in plant growth and development, exerting a remarkable impact on specimen characteristics, as validated by the results of feature importance (Section 3.2.2). Furthermore, genetic variations among treated cultivars were identified as a significant contributor to the observed variability. Understanding the mechanisms that determine variability in plant attributes is critical to better understanding the ecological processes involved in their adaptation to environmental changes and guiding efforts to select the most adapted cultivars to the local conditions. Hence, each factor was studied from the most predictive variable to the lowest predictive one for the GNII.

3.2.2. Environmental Variables Affecting the Determination and Forecasting of the the GNII Value

The model’s performance was evaluated using a testing set, where the dataset was randomly split into training and testing subsets, with 30% of the data allocated to the testing set. This split enabled us to assess the model’s generalization to unseen data.
To predict GNII as a function of variables (soil pH, SOM, cultivar, rainfall, and country), Xgboost and Random Forest (RF) gave comparable results. Compared to RF (robustness (R2) = 60, Root-Mean-Square Error (RMSE) = 4.730, intercept = 8.70, and accuracy (slope) = 60%), the Xgboost model (robustness (R2) = 65%, Root-Mean-Square Error (RMSE) = 4.450, intercept = 3.30014, and accuracy (slope) = 70%)) was selected due to its performance, exhibiting an R2 and slope nearing 100%, while its intercept and RMSE are close to zero.
Figure 4b depicts each variable’s importance in the GNII prediction. We determined the sequence of influence from the obtained scores, revealing that the soil pH variable emerged as the most influential predictor in the GNII, with a dependence score of 41.59%. On the other hand, the rainfall and country variables exhibited the least impact, with dependence scores of 7.05% and 7.31%, respectively.
Soil pH plays a critical role in predicting the GNII values. The GNII values exhibit substantial variability within the pH range of 5.5 to 8.2, as demonstrated in Figure 4c. At a pH of 5, the GNII value exceeds 15, indicating a highly imbalanced nutritional profile. Furthermore, Figure 4c clearly illustrates a distinct decline in the GNII within the pH range of 6 to 6.5, suggesting a consistently low value. In this range, the population can be classified as having an excellent nutritional balance, with GNII values hovering around 2.2. Contrarily, GNII values exceeding 6.8 pH fall within a region marked by minimal yield and a notably unbalanced nutritional profile. This indicates that pronounced imbalances are prevalent under extreme conditions, specifically in highly acidic environments with a pH below 5.5, as well as in alkaline scenarios where the pH surpasses 6.8.
The variability in soil organic matter (SOM) also influences the variation in GNII values (Figure 4d). Based on frequency, the results mainly focus on three peaks corresponding to the following values of SOM: 9.67, 13.55, and 25 g kg−1. The first peak, observed at a value of 9.76 g kg−1, resulted in an imbalance index of approximately 12. This indicates a population with a highly imbalanced nutritional profile, highlighting a deficiency of SOM in establishing a nutritional balance. However, a slight increase in SOM to around 13.55 g kg−1 led to a decrease in the GNII below 2.5. This falls within the zone representing a population with a nutritional balance. Beyond this point, a second peak emerged at a SOM concentration of 25 g kg−1, leading to a GNII value exceeding 15. This indicates a significant nutritional imbalance. Another factor, according to the feature importance results, highlights how a cultivar significantly affects both production variability and the GNII (Figure 4e). Categorizing nutrient indices into distinct zones, such as highly balanced, balanced, and imbalanced, would be beneficial. This systematic classification could aid in effectively grouping cultivars. It would also provide insights into their yield responses and the GNII, facilitating a deeper understanding of their agricultural characteristics and performance. In the high-potential Class 1, cultivars like Suwan 1, Zhengdan 958, and 3312ET are notable for their low GNII values, which are below 1.6. This signifies a very balanced nutritional profile, as depicted in Figure 4e. Such a nutritional signature is invaluable for selecting the most suitable cultivars for specific agrosystems to ensure enhanced yields. Meanwhile, Class 2 comprises cultivars with balanced nutritive composition, including Dekalb DK221 and Pioneer brand cultivars cv. 3223 and 31G98, which are also illustrated in Figure 4e. The third category, identified as the imbalanced zone, is distinguished by a significantly unbalanced nutritional profile. This zone encompasses cultivars such as CV. Nakhon Sawan 3, 3624, 4550, BARI Hybrid Bhutta-9, and DK888. Each of these cultivars, as illustrated in Figure 4e, demonstrates characteristics that categorize them within this zone due to their less optimal nutrient balances. Recognizing these cultivars is crucial for understanding and managing their impact on agricultural outcomes. These classifications provide critical insights for informed cultivar selection in agricultural practices.
An additional crucial element in predicting GNII values is illustrated in Figure 4f, which presents the variation of GNII values across different countries. Notably, Bangladesh and Thailand display the highest GNII values, with scores of 12 and 11, respectively. This suggests that these nations predominantly cultivate nutritionally imbalanced corn varieties, starkly contrasting countries like the USA, Canada, and China. It is important to note that the nutritional balance of corn can significantly differ from country to country. Various factors, including climate, soil quality, farming practices, and genetic diversity, influence this variation. Understanding these nuances is essential for a comprehensive analysis of GNII values on a global scale. The predominant pedoclimatic factor influencing GNII values is rainfall, as illustrated in Figure 4g. This section underscores the critical role of rainfall variability in affecting GNII fluctuations. Notably, when rainfall is within the range of 750 to 1100 mm, the GNII values tend to be low, not surpassing 2, which is indicative of an excellent nutritional balance in the crops. Conversely, higher rainfall levels, specifically between 1200 and 1500 mm, are associated with two significant peaks in GNII values, approximately 11.28 and 13, respectively. These peaks are indicative of a high nutritional imbalance, highlighting the strong correlation between increased rainfall and nutrient imbalances in agricultural contexts.

4. Discussion

4.1. Selecting the High-Yielding Population from the Datasets

The implementation of the cumulative variance function facilitated the determination of a yield cutoff point of approximately 12,000 kg ha−1, resulting in the stratification of the population into a subpopulation exhibiting high yields and another subpopulation showing low yields. The yield data presented in the existing literature align closely with the outcomes derived from the application of Richard’s six equations. This congruence further substantiates the accuracy of the calculated average yield value, which stands at 12,000 kg ha−1. Such alignment validates the results obtained from the equations and underscores the reliability of the yield data reported in scholarly sources.
The degree of fluctuation in this critical yield metric differs significantly across countries. These variations in yield are primarily attributed to several key factors. These include the extent of fertilizer use, agricultural practices, the availability of new cultivar varieties in local markets, and varying climatic conditions, among others. Steinfeld et al. [37] provide further insights into these contributing elements, highlighting their substantial impact on yield variability in different geographical contexts. Bruns and Ebelhar [28] reported that in the United States, specifically in the Mississippi Delta region, the average grain yields have shown a notable increase, rising from 6000 to 8100 kg ha−1. This increase is attributed mainly to nitrogen application, recognized as the most critical macronutrient for maize grain yields. In the same context, Supasri et al. [38] observed in northern Thailand that maize yields experienced a 5.73% increase, coinciding with improved rainfall conditions during the maize growing season. Furthermore, international data suggest that global maize yields range between 8000 and 9000 kg ha−1. Some studies also noted that a yield is considered satisfactory when it exceeds the threshold of 10,000 kg ha−1.
However, the target yield mentioned earlier significantly surpasses the figures reported in previous studies. Khiari et al. [14] documented a yield of 6670 kg ha−1, while Magallanes-Quintanar et al. [39] noted a yield of 7000 kg ha−1 to categorize the high-yielding subpopulation of maize. This yield disparity might be attributed to the differences in achieving nutrient status stability. It is observed that maintaining a stable nutrient status in maize leaves is feasible at these lower yield levels. In contrast, achieving similar stability in seeds poses a greater challenge, which might explain the higher yield targets required for optimal nutrient status. Thus, it becomes evident that evaluating yield performance based on seed nutrient status is a more selective approach compared to leaf-based assessments. The underlying diagnostic goals for each method are distinct. Leaf diagnosis primarily aims to inform and optimize fertilization and supplementation practices. On the other hand, seed diagnosis focuses on evaluating the potential of a cultivar and its adaptability to the specific agrosystem in which it is cultivated. We can determine the best conditions to promote vigorous growth and maximize yields by focusing on seed characteristics. Seed selection provides a more direct insight into the potential yield of the plant, making it a valuable approach to crop improvement. The findings also revealed that grown cultivars considerably increased grain production. As different cultivars have been assessed in this study and each one adapts differently to pedoclimatic conditions, which vary from country to country, it is obvious to report the variability in yield between cultivars. Haut du formulaire.

4.2. Discussion of the Theoretical Aspects of the Nutrient Imbalance Index (GNIITheoretical)

Determining a critical value (GNII), approximately 2.2, for 90% of low-yielding subpopulations derived from the chi-square cumulative distribution function holds significant importance in comprehending the optimal nutrient balance required to achieve satisfactory yield.
Employing the same simplex S5 (N, P, K, Ca, and Mg) in their leaf analysis, Magallanes-Quintanar et al. [39] and Khiari et al. [14] identified that approximately 30–31% of the population was productive. This resulted in critical values ranging between 3.8 and 3.9 for the overall imbalance index. In contrast, when nutrient status is assessed in seeds, which is a more selective criterion, the proportion of the productive population is markedly reduced to only 10%. Consequently, this leads to a significantly lower theoretical GNII of 2.2.
The higher the critical yield value, the lower the proportion of the high-yielding subpopulation in the database, and the lower the theoretical imbalance value (GNII), the more likely the cultivar is to perform well in its specific agrosystem. Analysis of the major nutrient composition of maize seeds can, therefore, be used as a nutrient signature to predict the performance and yield potential of the cultivar in its environment. By enlarging the database and achieving more interesting levels of precision, this nutrient signature could easily be integrated into the list of genetic selection criteria for cultivars.
However, grains serve as nutrient sinks within the plant, prioritizing nutrient allocation to ensure reproductive success, even in cases of nutrient deficiency in other tissues. This storage and homeostasis mechanism is essential for plant survival, but it poses a limitation for diagnostic methods based solely on grain nutrient composition. For example, nutrients such as phosphorus, potassium, and certain micronutrients (like zinc and iron) are often concentrated in grains, even when deficiencies are present in other parts of the plant [40]. This preferential concentration in grains, or ‘sink effect’, can give a skewed picture of the plant’s overall nutritional status, particularly for macronutrients, like phosphorus, of which approximately 80% is located in the grains [41]. Furthermore, recent studies have shown that plants’ tendency to maintain stable nutrient levels in grains, even under nutrient-deficient conditions, is an evolutionary strategy aimed at ensuring reproduction and species survival ([40,41]). This behavior makes it challenging to rely solely on grain composition to diagnose the entire plant’s nutritional deficiencies. Consequently, GNII values derived solely from grain composition may overestimate the plant’s overall nutritional status. To address this limitation, it would be useful to supplement GNII assessments with measurements of the nutrient composition in non-reproductive tissues (leaves and stems), especially for nutrients that tend to accumulate in grains. When using the GNII as a diagnostic tool, it is essential to consider these limitations, as GNII values derived solely from grain composition may not fully reflect nutrient imbalances within the plant. This underscores the need for complementary evaluations or adjustments when using grain-based diagnostics, particularly for nutrients with a strong sink behavior in grains. These adjustments could include multi-organ diagnostic approaches, where nutrient concentrations are assessed in leaves and stems in addition to grains, as recommended by several researchers.

4.2.1. Understanding Critical Yields and GNII: A Discussion on Validation and Practical Implications

The application of Cate–Nelson partitioning served as a crucial step in validating the previously established metrics of critical yield and the GNII. This process revealed that a critical yield of 11,000 kg per hectare is less restrictive compared to the 12,000 kg per hectare threshold initially identified through the inflection points of Richard’s equations (as discussed in Section 3.1). Conversely, the critical GNII established at 1.6 proved to be more restrictive than the theoretical value of 2.2, which was determined based on the χ2 law (outlined in Section 3.2). This comparison highlights the nuances in defining critical yield and GNII values, demonstrating how different analytical methods can lead to comparable levels of restrictiveness in agricultural assessments. This validation process significantly bolsters the credibility of the nutrient signature method. It underscores its effectiveness and reliability as a tool for predicting good yield performance. Additionally, while the Cate–Nelson method provides a valuable theoretical foundation for the GNII, field trials in actual agricultural settings could significantly strengthen the model’s practical validity. Given the variety of environmental conditions and management practices represented in the literature, practical testing in commercial cultivation zones would offer essential insights into GNII’s diagnostic performance. Future studies should aim to conduct these field-based trials, allowing for a comprehensive assessment of GNII’s reliability and effectiveness as a diagnostic tool across diverse agricultural environments.
The successful validation confirms the accuracy of this approach and enhances confidence in its practical application for forecasting agricultural yields.
This emphasizes the significance of the cultivar–environment interaction in determining the high-yielding subpopulation and GNII levels. Bawa [42] showed, in a study conducted in Nigeria, a significant contribution of newly selected cultivars in increasing corn grain yield. Feil et al. [24] reported that the new cultivars could be associated also with corn grain nutrient composition changes. This highlights the impact of cultivars on the nutritional composition of corn grains. This concept of nutrient diagnosis is crucial in the investigation of the mineral composition of maize grain in response to physiological stimuli, developmental status, and genetic modifications, as was the case in the current study, where we examined various cultivars grown in various soil and climatic conditions.

4.2.2. Environmental Variables Affecting the Determination and Forecasting of the GNII Value

Our current understanding of the intricate interactions between genotype and environment in agriculture remains somewhat rudimentary. This is partly due to the vast and uneven diversity of soil compositions across various scales, as noted by Stein et al. [5]. Cescas [43] significantly contributed by identifying the optimal pH levels for maize cultivation specific to each soil textural group. For instance, the cultivar Cv. Nakhon Swan3, predominantly grown in Thailand on G1 textured soils, is best suited to pH values ranging from 5.1 to 5.5. Notably, this particular cultivar exhibits the highest GNII (gross nutrient input index) values and falls into Zone 3, which is characterized as a population with a highly imbalanced nutritional profile. This example underscores the importance of matching cultivar characteristics with specific environmental conditions for optimal agricultural productivity. Parent, L., and Gagné [21] highlight the importance of soil pH in maize cultivation, specifically stating that the optimal pH range for maize in texture group G1 is between 5.8 and 7. This finding underscores the critical role of soil pH in achieving high yields and confirms the need to consider soil type in agricultural planning. Soils with pH values ranging from 5.1 to 5.5 are categorized as highly acidic and generally less fertile. Pernes-Debuyser and Tessier [44] further reinforce this by demonstrating that lower soil pH levels correlate with increased soil instability. Parent, L., and Gagné [21] also note that soil acidity is a major environmental factor affecting seed performance, often leading to nutritional imbalances in seed composition. However, advancements in agronomy have shown promise. Researchers like Duque-Vargas et al. [45], Pandey and Gardner [46], and Bennet et al. [47] have successfully improved maize grain productivity in acidic soils by utilizing tolerant maize cultivars. Analyzing the nutrient signature of seeds across diverse pH conditions provides critical insights into the inhibitory impact of soil acidity on corn yields. In this study, the strong correlation between soil pH and GNII values underscores the significant role of pH in nutrient availability and plant uptake. Soil pH directly influences the solubility and accessibility of nutrients, impacting both macronutrients (such as phosphorus, which becomes less available in highly acidic or highly alkaline conditions) and micronutrients (such as iron and zinc, which are more readily available in acidic soils). Under acidic conditions, certain micronutrients are more soluble, thus facilitating plant uptake. However, excessively low or high pH can limit the absorption of essential nutrients, disrupting nutritional balance and impeding plant growth. Our findings demonstrate that the GNII is particularly sensitive to pH variations, reaffirming the crucial influence of this parameter on plant nutrition. This observation aligns with fundamental principles of soil chemistry, illustrating how pH conditions modify nutrient availability—an essential factor for optimizing soil fertility and crop yield. This GNII signature is influenced by a combination of genetic and environmental factors. By examining the GNII signature of seeds, we gain a comprehensive understanding of their adaptability to specific environmental conditions. Such analysis could prove invaluable as a strategic tool in genetic selection processes. It allows for the identification of cultivars that are not only genetically robust but also well-suited to the pH conditions of their intended growing environments, thereby optimizing yield potential. Numerous researchers have established a link between the impact of soil organic matter (SOM) and agricultural yield. However, few studies have focused on its effect on nutrient balance. Our study observed that when the SOM content is less than 11 g kg−1, it results in a marked nutritional imbalance, with a high GNII value reaching 16.
Conversely, an increase in SOM content beyond 11 g kg−1 significantly reduces the GNII value, falling below 1.6. This correlation between SOM and the GNII (illustrated in Figure 4d) is crucial for predicting the adaptability of seeds, depending on the organic matter richness of the receiving environment. The work of Kane et al. [48] supports these findings, recommending maintaining SOM content above 11 g kg−1 for the three soil texture groups (G1, G2, and G3). The connection between the GNII signature and soil organic matter content underscores agricultural advisors’ need to take proactive steps [49]. These measures should aim to increase the soil organic matter to at least the minimum required levels. Doing so is essential not only for maintaining nutrient balance but also for ensuring optimal crop yields. This approach highlights the critical role of soil management in achieving agricultural productivity.
Beyond soil characteristics, annual precipitation plays a significant role in determining nutrient balance. Rainfall levels between 400 mm and 1.060 mm are associated with the most favorable nutrient signatures, indicated by a GNII level not exceeding 4 (Figure 4g). However, nutrient signatures deteriorate when rainfall exceeds 1.060 mm, leading to a GNII value as high as 13. Such excessive precipitation promotes the leaching of essential nutrients, resulting in a marked imbalance, a scenario especially pertinent in tropical climates. Reinforcing this, Ritchie’s [50] model established a substantial link between variations in rainfall and their effects on maize yield, nutrient availability, and grain quality. Rusinamhodzi et al. [51] further highlighted that adopting conservation agriculture practices resulted in higher maize yields in conditions of average annual rainfall below 600 mm. In contrast, yields tended to decline in regions experiencing average annual rainfall exceeding 1000 mm.
By meticulously examining the relationship between rainfall patterns and the nutritional equilibrium of maize seeds, we can acquire valuable insights into how these climatic factors affect the composition of the grains. This understanding enables us to evaluate the adaptability of seeds to specific precipitation conditions. By comprehending the fluctuations in seed nutritional composition in response to varying rainfall levels, we can identify the optimal conditions for cultivating maize seeds that will exhibit exceptional performance. This approach empowers us to meticulously select seeds tailored to the unique rainfall characteristics of each environment, thereby maximizing crop yields and fostering sustainable agricultural practices. Therefore, it is crucial to understand the conditions in which the seed can perform optimally. As a result, the nutritional balance of maize varies by country due to a combination of climate, soil quality, farming practices, and genetic variables.

5. Conclusions

This study introduced an innovative approach by adapting a nutritional signature in maize kernels based on their content of five major nutrients: N, P, K, Ca, and Mg. This signature, termed the GNII, led to two pivotal findings. Firstly, we calibrated the GNII with yield data, and secondly, we explored the influence of environmental factors on nutrient balance using machine learning. Employing the cumulative variance function and Richard’s equations established a critical yield threshold of 12,000 kg per hectare, defining a productive subpopulation. Using the χ2 distribution law, we determined a critical GNII value of 2.2, below which the population is considered both productive and in nutrient equilibrium. The Cate–Nelson partitioning method validated these critical yields and GNII values. Based on this validation, we propose a classification for the nutrient signature: (i) very balanced when the GNII ≤ 1.6; (ii) balanced when 1.6 < GNII ≤ 2.2; and (iii) unbalanced when the GNII > 2.2. In examining how edaphic and climatic factors influence this signature through supervised learning, soil pH emerged as the most significant variable, with a 42% dependence score in signature prediction and a critical threshold of 5.5 for nutrient equilibrium. Soil organic matter (SOM), cultivar type, and rainfall also proved influential, with scores of 22%, 13%, and 12.7%, respectively. The database can be enriched with new data on grain corn to refine this nutrient signature further as a tool for cultivar and agrosystem selection. By incorporating more detailed parameters, such as rainfall distribution during the growing season, thermal units, cultivation practices, and trace elements in grains, the precision of this nutrient signature can be significantly enhanced. This advancement can potentially transform how cultivars are selected, ensuring they are optimally suited to their specific agrosystems. However, it should be noted that the absence of data from certain regions, particularly Europe and Africa, may limit the generalizability of our findings. Agricultural practices, environmental conditions, and nutrient profiles vary significantly across these regions, which could influence GNII outcomes. Thus, our results are primarily applicable to regions included in our dataset, and caution should be taken when extrapolating these findings globally. Future studies that incorporate data from a broader range of regions may help refine and enhance the applicability of the GNII.

Author Contributions

L.K., R.D. and N.I.; methodology: L.K. and N.I.; writing—original draft preparation: L.K. and N.I.; project administration, L.K.; writing—review and editing: L.K., R.D. and N.I.; Supervision: L.K. and R.D.; funding acquisition: L.K. All authors have read and agreed to the published version of the manuscript.

Funding

Funding was provided by the OCP-Africa-DAQARA project.

Data Availability Statement

The data presented in this study are available upon request from the corresponding author (The personal data were independently processed and systematically organized by the author after the data extraction phase).

Acknowledgments

This work is a key component of the DAQARA project, generously supported by OCP Africa.

Conflicts of Interest

The authors declare no competing interests.

References

  1. Willby, N.J.; Pulford, I.D.; Flowers, T.H. Tissue Nutrient Signatures Predict Herbaceous-Wetland Community Responses to Nutrient Availability. New Phytol. 2001, 152, 463–481. [Google Scholar] [CrossRef]
  2. Baxter, I. Should We Treat the Ionome as a Combination of Individual Elements, or Should We Be Deriving Novel Combined Traits? J. Exp. Bot. 2015, 66, 2127–2131. [Google Scholar] [CrossRef]
  3. Conn, S.; Gilliham, M. Comparative Physiology of Elemental Distributions in Plants. Ann. Bot. 2010, 105, 1081–1102. [Google Scholar] [CrossRef]
  4. Aerts, R.; Chapin, F.S. The Mineral Nutrition of Wild Plants Revisited: A Re-Evaluation of Processes and Patterns. In Advances in Ecological Reaserch; Academic Press: Cambridge, MA, USA, 1999; Volume 30, pp. 1–67. [Google Scholar]
  5. Stein, R.J.; Höreth, S.; de Melo, J.R.F.; Syllwasschy, L.; Lee, G.; Garbin, M.L.; Clemens, S.; Krämer, U. Relationships between Soil and Leaf Mineral Composition Are Element-Specific, Environment-Dependent and Geographically Structured in the Emerging Model Arabidopsis Halleri. New Phytol. 2016, 213, 1274–1286. [Google Scholar] [CrossRef]
  6. Debbarma, N.; Manivannan, S.; Muddarsu, V.R.; Umadevi, P.; Upadhyay, S. Ionome Signatures Discriminates the Geographical Origin of Jackfruits (Artocarpus heterophyllus Lam.). Food Chem. 2021, 339, 127896. [Google Scholar] [CrossRef]
  7. Asaro, A.; Ziegler, G.; Ziyomo, C.; Hoekenga, O.A.; Dilkes, B.P.; Baxter, I. The Interaction of Genotype and Environment Determines Variation in the Maize Kernel Ionome. G3 Genes Genomes Genet. 2016, 6, 4175–4183. [Google Scholar] [CrossRef]
  8. Baxter, I.R.; Vitek, O.; Lahner, B.; Muthukumar, B.; Borghi, M.; Morrissey, J.; Guerinot, M.L.; Salt, D.E. The Leaf Ionome as a Multivariable System to Detect a Plant’s Physiological Status. Proc. Natl. Acad. Sci. USA 2008, 105, 12081–12086. [Google Scholar] [CrossRef]
  9. White, P.J.; Brown, P.H. Plant Nutrition for Sustainable Development and Global Health. Ann. Bot. 2010, 105, 1073–1080. [Google Scholar] [CrossRef]
  10. Jaradat, A.A.; Goldstein, W. Diversity of Maize Kernels from a Breeding Program for Protein Quality III: Ionome Profiling. Agronomy 2018, 8, 9. [Google Scholar] [CrossRef]
  11. Parent, S.É.; Parent, L.E.; Egozcue, J.J.; Rozane, D.E.; Hernandes, A.; Lapointe, L.; Hébert-Gentile, V.; Naess, K.; Marchand, S.; Lafond, J.; et al. The Plant Ionome Revisited by the Nutrient Balance Concept. Front. Plant Sci. 2013, 4, 39. [Google Scholar] [CrossRef]
  12. Nicolas, O.; Charles, M.T.; Jenni, S.; Toussaint, V.; Parent, S.É.; Beaulieu, C. The Ionomics of Lettuce Infected by Xanthomonas Campestris Pv. Vitians. Front. Plant Sci. 2019, 10, 351. [Google Scholar] [CrossRef]
  13. Labaied, M.B.; Khiari, L.; Gallichand, J.; Kebede, F.; Kadri, N.; Ben Ammar, N.; Ben Hmida, F.; Mimoun, M. Ben Nutrient Diagnosis Norms for Date Palm (Phoenix dactylifera L.) in Tunisian Oases. Agronomy 2020, 10, 886. [Google Scholar] [CrossRef]
  14. Khiari, L.; Parent, L.-E.; Tremblay, N. Critical Compositional Nutrient Indexes for Sweet Corn at Early Growth Stage. Agron. J. 2001, 93, 809–814. [Google Scholar] [CrossRef]
  15. Felton, A.M.; Felton, A.; Raubenheimer, D.; Simpson, S.J.; Krizsan, S.J.; Hedwall, P.-O.; Stolter, C. The Nutritional Balancing Act of a Large Herbivore: An Experiment with Captive Moose (Alces alces L). PLoS ONE 2016, 11, e0150870. [Google Scholar] [CrossRef]
  16. Robbins, C.T.; Fortin, J.K.; Rode, K.D.; Farley, S.D.; Shipley, L.A.; Felicetti, L.A. Optimizing Protein Intake as a Foraging Strategy to Maximize Mass Gain in an Omnivore. Oikos 2007, 116, 1675–1682. [Google Scholar] [CrossRef]
  17. Dussutour, A.; Latty, T.; Beekman, M.; Simpson, S.J. Amoeboid Organism Solves Complex Nutritional Challenges. Proc. Natl. Acad. Sci. USA 2010, 107, 4607–4611. [Google Scholar] [CrossRef]
  18. Jiang, C.; You, Y.; Lai, X.; Zhang, Z.; Gao, W.; Ma, R.; Yang, X. Maximizing Food Equivalent Unit Yield for Forage Maize Production without Notably Compromising Dry Matter Yield and Feed Quality in a Semi-Arid Region. Ind. Crops Prod. 2024, 218, 118942. [Google Scholar] [CrossRef]
  19. Awata, L.A.; Tongoona, P.; Danquah, E.; Ifie, B.E.; Suresh, L.M.; Jumbo, M.B.; Marchelo-D, P.W.; Sitonik, A. Understanding Tropical Maize (Zea mays L.): The Major Monocot in Modernization and Sustainability of Agriculture in Sub-Saharan Africa. Ijaar 2019, 7, 32–77. [Google Scholar] [CrossRef]
  20. Khiari, L.; Parent, L.E.; Tremblay, N. The Phosphorus Compositional Nutrient Diagnosis Range for Potato. Agron. J. 2001, 93, 815–819. [Google Scholar] [CrossRef]
  21. Parent, L.; Gagné, G. Guide de Référence En Fertilisation; Quebec, 2010; Available online: https://www.craaq.qc.ca/Publications-du-CRAAQ (accessed on 9 September 2024).
  22. Sirisuntornlak, N.; Ullah, H.; Sonjaroon, W.; Arirob, W.; Anusontpornperm, S.; Datta, A. Effect of Seed Priming with Silicon on Growth, Yield and Nutrient Uptake of Maize under Water-Deficit Stress. J. Plant Nutr. 2021, 44, 1869–1885. [Google Scholar] [CrossRef]
  23. Sirisuntornlak, N.; Ullah, H.; Sonjaroon, W.; Anusontpornperm, S.; Arirob, W.; Datta, A. Interactive Effects of Silicon and Soil PH on Growth, Yield and Nutrient Uptake of Maize. Silicon 2020, 13, 289–299. [Google Scholar] [CrossRef]
  24. Feil, B.; Moser, S.B.; Jampatong, S.; Stamp, P. Mineral Composition of the Grains of Tropical Maize Varieties as Affected by Pre-Anthesis Drought and Rate of Nitrogen Fertilization. Crop Sci. Soc. Am. 2005, 45, 516–523. [Google Scholar] [CrossRef]
  25. Sarker, K.K.; Hossain, A.; Timsina, J.; Biswas, S.K.; Malone, S.L.; Alam, M.K.; Loescher, H.W.; Bazzaz, M. Alternate Furrow Irrigation Can Maintain Grain Yield and Nutrient Content and Increase Crop Water Productivity in Dry Season Maize in Sub-Tropical Climate of South Asia. Agric. Water Manag. 2020, 238, 106229. [Google Scholar] [CrossRef]
  26. Warman, P.R.; Havard, K.A. Yield, Vitamin and Mineral Contents of Organically and Conventionally Grown Potatoes and Sweet Corn. Ecosyst. Environ. 1998, 68, 207–216. [Google Scholar] [CrossRef]
  27. Tweddell, R.J.; Pelerin, S.; Chabot, R. A Two-Year Field Study of a Commercial Biostimulant Applied on Maize as Seed Coating. Can. J. Plant Sci. 2000, 80, 805–807. [Google Scholar] [CrossRef]
  28. Bruns, H.A.; Ebelhar, M.W. Nutrient Uptake of Maize Affected by Nitrogen and Potassium Fertility in a Humid Subtropical Environment. Commun. Soil Sci. Plant Anal. 2006, 37, 275–293. [Google Scholar] [CrossRef]
  29. Heckman, J.R.; Sims, J.T.; Beegle, D.B.; Coale, F.J.; Herbert, S.J.; Bruulsema, T.W.; Bamka, W.J. Nutrient Removal by Corn Grain Harvest. Agron. J. 2003, 95, 587–591. [Google Scholar] [CrossRef]
  30. Wang, J.; Wang, Z.; Mao, H.; Zhao, H.; Huang, D. Increasing Se Concentration in Maize Grain with Soil- or Foliar-Applied Selenite on the Loess Plateau in China. F. Crop. Res. 2013, 150, 83–90. [Google Scholar] [CrossRef]
  31. Chen, Q.; Mu, X.; Chen, F.; Yuan, L.; Mi, G. Dynamic Change of Mineral Nutrient Content in Different Plant Organs during the Grain Filling Stage in Maize Grown under Contrasting Nitrogen Supply. Eur. J. Agron. 2016, 80, 137–153. [Google Scholar] [CrossRef]
  32. Khiari, L.; Parent, L.-E.; Tremblay, N. Selecting the High-Yield Subpopulation for Diagnosing Nutrient Imbalance in Crops. Agron. J. 2001, 93, 802–808. [Google Scholar] [CrossRef]
  33. Of, J.; Education, A.; Learning, O.; Hampshire, N. Summary and Analysis of Extension Program Evaluation in R; Rutgers Cooperative Extension: New Brunswick, NJ, USA, 2016; Volume 10. [Google Scholar]
  34. Van Rossum, G.; Drake, F.L. Python/C API Manual—Python 3; CreateSpace: Scotts Valley, CA, USA, 2009. [Google Scholar]
  35. Westerveld, J.J.L.; van den Homberg, M.J.C.; Nobre, G.G.; van den Berg, D.L.J.; Teklesadik, A.D.; Stuit, S.M. Forecasting Transitions in the State of Food Security with Machine Learning Using Transferable Features. Sci. Total Environ. 2021, 786, 147366. [Google Scholar] [CrossRef]
  36. Svetnik, V.; Liaw, A.; Tong, C.; Christopher Culberson, J.; Sheridan, R.P.; Feuston, B.P. Random Forest: A Classification and Regression Tool for Compound Classification and QSAR Modeling. J. Chem. Inf. Comput. Sci. 2003, 43, 1947–1958. [Google Scholar] [CrossRef]
  37. Steinfeld, H.; Wassenaar, T.; Jutzi, S. Livestock Production Systems in Developing Countries: Status, Drivers, Trends. Rev. Sci. Tech. Off. Int. Epiz 2006, 25, 505–516. [Google Scholar] [CrossRef]
  38. Supasri, T.; Itsubo, N.; Gheewala, S.H.; Sampattagul, S. Life Cycle Assessment of Maize Cultivation and Biomass Utilization in Northern Thailand. Sci. Rep. 2020, 10, 3516. [Google Scholar] [CrossRef]
  39. Magallanes-Quintanar, R.; Valdez-Cepeda, R.D.; Olivares-Sáenz, E.; Pérez-Veyna, O.; García-Hernández, J.L.; López-Martínez, J.D. Compositional Nutrient Diagnosis in Maize Grown in a Calcareous Soil. J. Plant Nutr. 2006, 29, 2019–2033. [Google Scholar] [CrossRef]
  40. Fageria, N.K.; Baligar, V.C.; Li, Y.C. The Role of Nutrient Efficient Plants in Improving Crop Yields in the Twenty First Century. J. Plant Nutr. 2008, 31, 1121–1157. [Google Scholar] [CrossRef]
  41. Sun, X.; Ma, L.; Lux, P.E.; Wang, X.; Stuetz, W.; Frank, J.; Liang, J. The Distribution of Phosphorus, Carotenoids and Tocochromanols in Grains of Four Chinese Maize (Zea mays L.) Varieties. Food Chem. 2022, 367, 130725. [Google Scholar] [CrossRef]
  42. Bawa, A. Yield and Growth Response of Maize (Zea mays L.) to Varietal and Nitrogen Application in the Guinea Savanna Agro-Ecology of Ghana. Adv. Agric. 2021, 2021, 1765251. [Google Scholar] [CrossRef]
  43. Cescas, M.P. Interpretative Table of the Measurement of Hydrogen-Ion Concentration in Soils of Quebec Using Four Different Methods. Nat. Can. 1978, 105, 259–603. [Google Scholar]
  44. Pernes-Debuyser, A.; Tessier, D. Soil Physical Properties Affected by Long-Term Fertilization. Eur. J. Soil Sci. 2004, 55, 505–512. [Google Scholar] [CrossRef]
  45. Duque-Vargas, J.; Pandey, S.; Granados, G.; Ceballos, H.; Knapp, E. Inheritance of Tolerance to Soil Acidity in Tropical Maize. Crop Sci. 1994, 34, 50–54. [Google Scholar] [CrossRef]
  46. Pandey, S.; Gardner, C.O. Recurrent selection for popution, variety, and hybrid improvement in tropical maize. Adv. Agron. 1992, 48, 1–87. [Google Scholar]
  47. Bennet, R.J.; Breen, C.M.; Fey, M.V. Aluminium Toxicity and Induced Nutrient Disorders Involving the Uptake and Transport of P, K, Ca and Mg in Zea mays L. S. Afr. J. Plant Soil 1986, 3, 11–17. [Google Scholar] [CrossRef]
  48. Kane, D.A.; Bradford, M.A.; Fuller, E.; Oldfield, E.E.; Wood, S.A. Soil Organic Matter Protects US Maize Yields and Lowers Crop Insurance Payouts under Drought. Environ. Res. Lett. 2021, 16, 044018. [Google Scholar] [CrossRef]
  49. Williams, A.; Hunter, M.C.; Kammerer, M.; Kane, D.A.; Jordan, N.R.; Mortensen, D.A.; Smith, R.G.; Snapp, S.; Davis, A.S. Soil Water Holding Capacity Mitigates Downside Risk and Volatility in US Rainfed Maize: Time to Invest in Soil Organic Matter? PLoS ONE 2016, 11, e0160974. [Google Scholar] [CrossRef]
  50. Ritchie, I. Precipitation Impact on Crop Yield; University of Nebraska—Lincoln: Lincoln, NE, USA, 2021. [Google Scholar]
  51. Rusinamhodzi, L.; Corbeels, M.; Van Wijk, M.T.; Rufino, M.C.; Nyamangara, J.; Giller, K.E. A Meta-Analysis of Long-Term Effects of Conservation Agriculture on Maize Grain Yield under Rain-Fed Conditions. Agron. Sustain. Dev. 2011, 31, 657–673. [Google Scholar] [CrossRef]
Figure 2. Theoretical threshold determination of the global nutrient imbalance index (GNII) using the chi-square cumulative distribution function with 6 degrees of freedom (DFs).
Agronomy 15 00597 g002
Figure 3. Development of a diagnostic model for grain maize using the Cate–Nelson partition: key statistical indicators and model performance metrics—(a) analysis of points outside true quadrants for yield threshold deduction; (b) yield distribution patterns relative to GNII and identification of true quadrants (true positive and true negative); (c) determination of critical thresholds using the sum of squares of GNII; (d) summary table illustrating the number of points across quadrants and associated model performance probabilities: robustness, negative predictive value (NPV), positive predictive value (PPV), specificity, and sensitivity.
Agronomy 15 00597 g003
Figure 4. Xgboost predictions and influential factors of the global nutrient imbalance index (GNII): (a) scatter plot comparing the predicted GNII vs. the actual GNII, (b) feature importance of predictors (%), (c) predicted GNII response to soil pH, (d) predicted GNII response to soil organic matter (SOM) in g kg−1, (e) predicted GNII variability across cultivars, (f) predicted GNII response across different countries, and (g) predicted GNII response to rainfall in mm.
Agronomy 15 00597 g004
Table 2. Parameter fitting using sigmoidal Richard’s curves for cumulative variance functions (FCI): determining critical yields at inflection points (yield-IP).
Characterizing the Sigmoidal Curve: Five Parameters of the Richard’s EquationFCi (CLRX)-IPYield-IP
FCi (CLRX)KAMBV%kg ha−1
FCi (CLRN) 1016.0210,7720.0003760.49258.612,659
FCi (CLRP) 1006.4510,9040.0002990.6457.112,395.5
FCi (CLRK) 93.66.1910,4710.0003730.63653.311,684.5
FCi (CLRCa) 105−2.1512,0000.0001860.55456.615,172
FCi (CLRMg) 89.510.747020.000480.29956.66563.5
FCi (CLRR5) 101−7.0416,6980.0002940.47153.513,261.5
FCi (CLRX): the cumulative variance ratio function (%) for the component X; K: the upper asymptote; A: the lower asymptote M: mean; B: the growth rate = 3 (lower yield, acceptable yield, and upper yield); C: typically takes a value of 1; V: affects near where asymptote maximum growth occurs >0; FCi (CLRX) -IP: the critical value of the cumulative variance ratio function (%) for the X component at the inflection point (IP); yield-PI: critical yield in kg ha−1 at the inflection point (IP); FCi (CLRN): cumulative variance ratio function for nitrogen; FCi (CLRP): cumulative variance ratio function for phosphorus; FCi (CLRK): cumulative variance ratio function for potassium; FCi (CLRCa): cumulative variance ratio function for calcium; FCi (CLRMg): cumulative variance ratio function for magnesium; and FCi (CLRR5): cumulative variance ratio function for the filling simplex value. The value in bold was chosen to discriminate between the productive and the less productive population.
Disclaimer/Publisher’s Note: The statements, opinions and data contained in all publications are solely those of the individual author(s) and contributor(s) and not of MDPI and/or the editor(s). MDPI and/or the editor(s) disclaim responsibility for any injury to people or property resulting from any ideas, methods, instructions or products referred to in the content.

