Article

Differences in Salinity Tolerance in Avena sativa and Avena nuda

1
Sichuan Zoige Alpine Wetland Ecosystem National Observation and Research Station, College of Grassland Resources, Southwest Minzu University, Chengdu 610041, China
2
Key Laboratory of the Alpine Grassland Ecology in the Three Rivers Region, Ministry of Education, Qinghai Academy of Animal Science and Veterinary Medicine, Qinghai University, Xining 810016, China
*
Author to whom correspondence should be addressed.
These authors contributed equally to this work.
Agronomy 2025, 15(3), 594; https://doi.org/10.3390/agronomy15030594
Submission received: 14 January 2025 / Revised: 18 February 2025 / Accepted: 26 February 2025 / Published: 27 February 2025
(This article belongs to the Section Plant-Crop Biology and Biochemistry)

Abstract

:
Both Avena sativa and Avena nuda, which are highly valued for their use in food and fodder, demonstrate considerable potential in the management of saline-alkali soils. This study aimed to establish a foundation for the selection of salt-tolerant oat cultivars by assessing the impact of varying salt concentrations (0, 50, 100, 150, and 200 mmol L−1) on agronomic traits, photosynthetic characteristics, physiological and biochemical properties, and leaf anatomical structures in both covered oat cultivars and naked oat cultivars. The measured parameters indicate the level of salt tolerance in Avena sativa and Avena nuda, which is influenced by both salt concentration and cultivar. Both Avena sativa and Avena nuda demonstrate strong adaptation to mild and moderate salt stress conditions. However, Avena sativa exhibits a significantly greater capacity to withstand severe salt stress compared to Avena nuda. Affinity function analysis ranked the cultivars’ salt tolerance as follows: ‘Qinghai 444’ > ‘Mengyan No. 1’ > ‘Baiyan No. 18’ > ‘Qingyin No. 3’. These results suggest that the selection of oat cultivars for salinity improvement should be tailored to the specific salinity levels present in different regions.

1. Introduction

Soil salinization poses a significant ecological challenge globally, impacting the sustainable development of agriculture. The total area of saline soil currently exceeds 108 hectares [1]. Approximately 20% of cropland and 33% of irrigated farmland are adversely affected by soil salinization [2]. Projections from the Food and Agriculture Organization of the United Nations (FAO) suggest that salinity could affect nearly 50% of the world’s agricultural land by 2050 [3]. Salt stress, a critical abiotic stressor, has emerged as a substantial barrier to agricultural development and food security worldwide [4,5]. Consequently, the screening and breeding of salt-tolerant crops have become essential strategies for the enhancement and utilization of saline lands [6].
Salt stress poses a significant threat to crop productivity, impairing physiological functions and leading to yield reductions or even crop failure. This abiotic stress manifests in several ways: Firstly, salt stress induces osmotic stress, where high salt concentrations hinder water uptake, delay seed germination, and lower germination rates and potential [7]. Secondly, it leads to ionic toxicity, compromising the structural integrity of plant cell membranes, increasing membrane permeability, and causing sodium ions to accumulate to toxic levels, disrupting the intracellular ion balance [8,9]. Sodium ion toxicity is a primary trigger for salt stress [10,11]. Excessive sodium accumulation can inhibit photosynthesis and physiological and metabolic activities, adversely affecting plant growth and development [12,13]. Similarly, high levels of chloride ions have been shown to lead to reduced chlorophyll levels and stomatal closure, which in turn can impair the efficiency of photosynthesis. Additionally, chloride ions can disrupt the integrity of cell membrane systems and the structural integrity of cellular organelles [14,15]. Thirdly, salt stress inhibits enzyme activity and sugar accumulation in plants. Studies have shown that salt stress can reduce the production of leaf primordia, decreasing leaf volume and total photosynthetic area, leading to reduced carbon assimilation, weakened enzymatic reactions, and decreased enzyme content and activity, ultimately affecting plant growth [12,16]. Plants have evolved adaptations to salt stress, such as reducing salt-exposed meristematic tissues and translocating excess salt ions to older leaves or specialized organs like salt glands and vesicles [17,18]. The root system, being in direct contact with the soil, employs the casparian strip and corky layer of the root endodermis as effective barriers against salt ion damage [19,20]. In leaves, salt ions can alter cellular osmotic potential, reducing leaf water potential, and plants can enhance water utilization by closing stomata and regulating water channel proteins [21].
Oat, a member of the Gramineae family, is a valuable annual plant serving as both food and forage [22]. Oats are categorized into two distinct types based on the presence or absence of a bran covering on their kernels: naked oats (Avena nuda), which are primarily cultivated in China, and covered oats (Avena sativa), the predominant cultivar in Europe and America [23]. These cereals hold a significant position in the advancement of animal husbandry both domestically and internationally, owing to their robust cold tolerance, salinity resistance, and adaptability to infertile soils, coupled with their substantial biomass and high nutritional value for feed [22]. In recent years, research into the salt tolerance of forage crops has garnered increased attention. The salt tolerance of oats is intricately linked to both varietal characteristics and salt concentration levels. Consequently, the development of oat cultivars that are high-yielding, high-quality, and possess robust stress resistance is of paramount importance for the sustainable advancement of the oat industry and the ecological environment [24]. Drawing on the insights from previous research, we formulated the hypothesis for the present study. It is posited that oats possess a degree of inherent salt tolerance, yet they remain susceptible to significant injury when subjected to high levels of salt stress. Furthermore, we hypothesize that the extent of salt tolerance is not uniform across different cultivars, suggesting that genetic variability plays a crucial role in determining the resilience of oats to saline conditions.
In this study, we utilized four oat cultivars—‘Qinghai 444’ (A. sativa), ‘Baiyan No. 18’ (A. nuda), ‘Mengyan No. 1’ (A. sativa), and ‘Qingyin No. 3’ (A. nuda)—as experimental materials to systematically compare and analyze the agronomic traits, physiological indicators, and anatomical structure changes under salt stress induced by NaCl. Our findings elucidated the response mechanisms of oats to salt stress and facilitated the screening of salt-tolerant germplasm.

2. Materials and Methods

2.1. Materials, Growth Conditions, Treatment, and Sampling

In this study, we used two covered oat cultivars and two naked oat cultivars: A. sativa cv. ‘Qinghai444’, A. nuda cv. ‘Baiyan No. 18’, A. sativa cv. ‘Mengyan No. 1’, and A. nuda cv. ‘Qingyin No. 3’. We meticulously selected seeds of uniform size that exhibited full and intact grains. These seeds were subjected to a sterilization process using a 4% hydrogen peroxide (H2O2) solution for a duration of 15 min. Following sterilization, the seeds were thoroughly rinsed with sterile distilled water to remove any residual sterilizing agent. Subsequently, the seeds were placed in an artificial climate chamber under controlled environmental conditions: a 16-h light and 8-h dark photoperiod, a day/night temperature cycle of 25 °C and 23 °C, respectively, and a relative humidity maintained at 52%. These conditions were optimized for seed germination. Upon successful germination, the resulting seedlings were cultivated using a hydroponic system. To assess their salt tolerance, the seedlings were exposed to varying concentrations of sodium chloride (NaCl) solutions, specifically at levels of 0, 50, 100, 150, and 200 mmol/L (mM), during their early growth stage. After a 7-day period of stress exposure (Figure 1), we proceeded to measure the agronomic traits of the plants as a means to evaluate their response to the saline conditions. Additionally, samples were collected for a comprehensive analysis of physiological indices, providing further insights into the plants’ salt tolerance mechanisms.

2.2. Agronomic Traits

In our study, we focused on four distinct oat cultivars subjected to varying salt concentrations. For each cultivar, a sample of five plants was chosen to assess several key morphological parameters, including plant height, flag leaf width, and stem thickness. These measurements were taken to evaluate the impact of salt stress on plant growth and development. To determine the biomass allocation, both aboveground and underground tissues were harvested from each selected plant. The aboveground fresh weight (AFW) was calculated by weighing the stems and leaves immediately after harvest. Similarly, the underground fresh weight (UFW) was obtained by weighing the roots after gently blotting the surface moisture with filter paper. Following the initial weighing, the plant materials were subjected to a standardized drying process to ascertain the dry weights. The stems, leaves, and roots were first placed in an oven set at 105 °C for 15 min to eliminate any residual moisture. Subsequently, they were transferred to a drying oven maintained at 80 °C for a period of 24 h to ensure complete dehydration. Once the samples reached a constant weight, indicative of thorough drying, they were reweighed to determine the aboveground dry weight (ADW) and underground dry weight (UDW), respectively.

2.3. Photosynthetic and Physiological Parameters

To assess the photosynthetic performance of the oat cultivars under various salt treatments, we quantified several key photosynthetic parameters in the leaves of the plants. Specifically, we measured the CO2 assimilation rate (net photosynthetic rate, μmol CO2 m−2·s−1), transpiration rate of water vapor (transpiration rate, mmol H2O m−2·s−1), stomatal conductance to water vapor (stomatal conductance, mol H2O m−2·s−1), and substomatal CO2 concentration (intercellular carbon dioxide concentration, μmol CO2 mol−1 air) using a portable photosynthesis measurement system [25], the LI-6800 (LI-COR, Lincoln, NE, USA).
In our investigation of the physiological responses to salt stress in oat cultivars, we meticulously quantified a range of biochemical markers. Chlorophyll content, a key determinant of photosynthetic capacity, was assessed through ethanol extraction [26]. Fresh leaf samples (After 7 days of salt stress treatment) were carefully collected and weighed using an electronic balance (Sartorius, BCE224i-1CCN, Goettingen, Germany) with an accuracy of 0.0001 g. A precise amount of 0.5 g of fresh leaf tissue was then transferred into a 10 mL centrifuge tube. Subsequently, 2 mL of 95% ethanol was added to the tube and the samples were macerated for 3 days in the dark. After the maceration period, the absorbance values of the extracts were measured (95% ethanol was used as a control) at wavelengths of 665 nm and 649 nm using a UV spectrophotometer (Agilent, CARY60, Santa Clara, CA, USA). The content of chlorophyll a, chlorophyll b, and total chlorophyll (mg·g−1 FW) was calculated based on the following equations [26,27]:
C a = 13.95 A 665 6.88 A 649 × V W f
C b = 24.96 A 649 7.32 A 665 × V W f
C t = C a + C b
Ca means the content of chlorophyll a,
Cb means the content of chlorophyll b,
Ct means the total chlorophyll content,
A665 means the absorbance value measured at a wavelength of 665 nm,
A649 means the absorbance value measured at a wavelength of 649 nm,
V means the volume of the extract,
Wf means the fresh weight of the sample.
To assess the level of lipid peroxidation, indicative of oxidative damage, we measured the malondialdehyde content using the thiobarbituric acid assay [28]. To determine the malondialdehyde (MDA) content, fresh leaf samples were weighed to an accuracy of 0.1 g using an analytical balance (Sartorius, BCE224i-1CCN, Goettingen, Germany) and transferred into a 20 mL centrifuge tube. Subsequently, 10 mL of 10% trichloroacetic acid was added to the tube. The leaf tissue was then homogenized using a chilled mortar and pestle to ensure uniform extraction. The homogenate was centrifuged (Thermo, Fresco 17, Bremen, Germany) at 4000 rpm for 10 min to separate the supernatant. Next, 2 mL of the supernatant was aspirated and transferred into a 10 mL centrifuge tube (Distilled water was used as a control). To this, 2 mL of 0.6% thiobarbituric acid was added. The mixture was then subjected to a reaction in a boiling water bath at 100 °C for 15 min. After the reaction, the mixture was quickly cooled to room temperature and centrifuged again at 4000 rpm for 10 min to remove any precipitates. The absorbance of the supernatant was measured at wavelengths of 450 nm, 532 nm, and 600 nm using a UV spectrophotometer (Agilent, CARY60, Santa Clara, CA, USA). The MDA content (μmol·g−1 FW) was calculated using the following formula [28,29]:
C m = [ 6.45 ( A 532 A 600 ) 0.56 A 450 ] × V W f
Cm means the content of malondialdehyde,
A532 means the absorbance value measured at a wavelength of 532 nm,
A600 means the absorbance value measured at a wavelength of 600 nm,
A450 means the absorbance value measured at a wavelength of 450 nm,
V means the volume of the extract,
Wf means the fresh weight of the sample.
The proline content, an osmolyte that accumulates in plants under stress and plays a role in osmotic adjustment, was quantified by the ninhydrin colorimetric method [30]. To determine the proline content, we weighed 0.1 g weight of fresh leaves (Sartorius, BCE224i-1CCN, Goettingen, Germany), cut and mixed them and transferred them to a 10 mL centrifuge tube. We added 5 mL of 3% sulfosalicylic acid and extracted the leaves in boiling water for 10 min. 2 mL of the supernatant was pipetted into a 20 mL centrifuge tube after cooling (Distilled water was used as a control), and 2 mL of glacial acetic acid and 3 mL of ninhydrin acid were added to the tube to develop the color. Heat in a boiling water bath for 30 min, cool to room temperature, and then add 5 mL of toluene to the centrifuge tube and shake well, and then take the upper layer of the extracted liquid and detect the absorbance value at 520 nm (Agilent, CARY60, Santa Clara, CA, USA). A standard curve was prepared using known concentrations of proline to determine the concentration of proline in the sample solution. The content of proline (μg·g−1 FW) was calculated according to the following formula [30,31]:
C p = C 0 × V t V 1 W f
Cp means the content of proline,
C0 means the concentration of proline,
Vt means the total volume of the extract,
V1 means the volume aspirated during the measurement,
Wf means the fresh weight of the sample.
Peroxidase activity, a key enzyme in the plant’s antioxidant defense system, was assayed using the guaiacol method [32]. To assess the activity of peroxidase (POD), fresh leaf samples were carefully weighed to an accuracy of 0.1 g using an analytical balance (Sartorius, BCE224i-1CCN, Goettingen, Germany). The leaf tissue was then cut into small pieces and transferred into a chilled mortar. An appropriate volume of 100 mM phosphate buffer (pH 7.0) was added to the mortar, and the tissue was ground thoroughly on ice to ensure uniform homogenization. The homogenate was subsequently transferred to a 10 mL centrifuge tube and centrifuged (Thermo, Fresco 17, Bremen, Germany) at 8000 rpm for 15 min at 4 °C to separate the supernatant, which served as the enzyme extract. The supernatant was carefully aspirated and set aside for further analysis. For the enzyme activity assay, 3 mL of the reaction solution (100 mM phosphate buffer + 10 mM guaiacol + 30% H2O2) was pipetted into a test tube. To this, 20 μL of the enzyme extract was added (An equal volume of phosphate buffer was added as a control). The mixture was quickly vortexed to ensure thorough mixing and then transferred into a cuvette. The change in absorbance at 470 nm was measured over a period of 3 min using a UV spectrophotometer (Agilent, CARY60, Santa Clara, CA, USA) in time-scan mode. The linear portion of the absorbance change was selected, and the change in absorbance per minute (ΔA470) was calculated. The change in optical density (OD) per minute was defined as one unit of enzyme activity (U). The activity of the POD enzyme (U·g−1 FW) was calculated using the following formula [32,33]:
A p = A 470 × V t W f × V 1 × T
Ap means the activity of peroxidase,
ΔA470 means the change in absorbance value over the reaction time,
Vt means the total volume of the extract,
Wf means the fresh weight of the sample,
V1 means the volume aspirated during the measurement,
T means the reaction time.
Lastly, the activity of superoxide dismutase, an enzyme critical for the dismutation of superoxide radicals, was determined using the aziridinium blue tetrazolium photoreduction method [31]. To assay the activity of superoxide dismutase (SOD), fresh leaf samples were weighed to an accuracy of 0.1 g using an analytical balance (Sartorius, BCE224i-1CCN, Goettingen, Germany). The leaf tissue was then cut into small pieces and transferred into a chilled mortar. Subsequently, 5 mL of 50 mM phosphate buffer (pH 7.8) was added to the mortar, and the tissue was ground thoroughly on ice to ensure uniform homogenization. The homogenate was transferred to a 10 mL centrifuge tube and centrifuged (Thermo, Fresco 17, Bremen, Germany) at 10,000 rpm for 15 min at 4 °C to separate the supernatant, which served as the enzyme extract. The supernatant was carefully aspirated and set aside for further analysis. For the SOD activity assay, a reaction solution was prepared by mixing the following components in a 10 mL test tube: 1.5 mL of 50 mM phosphate buffer (pH 7.8), 0.3 mL of 130 mM methionine solution, 0.3 mL of 750 µM aziridine blue tetrazolium solution, 0.3 mL of 100 µM EDTA-Na2 solution, 0.3 mL of 100 µM riboflavin solution, 0.5 mL of distilled water. A volume of 3.2 mL of this reaction solution was pipetted into a test tube, and 100 µL of the enzyme extract was added (Two test tubes with equal volumes of phosphate buffer instead of enzyme extract were used as controls). The mixture was quickly vortexed to ensure thorough mixing. One control tube was placed in the dark, while the other tubes were placed in an artificial climate chamber (Ningbo Jiangnan, RXZ-1500B, Ningbo, China) set at a light intensity of 4000 lx and a temperature of 30 °C for 25 min. At the end of the reaction period, the unilluminated control tube was used as a blank. The absorbance values of the other tubes were measured at 560 nm using a UV spectrophotometer (Agilent, CARY60, Santa Clara, CA, USA). The activity of the SOD enzyme (U·g−1 FW) was calculated using the following formula [31,33]:
A s = ( A C K A S ) × V t 0.5 × A C K × W f × V 1
As means the activity of superoxide dismutase,
ACK means the absorbance value of the illuminated control tube with buffer instead of enzyme solution,
AS means the sample tube absorbance value,
Vt means the total volume of the sample enzyme solution,
Wf means the fresh weight of the sample,
V1 means the volume aspirated during the measurement.

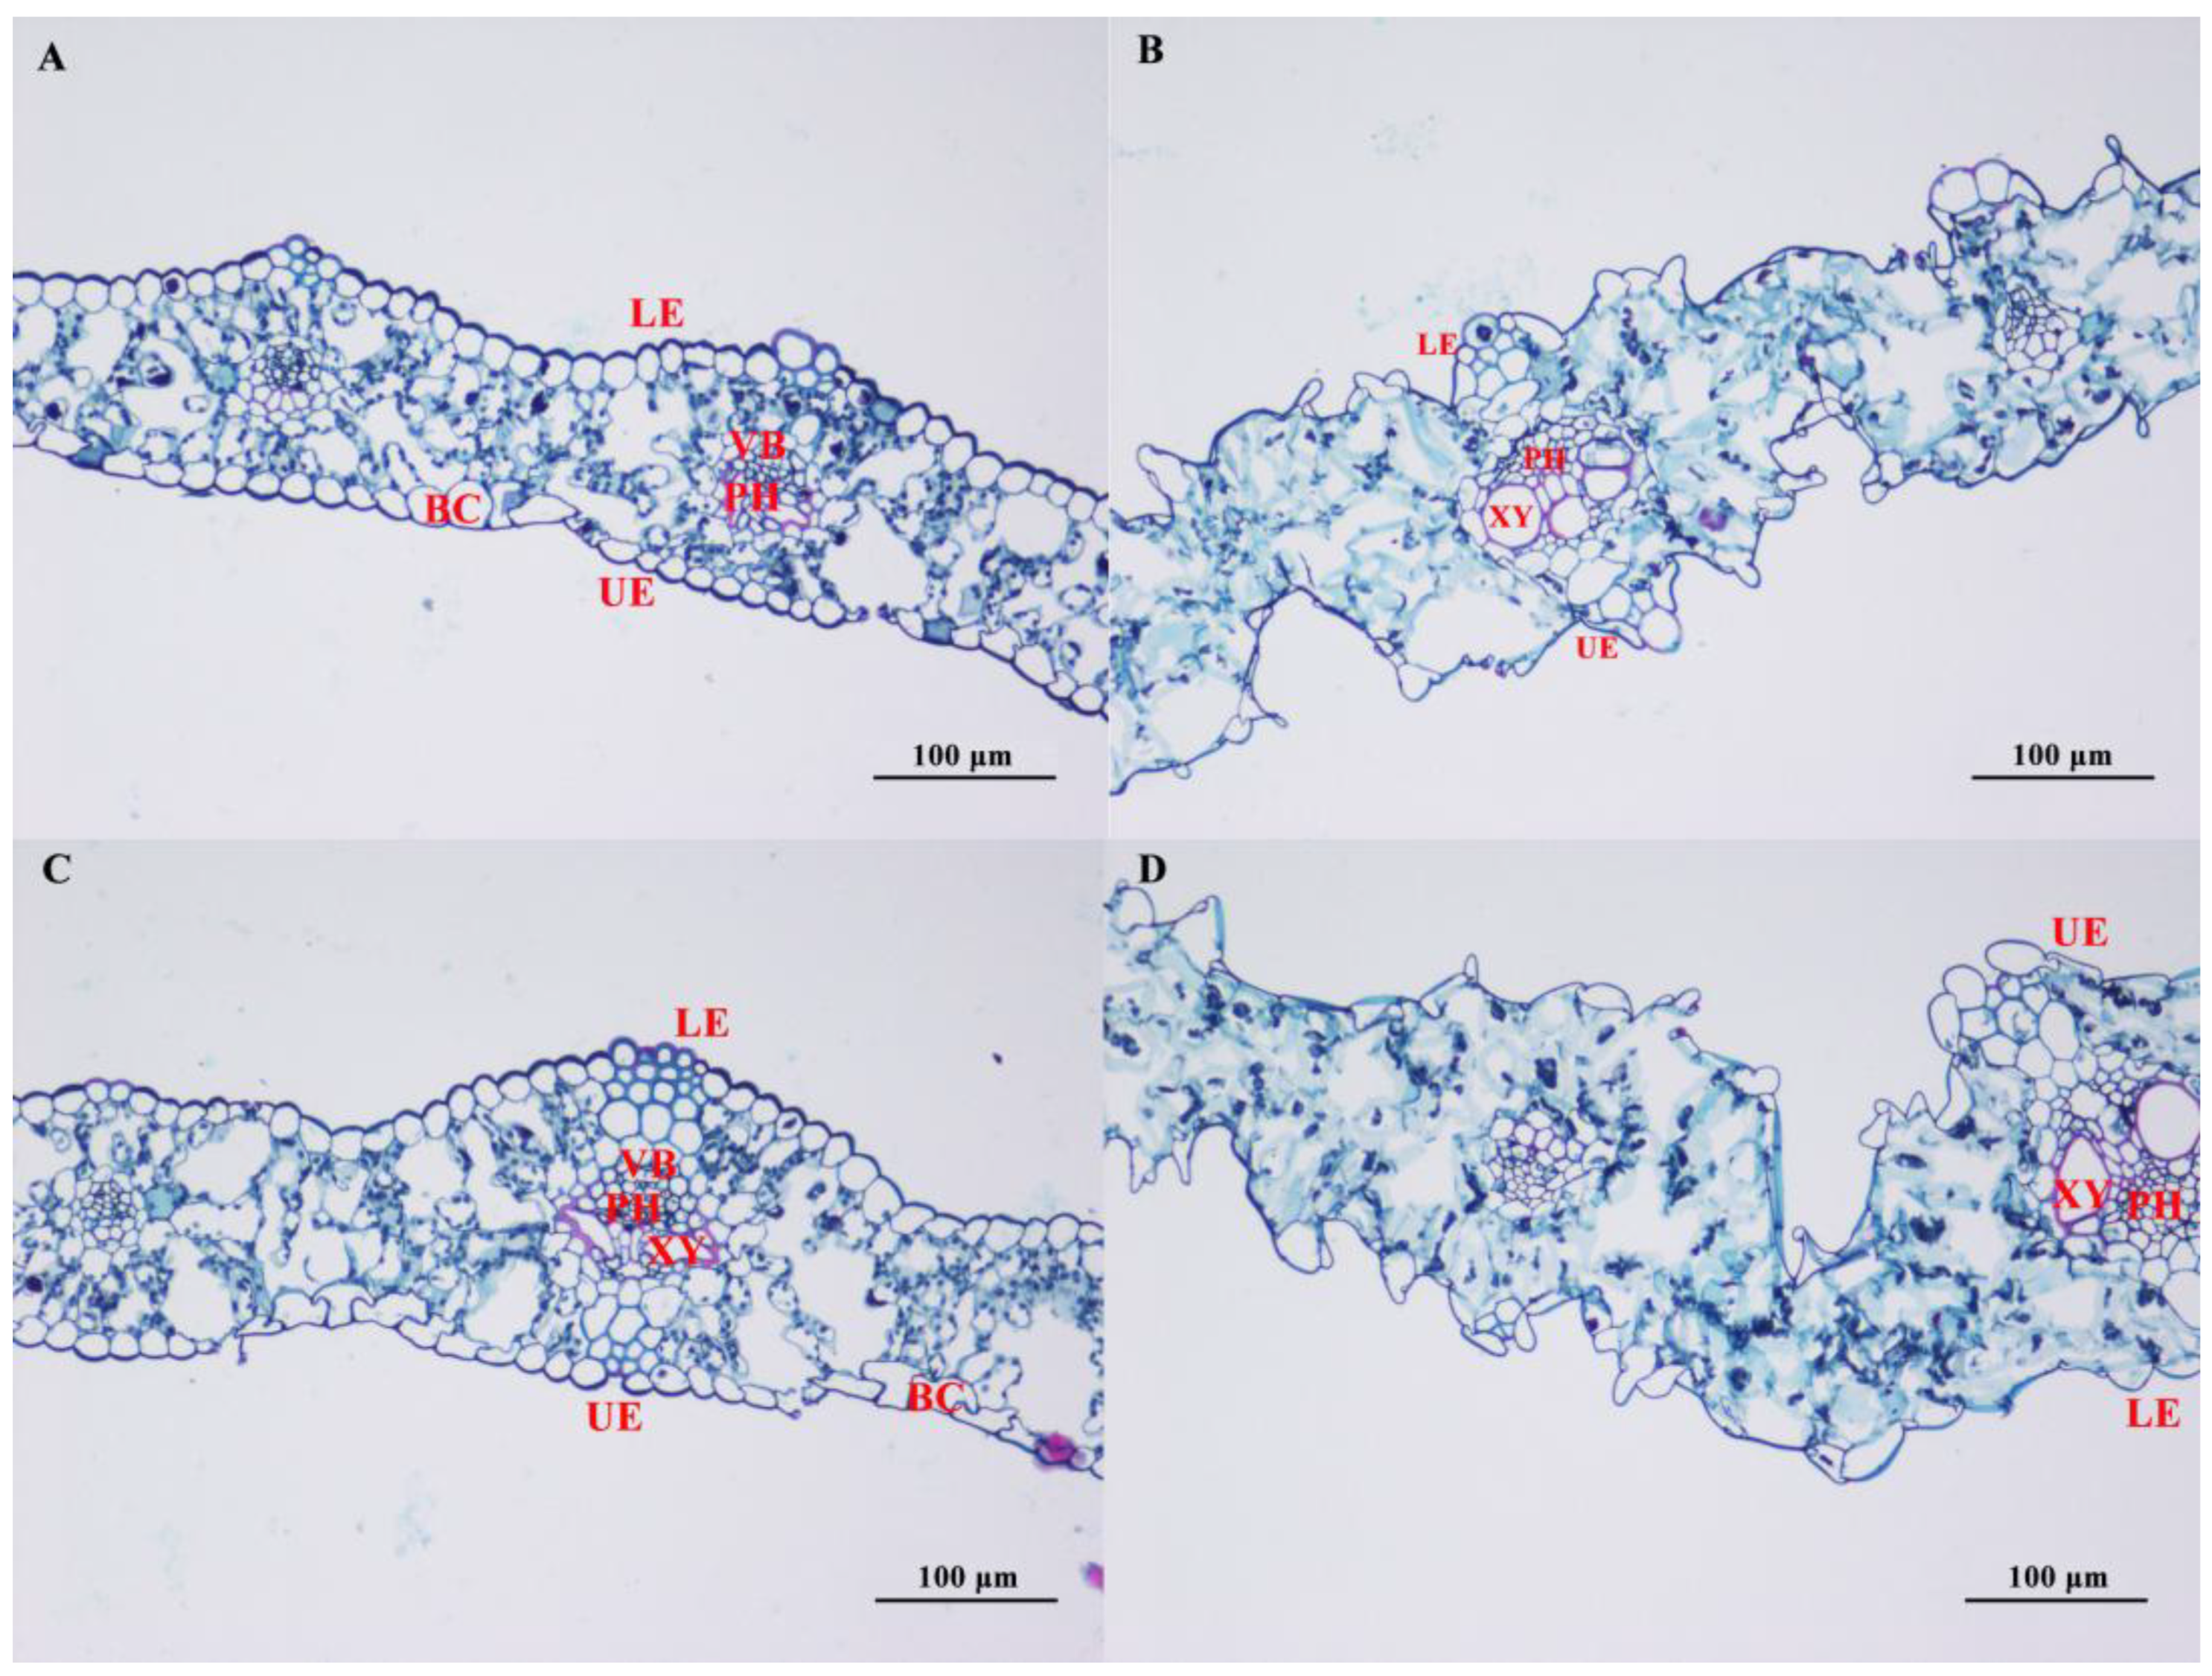
2.4. Observation of the Anatomical Structure of the Leaf

For each treatment, we selected three replicates of leaves, ensuring that the samples were 1–1.5 mm thick and contained the main vein. These leaves were carefully cut, collected, and fixed in a Formalin-Acetic Acid-Alcohol (FAA) solution, which is composed of 5 mL formalin, 5 mL glacial acetic acid, and 90 mL of 50% ethyl alcohol, for a period of 48 h. Following fixation, the leaves underwent a dehydration process using a graded series of ethanol concentrations. The leaf tissues were immersed in a mixture of anhydrous ethanol and xylene (in a 1:1 ratio) to facilitate the initial clearing of cellular contents. This step was followed by a second clearing step using 100% xylene solution to ensure the complete removal of water and ethanol from the tissue. After the clearing process, the leaf tissues were transferred to paraffin liquid in an oven set at 58 °C for wax infiltration. Once the wax infiltration was complete, the leaf material was embedded in a paraffin block using a rigid cardboard mold to maintain the structural integrity of the tissue during sectioning. The embedded leaves were then sectioned to a thickness of 10 μm using a semi-automatic microtome (Leica, Wetzlar, Germany). These sections were subsequently stained with toluidine blue for a brief period of 2–5 min. After staining, the sections were rinsed with distilled water to remove any excess dye, followed by a brief clearing step in xylene for 10 min. Subsequently, the sections were sealed with neutral gum. Finally, the microstructure of these sealed sections was meticulously examined under a light microscope (Nikon, Tokyo, Japan) [34].

2.5. Statistical Analysis

For the data management and computational tasks in our study, we employed Microsoft Excel 2023 software. Additionally, we conducted an analysis of variance (ANOVA) using SPSS 23.0 statistical software. To evaluate the contributions of genetic and environmental factors to the agronomic and physiological traits of covered and naked oats under salt stress, we employed a two-way ANOVA. Each parameter was analyzed using a two-factor ANOVA model, with cultivar and salt concentration designated as the primary influencing factors. The model also considered the interactions between these factors to provide a comprehensive understanding of their combined effects on the studied parameters. To further investigate the differences among groups for indicators that exhibited significant interactions, we conducted post hoc analyses using Tukey’s Honest Significant Difference (HSD) test. This method was implemented in SPSS 23.0 software to determine which specific group means were significantly different from one another. In addition, to elucidate the relationship between salt concentration and each physiological indicator, we conducted a series of linear regression analyses. Initially, we identified the indicators with the most significant association with salt concentration by examining the f-values obtained from the two-way ANOVA results. This approach ensured that we focused on the indicators most strongly influenced by salinity. Subsequently, we performed linear regression analyses using GraphPad Prism software (version 8.0.2). Only regression models with an R2 value greater than 0.5 were considered robust and included in our analysis. To analyze and interpret the measured metrics, the data were subjected to principal component analysis (PCA) using Origin 2020 software. Subsequently, Pearson correlation analysis was performed using SPSS 23.0 software to assess the linear relationships between the measured metrics. Furthermore, the visualization of correlation analysis was achieved using the linkET package within R software v4.4.1. The affiliation function values, the weights of each composite indicator, and the composite salt tolerance value were meticulously calculated and formulated using the following methods [35]:
μ X i j = X i j X j m i n X j m a x X j m i n   ,   j = 1,2 , n
W j = P j j = 1 n P j   ,   j = 1,2 , n
D = j = 1 n μ X j × W j   , j = 1,2 , n
μ(Xij) means the value of the affiliation function of i cultivar and j indicator,
Xmax and Xmin means the maximum and minimum values of each indicator,
Wj means the weight of the j indicator,
Pj means the contribution rate of the jth indicator of each oat cultivar obtained from the principal component analysis,
D-value is the comprehensive evaluation value of the salt tolerance of each oat cultivar under salt stress.

3. Results

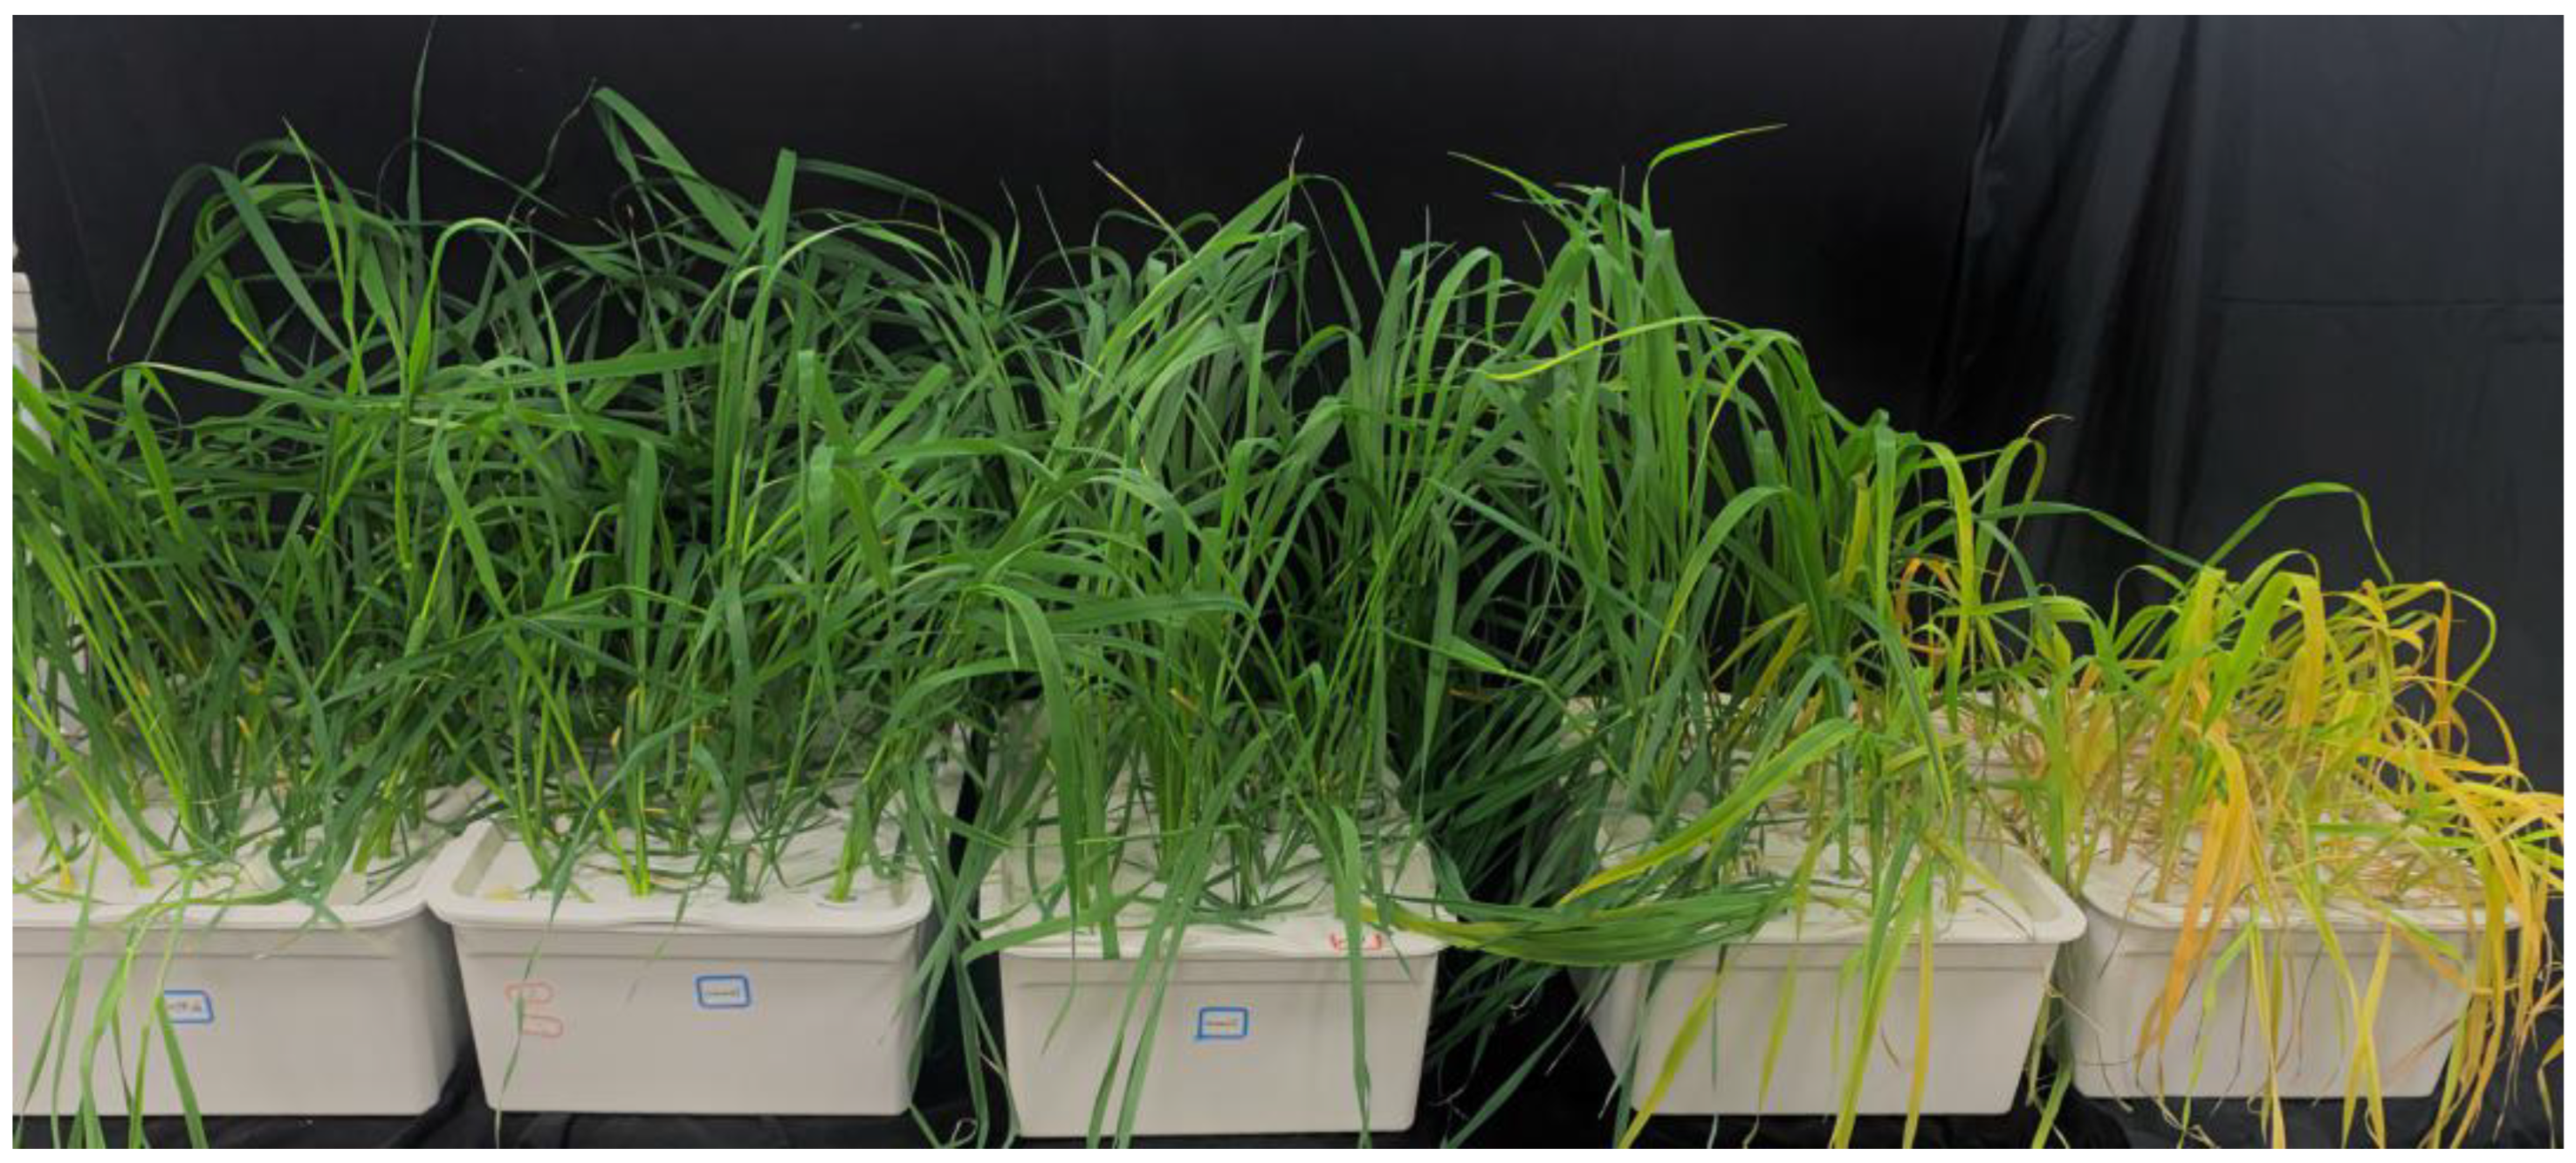
3.1. Effects of Salt Stress on the Growth

Two-way ANOVA (Table 1) showed that cultivar, salt concentration, and its interaction between cultivar and salt concentration had highly significant (p < 0.01) effects on plant height, aboveground dry weight, aboveground fresh weight, underground dry weight, and underground fresh weight. Cultivar had highly significant effects on flag leaf width and stem thickness (p < 0.01), and salt concentration had highly significant effects (p < 0.01) on flag leaf width. The interaction between cultivar and salt concentration had significant effects on stem thickness (p < 0.05). The results of our analysis, based on the f-values obtained from each treatment, reveal distinct patterns of influence on various plant growth traits. Specifically, the degree of influence on plant height, aboveground dry weight, and aboveground fresh weight was found to be in the order of salt concentration > cultivar > cultivar × salt concentration. In contrast, for flag leaf width, underground dry weight, and underground fresh weight, the influence was in the order of cultivar > salt concentration > cultivar × salt concentration. For stem thickness, the influence order was cultivar > cultivar × salt concentration > salt concentration.
To comprehensively assess the impact of salinity on plant growth, we conducted a comparative analysis of agronomic traits across different cultivars at the same salt concentration, as well as across different salt concentrations for the same cultivar (Table 2). Four oat cultivars displayed a consistent decline in height with rising salt levels. At a salt stress level of 200 mM, the plant heights of these cultivars were reduced by 32%, 24%, 25%, and 18% compared to the control group, with ‘Qinghai 444’ experiencing the most significant reduction. When comparing plant height across different cultivars at the same salt concentration, the cultivar ‘Qinghai 444’ exhibited the highest plant height among all tested cultivars, with the exception of ‘Mengyan No. 1’, which surpassed it at the 200 mM salt concentration level. In conjunction with the data presented in Table 1, our analysis revealed that varying salt concentration treatments did not significantly influence the stem thickness of oats. Instead, the differences in stem thickness were primarily attributed to the specific cultivars under investigation. Notably, among the tested cultivars, ‘Menyan No. 1’ consistently exhibited the greatest stem thickness across all tested salt concentrations. The aboveground dry weight, aboveground fresh weight, underground dry weight, and underground fresh weight of four oat cultivars all exhibited a decline with increasing salt levels. At a salt concentration of 200 mM, the aboveground dry weight reductions for ‘Qing-hai 444’, ‘Baiyan No. 18’, ‘Mengyan No. 1’, and ‘Qingyin No. 3’ were 60%, 68%, 63%, and 67%, respectively, relative to the control group. Similarly, the aboveground fresh weight decreased by 68% for ‘Qinghai 444’, 79% for ‘Baiyan No. 18’, 79% for ‘Mengyan No. 1’, and 74% for ‘Qingyin No. 3’. For underground biomass, the dry weight reductions were 43% for ‘Qinghai 444’, 60% for ‘Baiyan No. 18’, 38% for ‘Mengyan No. 1’, and 40% for ‘Qingyin No. 3’, compared to the control. The underground fresh weight also showed significant decreases, with ‘Qinghai 444’, ‘Baiyan No. 18’, ‘Mengyan No. 1’, and ‘Qingyin No. 3’ experiencing reductions of 58%, 63%, 37%, and 65%, respectively. At the same salt concentration, the cultivar ‘Qinghai 444’ exhibited the highest aboveground fresh weight and aboveground dry weight among all tested cultivars. Conversely, the underground dry weight was found to be highest in the cultivar ‘Mengyan No. 1’ across all tested salt concentrations. At salt concentrations of 0, 50, and 100 mM, ‘Qinghai 444’ had the highest underground fresh weight. However, at higher salt concentrations of 150 and 200 mM, ‘Mengyan No. 1’ demonstrated the highest underground fresh weight.
The regression analysis revealed a significant linear correlation between salt concentration and three plant agronomic traits, including plant height, aboveground dry weight, and aboveground fresh weight, as depicted in Figure 2. The respective R2 values were 0.6653 for plant height, 0.6041 for aboveground fresh weight, and 0.6420 for aboveground dry weight. Although the data points were somewhat scattered, they exhibited a clear overall downward trend along the fitted linear regression line.

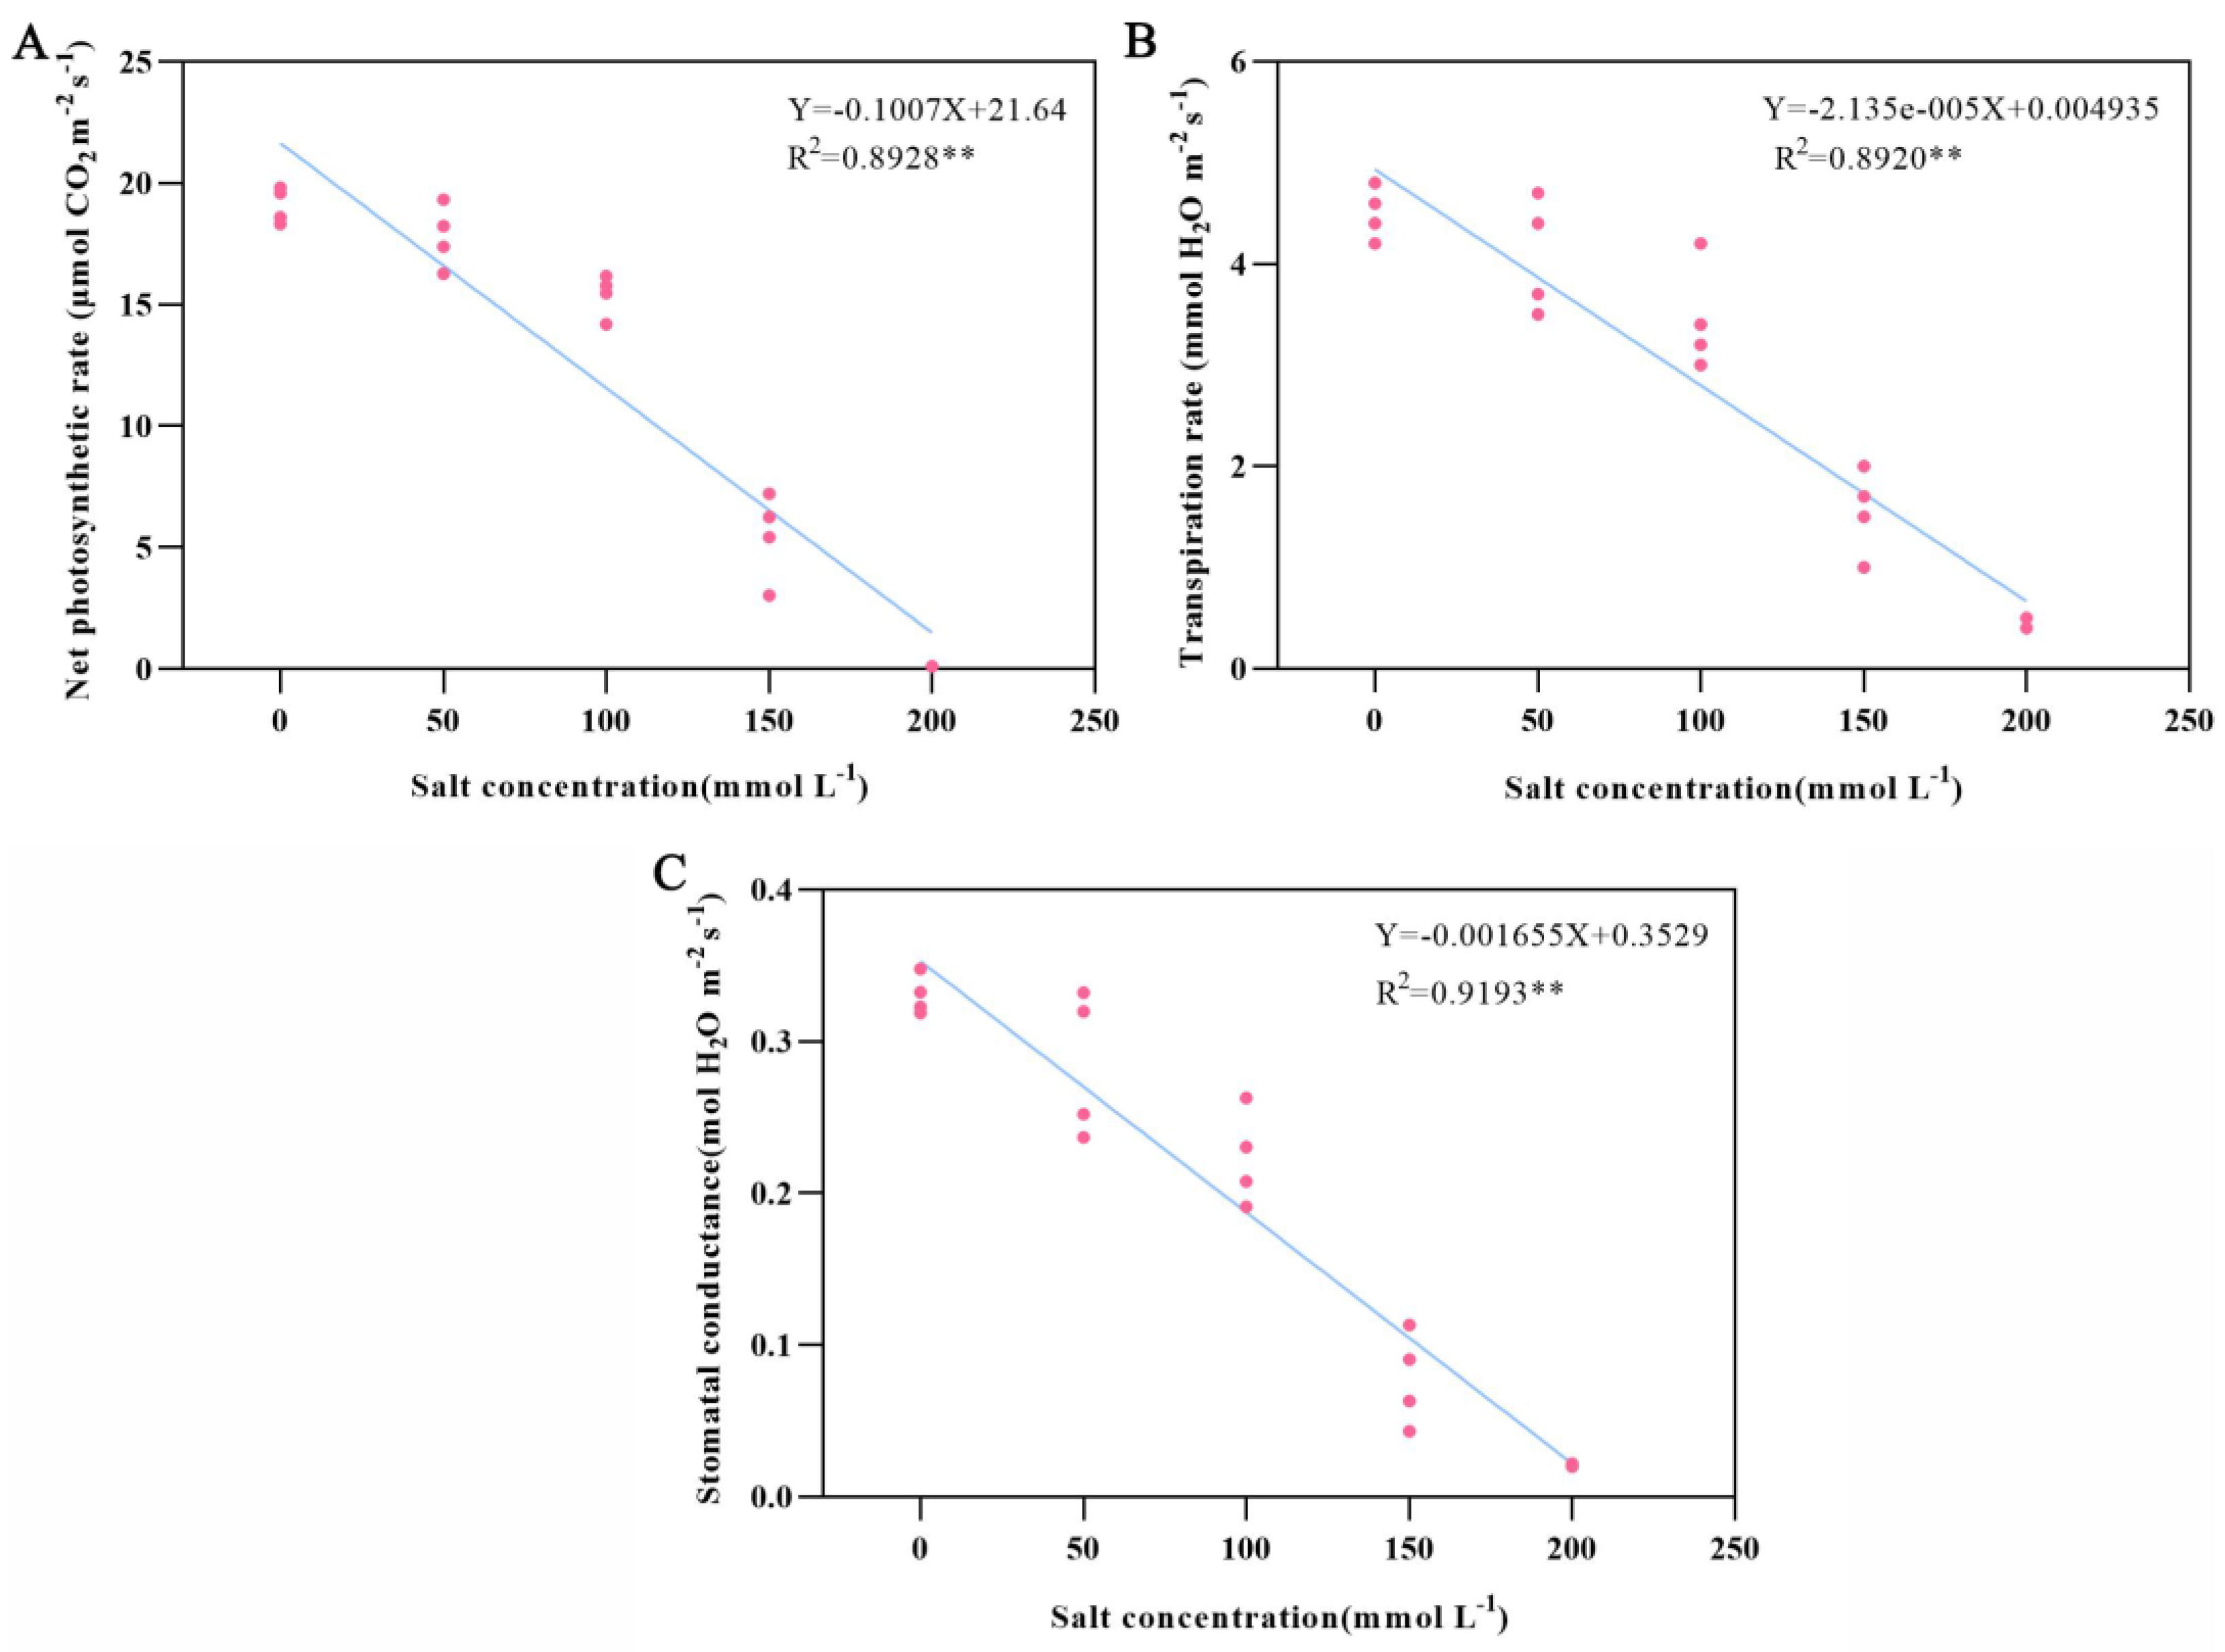
3.2. Effects of Salt Stress on Chlorophyll Content and Photosynthesis

A two-way ANOVA (Table 3) showed that the interaction of cultivar, salt concentration, and cultivar and concentration had highly significant effects (p < 0.01) on chlorophyll a, chlorophyll b, total chlorophyll content, net photosynthetic rate, transpiration rate, stomatal conductance, and intercellular CO2 concentration. The analysis of the f-values from each treatment revealed distinct patterns of influence on various photosynthetic parameters. Specifically, the degree of influence on chlorophyll a content, chlorophyll b content, and total chlorophyll content was found to be in the order of cultivar > salt concentration > cultivar × salt concentration. In contrast, the degree of influence on net photosynthetic rate, stomatal conductance, transpiration rate, and intercellular CO2 concentration was in the order of salt concentration > cultivar > cultivar × salt concentration.
Salt stress had a pronounced impact on the chlorophyll content and photosynthetic indices across all oat cultivars (Table 4). Additionally, significant differences were observed among the oat cultivars at each level of salinity treatment. Chlorophyll a, chlorophyll b, and total chlorophyll contents of all four oat cultivars showed a decreasing trend with increasing salt concentration. Specifically, at a salt concentration of 200 mM, the chlorophyll a content diminished by 65%, 76%, 79%, and 68% for ‘Qinghai 444’, ‘Baiyan No. 18’, ‘Mengyan No. 1’, and ‘Qingyin No. 3’, respectively, when compared to the control. Similarly, chlorophyll b content decreased by 67%, 85%, 76%, and 71% for the same cultivars under the same conditions. The total chlorophyll content followed a similar downward trend, with reductions of 65% for ‘Qinghai 444’, 76% for ‘Baiyan No. 18’, 78% for ‘Mengyan No. 1’, and 69% for ‘Qingyin No. 3’, relative to the control. Notably, ‘Baiyan No. 18’ and ‘Mengyan No. 1’ exhibited significantly higher decreases (p < 0.05) in all chlorophyll content indicators compared to ‘Qinghai 444’ and ‘Qingyin No. 3’. Among the oat cultivars tested, ‘Qinghai 444’ exhibited the highest levels of chlorophyll a, chlorophyll b, and total chlorophyll content at the same salt concentration. The net photosynthetic rate, stomatal conductance, and transpiration rate of the four oat cultivars showed consistent decreasing trends with increasing salt concentration. At a critical salt concentration of 200 mM, the net photosynthetic rate plummeted by 99.4%, 99.6%, 99.8%, and 99.4% for ‘Qinghai 444’, ‘Baiyan No. 18’, ‘Mengyan No. 1’, and ‘Qingyin No. 3’, respectively, compared to the control. Transpiration rates also showed significant reductions, dropping by 90%, 90%, 92%, and 90% for ‘Qinghai 444’, ‘Baiyan No. 18’, ‘Mengyan No. 1’, and ‘Qingyin No. 3’, respectively. Stomatal conductance similarly decreased by 93.7%, 93.8%, 94%, and 93.8% for the same cultivars, indicating a substantial reduction in gas exchange under saline conditions. In contrast, intercellular CO2 concentration, which typically decreases under stress conditions, initially decreases and then increases with rising salt concentrations. At 200 mM, the intercellular CO2 concentration increased by 33% for ‘Qinghai 444’, 29% for ‘Baiyan No. 18’, 33% for ‘Mengyan No. 1’, and 24% for ‘Qingyin No. 3’, suggesting an adaptation mechanism to maintain carbon fixation despite severe stress. The net photosynthetic rate, stomatal conductance, and transpiration rate of ‘Qinghai 444’ were found to be the highest among all tested cultivars at the same salt concentration. Conversely, the intercellular carbon dioxide concentration varied significantly among different cultivars and salt concentrations. The maximum intercellular CO2 concentrations were observed as follows: ‘Baiyan No. 18’ at 0 mM salinity, ‘Qinghai 444’ at both 50 mM and 100 mM salinity, ‘Mengyan No. 1’ at 150 mM salinity, ‘Qingyin No. 3’ at 200 mM salinity.
The regression analysis revealed a strong linear correlation between salt concentration and several key physiological parameters, including net photosynthetic rate, transpiration rate, and stomatal conductance, as depicted in Figure 3. The coefficient of determination (R2) values for these relationships were 0.8928, 0.8920, and 0.9193, respectively. These parameters exhibited a consistent decline as salt concentration increased, aligning with the linear regression model.

3.3. Effects of Salt Stress on Physiological and Biochemical Properties

The results of the two-way ANOVA (Table 5) revealed that both cultivar and salt concentration, as well as their interaction, had highly significant effects on SOD activity, POD activity, and proline content (p < 0.01). Additionally, cultivar was found to have a significant impact on MDA content (p < 0.05), while salt concentration and the interaction between cultivar and salt concentration exerted highly significant effects on MDA content (p < 0.01). The analysis of the f-values from each treatment revealed distinct patterns of influence on various biochemical parameters in the plants. Specifically, the degree of influence on SOD activity and POD activity was found to be in the order of salt concentration > cultivar > cultivar × salt concentration. For proline content, the influence was in the order of cultivar > salt concentration > cultivar × salt concentration. In the case of MDA content, the influence was observed to be in the order of salt concentration > cultivar × salt concentration > cultivar.
Salt stress had a significant impact on the activity of SOD and POD, as well as the content of proline and MDA in all oat cultivars examined (Table 6). Furthermore, substantial differences were observed among the oat cultivars across all salinity treatments. An initial increase followed by a decrease in SOD activity was observed, with a maximum of 100 mM salt concentration for all cultivars. Notably, ‘Baiyan No. 18’ exhibited the highest increase in SOD activity (1.05-fold over the control) at this concentration. At 200 mM, ‘Qinghai 444’ and ‘Qingyin No. 3’ showed the most significant decreases in SOD activity, with 2.01-fold and 3.75-fold reductions, respectively, compared to the control. The POD activity also followed an increasing and then decreasing trend with rising salt concentrations. ‘Mengyan No. 1’ demonstrated a significant (p < 0.05) increase of 28% under 50 mM salt stress compared to the control. However, at 200 mM, POD activity declined by 37%, 28%, 35%, and 36% for ‘Qinghai 444’, ‘Baiyan No. 18’, ‘Mengyan No. 1’, and ‘Qingyin No. 3’, respectively, compared to the control. Proline content exhibited a significant (p < 0.05) increase with escalating salt concentrations. While the changes in proline content were relatively modest at 50 mM and 100 mM salt concentrations, a more pronounced and substantial increase was observed at 150 mM. At the highest salt concentration of 200 mM, proline content increased by 13.3-fold for ‘Qinghai 444’, 8.5-fold for ‘Baiyan No. 18’, 14.4-fold for ‘Mengyan No. 1’, and 12.1-fold for ‘Qingyin No. 3’, respectively, compared to the control. As the salt concentration increased, the MDA content exhibited distinct trends among the different oat cultivars. ‘Qinghai 444’, ‘Baiyan No. 18’ and ‘Qingyin No. 3’ exhibited an increasing then decreasing then increasing trend, while ‘Mengyan No. 1’ showed a steady increase in salt concentration. At 200 mM, MDA content increased by 87% for ‘Qinghai 444’, 86% for ‘Baiyan No. 18’, 44% for ‘Mengyan No. 1’, and 2.34-fold for ‘Qingyin No. 3’, respectively, compared to the control. ‘Qingyin No. 3’ exhibited the highest SOD activity at 0 mM salt concentration, while ‘Qinghai 444’ showed peak activity at both 50 mM and 150 mM salt concentrations. Additionally, ‘Baiyan No. 18’ demonstrated the highest SOD activity at 100 mM and 200 mM salt concentrations. The highest POD activity was observed in ‘Qinghai 444’ across all tested salt concentrations (0, 50, 150, and 200 mM), ‘Qingyin No. 3’ exhibited peak POD activity at 100 mM salt concentration. At 0, 50, 100, and 150 mM salt concentrations, ‘Baiyan No. 18’ exhibited the highest proline content. At the highest salt concentration (200 mM), ‘Mengyan No. 1’ demonstrated the highest proline content. The highest MDA content was observed in ‘Qinghai 444’ at 0 and 50 mM salt concentrations, in ‘Mengyan No. 1’ at 100 mM and 150 mM salt concentrations, and in ‘Qingyin No. 3’ at 200 mM salt concentrations.
In contrast, a strong linear relationship was found between salt concentration and POD activity, as illustrated in Figure 4, with an R2 value of 0.5156. Notably, POD activity decreased progressively along the linear regression line with increasing salt concentration.

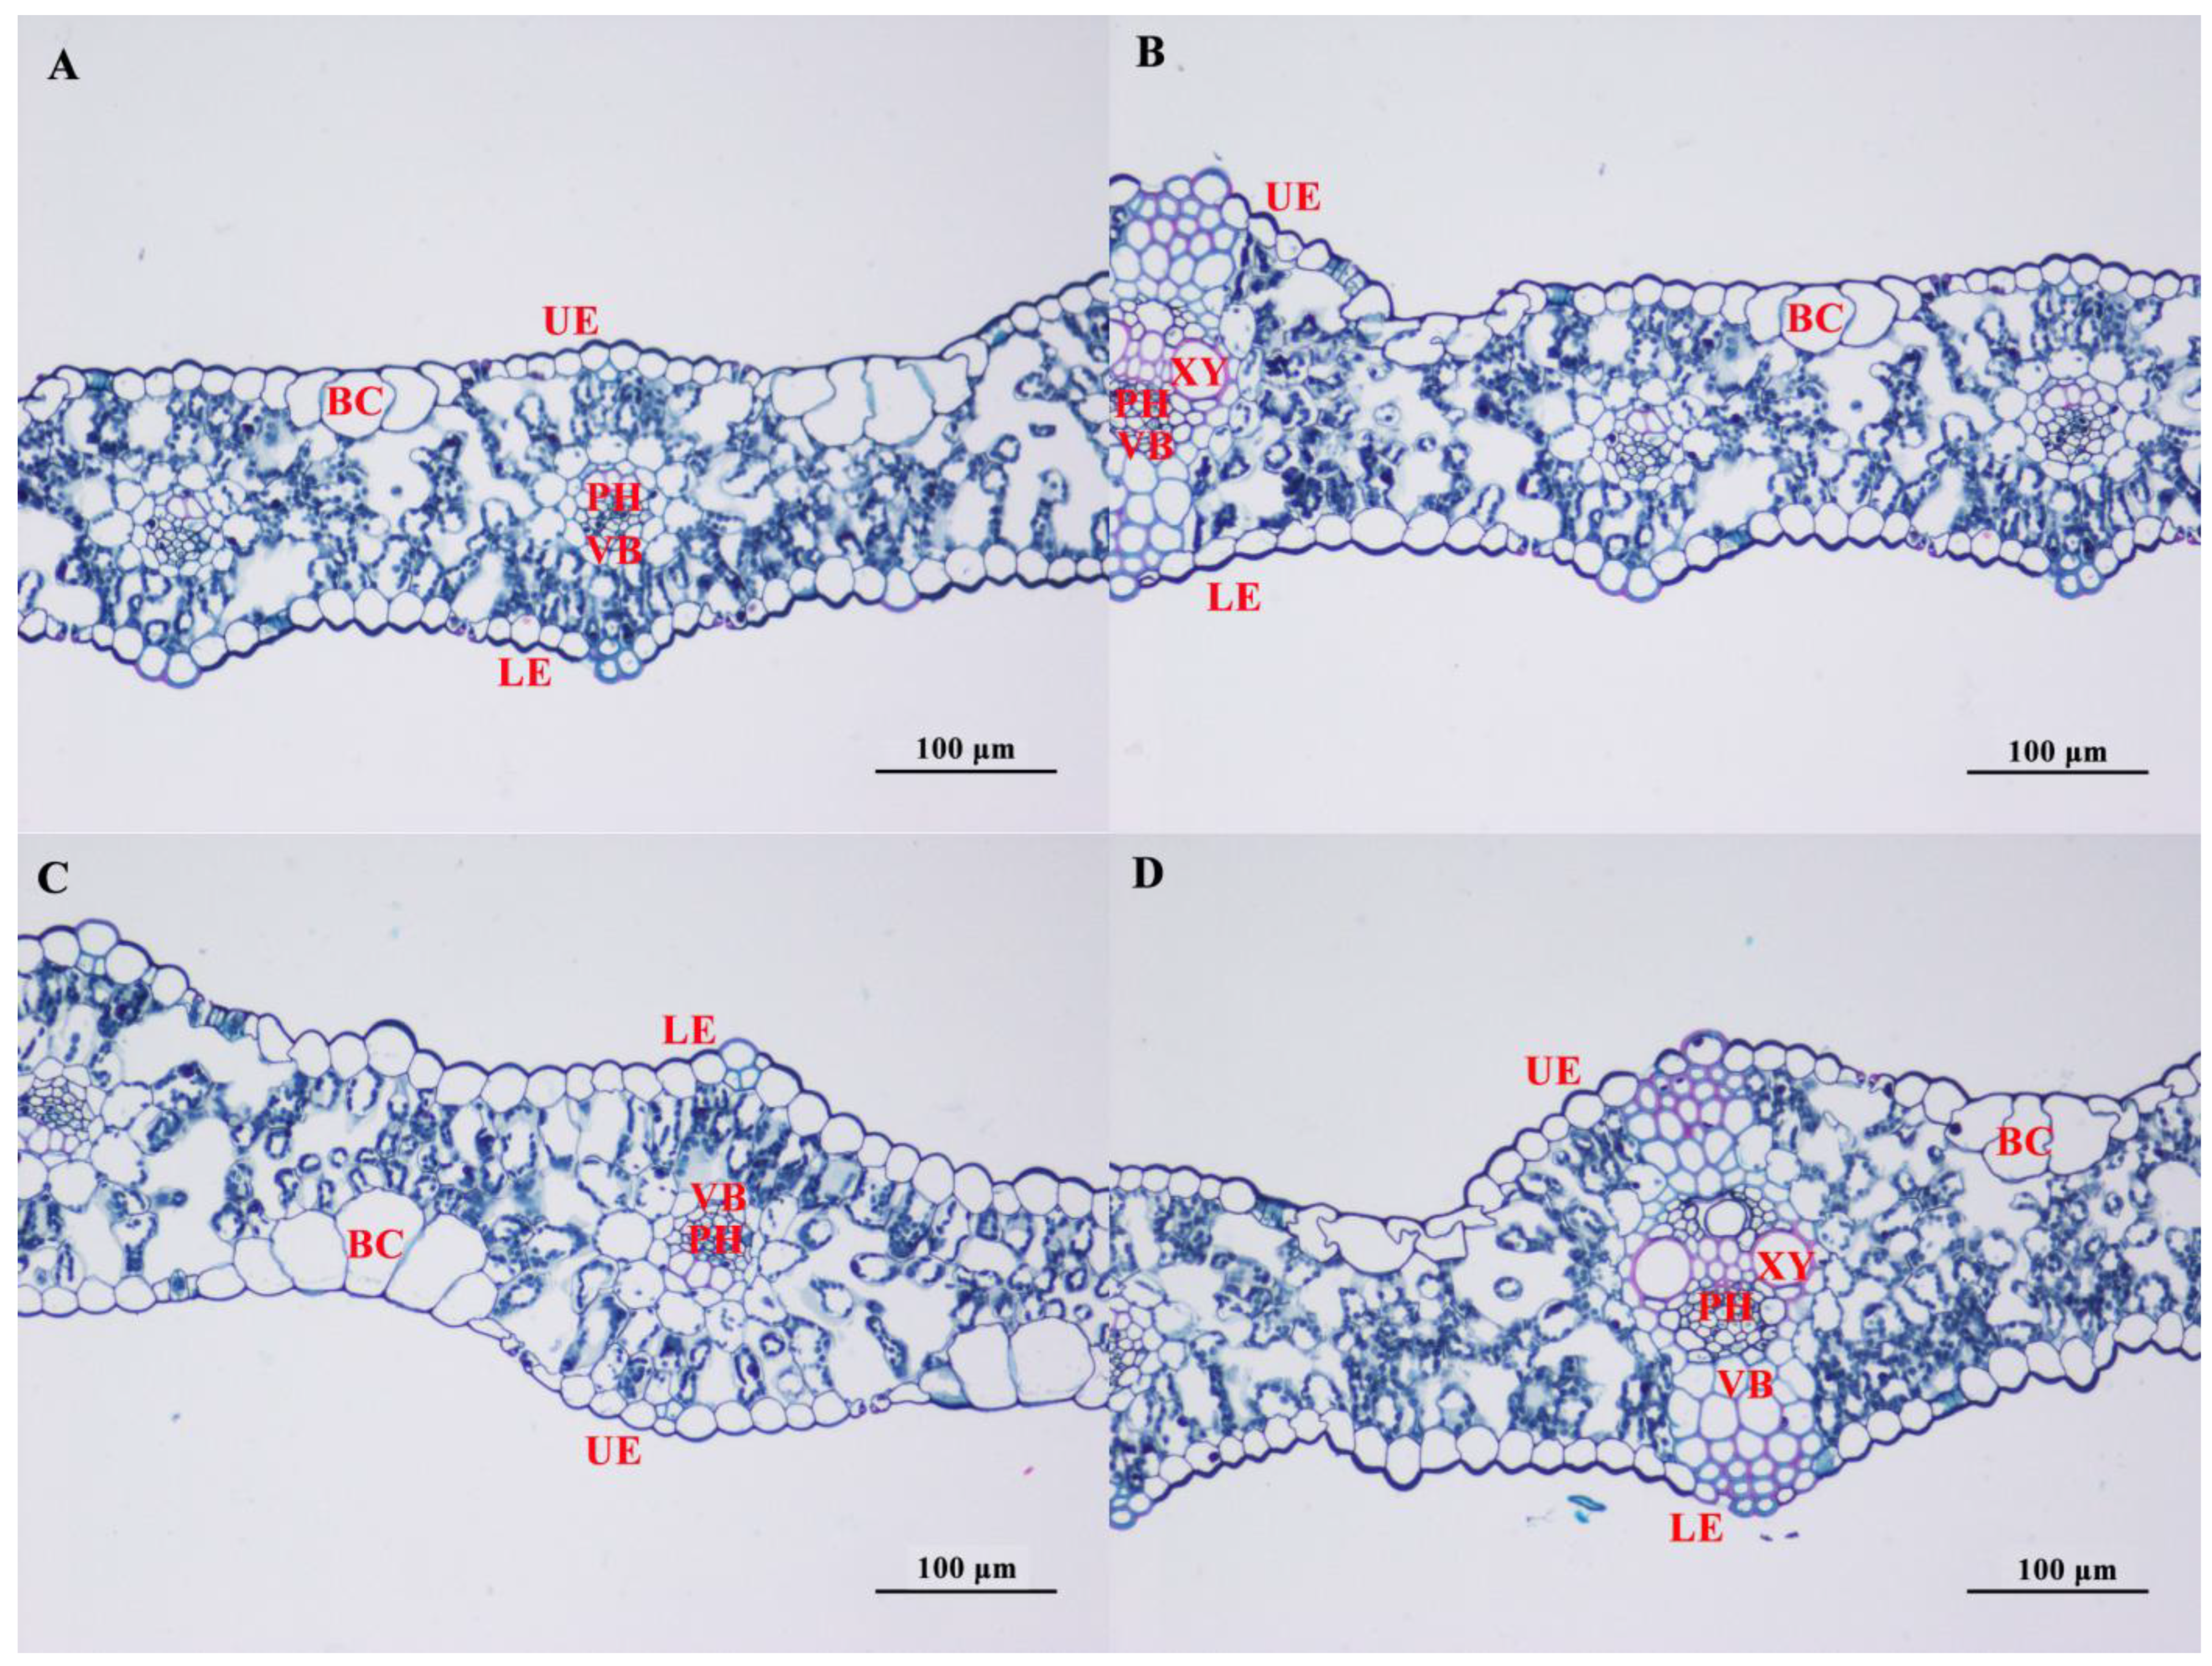
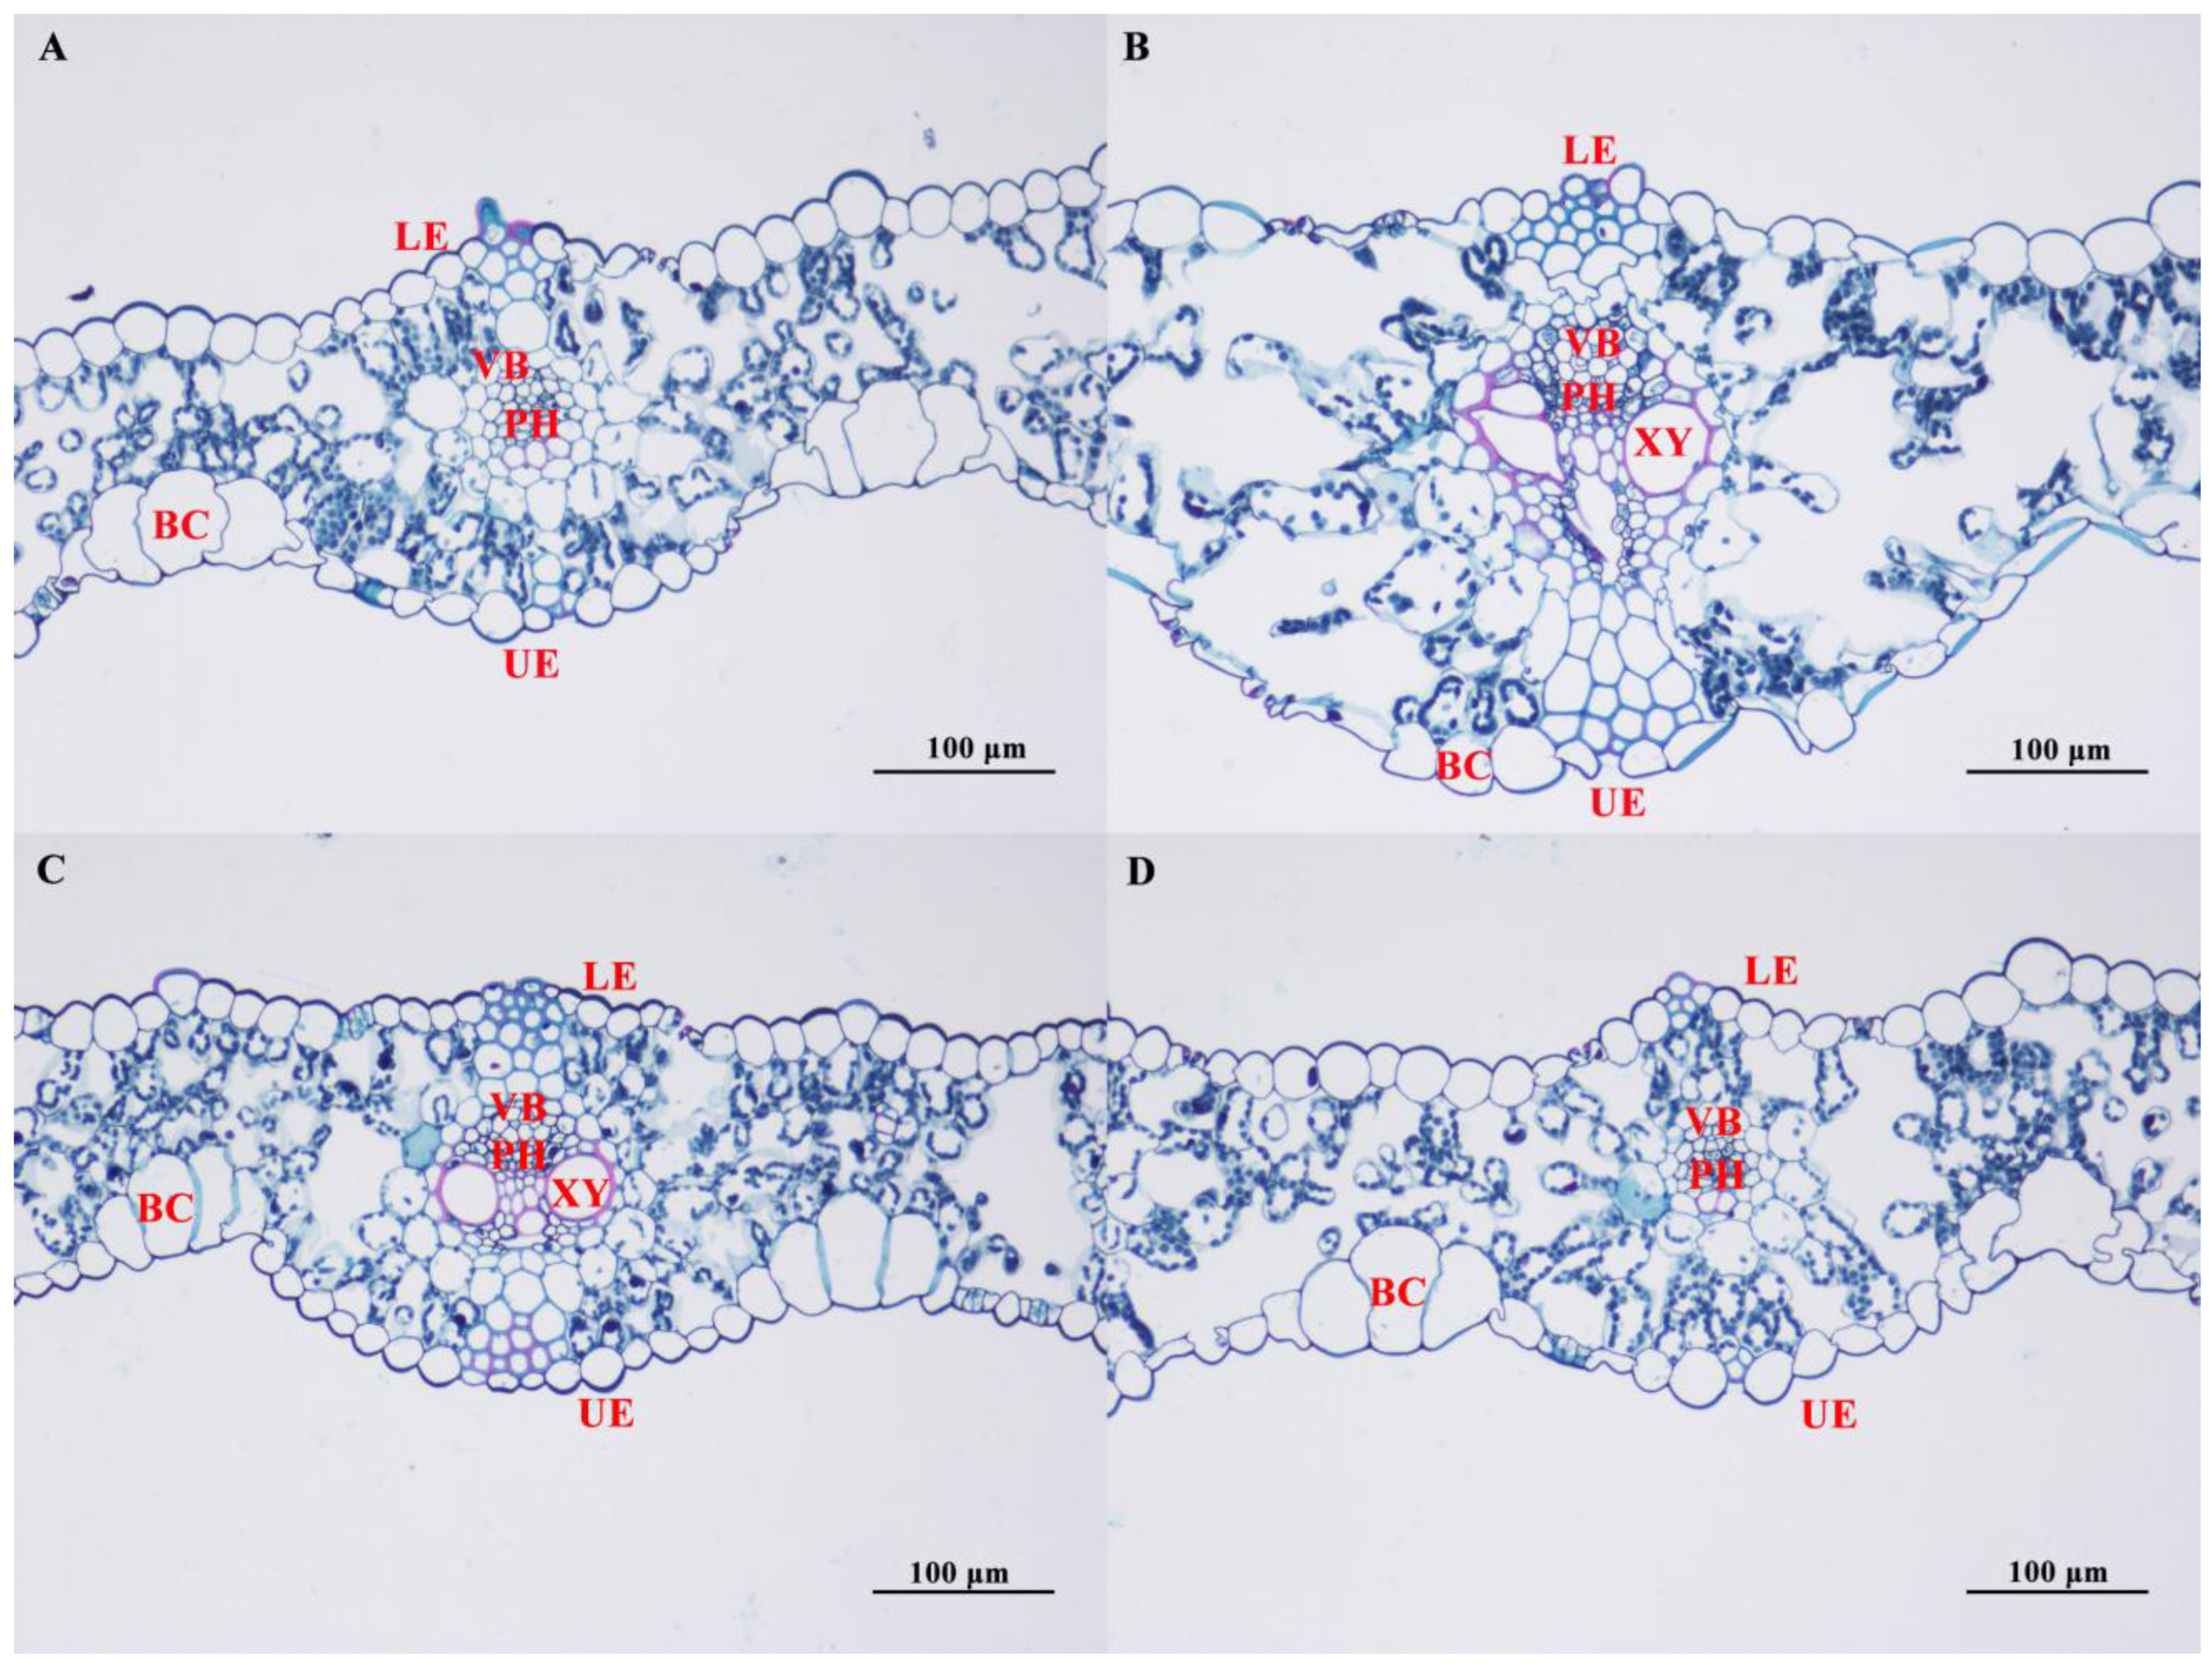
3.4. Effect of Salt Stress on the Microstructure of Oat Leaves

The anatomical features of leaves (including cell structure and tissue arrangement) can reflect changes in leaf morphology as well as alterations in physiological and metabolic processes [36,37]. Under non-saline stress conditions, the vacuoles in the mesophyll cells of both A. sativa and A. nuda occupied the majority of the cell volume. These large central vacuoles were prominent, pushing other organelles, such as chloroplasts and nuclei, to the periphery of the cell. The epidermal cells on both the upper and lower surfaces of the leaves were uniformly shaped and tightly, neatly arranged. In the four oat cultivars examined, stomata were slightly open and recessed, comprised of guard cells and subsidiary cells, with the stomatal apertures appearing flat and the vesicular cells round and filled (Figure 5).
Under salt stress conditions of 100 mmol/L, significant alterations in leaf cellular architecture were observed in four oat cultivars compared to the control group (Figure 6). The volume of upper and lower epidermal cells and chloroplasts was notably reduced, leading to a decrease in the thickness of the leaves. The chloroplast and vascular bundle structures became more compact, while the mesophyll cell structure loosened, the distance between guard cells diminished, and stomatal apertures constricted. In ‘Qinghai 444’ and ‘Mengyan No. 1’, the cellular structures were more distinctly defined, with chloroplasts appearing more uniformly distributed (Figure 6A,C). In contrast, ‘Baiyan No. 18’ and ‘Qingyin No. 3’ exhibited deformation and degradation in their upper and lower epidermal cells, accompanied by a significant reduction in chloroplast number (Figure 6B,D). Notably, the phloem cells in ‘Baiyan No. 18’ displayed irregular, elongated morphologies, potentially a result of increased cellular osmotic potential and water loss from the vesicles due to salt stress (Figure 6B).
Exposure to a salt concentration of 200 mmol/L inflicted substantial damage on the leaf structure of four oat cultivars, as evidenced in Figure 7. The impact was particularly noticeable in the mesophyll cells, which exhibited a loose and disorganized structure, a significant reduction in chloroplast number, and poorly defined cell outlines. As the salt concentration increased, the upper and lower epidermal cells of ‘Qinghai 444’ and ‘Mengyan No. 1’ demonstrated deformation and indentation, alongside irregular cell arrangement. The chloroplast count tended to decrease, and there was a noticeable reduction in the volume of vascular bundles, bulliform cells, xylem, and phloem (Figure 7A,C). Furthermore, the upper and lower epidermal cells of ‘Baiyan No. 18’ and ‘Qingyin No. 3’ sustained severe deformation, or even rupture (Figure 7B,D). The structure of the mesophyll cells became highly disorganized, and the chloroplast number was drastically reduced. More gaps appeared inside the leaf and the boundaries between cell structures became indistinct, and it was challenging to discern the guard cells and bulliform cells accurately. The vascular bundles were severely compromised and significantly reduced in volume.

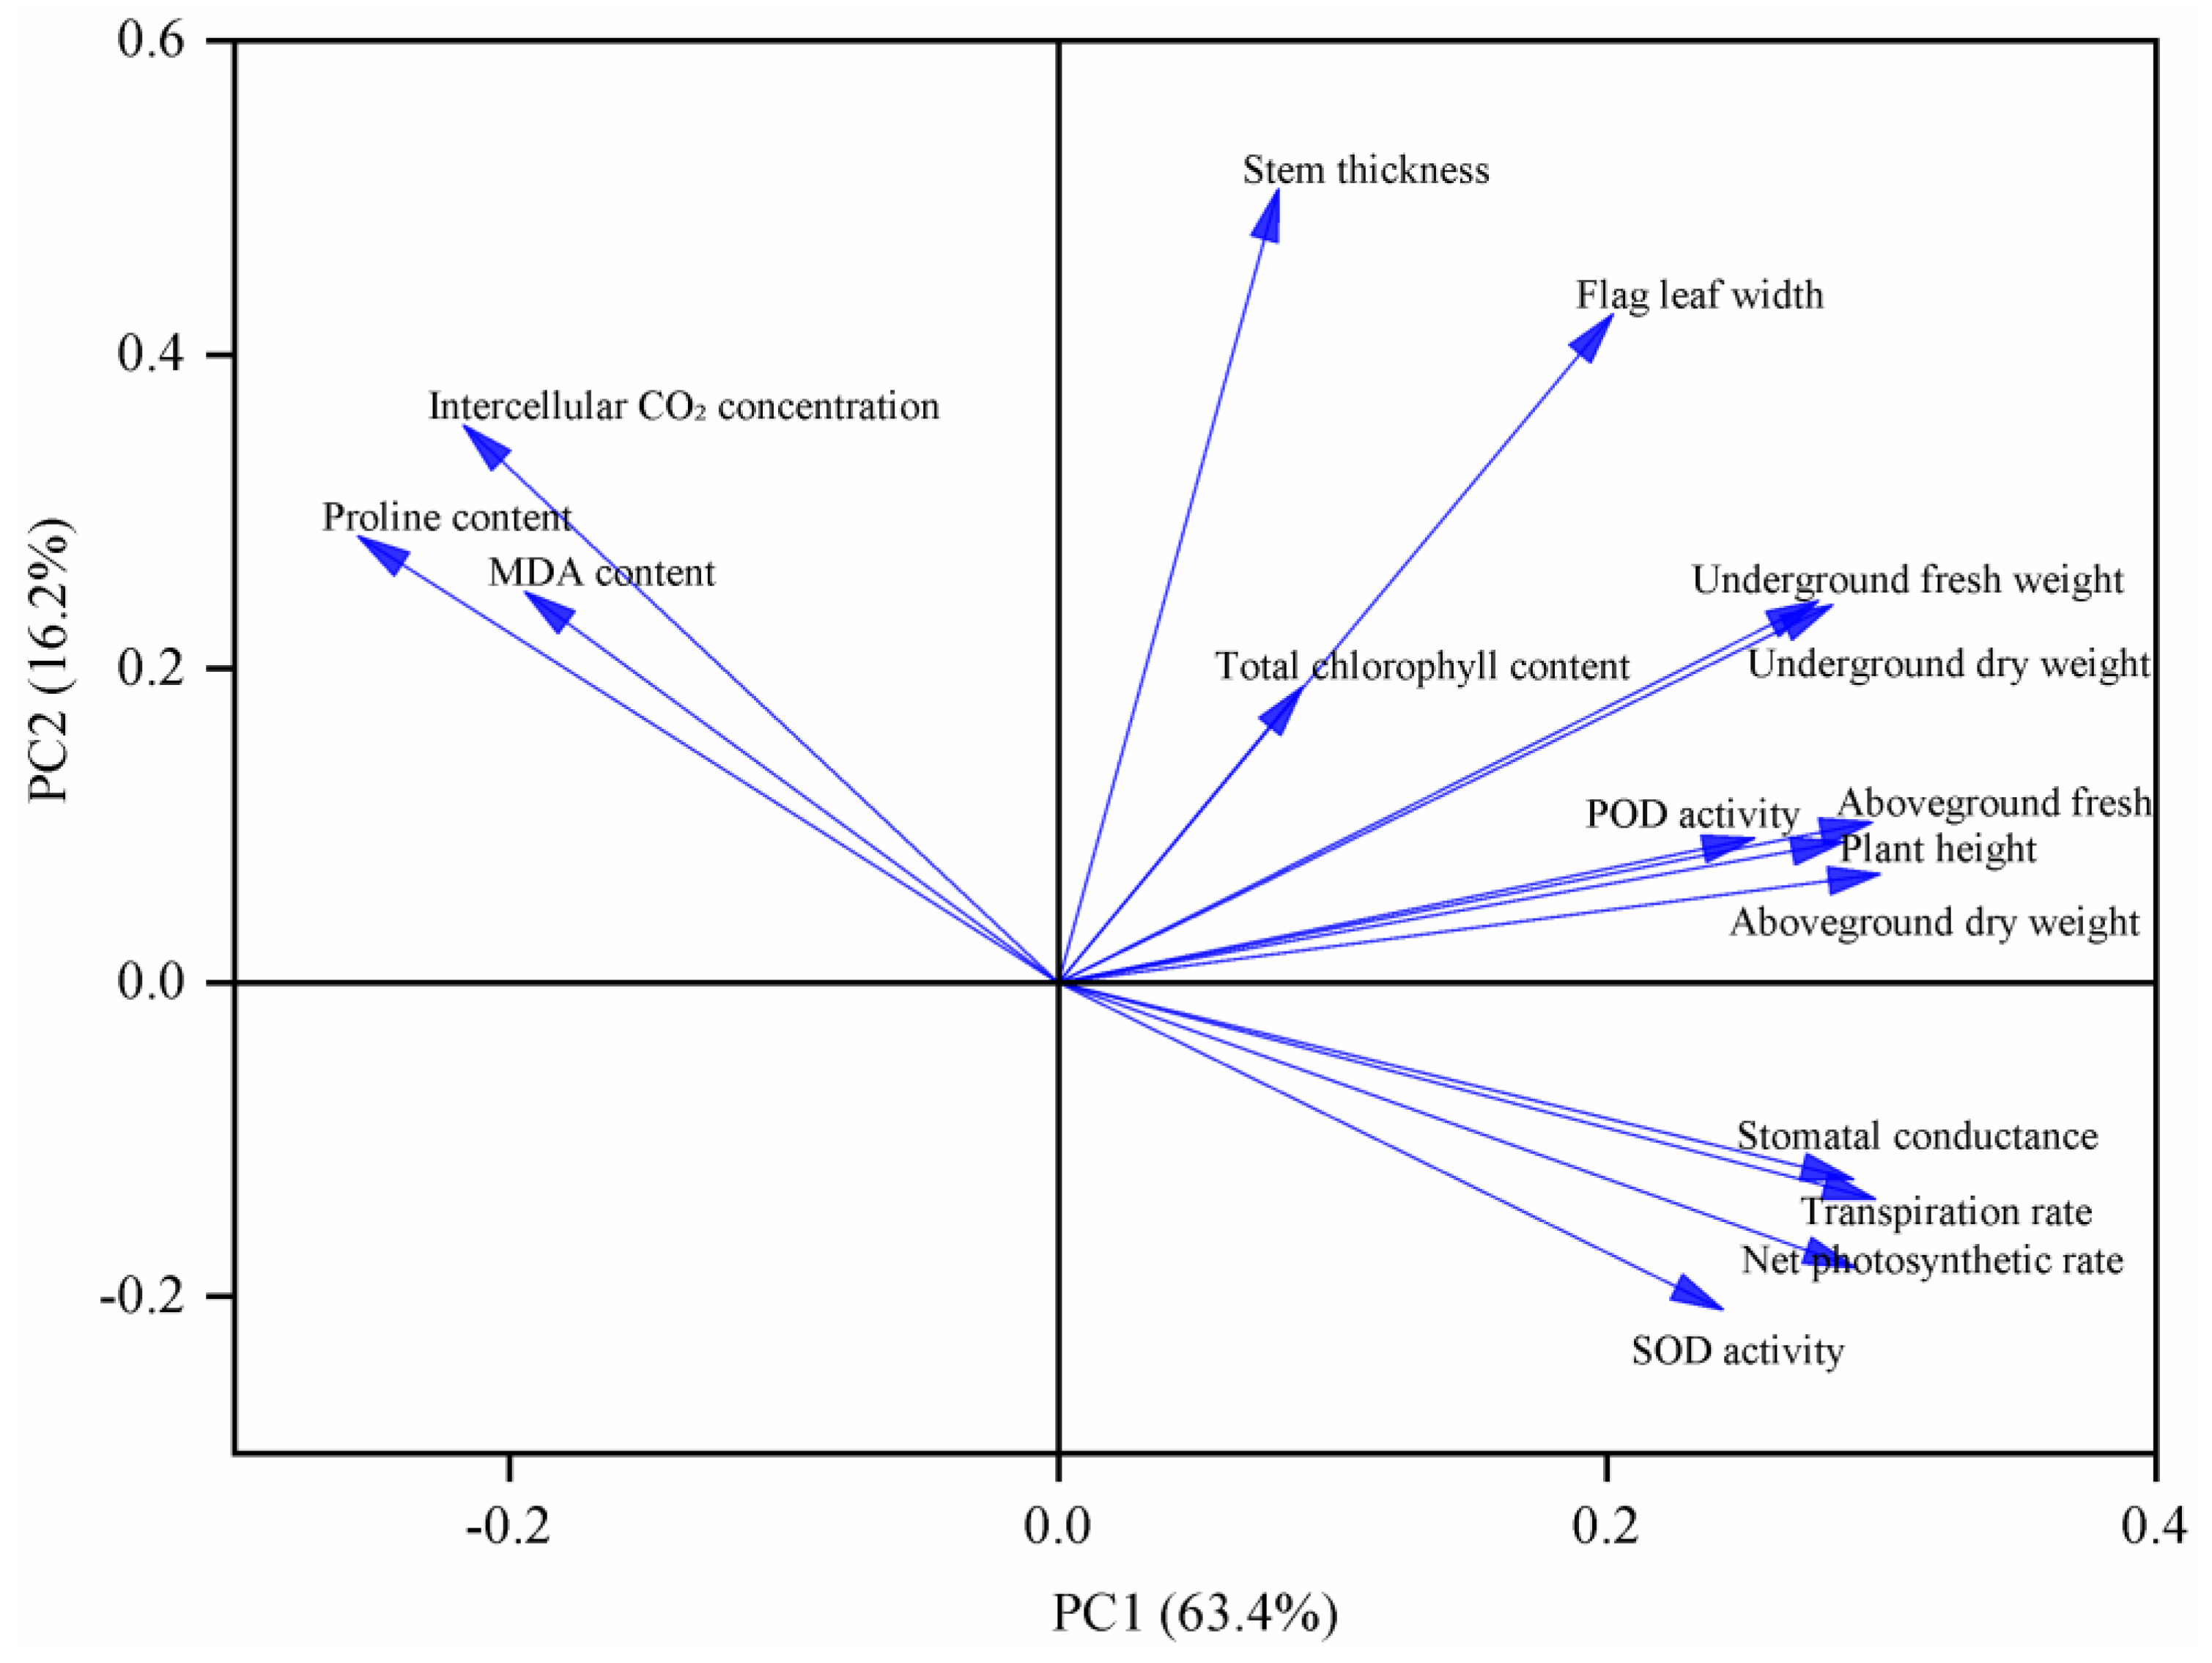
3.5. Principal Component Analysis

Principal component analysis (PCA) was conducted to determine the variance contribution of each variable for the four oat cultivars. The analysis revealed that the eigenvalues for the first three principal components exceeded 1, accounting for a cumulative contribution of 86.359% to the dataset (as detailed in Supplementary Tables S1 and S2). The analysis revealed that the first principal component (PC1) accounted for 63.4% of the total variance, while the second principal component (PC2) contributed an additional 16.2%. Collectively, these two components explained a substantial portion of the variance among the variables (Figure 8). On PC1, several agronomic indicators exhibited high positive loading values, indicating their strong positive correlation with this principal component. These indicators included plant height, aboveground fresh and dry weights, and belowground fresh and dry weights. These metrics collectively contributed significantly to the variance explained by PC1. Similarly, key photosynthetic indicators such as net photosynthetic rate, transpiration rate, and stomatal conductance also displayed high positive loading values on PC1. In contrast, other variables exhibited negative loading values on PC1, indicating an inverse relationship with the principal component. These variables included intercellular carbon dioxide concentration, malondialdehyde content, and proline content. On PC2, several key metrics exhibited high positive loading values, indicating their strong positive correlation with this principal component. These included flag leaf width, stem thickness, intercellular carbon dioxide concentration, proline content, and malondialdehyde (MDA) content. These variables collectively contributed significantly to the variance explained by PC2. Conversely, other physiological indicators displayed negative loading values on PC2, indicating an inverse relationship with the principal component. These variables included stomatal conductance, transpiration rate, net photosynthetic rate, and superoxide dismutase activity.

3.6. Correlation Analysis

Correlation analysis was conducted among various indices for four oat cultivars (Figure 9). Highly significant positive correlations (p < 0.01) were observed between plant height and flag leaf width, aboveground dry and fresh weights, underground dry and fresh weights, and between SOD and POD activities. Flag leaf width correlated positively with stem thickness, aboveground biomass (both dry and fresh weights), underground biomass (dry and fresh weights), and POD activity, and negatively with proline content (p < 0.01). Aboveground dry weight was positively correlated with underground biomass, SOD, and POD activities, and negatively with proline content (p < 0.01). Underground dry weight showed a positive correlation with POD activity (p < 0.01), a significant positive correlation with SOD activity (p < 0.05), and a negative correlation with proline content (p < 0.01). Chlorophyll content was positively correlated with net photosynthetic rate, transpiration rate, and stomatal conductance (p < 0.01). The net photosynthetic rate was highly significantly correlated with transpiration rate and stomatal conductance (p < 0.01). Transpiration rate also showed a highly significant positive correlation with stomatal conductance (p < 0.01). SOD and POD activities were highly significantly positively correlated (p < 0.01), while SOD showed a significant negative correlation with MDA content (p < 0.05) and a highly significant negative correlation with proline content (p < 0.01). Proline content was significantly positively correlated with MDA content (p < 0.05). Additionally, salt concentration showed significant negative correlations with plant height, aboveground and underground biomass, net photosynthetic rate, transpiration rate, stomatal conductance, SOD, and POD activities, and positive correlations with intercellular CO2 concentration, MDA, and proline content within a certain range (p < 0.05).

3.7. Affiliation Function Analysis

Trait indicator values were determined for four oat cultivars under salt stress, with the affiliation function’s D-value indicating salt tolerance. A D-value closer to 1 signifies superior salt tolerance, while a value near 0 indicates poor tolerance. As shown in Table 7, ‘Qinghai 444’ exhibited the highest salt tolerance at 50, 100, and 200 mmol concentrations, outperforming the other cultivars. In contrast, ‘Qingyin No. 3’ displayed the lowest salt tolerance. Assessing the overall performance across varying salt concentrations, the ranking of salt tolerance for the four cultivars was: ‘Qinghai 444’ > ‘Mengyan No. 1’ > ‘Baiyan No. 18’ > ‘Qingyin No. 3’.

4. Discussion

4.1. Effects of Different Salt Concentrations on Agronomic Traits and Physiological Characteristics in Covered Oats and Naked Oats

Plants under salt stress often mitigate the damage by adjusting morphological traits such as reduced plant height and leaf area [38]. Concurrently, they maintain growth by reallocating biomass among different organs [39]. Our findings align with previous research, showing that plant height, leaf number, and biomass generally decrease under salt stress [40]. In this study, all oat cultivars exhibited a significant reduction in plant height with increasing salt concentration. The dry and fresh weights of the aboveground parts of the oat cultivars were also reduced, with no significant biomass changes observed under low salt stress (50 mmol/L). However, a significant downward trend in biomass was noted under higher salt concentrations (100, 150, and 200 mmol/L), consistent with the notion that salt stress can diminish aboveground biomass [41]. Roots, being the initial site of salt toxicity, are critical for plant survival under saline conditions, as reflected by under-ground biomass [42]. This study revealed that the dry and fresh weights of the underground parts of the oat cultivars remained relatively stable under low salt concentrations (0 to 100 mmol/L). However, a significant decrease was observed at 150 and 200 mmol/L, suggesting that medium to high salt concentrations disrupt the normal growth and metabolic activities of the covered oats and naked oats root system, leading to a reduction in the dry and fresh weights of the underground parts of A. sativa and A. nuda. Furthermore, the data on aboveground dry weight and underground fresh weight revealed that severe salt stress at 200 mmol/L resulted in a more pronounced reduction in biomass for naked oats compared to covered oats. This observation could be attributed to the differential adaptability of these two oat types to the challenging conditions imposed by high salinity.
Salt stress impedes plant growth and elevates the intracellular accumulation of salt ions, which can disrupt chloroplast structure and reduce chlorophyll content [43]. Chlorophyll, a crucial component for photosynthesis, serves as a direct indicator of photosynthetic changes and stress-induced damage in plants [44]. The response of chlorophyll to salt stress varies among plant species. Some studies have indicated that low levels of salt stress can enhance chlorophyll accumulation in certain salt-tolerant plants, such as Suaeda glauca and Medicago sativa [45,46]. Conversely, increased salt stress has been shown to decrease chlorophyll content in plants, including oat, by inhibiting the synthesis of chlorophyll precursors [47]. Our study’s findings corroborate this trend, demonstrating a decline in chlorophyll content across all oat cultivars with escalating salt concentrations. This suggests that high salt stress may accelerate chlorophyll degradation in A. sativa and A. nuda, potentially impairing photosynthetic efficiency.
Plants under stress adapt to adverse conditions by modulating their physiological metabolism, which includes the synthesis of osmoregulatory substances and alterations in antioxidant enzyme activities [48]. Under salt stress, plants synthesize various osmoregulatory compounds to counteract the detrimental effects of the stress [49]. For instance, proline and soluble sugars help maintain high osmotic potential within plant cells. Proline, primarily found in its free form in plants, is a marker of salt tolerance, with its content reflecting the plant’s ability to withstand saline conditions [50]. Studies have shown a significant increase in proline content in wheat under salt stress [51]. Our findings align with these reports, demonstrating a rapid accumulation of free proline in covered oats and naked oats in response to salt stress. At low and moderate salt stress concentrations (50 and 100 mM), the proline content of the four oat cultivars exhibited relatively minor variations, ranging between 2% and 30%. However, at higher salt stress concentrations (150 and 200 mM), the proline content showed a more pronounced increase, with variations ranging from 83% to 1447%, suggesting that elevated proline levels can mitigate osmotic stress induced by salt ions to some extent. Variability in salt stress tolerance was observed among the oat cultivars. It is significant to observe that the enhancement in proline levels within the two covered oat cultivars, ‘Mengyan No. 1’ and ‘Qinghai 444’, exceeded that of the two naked oat cultivars, ‘Baiyan No. 18’ and ‘Qingyin No. 3’, under high salinity stress. This disparity implies that covered oats may possess a greater capacity for salt tolerance compared to their naked counterparts. Excessive salt ions in plants can lead to the production of reactive oxygen species (ROS), which can cause membrane lipid peroxidation in cell membranes. Enzymes such as SOD and POD play crucial roles in the ROS scavenging system, effectively mitigating oxidative damage induced by free radicals [52]. Studies have demonstrated that plants can enhance their salt tolerance by upregulating antioxidant enzyme activities. For example, Hordeum vulgare increases SOD activity in response to salt-damaging ions, and Leymus chinensis boosts both SOD and POD activities to reduce salt stress damage [53,54]. Our study’s findings revealed that at salt concentrations below 100 mM, the activities of SOD and POD in all oat cultivars increased compared to the control. However, at higher salt concentrations (150 and 200 mM), the activities of these enzymes decreased. This trend is consistent with previous research [55], suggesting that covered oats and naked oats may modulate antioxidant enzyme activities under low salt stress to alleviate cellular damage. Nevertheless, high salt stress might disrupt the antioxidant enzyme regulatory mechanisms in covered oats and naked oats. MDA, a product of membrane lipid peroxidation, serves as a key indicator of the extent of cell membrane peroxidation and the degree of plasma membrane disruption [56]. Our results showed that the MDA content in all oat cultivars increased significantly with rising salt concentrations. There was also significant variation in MDA content among the different cultivars, with ‘Qingyin No. 3’ (naked oat) exhibiting the highest MDA content. This suggests that this cultivar experienced the most severe membrane lipid peroxidation under high salt stress conditions.

4.2. Effects of Salt Stress on the Cellular Structure of Leaves of in Covered Oats and Naked Oats

The anatomical features (including cell structure and tissue arrangement) of plant leaves are critical for understanding how plants adapt to stress. These features can reflect changes in leaf morphology (such as leaf thickness and leaf area), as well as alterations in physiological and metabolic processes (such as photosynthesis and ion balance) in plant stress tolerance research [36,37]. For example, salt stress has been shown to significantly reduce both leaf area and stomatal density in Solanum lycopersicum [57], and similarly, Stylosanthes humilis experiences a significant reduction in leaf area with noticeable leaf damage under salt stress [58]. Salt stress is also known to cause a reduction in epidermal cell number and size, as well as distortions in mesophyll cell morphology. Studies on Lycium barbarum have demonstrated that low salt concentrations can promote increases in leaf length and width, while high concentrations lead to an increase in leaf thickness, with the contribution of fenestrated chloroplastic tissue to leaf thickness being greater than that of spongy chloroplastic tissue [59]. In wheat plants, adaptation to salt stress involves changes in leaf and stem anatomy, including reductions in stem and leaf diameter, wall thickness, and vascular bundle characteristics [60]. Scanning electron microscopy of Bruguiera parviflora leaves under salt stress revealed reductions in stomatal area, epidermal and sarcolemmal thickness, and cellular interstitial space, which may contribute to decreased stomatal and sarcolemmal conductance [61]. Our study’s findings are consistent with these observations. Under 100 mmol/L salt stress, the volume of chloroplasts and epidermal cells in covered oats and naked oats was reduced, but the internal cell structures remained distinguishable. The vascular bundles in all oat cultivars were reduced in area but appeared more compact. These results suggest that A. sativa and A. nuda can maintain photosynthetic areas and enhance transpiration to safeguard normal physiological activities by strengthening intercellular connectivity under moderate salt stress. However, at higher salt concentrations (200 mmol/L), we observed a significant reduction in chloroplast number, cellular deformation, and apparent water loss, leading to increased cell gaps and severe mesophyll cell damage, with signs of cavitation in all samples.
Previous research has demonstrated that, despite morphological resemblances, SSR molecular marker analyses reveal substantial genetic disparities between covered oats and naked oats [62]. Current comparative studies on covered and naked oats predominantly concentrate on yield and quality assessments, with a relative scarcity of research examining stress tolerance between the two [63,64]. The seed yield of covered and naked oats is likely influenced by the cultivar selected and the cultivation region [63,64]. Naked oats are recognized for their superior feed value, whereas covered oats exhibit greater resistance to lodging [63,64,65]. Under intensified herbicide applications, covered oats exhibit a reduced decline in net photosynthetic rate and an enhanced increase in water use efficiency compared to naked oats, suggesting a higher herbicide resistance in covered oats [66]. During germination, covered oat seeds display greater salt tolerance than naked oat seeds, potentially due to the protective seed coat of covered oats that mitigates abiotic stress damage [67]. Similarly, seed viability in naked oats is more adversely affected by extended storage times than in covered oats [68]. However, recent studies indicate that covered oat seeds are more susceptible to high-temperature stress compared to naked oats [69]. Under low-temperature conditions, naked oats exhibit higher activities of POD, SOD, and catalase (CAT) than covered oats, conferring a greater low-temperature tolerance to naked oats [70]. This variability may stem from the distinct response mechanisms of oats to temperature stress as opposed to other forms of stress.

5. Conclusions

In conclusion, our research has demonstrated that salt stress profoundly inhibits growth and disrupts the physiological and metabolic processes in A. sativa and A. nuda. This was manifested through a reduction in biomass, a decline in photosynthetic efficiency within the leaves, and cellular structural damage. The cultivars tested exhibited tolerance to low and moderate salt treatments, indicating an adaptive capacity to saline conditions. However, under high salt stress, the adversity response system of A. sativa and A. nuda was severely compromised, highlighting the threshold of their salt tolerance. Upon integrating the data from various indicators, it becomes evident that the two covered oat cultivars exhibited superior salt tolerance compared to the two naked oat cultivars. Its robust performance under saline conditions positions ‘Qinghai 444’ as a promising candidate for use as salt-tolerant germplasm, offering a valuable resource for the enhancement of saline and alkaline land.

Supplementary Materials

The following supporting information can be downloaded at: https://www.mdpi.com/article/10.3390/agronomy15030594/s1, Table S1: Eigenvalues, contributions, and accumulative contribution of the principal components for A. sativa and A. nuda under salt stress. Table S2: Factor loading matrix of the first three principal components in four oat cultivars under salt stress.

Author Contributions

Conceptualization, J.Z. and Y.Z.; methodology, C.Y., and Y.Z.; software, D.P. and C.Y.; validation, C.Y.; formal analysis, D.P. and J.Z.; investigation, P.W. and Y.Z.; resources, P.W. and Q.Z.; data curation, J.Z.; writing—original draft preparation, J.Z. and D.P.; writing—review and editing, J.Z. and Y.Z.; visualization, D.P.; supervision, P.W. and Q.Z.; project administration, Y.Z.; funding acquisition, J.Z. and Q.Z. All authors have read and agreed to the published version of the manuscript.

Funding

This research was funded by the National Natural Science Foundation of China (No. 32201452), Sichuan Science and Technology Program (2024NSFSC0310), Southwest Minzu University Double World-Class Project (No. CX2023006), the Fundamental Research Funds for the Central Universities, Southwest Minzu University (No. ZYN2024012), The Open Project of Key Laboratory of the Alpine Grassland Ecology in the Three Rivers Region (Qinghai University), Ministry of Education (No. 2023-SJY-KF-03), the Southwest Minzu University Research Startup Funds (No. RQD2021094), The Open Project of State Key Laboratory of Plateau Ecology and Agriculture, Qinghai University (2024-ZZ-16). The APC was funded by the National Natural Science Foundation of China (No. 32201452).

Data Availability Statement

The data that support the findings of this study are available from the corresponding author upon request.

Conflicts of Interest

The authors declare no conflicts of interest.

References

  1. Shahid, M.; Akram, M.S.; Khan, M.A.; Zubair, M.; Shah, S.M.; Ismail, M.; Shabir, G.; Basheer, S.; Aslam, K.; Tariq, M. A phytobeneficial strain Planomicrobium sp. MSSA-10 triggered oxidative stress responsive mechanisms and regulated the growth of pea plants under induced saline environment. J. Appl. Microbiol. 2018, 124, 1566–1579. [Google Scholar] [CrossRef] [PubMed]
  2. Nachshon, U. Cropland soil salinization and associated hydrology: Trends, processes and examples. Water 2018, 10, 1030. [Google Scholar] [CrossRef]
  3. Butcher, K.; Wick, A.F.; DeSutter, T.; Chatterjee, A.; Harmon, J. Soil salinity: A threat to global food security. Agron. J. 2016, 108, 2189–2200. [Google Scholar] [CrossRef]
  4. Fang, S.; Hou, X.; Liang, X. Response mechanisms of plants under saline-alkali stress. Front. Plant Sci. 2021, 12, 667458. [Google Scholar] [CrossRef]
  5. Bartels, D.; Sunkar, R. Drought and salt tolerance in plants. Crit. Rev. Plant Sci. 2005, 24, 23–58. [Google Scholar] [CrossRef]
  6. Afzal, M.; Hindawi, S.E.S.; Alghamdi, S.S.; Migdadi, H.H.; Khan, M.A.; Hasnain, M.U.; Arslan, M.; Rahman, M.H.; Sohaib, M. Potential breeding strategies for improving salt tolerance in crop plants. J. Plant Growth Regul. 2023, 42, 3365–3387. [Google Scholar] [CrossRef]
  7. Shi, D.; Sheng, Y. Effect of various salt–alkaline mixed stress conditions on sunflower seedlings and analysis of their stress factors. Environ. Exp. Bot. 2005, 54, 8–21. [Google Scholar] [CrossRef]
  8. Krishnamurthy, S.L.; Gautam, R.K.; Sharma, P.C.; Sharma, D.K. Effect of different salt stresses on agro-morphological traits and utilisation of salt stress indices for reproductive stage salt tolerance in rice. Field Crops Res. 2016, 190, 26–33. [Google Scholar] [CrossRef]
  9. Park, H.J.; Kim, W.Y.; Yun, D.J. A New Insight of Salt Stress Signalingin Plant. Mol. Cells 2016, 39, 447–459. [Google Scholar] [CrossRef]
  10. Van Zelm, E.; Zhang, Y.; Testerink, C. Salt tolerance mechanisms of plants. Annu. Rev. Plant Biol. 2020, 71, 403–433. [Google Scholar] [CrossRef]
  11. Tester, M.; Davenport, R. Na+ tolerance and Na+ transport in higher plants. Ann. Bot. 2003, 91, 503–527. [Google Scholar] [CrossRef] [PubMed]
  12. Udomchalothorn, T.; Plaimas, K.; Sripinyowanich, S.; Boonchai, C.; Kojonna, T.; Chutimanukul, P.; Comai, L.; Buaboocha, T.; Chadchawan, S. OsNucleolin1-L expression in Arabidopsis enhances photosynthesis via transcriptome modification under salt stress conditions. Plant Cell Physiol. 2017, 58, 717–734. [Google Scholar] [CrossRef] [PubMed]
  13. He, J.; Yang, W.; Qin, L.; Fan, D.Y.; Chow, W.S. Photoinactivation of Photosystem II in wild-type and chlorophyll b-less barley leaves: Which mechanism dominates depends on experimental circumstances. Photosynth. Res. 2015, 126, 399–407. [Google Scholar] [CrossRef]
  14. Hao, S.H.; Wang, Y.R.; Yan, Y.X.; Liu, Y.H.; Wang, J.Y.; Chen, S. A review on plant responses to salt stress and their mechanisms of salt resistance. Horticulturae 2021, 7, 132–161. [Google Scholar] [CrossRef]
  15. Munns, R.; Tester, M. Mechanisms of salinity tolerance. Annu. Rev. Plant Biol. 2008, 59, 651–681. [Google Scholar] [CrossRef]
  16. Guo, R.; Shi, L.X.; Yan, C.R.; Zhong, X.L.; Gu, F.X.; Liu, Q.; Xia, X.; Li, H.R. Ionomic and metabolic responses to neutral salt or alkaline salt stresses in maize (Zea mays L.) seedlings. BMC Plant Biol. 2017, 17, 1–13. [Google Scholar] [CrossRef]
  17. Munns, R. Physiological processes limiting plant growth in saline soils: Some dogmas and hypotheses. Plant Cell Environ. 1993, 16, 15–24. [Google Scholar] [CrossRef]
  18. Liu, J.G.; Han, X.; Yang, T.; Cui, W.H.; Wu, A.M.; Fu, C.X.; Wang, B.C.; Liu, L.J. Genome-wide transcriptional adaptation to salt stress in Populus. BMC Plant Biol. 2019, 19, 1–14. [Google Scholar] [CrossRef]
  19. Zolla, G.; Heimer, Y.M.; Barak, S. Mild salinity stimulates a stress-induced morphogenic response in Arabidopsis thaliana roots. J. Exp. Bot. 2010, 61, 211–224. [Google Scholar] [CrossRef]
  20. Dou, L.; He, K.; Higaki, T.; Wang, X.; Mao, T. Ethylene signaling modulates cortical microtubule reassembly in response to salt stress. Plant Physiol. 2018, 176, 2071–2081. [Google Scholar] [CrossRef]
  21. Läuchli, A.; Grattan, S.R. Plant growth and development under salinity stress. In Advances in Molecular Breeding Toward Drought and Salt Tolerant Crops, 1st ed.; Jenks, M.A., Hasegawa, P.M., Jain, S.M., Eds.; Springer: Dordrecht, The Netherlands, 2007; pp. 1–32. [Google Scholar]
  22. Alhilfi, S.K. Response of two varieties of oat plant (Avena sativa L.) to different levels of nitrogen fertilizer. Int. J. Agric. Stat. Sci. 2020, 16, 665–670. [Google Scholar]
  23. Ye, X.L.; Gan, Z.; Wan, Y.; Xiang, D.B.; Wu, X.Y.; Wu, Q.; Liu, C.Y.; Fan, Y.; Zou, L. Advances and perspectives in forage oat breeding. Acta Pratacult. Sin. 2023, 32, 160–177. [Google Scholar]
  24. Ahmed, S.; Patel, R.; Rana, M.; Kumar, N.; Choudhary, M.; Chand, S.; Singh, A.K.; Ghosh, A.; Singhal, R.K. Effect of salt, alkali and combined stresses on root system architecture and ion profiling in a diverse panel of oat (Avena spp.). Funct. Plant Biol. 2023, 51, 1–16. [Google Scholar]
  25. Brenes, M.; Solana, A.; Boscaiu, M.; Fita, A.; Vicente, O.; Calatayud, Á.; Prohens, J.; Plazas, M. Physiological and biochemical responses to salt stress in cultivated eggplant (Solanum melongena L.) and in S. insanum L., a close wild relative. Agronomy 2020, 10, 651–669. [Google Scholar]
  26. Xiao, X.L.; Duan, B.; Huang, F.Y.; Zhi, X.M.; Jiang, Z.; Ma, N. Analysis of canopy light utilization efficiency in high-yielding rapeseed varieties. Sci. Rep. 2024, 14, 31243–31255. [Google Scholar] [CrossRef]
  27. Wang, X.X.; Fang, Z.W.; Zhao, D.Q.; Tao, J. Effects of high-temperature stress on photosynthetic characteristics and antioxidant enzyme system of Paeonia ostii. Phyton-Int. J. Exp. Bot. 2022, 91, 599–615. [Google Scholar] [CrossRef]
  28. Ma, N.N.; Zuo, Y.Q.; Liang, X.Q.; Yin, B.; Wang, G.D.; Meng, Q.W. The multiple stress-responsive transcription factor SlNAC1 improves the chilling tolerance of tomato. Physiol. Plant. 2013, 149, 474–486. [Google Scholar] [CrossRef]
  29. Jiao, J.; Ma, Y.; Chen, S.; Liu, C.; Song, Y.; Yin, Y.; Yuan, C.; Liu, Y. Melatonin-producing endophytic bacteria from grapevine roots promote the abiotic stress-induced production of endogenous melatonin in their hosts. Front. Plant Sci. 2016, 7, 1387. [Google Scholar] [CrossRef]
  30. Yaqoob, H.; Akram, N.A.; Iftikhar, S.; Ashraf, M.; Khalid, N.; Sadiq, M.; Alyemeni, M.N.; Wijaya, L.; Ahmad, P. Seed pretreatment and foliar application of proline regulate morphological, physio-biochemical processes and activity of antioxidant enzymes in plants of two cultivars of quinoa (Chenopodium quinoa Willd.). Plants 2019, 8, 588–604. [Google Scholar] [CrossRef]
  31. Chen, X.R.; Gao, Z.H.; Li, Y.Y.; Nie, X.Q.; Xie, Q.L.; Chen, G.P.; Hu, Z.L. Knockdown of SlYTHDF2 Accelerates Dark–Induced Tomato Leaf Senescence by Affecting the ABA Pathway. Plants 2024, 13, 2800–2818. [Google Scholar] [CrossRef]
  32. Wu, J.Q.; Shu, S.; Li, C.C.; Sun, J.; Guo, S.R. Spermidine-mediated hydrogen peroxide signaling enhances the antioxidant capacity of salt-stressed cucumber roots. Plant Physiol. Bioch. 2018, 128, 152–162. [Google Scholar] [CrossRef] [PubMed]
  33. Zhao, Y.; Wang, G.L.; Liu, M.; Xue, H.T.; Zhao, P.Y.; Han, B.S.; Fan, H.P.; Wang, R.; Wang, L.X.; Guo, E.H.; et al. Study on improving yield and antioxidant enzyme activities in millet by rationing molybdenum and nitrogen. Front. Plant Sci. 2025, 15, 1524347–1524359. [Google Scholar] [CrossRef] [PubMed]
  34. Pan, X.J.; Jiang, X.Y.; Wen, J.L.; Huang, M.H.; Wang, Y.Q.; Wang, M.; Dong, H.; Liu, Q.P. Disruption of the Expression of the Cinnamoyl–CoA Reductase (CCR) Gene OsCCR18 Causes Male Sterility in Rice (Oryza sativa L. japonica). Agriculture 2022, 12, 1685–1697. [Google Scholar] [CrossRef]
  35. Meng, C.; Lu, X.L.; Song, Y.R.; Zhang, C.S.; Li, Y.Q.; Xiang, H.Q.; Xu, Z.C. Evaluation and identification of salt tolerance of 11 Leonurus germplasm lines at the seedling stage. Acta Pratacult. Sin. 2024, 33, 196–203. [Google Scholar]
  36. Nakayama, H. Leaf form diversity and evolution: A never-ending story in plant biology. J. Plant Res. 2024, 137, 547–560. [Google Scholar] [CrossRef]
  37. Tholen, D.; Boom, C.; Zhu, X.G. Opinion: Prospects for improving photosynthesis by altering leaf anatomy. Plant Sci. 2012, 197, 92–101. [Google Scholar] [CrossRef]
  38. Acosta-Motos, J.R.; Ortuño, M.F.; Bernal-Vicente, A.; Diaz-Vivancos, P.; Sanchez-Blanco, M.J.; Hernandez, J.A. Plant responses to salt stress: Adaptive mechanisms. Agronomy 2017, 7, 18. [Google Scholar] [CrossRef]
  39. Bhatla, S.C.; Gogna, M.; Jain, P.; Singh, N.; Mukherjee, S.; Kalra, G. Signaling mechanisms and biochemical pathways regulating pollen-stigma interaction, seed development and seedling growth in sunflower under salt stress. Plant Signal. Behav. 2021, 16, 1958129. [Google Scholar] [CrossRef]
  40. Liu, B.; Kang, C.; Wang, X.; Bao, G. Physiological and morphological responses of Leymus chinensis to saline-alkali stress. Grassland Sci. 2015, 61, 217–226. [Google Scholar] [CrossRef]
  41. Wei, J.N. Effect of Silicon Fertilizer on the Growth and Development of Early Grassland Under Salt Stress. Master’s Thesis, Lanzhou University, Lanzhou, China, 2016. [Google Scholar]
  42. Rosas, U.; Lara-González, J.A.; De-la-Rosa-Tilapa, A.; Terrazas, T. Persistent adventitious and basal root development during salt stress tolerance in Echinocactus platyacanthus (Cactaceae) seedlings. J. Arid Environ. 2021, 187, 104431. [Google Scholar] [CrossRef]
  43. Gu, J.J.; Hu, B.W.; Jia, Y.; Sha, H.J.; Li, J.W.; Ma, C.; Zhao, H.W. Effects of salt stress on root related traits and yield of rice. Crop 2019, 4, 176–182. [Google Scholar]
  44. Guo, H.J.; Hu, T.; Fu, J.M. Effects of saline sodic stress on growth and physiological responses of Lolium perenne. Acta Pratacult. Sin. 2012, 21, 118–125. [Google Scholar]
  45. Lu, C.; Qiu, N.; Lu, Q.; Wang, B.; Kuang, T. Does salt stress lead to increased susceptibility of photosystem II to photoinhibition and changes in photosynthetic pigment composition in halophyte Suaeda salsa grown outdoors? Plant Sci. 2002, 163, 1063–1068. [Google Scholar] [CrossRef]
  46. Winicov, I.; Button, J.D. Accumulation of photosynthesis gene transcripts in response to sodium chloride by salt-tolerant alfalfa cells. Planta 1991, 183, 478–483. [Google Scholar] [CrossRef]
  47. Ma, X.; Jia, Z.F.; Liu, Y. Study on photosynthesis and chlorophyll metabolism of Avena sativa L. under salt stress. Chin. Qinghai J. Animal Vet. Sci. 2021, 51, 7–14. [Google Scholar]
  48. Wang, M.M.; Zhou, X.R.; Liang, G.L.; Zhao, G.Q.; Jiao, R.A.; Chai, J.K.; Gao, X.M.; Li, J.N. A multi-trait evaluation of salt tolerance of 5 oat germplasm lines at the seedling stage. Acta Pratacult. Sin. 2020, 29, 143–154. [Google Scholar]
  49. Shabala, S.; Mackay, A. Ion transport in halophytes. Adv. Bot. Res. 2011, 57, 151–199. [Google Scholar]
  50. Khedr, R.A.; Sorour, S.G.R.; Aboukhadrah, S.H.; El Shafey, N.M.; Abd Elsalam, H.E.; El-Sharnouby, M.E.; El-Tahan, A.M. Alleviation of salinity stress effects on agro-physiological traits of wheat by auxin, glycine betaine, and soil additives. Saudi J. Biol. Sci. 2022, 29, 534–540. [Google Scholar] [CrossRef]
  51. El-Shintinawy, F.; El-Shourbagy, M.N. Alleviation of changes in protein metabolism in NaCl-stressed wheat seedlings by thiamine. Biol. Plant. 2001, 44, 541–545. [Google Scholar] [CrossRef]
  52. Zhao, Y.; Wei, X.H.; He, Y.L.; Zhao, X.F.; Han, T.; Yue, K.; Xin, X.Q.; Su, M.F.; Ma, W.J.; Luo, Q.J. Effects of complex saline-alkali stress on seed germination and seedling antioxidant characteristics of Chenopodium quinoa. Acta Pratacult. Sin. 2019, 28, 156–167. [Google Scholar]
  53. Acar, O.K.A.N.; Türkan, I.; Özdemir, F. Superoxide dismutase and peroxidase activities in drought sensitive and resistant barley (Hordeum vulgare L.) varieties. Acta Physiol. Plant. 2001, 23, 351–356. [Google Scholar] [CrossRef]
  54. Liu, B.S.; Kang, C.L.; Wang, X.; Bao, G.Z. Physiological and biochemical response characteristics of Leymus chinensis to saline-alkali stress. Trans. Chin. Soc. Agric. Eng. 2014, 30, 166–173. [Google Scholar]
  55. Ji, X.; Tang, J.; Zhang, J. Effects of salt stress on the morphology, growth and physiological parameters of Juglans microcarpa L. seedlings. Plants 2022, 11, 2381. [Google Scholar] [CrossRef] [PubMed]
  56. Liu, J.J.; Lin, S.H.; Xu, P.L.; Wang, X.J.; Bai, J.G. Effects of exogenous silicon on the activities of antioxidant enzymes and lipid peroxidation in chilling-stressed cucumber leaves. Agric. Sci. China 2009, 8, 1075–1086. [Google Scholar] [CrossRef]
  57. Romero-Aranda, R.; Soria, T.; Cuartero, J. Tomato plant-water uptake and plant-water relationships under saline growth conditions. Plant Sci. 2001, 160, 265–272. [Google Scholar] [CrossRef]
  58. Lovato, M.B.; de Lemos Filho, J.P.; Martins, P.S. Growth responses of Stylosanthes humilis (Fabaceae) populations to saline stress. Environ. Exp. Bot. 1999, 41, 145–153. [Google Scholar] [CrossRef]
  59. Yao, X.C.; Meng, L.F.; Zhao, W.L.; Mao, G.L. Changes in the morphology traits, anatomical structure of the leaves and transcriptome in Lycium barbarum L. under salt stress. Front. Plant Sci. 2023, 14, 1090366. [Google Scholar] [CrossRef]
  60. Nassar, R.M.; Kamel, H.A.; Ghoniem, A.E.; Alarcón, J.J.; Sekara, A.; Ulrichs, C.; Abdelhamid, M.T. Physiological and anatomical mechanisms in wheat to cope with salt stress induced by seawater. Plants 2020, 9, 237. [Google Scholar] [CrossRef]
  61. Parida, A.K.; Das, A.B.; Mittra, B. Effects of salt on growth, ion accumulation, photosynthesis and leaf anatomy of the mangrove, Bruguiera parviflora. Trees 2004, 18, 167–174. [Google Scholar] [CrossRef]
  62. Pipan, B.; Sinkovič, L.; Rutar, R.; Meglič, V. The use of DNA markers for genetic differentiation of common (Avena sativa L.) and naked oat (Avena nuda L.). J. Cent. Eur. Agric. 2021, 22, 329–340. [Google Scholar] [CrossRef]
  63. Ta, N.; Lu, X.P.; Zhang, Y.H.; Zhang, X.Y.; Xue, C.L.; Zhao, W.G. Character performance and genetic diversity of Avena sativa and naked oat. Inn. Mong. Agric. Sci. Technol. 2010, 38, 33–35. [Google Scholar]
  64. Zhao, S.F.; Cao, L.X.; Zhang, L.J.; Wu, Y.Z.; Li, Y.X. Quality and yield of different types of oat bred varieties. J. Hebei Agric. Sci. 2012, 16, 58–61. [Google Scholar]
  65. Wang, Q.; Li, Z.J.; Li, J.; Zhou, B.W. Evaluation of agronomic and forage quality traits of a range of oat cultivars. Acta Pratacult. Sin. 2019, 28, 149–158. [Google Scholar]
  66. Liu, H.; Mu, P.; Zhao, G.Q.; Zhou, X.R. The impact of herbicides concentrations on photosynthetic characters and production of covered and naked oat. Agric. Res. Arid Areas 2017, 35, 124–133. [Google Scholar]
  67. Tao, J.; Hou, L.Y.; Yang, J.; Song, S.H.; Bai, W.M.; Pan, Q.M.; Yin, S.Y.; Hao, J.X.; Zhang, W.H. Comparative studies on seed germination characteristics and indicators of oat varieties under salt stress. Pratacult. Sci. 2018, 35, 2414–2421. [Google Scholar]
  68. Yao, R.R.; Liu, H.; Zhao, G.Q.; Wang, J.L.; Wang, Q.Y.; Dong, K.; Zhang, R. Effects of seed storage time on seed germination and cytological structure of covered oats and naked oats. Acta Pratacult. Sin. 2024, 33, 154–163. [Google Scholar]
  69. Yao, R.; Liu, H.; Wang, J.; Shi, S.L.; Zhao, G.Q.; Zhou, X.R. Cytological structures and physiological and biochemical characteristics of covered oat (Avena sativa L.) and naked oat (Avena nuda L.) seeds during high-temperature artificial aging. BMC Plant Biol. 2024, 24, 530–542. [Google Scholar] [CrossRef]
  70. Nesterova, N.; Pareniuk, O.; Illienko, V.; Ruban, Y.; Shpyrka, N.; Shavanova, K. Physiological reactions in cereals family Avena sativa L. and Avena nuda L., caused by low-temperature stress factors. In Proceedings of the 2019 IEEE 39th International Conference on Electronics and Nanotechnology (ELNANO), Kyiv, Ukraine, 16–18 April 2019; pp. 502–506. [Google Scholar]
Figure 1. Phenotypic responses of four oat cultivars to different concentrations of salt stress after 7 days of treatment. From left to right: Hogland nutrient solution without added NaCl (control), and solutions with NaCl concentrations of 50 mM, 100 mM, 150 mM, and 200 mM, respectively.
Agronomy 15 00594 g001
Figure 2. Trend lines show the linear regressions of plant height (A), aboveground fresh weight (B), and aboveground dry weight (C) against salt concentrations. Each dot represents the mean value of the corresponding indicator for a specific oat cultivar at a given salt concentration. ** Represent p < 0.01.
Agronomy 15 00594 g002
Figure 3. Trend lines show the linear regressions of net photosynthetic rate (A), transpiration rate (B), and stomatal conductance (C) against salt concentrations. Each dot represents the mean value of the corresponding indicator for a specific oat cultivar at a given salt concentration. ** Represent p < 0.01.
Agronomy 15 00594 g003
Figure 4. Trend lines show the linear regression of POD activity against salt concentrations. Each dot represents the mean value of the corresponding indicator for a specific oat cultivar at a given salt concentration. ** Represent p < 0.01.
Agronomy 15 00594 g004
Figure 5. Microstructure of oat leaves without salt stress treatment. (A): ‘Qinghai 444’, (B): ‘Baiyan No. 18’, (C): ‘Mengyan No. 1’, (D): ‘Qingyin No. 3’, UE: upper epidermis, LE: lower epidermis, BC: bulliform cell, VB: vascular bundle, PH: phloem, XY: xylem, the same as below.
Agronomy 15 00594 g005
Figure 6. Effect of treatment with a salt concentration of 100 mmol/L on the microstructure of oat leaves. (A): ‘Qinghai 444’, (B): ‘Baiyan No. 18’, (C): ‘Mengyan No. 1’, (D): ‘Qingyin No. 3’.
Agronomy 15 00594 g006
Figure 7. Effect of treatment with a salt concentration of 200 mmol/L on the microstructure of oat leaves. (A): ‘Qinghai 444’, (B): ‘Baiyan No. 18’, (C): ‘Mengyan No. 1’, (D): ‘Qingyin No. 3’.
Agronomy 15 00594 g007
Figure 8. Principal component analysis of four oat cultivars under different salt concentrations. PC1 is represented on the X-axis, while PC2 is represented on the Y-axis.
Agronomy 15 00594 g008
Figure 9. Correlation analysis between various indexes of oat under salt stress. Abbreviation of the corresponding indicators are shown in Table 1, Table 2, Table 3, Table 4, Table 5 and Table 6, CC: total chlorophyll content.
Agronomy 15 00594 g009
Table 1. Two-way ANOVAs for the effects of cultivar, salt concentration, and their interaction on agronomic traits and biomass of oats.
FactorCultivar Salt ConcentrationCultivar × Salt Concentration
f Valuep Valuef Valuep Valuef Valuep Value
PH60.233<0.001 **123.000<0.001 **4.585<0.001 **
FLW37.619<0.001 **8.271<0.001 **0.8650.587 NS
ST62.248<0.001 **2.1860.088 NS2.6070.012 *
ADW109.238<0.001 **182.773<0.001 **3.7200.001 **
AFW244.916<0.001 **473.233<0.001 **11.036<0.001 **
UDW423.462<0.001 **262.951<0.001 **4.981<0.001 **
UFW428.159<0.001 **219.124<0.001 **7.860<0.001 **
Note: PH, plant height; FLW, flag leaf width; ST, stem thick; ADW, aboveground dry weight; AFW, aboveground fresh weight; UDW, underground dry weight; UFW, underground fresh weight. * represent p < 0.05, ** represent p < 0.01, NS represent p > 0.05.
Table 2. Comparative analysis of agronomic traits in four oat cultivars across different salt concentrations. Different capital letters indicate significant differences among different cultivars under the same concentration treatment (p < 0.05). Different lowercase letters indicate significant differences among different concentration treatments on the same cultivar (p < 0.05). Abbreviation of the corresponding indicators are shown in Table 1.
TraitSalt Concentration (mM)Cultivar
Qinghai 444Baiyan No. 18Mengyan No. 1Qingyin No. 3
PH (cm)064.57 ± 3.51 Aa54.50 ± 0.79 Ba64.07 ± 3.27 Aa53.13 ± 1.88 Ba
5059.20 ± 3.49 Aab52.87 ± 0.55 Bab59.13 ± 1.00 Ab52.70 ± 2.15 Bab
10058.20 ± 2.15 Aab51.10 ± 0.50 Bb53.73 ± 0.40 Bc51.03 ± 1.46 Bab
15053.50 ± 1.22 Ab42.70 ± 1.31 Cc49.67 ± 0.67 Bcd47.70 ± 2.09 Bbc
20044.20 ± 0.89 Bc41.63 ± 1.24 Bc47.87 ± 0.59 Ad43.70 ± 2.19 Bc
ST (mm)03.31 ± 0.10 Aa2.99 ± 0.20 Aa3.73 ± 0.56 Aa2.10 ± 0.25 Bb
502.92 ± 0.23 BCa3.08 ± 0.05 ABa3.45 ± 0.22 Aa2.48 ± 0.15 Cab
1002.83 ± 0.35 ABa2.90 ± 0.28 ABa3.20 ± 0.04 Aa2.29 ± 0.19 Bab
1502.96 ± 0.07 Ba2.67 ± 0.12 BCa3.31 ± 0.12 Aa2.61 ± 0.14 Ca
2003.28 ± 0.18 Aa2.95 ± 0.13 Ba3.32 ± 0.03 Aa2.38 ± 0.09 Cab
ADW (g)00.85 ± 0.06 Aa0.63 ± 0.05 Ba0.70 ± 0.05 Ba0.60 ± 0.06 Ba
500.77 ± 0.08 Aab0.54 ± 0.04 Ba0.62 ± 0.06 Bab0.51 ± 0.03 Bab
1000.70 ± 0.06 Aab0.43 ± 0.05 Cb0.57 ± 0.03 Bb0.43 ± 0.00 Cbc
1500.64 ± 0.02 Ab0.22 ± 0.02 Dc0.50 ± 0.04 Bb0.35 ± 0.03 Cc
2000.34 ± 0.04 Ac0.20 ± 0.03 Bc0.26 ± 0.03 Bc0.20 ± 0.02 Bd
AFW (g)04.82 ± 0.11 Aa3.64 ± 0.05 Ba4.82 ± 0.16 Aa2.51 ± 0.41 Ca
504.39 ± 0.35 Aa3.41 ± 0.07 Ba3.94 ± 0.10 Ab2.33 ± 0.13 Ca
1003.68 ± 0.15 Ab3.06 ± 0.09 Bb3.53 ± 0.04 Ac2.07 ± 0.09 Ca
1503.29 ± 0.08 Ab2.08 ± 0.11 Bc3.24 ± 0.04 Ac2.06 ± 0.09 Ba
2001.56 ± 0.43 Ac0.76 ± 0.12 Bd0.99 ± 0.18 ABd0.65 ± 0.06 Bb
UDW (g)00.21 ± 0.00 Aa0.15 ± 0.01 Ba0.21 ± 0.00 Aa0.15 ± 0.00 Ba
500.20 ± 0.00 Aab0.14 ± 0.00 Bb0.20 ± 0.00 Aab0.14 ± 0.00 Bb
1000.19 ± 0.01 Ab0.12 ± 0.01 Bc0.19 ± 0.01 Ab0.11 ± 0.00 Bc
1500.17 ± 0.01 Ac0.10 ± 0.00 Bd0.17 ± 0.01 Ac0.11 ± 0.00 Bc
2000.12 ± 0.01 Ad0.09 ± 0.01 Be0.13 ± 0.01 Ad0.09 ± 0.01 Bd
UFW (g)02.67 ± 0.05 Aa1.42 ± 0.10 Ca2.17 ± 0.23 Ba1.59 ± 0.06 Ca
502.48 ± 0.07 Aab1.35 ± 0.12 Cab2.08 ± 0.14 Ba1.29 ± 0.04 Cb
1002.26 ± 0.11 Ab1.13 ± 0.11 Bb2.07 ± 0.03 Aa1.08 ± 0.09 Bc
1501.67 ± 0.05 Bc0.67 ± 0.05 Cc1.85 ± 0.06 Aa0.78 ± 0.06 Cd
2001.13 ± 0.15 Ad0.53 ± 0.04 Bc1.36 ± 0.13 Ab0.56 ± 0.09 Be
Table 3. Two-way ANOVAs for the effects of cultivar, salt concentration, and their interaction on chlorophyll content and photosynthesis of oats.
FactorCultivarSalt ConcentrationCultivar × Salt
Concentration
F Valuep Valuef Valuep Valuef Valuep Value
CaC2830.621<0.001 **289.704<0.001 **187.462<0.001 **
CbC1422.226<0.001 **99.942<0.001 **81.406<0.001 **
TCC2903.200<0.001 **215.518<0.001 **178.899<0.001 **
NPR458.832<0.001 **40,067.878<0.001 **106.165<0.001 **
SC598.488<0.001 **17,568.963<0.001 **119.052<0.001 **
TR2334.772<0.001 **49,227.978<0.001 **276.414<0.001 **
ICDC558.852<0.001 **10,428.536<0.001 **557.590<0.001 **
Note: CaC, chlorophyll a content; CbC, chlorophyll b content; TCC, total chlorophyll content; NPR, net photosynthetic rate; SC, stomatal conductance; TR, transpiration rate; ICDC, intercellular carbon dioxide concentration. ** represent p < 0.01.
Table 4. Comparative analysis of chlorophyll content and photosynthetic indices in four oat cultivars across different salt concentrations. Different capital letters indicate significant differences among different cultivars under the same concentration treatment (p < 0.05). Different lowercase letters indicate significant differences among different concentration treatments on the same cultivar (p < 0.05). Abbreviation of the corresponding indicators are shown in Table 3.
TraitSalt Concentration (mM)Cultivar
Qinghai 444Baiyan No. 18Mengyan No. 1Qingyin No. 3
CaC (mg·g−1 FW)02.86 ± 0.05 Aa1.92 ± 0.03 Da2.68 ± 0.08 Ba2.36 ± 0.04 Ca
502.76 ± 0.10 Aa1.93 ± 0.11 Ca2.14 ± 0.07 Bb2.09 ± 0.05 Bb
1002.48 ± 0.10 Ab1.83 ± 0.04 Ca2.12 ± 0.06 Bb1.91 ± 0.04 Cc
1501.97 ± 0.11 Ac0.99 ± 0.26 Cb1.79 ± 0.02 Bc1.80 ± 0.04 ABd
2000.99 ± 0.03 Ad0.47 ± 0.05 Dc0.56 ± 0.02 Cd0.76 ± 0.03 Be
CbC (mg·g−1 FW)00.90 ± 0.02 Aa0.65 ± 0.06 Ca0.82 ± 0.05 Ba0.76 ± 0.07 Ba
500.90 ± 0.07 Aa0.59 ± 0.03 Cab0.70 ± 0.01 Bb0.61 ± 0.01 Cb
1000.79 ± 0.06 Ab0.56 ± 0.01 Cb0.68 ± 0.00 Bb0.60 ± 0.03 Cb
1500.60 ± 0.03 Ac0.31 ± 0.08 Bc0.55 ± 0.01 Ac0.56 ± 0.01 Ac
2000.31 ± 0.02 Ad0.15 ± 0.01 Dd0.20 ± 0.01 Cd0.22 ± 0.00 Bd
TCC (mg·g−1 FW)03.73 ± 0.08 Aa2.57 ± 0.08 Da3.50 ± 0.12 Ba3.12 ± 0.08 Ca
503.60 ± 0.25 Aa2.52 ± 0.14 Ca2.83 ± 0.07 Bb2.70 ± 0.05 Bb
1003.19 ± 0.33 Ab2.39 ± 0.04 Da2.80 ± 0.06 Bb2.51 ± 0.05 Cc
1502.46 ± 0.43 Ac1.29 ± 0.34 Bb2.34 ± 0.02 Ac2.36 ± 0.05 Ad
2001.43 ± 0.39 Ad0.62 ± 0.05 Dc0.76 ± 0.02 Cd0.98 ± 0.04 Be
NPR (μmol CO2 m−2·s−1)019.82 ± 0.45 Aa18.33 ± 0.12 Ba19.60 ± 0.19 Aa18.60 ± 0.08 Ba
5019.33 ± 0.09 Ab16.29 ± 0.12 Db18.24 ± 0.07 Bb17.38 ± 0.31 Cb
10016.19 ± 0.08 Ac15.47 ± 0.35 Bc15.78 ± 0.15 ABc14.19 ± 0.40 Cc
1507.21 ± 0.19 Ad3.03 ± 0.05 Dd5.42 ± 0.06 Cd6.27 ± 0.33 Bd
2000.11 ± 0.00 Ae0.08 ± 0.02 Be0.03 ± 0.02 Ce0.10 ± 0.00 ABe
SC (mol H2O m−2·s−1)00.348 ± 0.003 Aa0.319 ± 0.005 Aa0.333 ± 0.001 Ba0.323 ± 0.000 Ba
500.332 ± 0.005 Ab0.237 ± 0.006 Ab0.320 ± 0.004 Bb0.252 ± 0.018 Bb
1000.263 ± 0.002 Ac0.208 ± 0.003 Bc0.230 ± 0.002 Cc0.191 ± 0.001 Dc
1500.113 ± 0.004 Ad0.043 ± 0.003 Cd0.063 ± 0.001 Dd0.091 ± 0.001 Bd
2000.022 ± 0.000 Ae0.020 ± 0.000 Ce0.020 ± 0.001 Be0.021 ± 0.000 Be
TR (mmol H2O m−2·s−1)04.80 ± 0.03 Aa4.20 ± 0.17 Da4.60 ± 0.10 Ba4.40 ± 0.06 Ca
504.70 ± 0.06 Ab3.70 ± 0.41 Db4.50 ± 0.00014 Bb3.70 ± 0.08 Cb
1004.20 ± 0.03 Ac3.20 ± 0.15 Cc3.60 ± 0.30 Bc3.10 ± 0.04 Dc
1502.00 ± 0.06 Ad1.10 ± 0.20 Cd1.60 ± 0.24 Bd1.60 ± 0.24 Bd
2000.50 ± 0.01 Ae0.40 ± 0.01 Be0.40 ± 0.00002 Be0.40 ± 0.02 Be
ICDC (μmol CO2 mol−1 air)0287.65 ± 3.01 Bb293.29 ± 1.39 Ab289.56 ± 1.23 Bc288.65 ± 0.18 Bb
50285.91 ± 1.13 Abc236.20 ± 2.20 Dd276.62 ± 1.85 Bd261.77 ± 1.58 Cd
100281.59 ± 1.20 Ac272.77 ± 1.70 Bc259.63 ± 1.93 De265.26 ± 1.50 Dc
150283.06 ± 4.40 Cc292.46 ± 2.58 Bb361.64 ± 3.33 Ab259.96 ± 2.14 Dd
200381.77 ± 2.35 Ba379.32 ± 2.97 Ba387.21 ± 2.59 Aa390.03 ± 3.20 Aa
Table 5. Two-way ANOVAs for the effects of cultivar, salt concentration, and their interaction on physiological and biochemical properties of oats.
FactorCultivarSalt ConcentrationCultivar × Salt Concentration
f Valuep Valuef Valuep Valuef Valuep Value
SOD1615.400<0.001 **32,932.298<0.001 **1241.101<0.001 **
POD54.327<0.001 **126.830<0.001 **9.129<0.001 **
PRO3,932,765.060<0.001 **322,925.780<0.001 **227,692.589<0.001 **
MDA3.3620.039 *78.827<0.001 **19.522<0.001 **
Note: SOD, the activity of superoxide dismutase; POD, the activity of peroxidase; PRO, proline content; MDA, malondialdehyde content. * represent p < 0.05, ** represent p < 0.01.
Table 6. Comparative analysis of physiological and biochemical indicators in four oat cultivars across different salt concentrations. Different capital letters indicate significant differences among different cultivars under the same concentration treatment (p < 0.05). Different lowercase letters indicate significant differences among different concentration treatments on the same cultivar (p < 0.05). Abbreviation of the corresponding indicators are shown in Table 5.
TraitSalt Concentration (mM)Cultivar
Qinghai 444Baiyan No. 18Mengyan No. 1Qingyin No. 3
SOD (U·g−1 FW)0264.08 ± 2.01 Bc229.14 ± 1.24 Cc247.02 ± 42.53 Db300.86 ± 2.89 Ab
50340.80 ± 1.25 Ab316.89 ± 0.31 Bb290.42 ± 57.81 Db304.42 ± 1.39 Cb
100367.16 ± 2.85 Ca416.56 ± 0.13 Aa381.58 ± 30.39 Ba343.16 ± 0.52 Da
150246.20 ± 0.38 Ad148.94 ± 1.88 Cd161.20 ± 53.82 Bd132.43 ± 0.06 Dc
20087.76 ± 1.96 Be101.95 ± 0.39 Ae88.32 ± 16.62 Be63.22 ± 0.59 Cd
POD (U·g−1 FW)014.21 ± 0.07 Aa11.09 ± 0.81 Ba10.75 ± 0.17 Bb10.89 ± 0.13 Bb
5015.29 ± 0.31 Aa11.24 ± 0.02 Ba14.69 ± 1.45 Aa11.31 ± 0.03 Ba
10011.44 ± 0.84 Ab9.39 ± 1.06 Aab10.62 ± 0.65 Ab11.85 ± 0.13 Aa
15011.79 ± 0.19 Ab7.69 ± 0.37 Cb8.30 ± 0.13 Cbc9.78 ± 0.15 Bc
2008.90 ± 0.47 Ac7.88 ± 0.03 Bb6.93 ± 0.10 Bc6.90 ± 0.14 Bd
PRO (μg·g−1 FW)043.88 ± 0.00 Dd61.42 ± 0.11 Ad45.88 ± 0.02 Cd47.64 ± 0.02 Be
5052.92 ± 0.11 Cc67.63 ± 0.02 Ac53.69 ± 0.04 Bc51.70 ± 0.07 Dd
10053.66 ± 0.37 Cc62.90 ± 0.09 Ad49.78 ± 0.10 Dc60.32 ± 0.13 Bc
150151.27 ± 0.10 Cb178.21 ± 0.55 Ab153.28 ± 0.18 Bb86.97 ± 0.16 Db
200627.20 ± 0.94 Ba578.16 ± 0.81 Ca709.63 ± 0.69 Aa627.01 ± 0.18 Ba
MDA (μmol·g−1 FW)014.51 ± 0.27 Ab12.39 ± 0.11 Bc13.17 ± 0.24 Aa12.85 ± 0.13 Ab
5020.73 ± 5.54 Aab18.24 ± 0.69 Ab14.22 ± 0.33 Aa13.69 ± 0.03 Ab
10014.40 ± 0.65 Ab12.42 ± 0.10 Ac16.90 ± 4.44 Aa13.15 ± 0.87 Ab
15019.20 ± 2.23 ABab17.15 ± 0.17 ABb20.13 ± 0.47 Aa14.43 ± 0.88 Bb
20026.86 ± 0.95 Ba23.15 ± 0.48 Ba19.05 ± 0.50 Ba42.83 ± 5.79 Aa
Table 7. Affiliation function analysis of four oat cultivars under different salt concentration treatments.
Salt ConcentrationOat CultivarsD ValueRank
50 mmol/LQinghai 4440.9211
Mengyan No. 10.5612
Baiyan No. 180.2503
Qingyin No. 30.0494
100 mmol/LQinghai 4441.0001
Mengyan No. 10.6702
Baiyan No. 180.4133
Qingyin No. 30.1244
150 mmol/LMengyan No. 10.829 1
Qinghai 4440.808 2
Baiyan No. 180.264 3
Qingyin No. 30.123 4
200 mmol/LQinghai 4440.925 1
Mengyan No. 10.604 2
Baiyan No. 180.371 3
Qingyin No. 30.284 4
Disclaimer/Publisher’s Note: The statements, opinions and data contained in all publications are solely those of the individual author(s) and contributor(s) and not of MDPI and/or the editor(s). MDPI and/or the editor(s) disclaim responsibility for any injury to people or property resulting from any ideas, methods, instructions or products referred to in the content.

