
The Effects of Light Duration and Intensity with Supplemental Light-Emitting Diode Lights on Grape Photosynthesis, Yield, and Fruit Quality

Abstract
1. Introduction
2. Materials and Methods
2.1. Plant Material and Growth Conditions
2.2. Experimental Design
2.3. Leaf Biochemical Component Measurements
2.4. Light Response Curve and Chlorophyll Fluorescence Measurements
2.5. Grape Yield and Fruit Quality Measurements
2.6. Calculations and Statistics
3. Results
3.1. PPFD Received by the Canopy of Grapevines
3.2. Leaf Physiological Properties
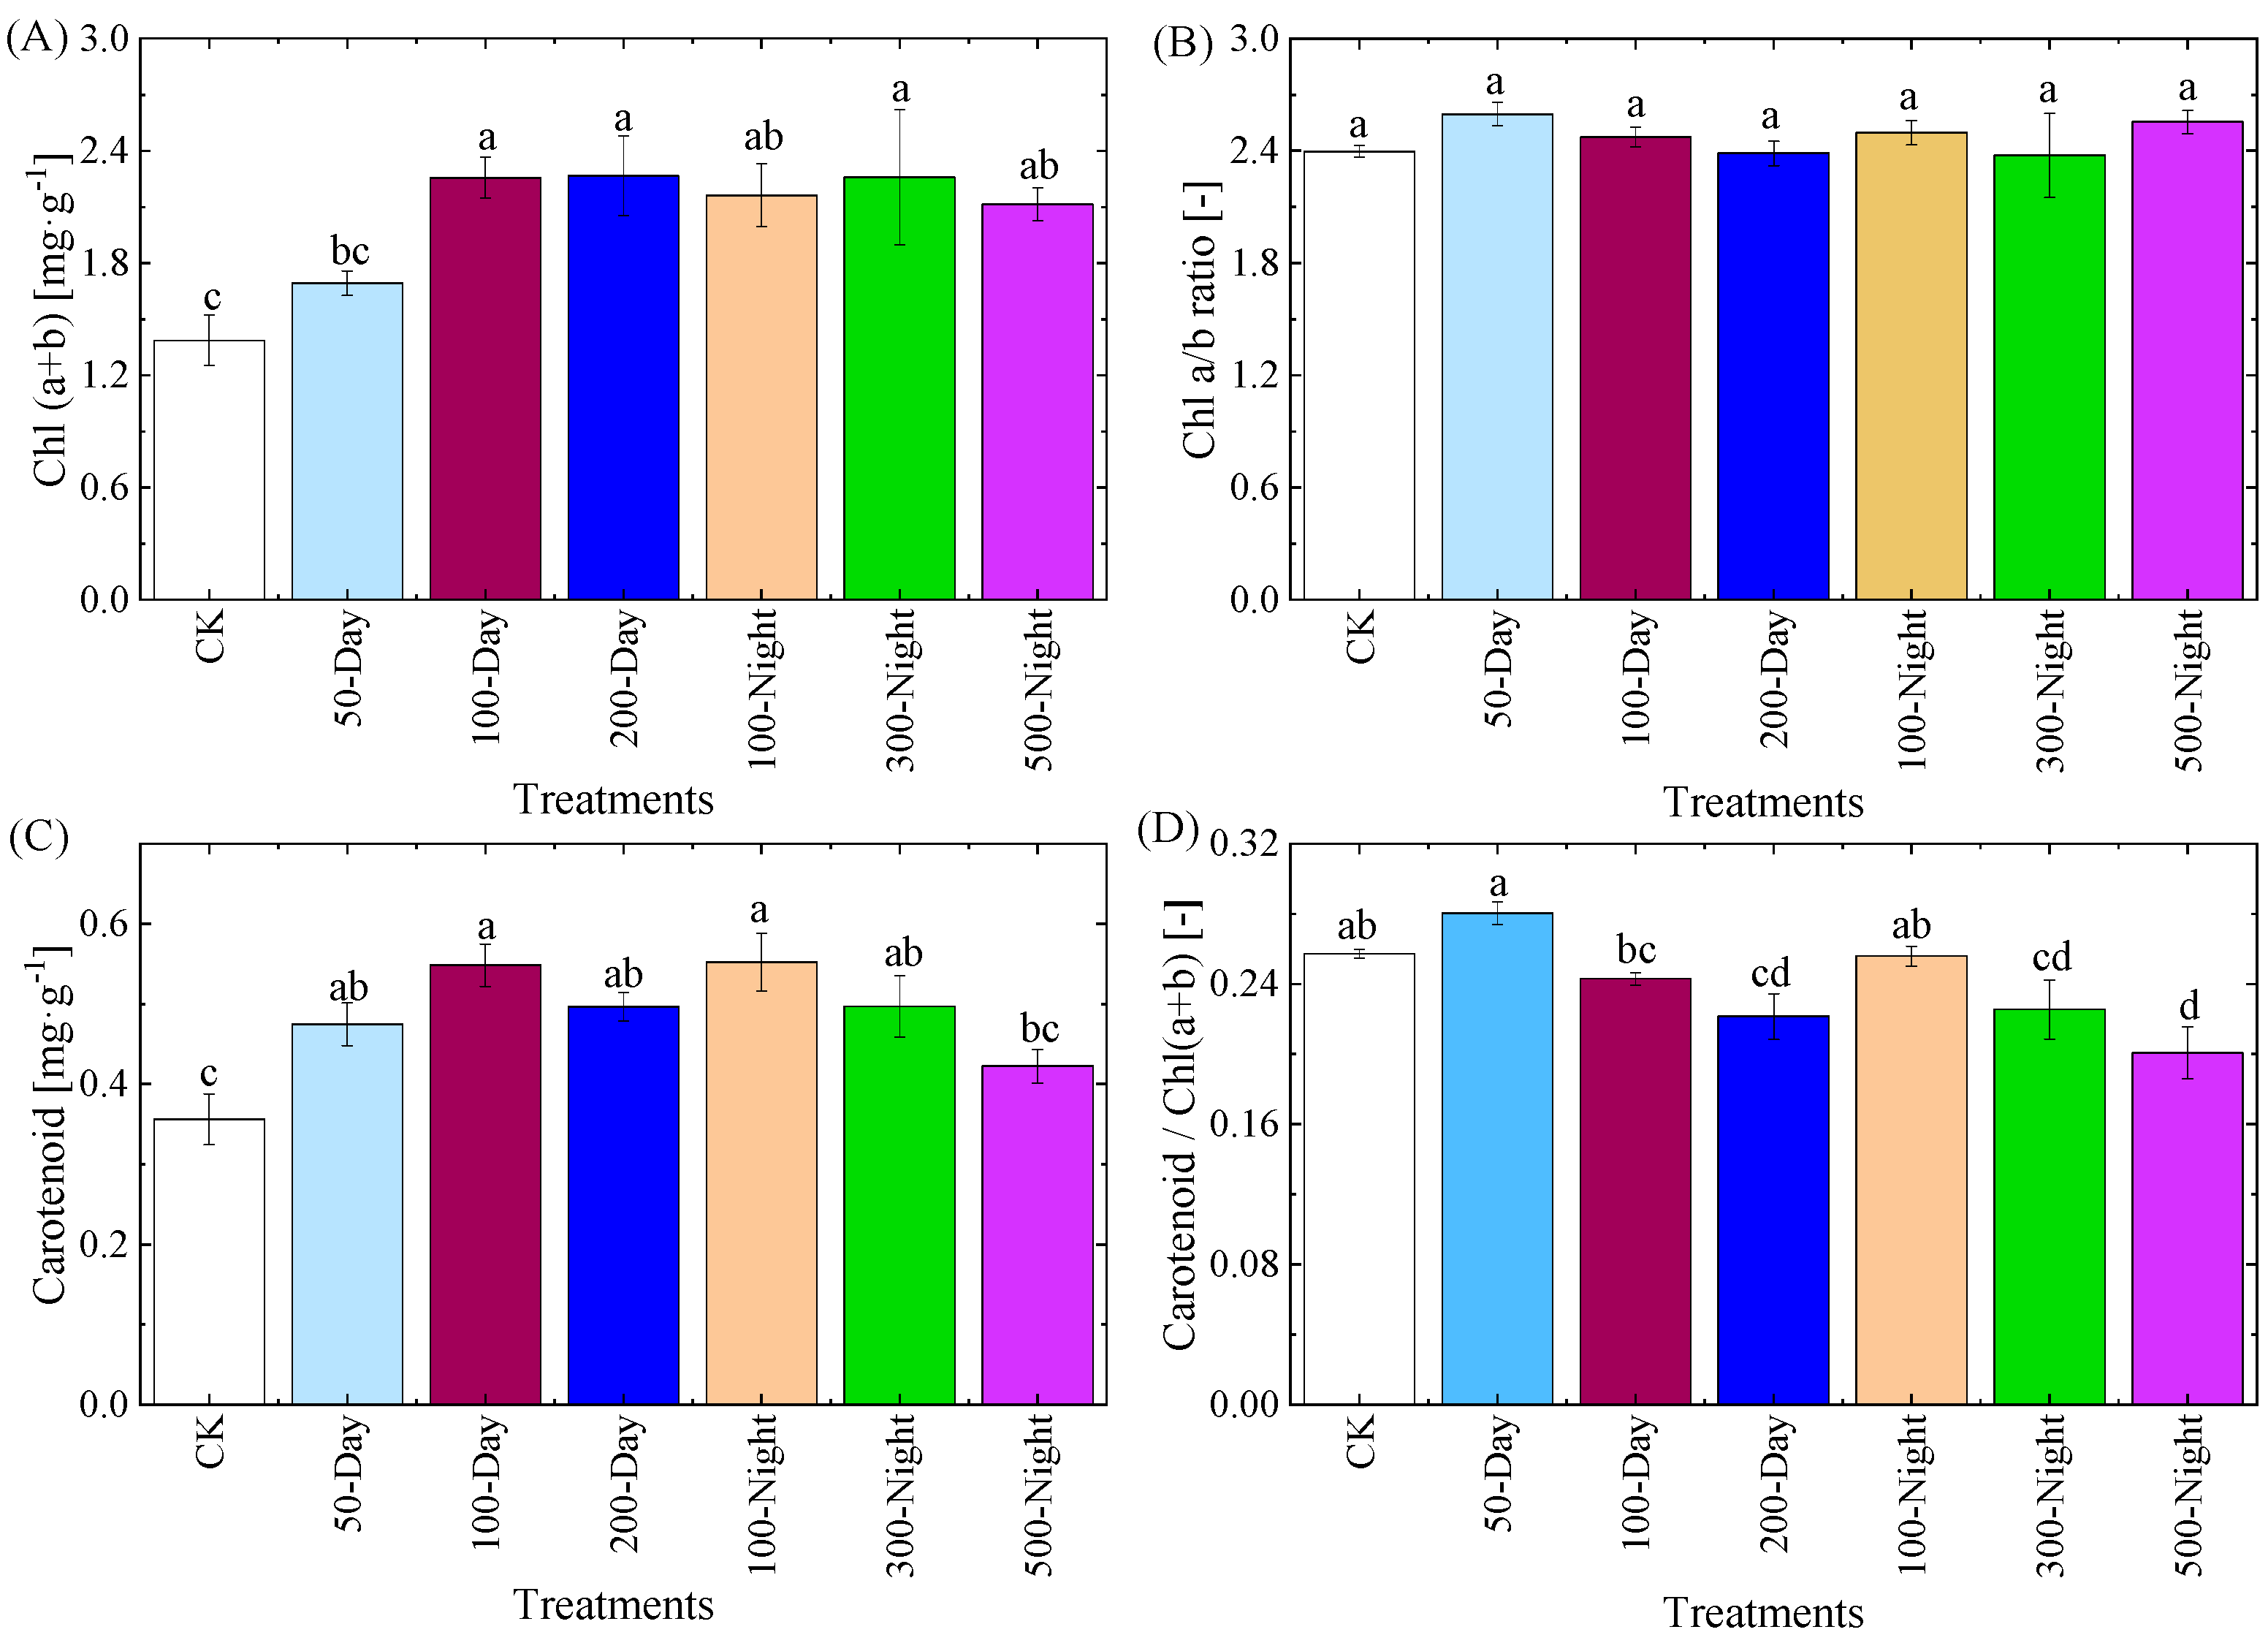
3.2.1. Leaf Biochemical Components
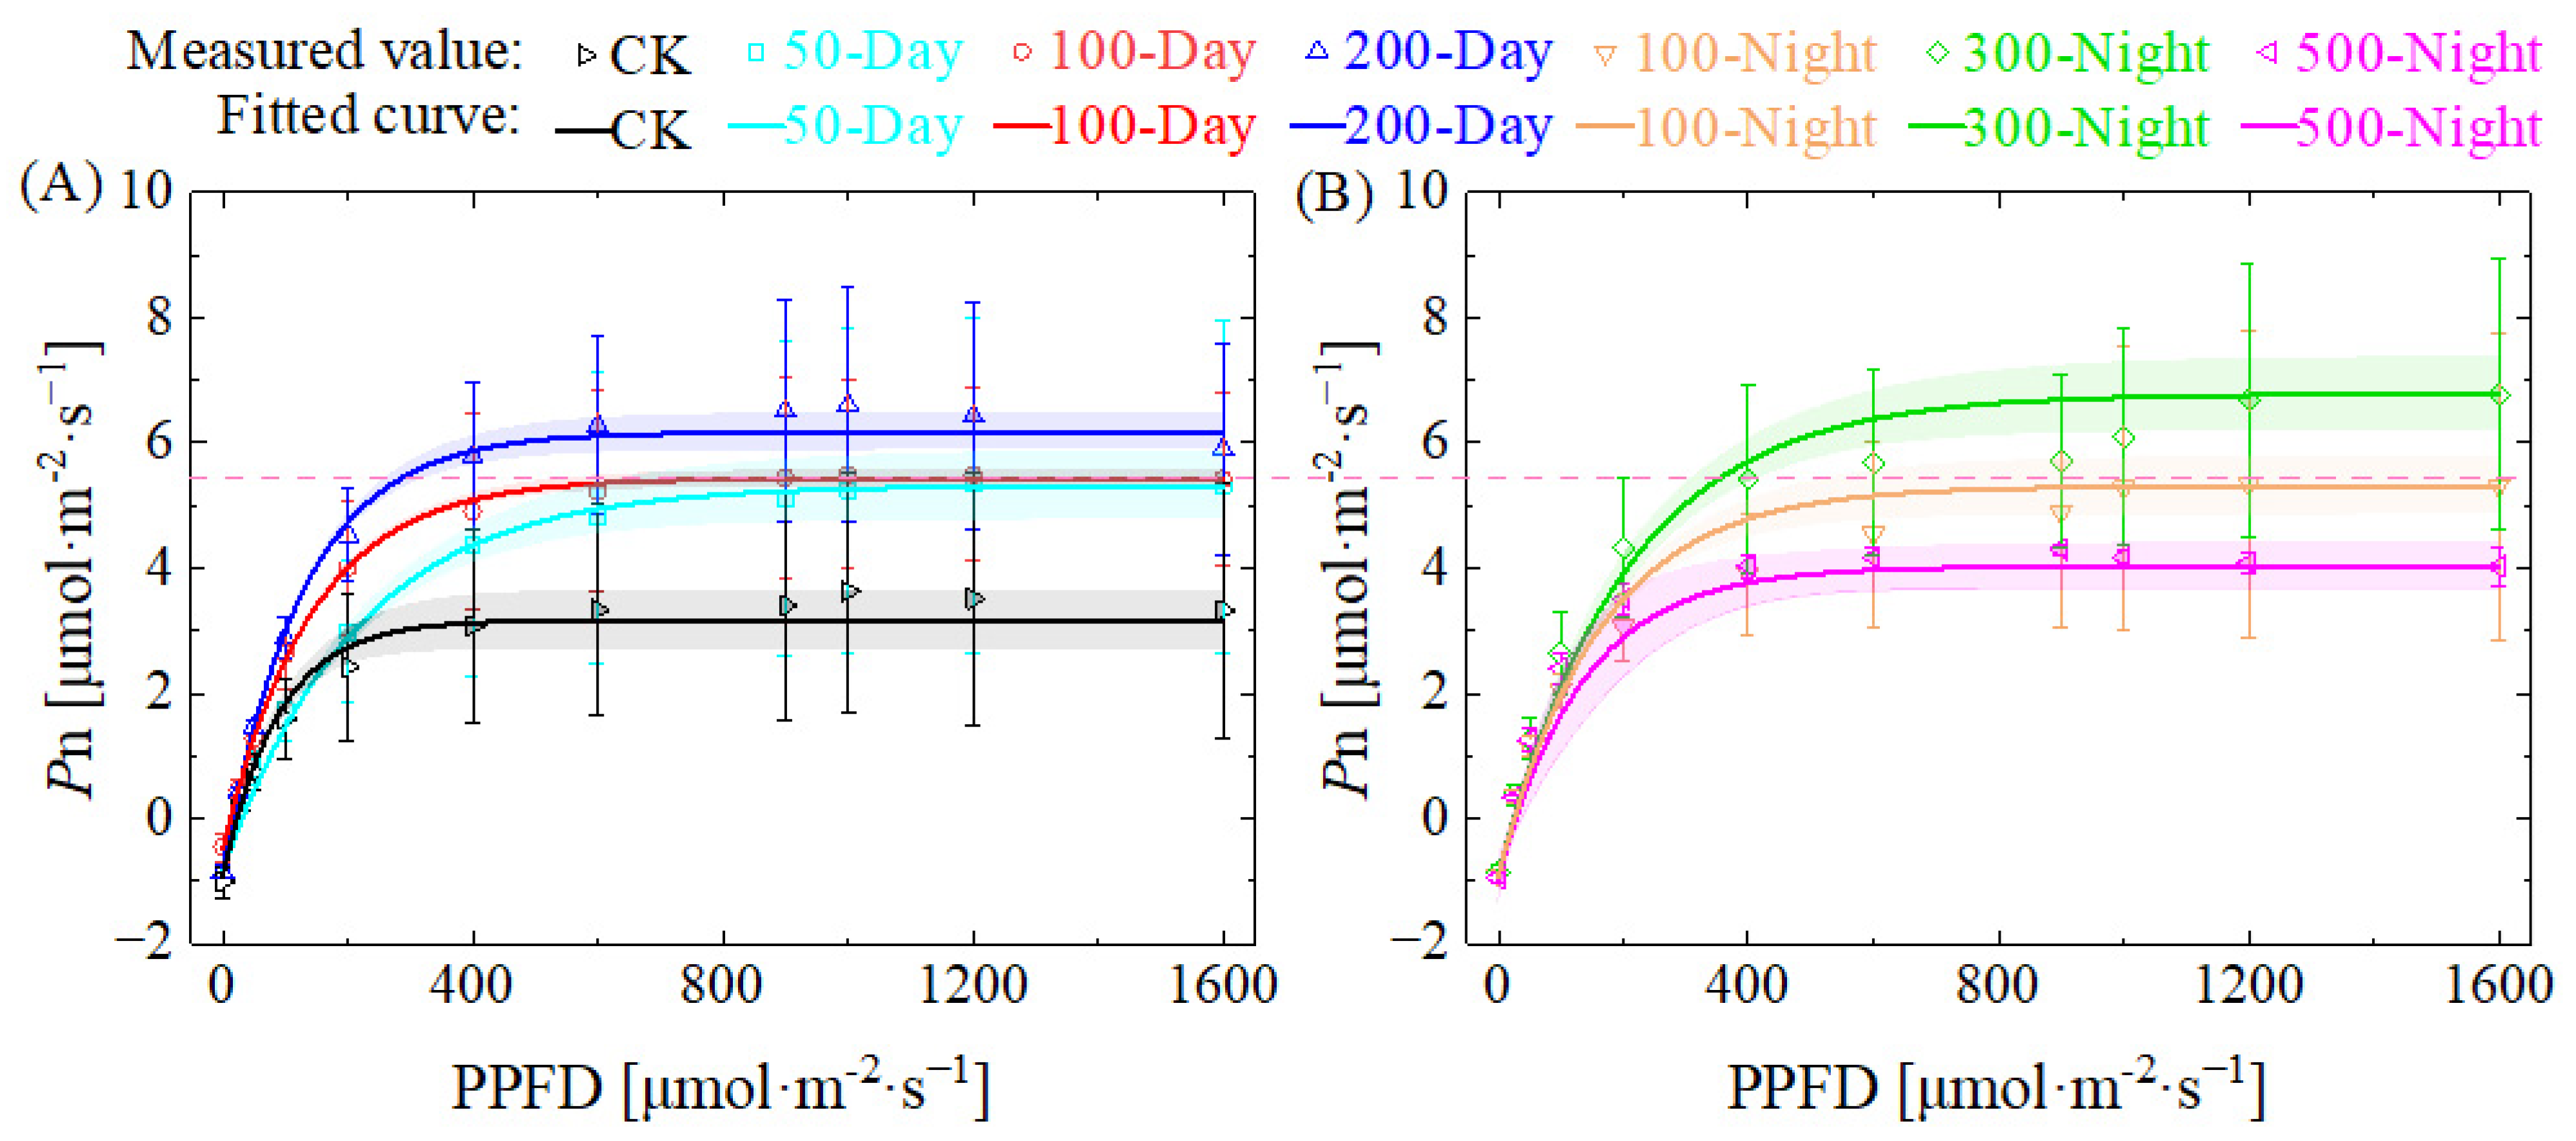
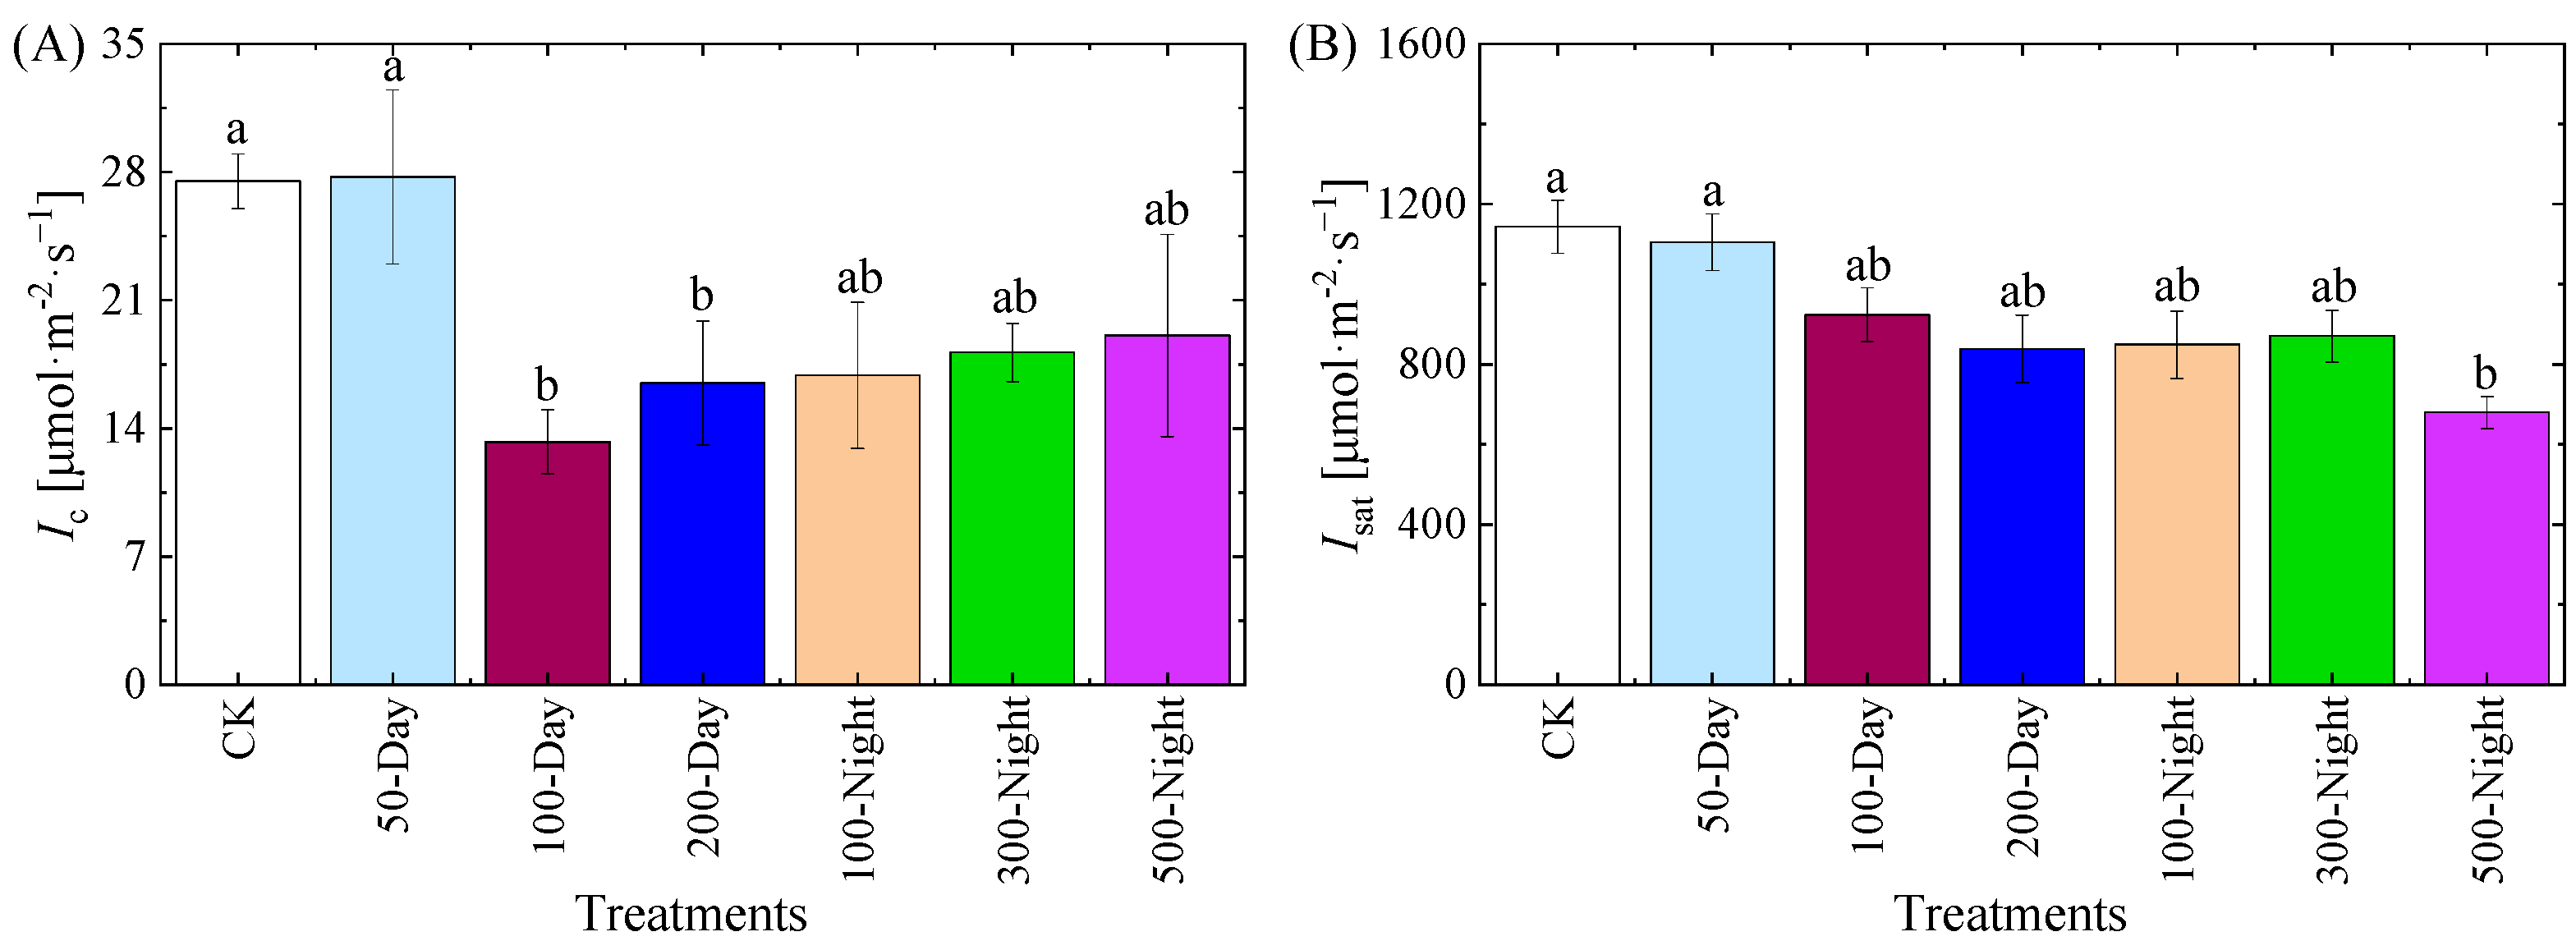
3.2.2. Light Response Curve and Related Parameters
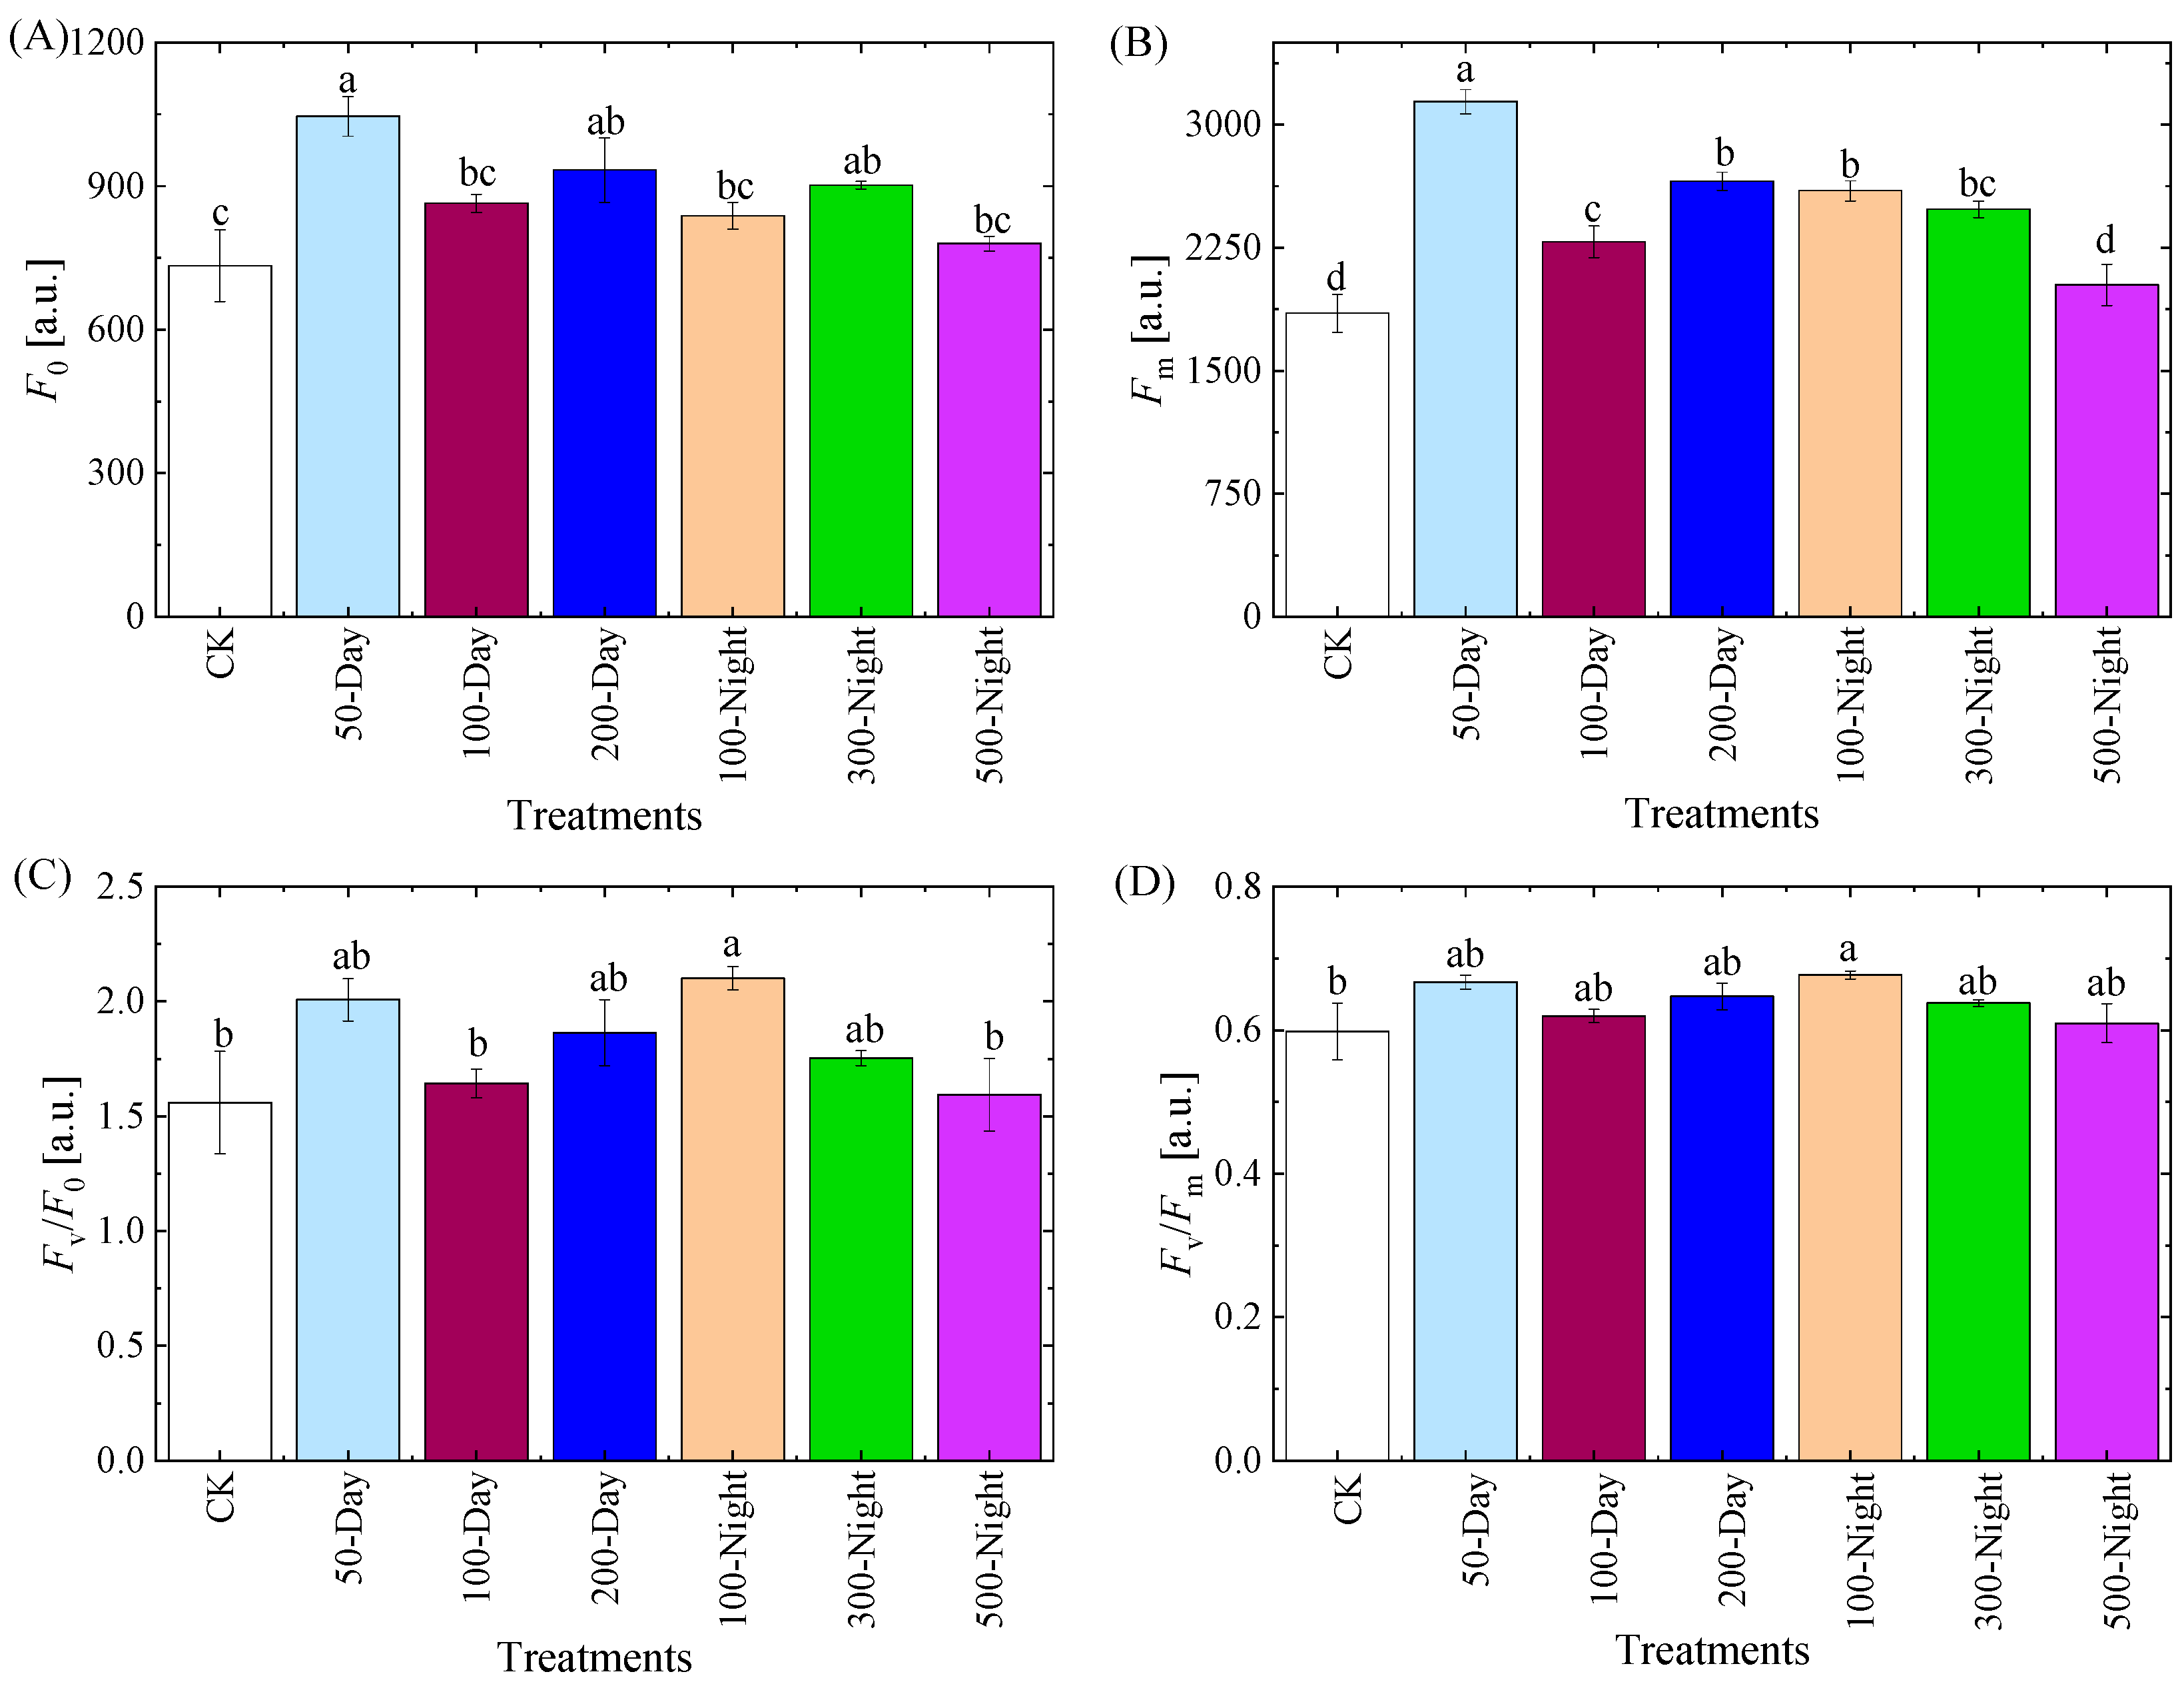
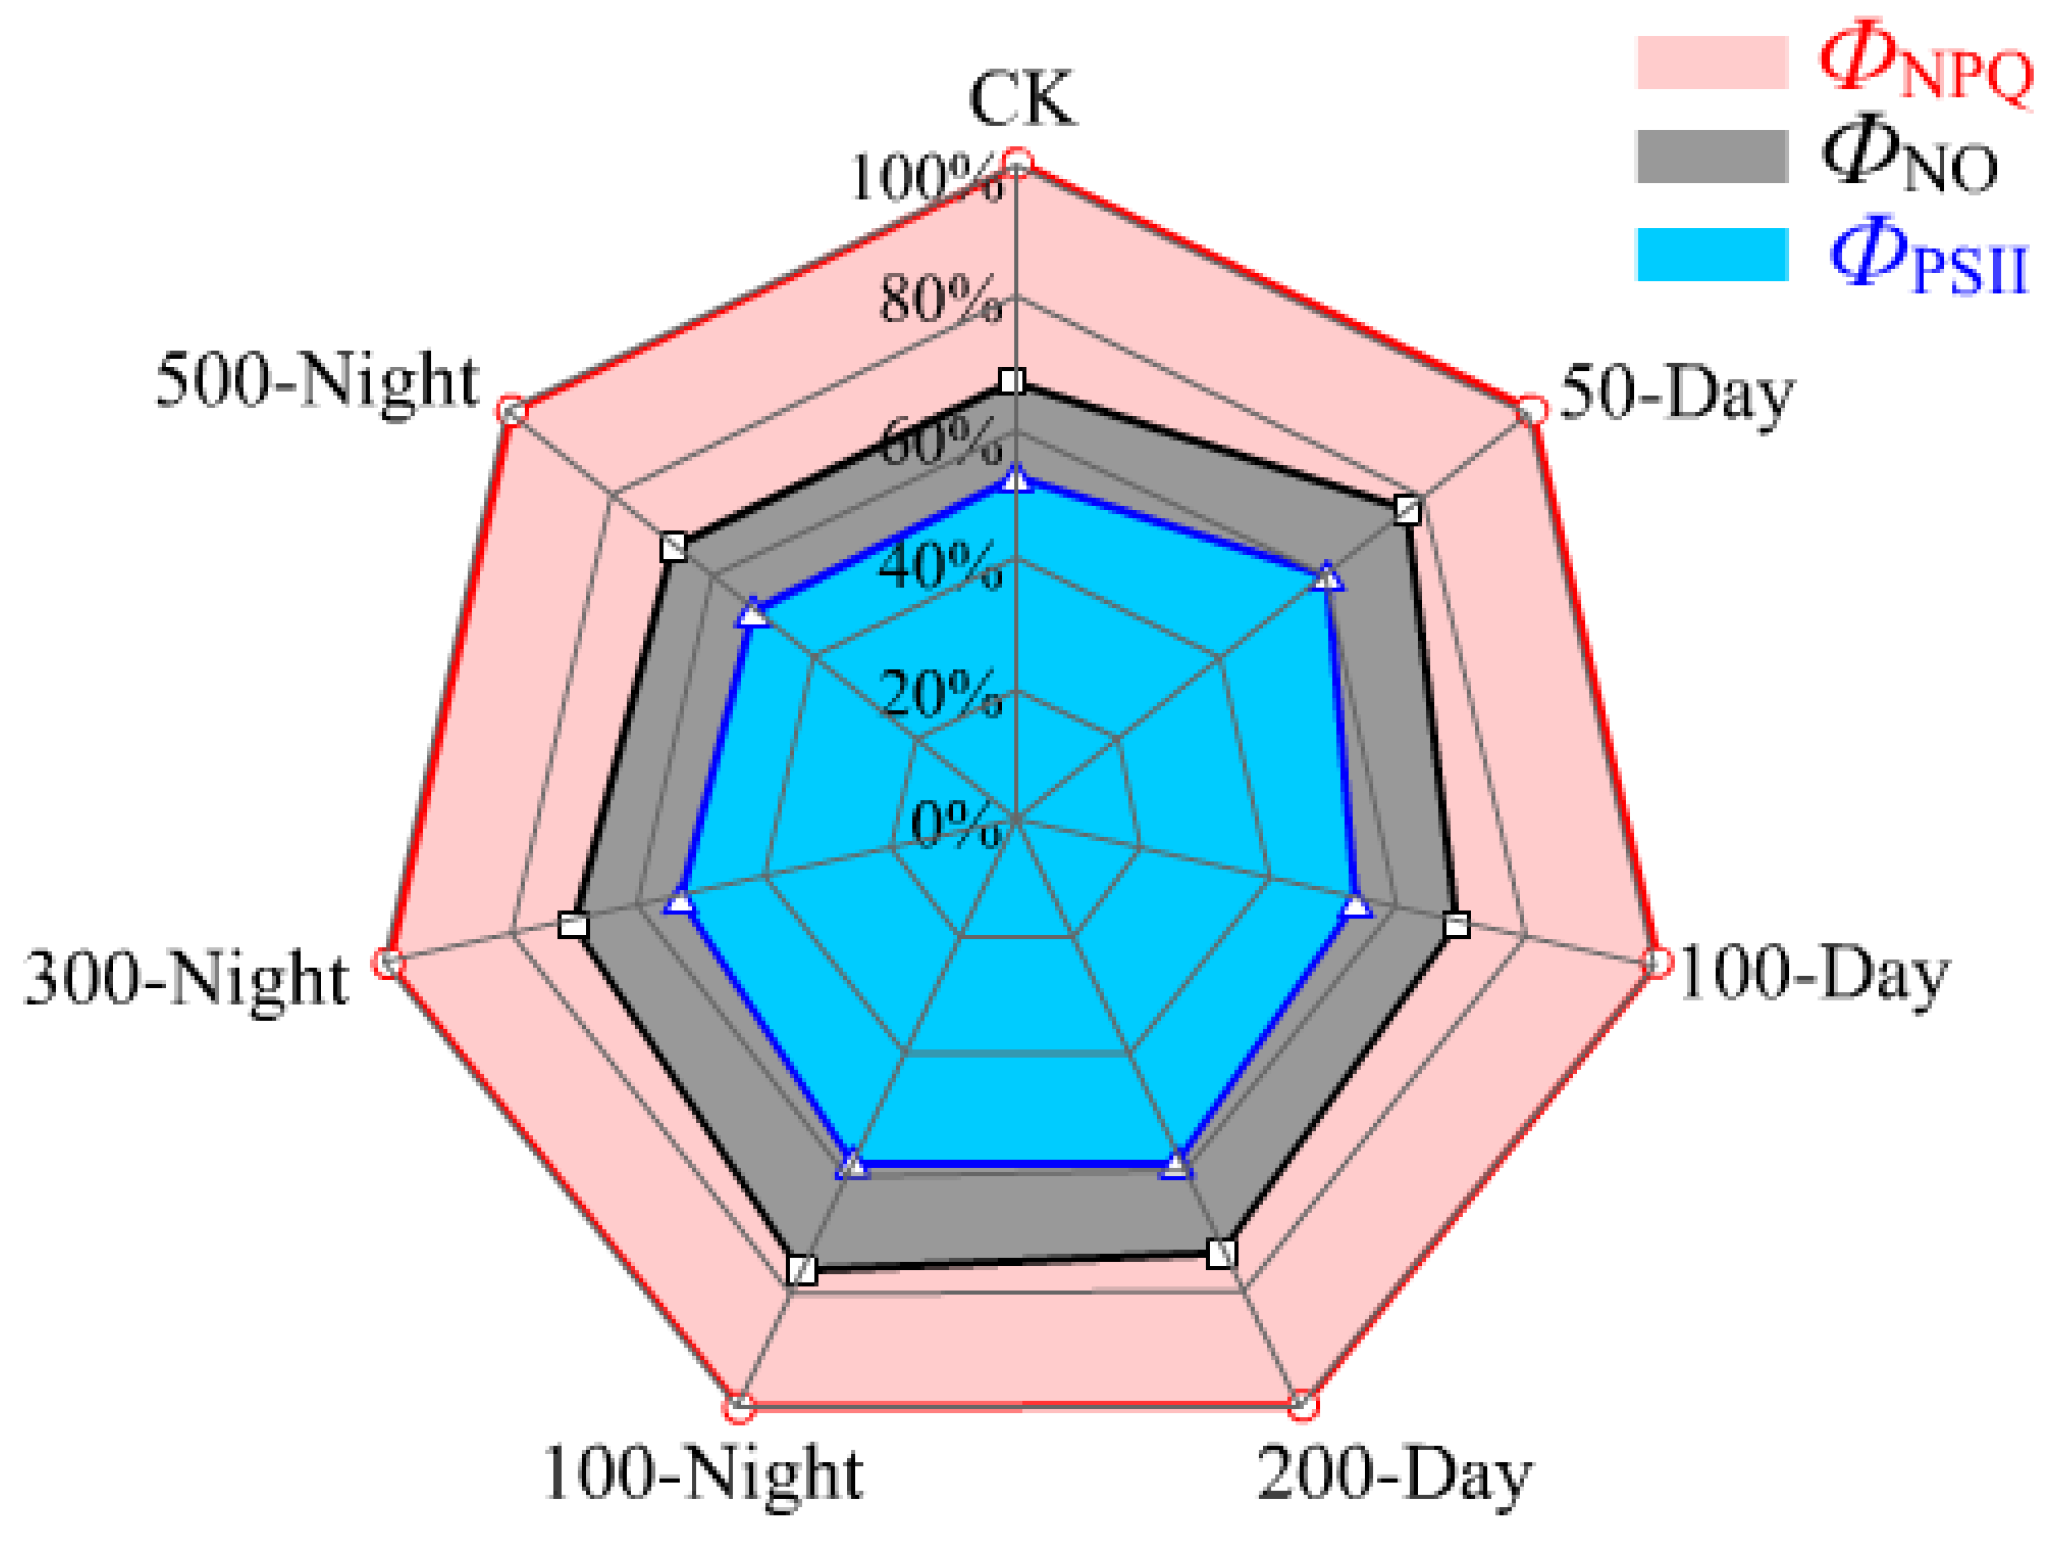
3.2.3. Leaf Chlorophyll Fluorescence Properties
3.3. Yield and Fruit Quality
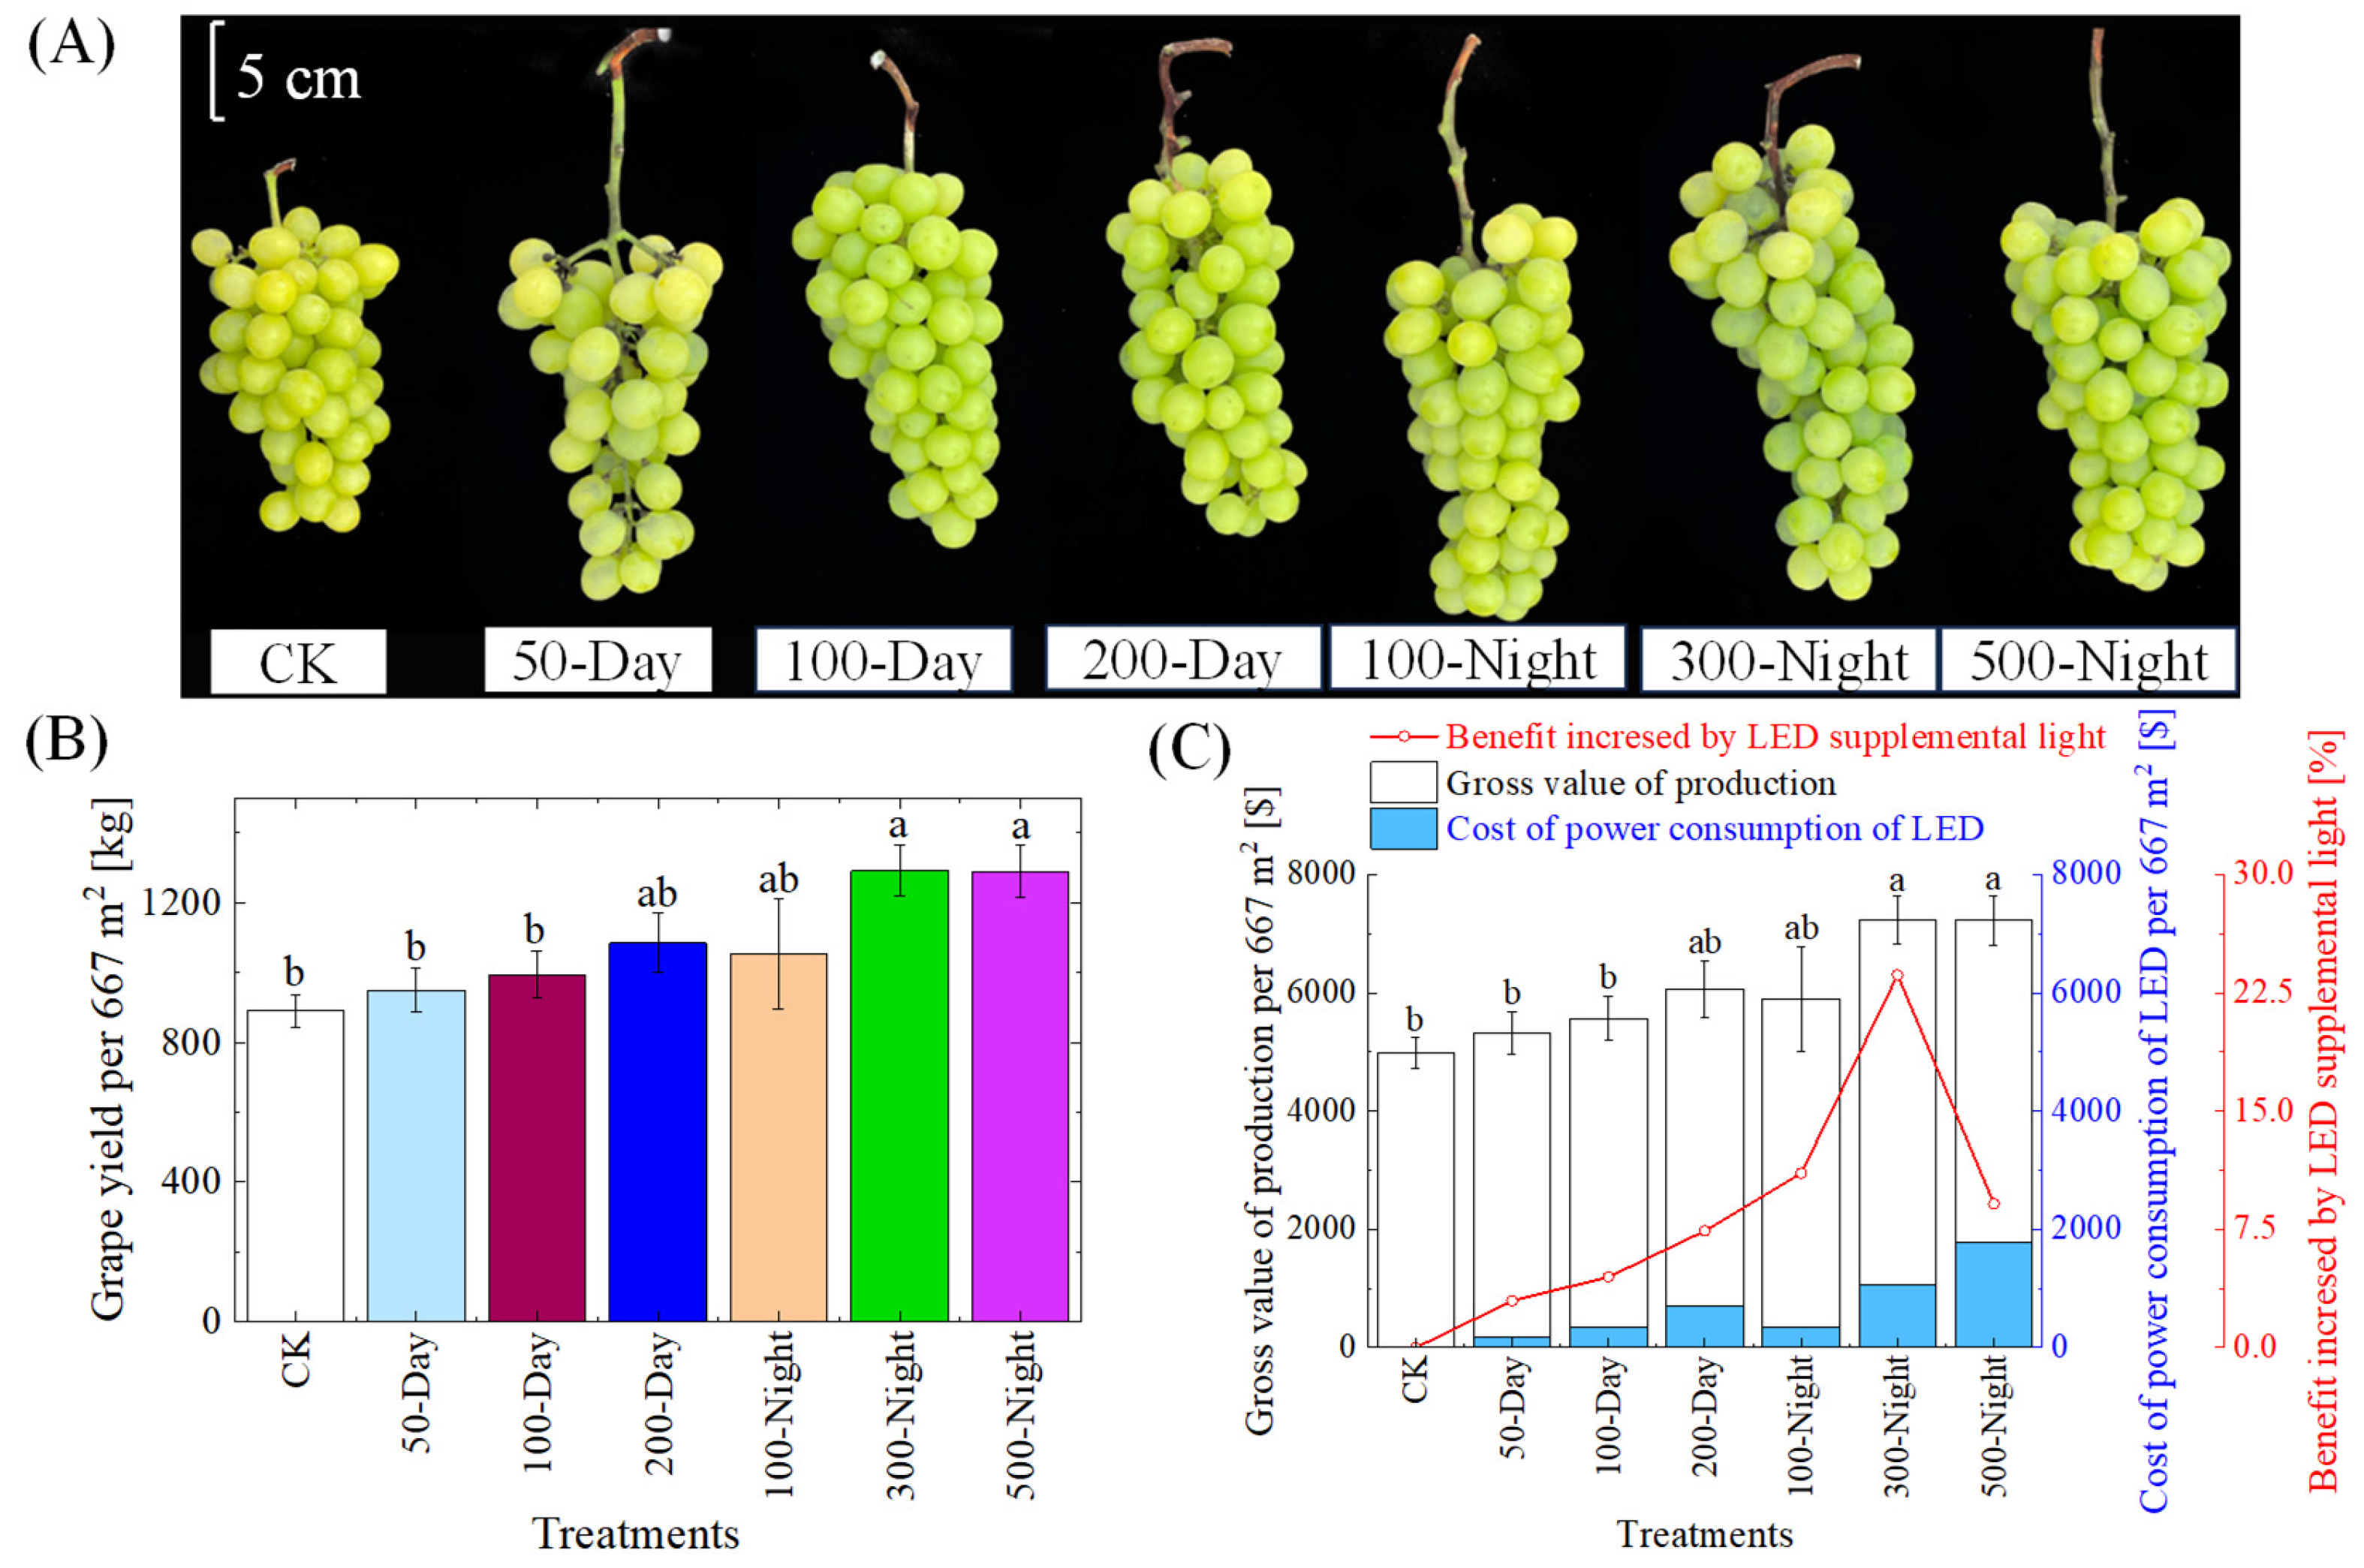
3.3.1. Grape Yield
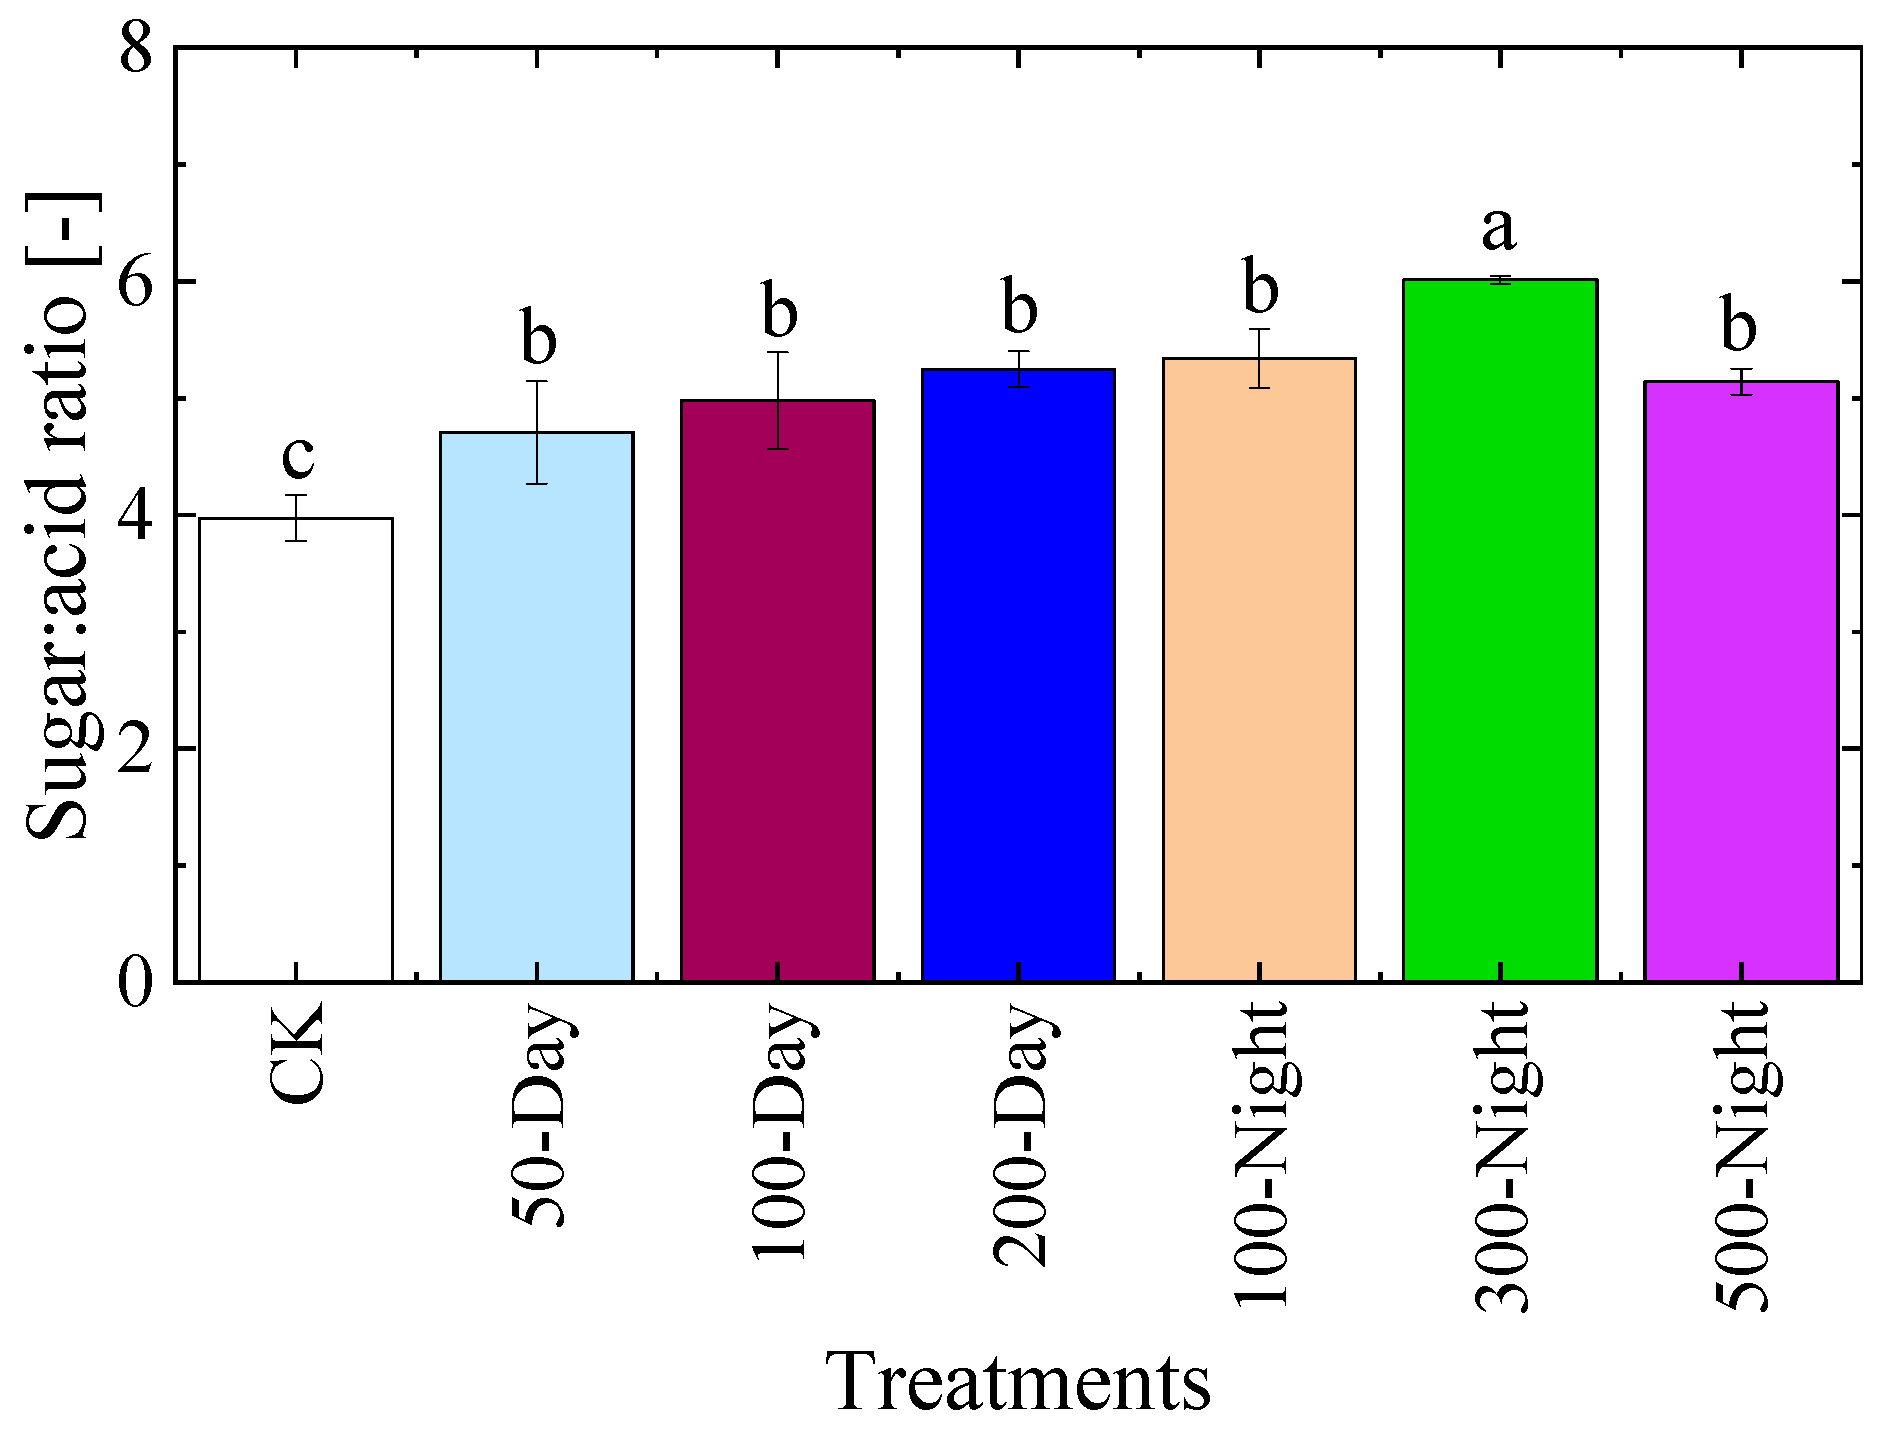
3.3.2. Fruit Quality
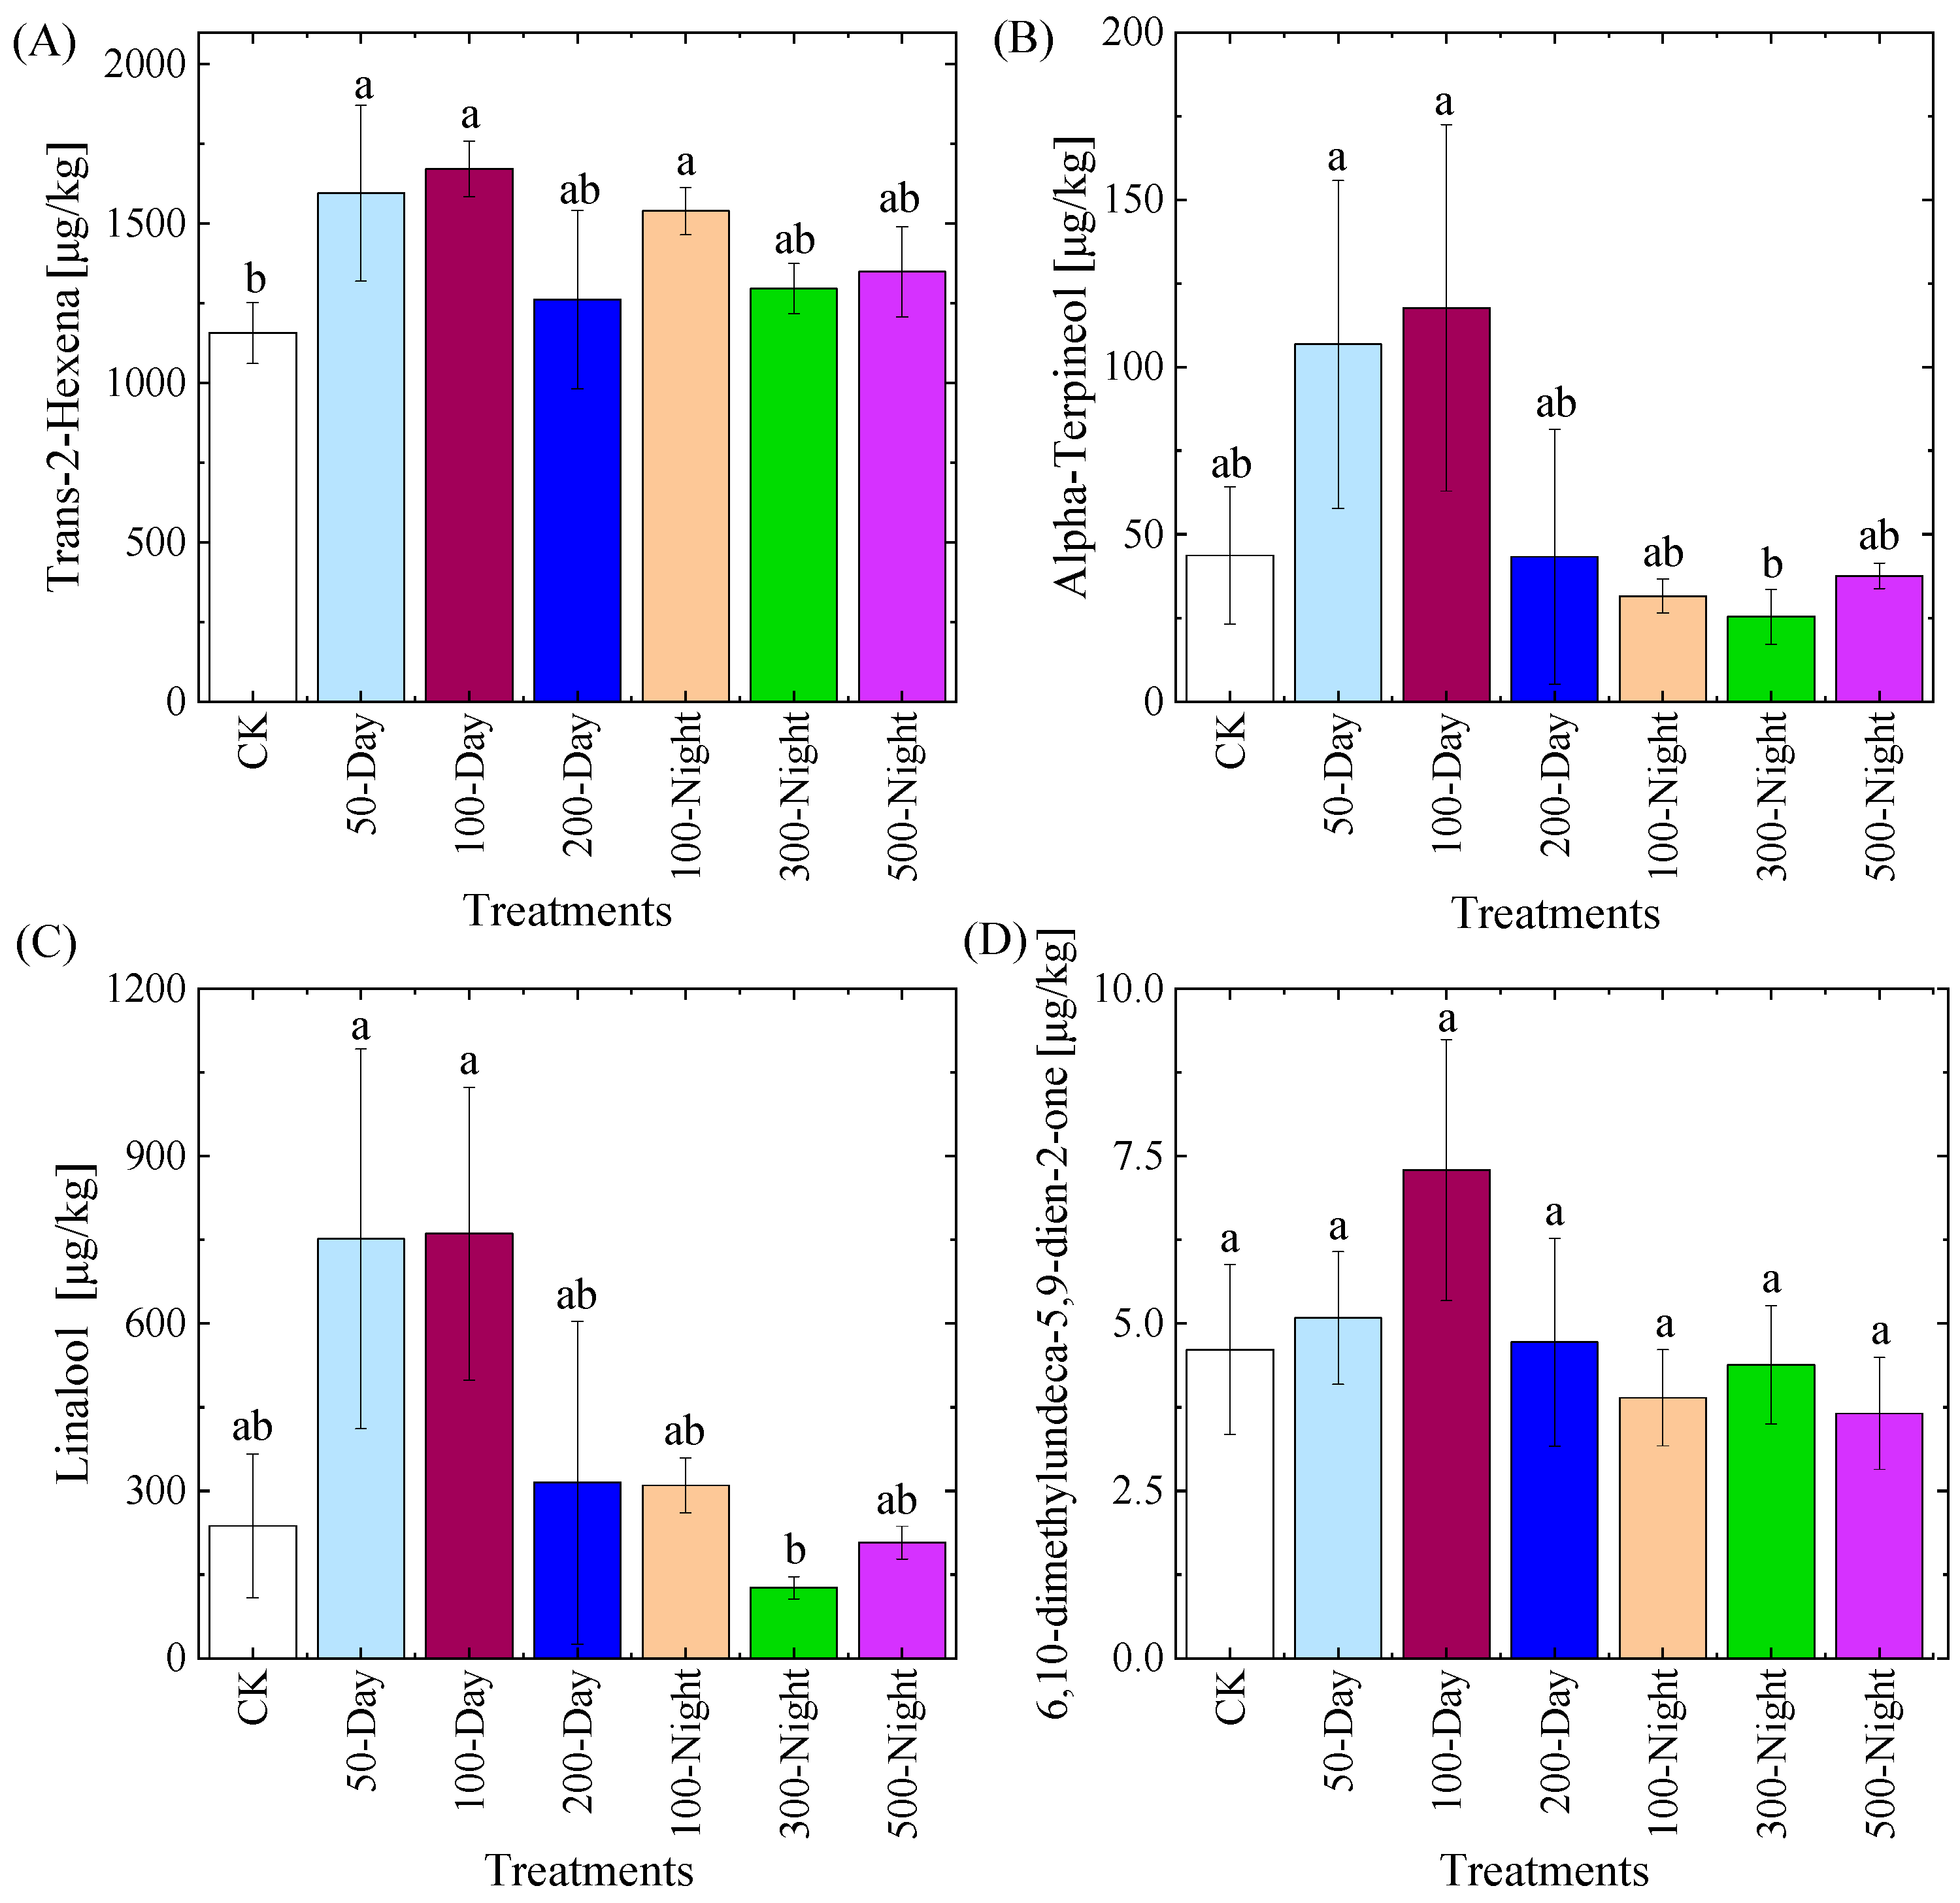
3.3.3. Aroma Characteristics
4. Discussion
4.1. Leaf Physiological Properties in Response to Supplemental Light
4.2. Effects of Supplemental Light on Grape Yield and Fruit Quality
4.3. Analysis of the Energy Consumption of LEDs
5. Conclusions
Author Contributions
Funding
Data Availability Statement
Conflicts of Interest
Nomenclature
| Symbols | |
| Chl | chlorophyll [mg/g] |
| DLI | daily light integral [mol/(m2·d)] |
| PPFD | photosynthetic photon flux density [μmol/(m2·s)] |
| Pn | net leaf photosynthetic rate [μmol/(m2·s)] |
| Ia | estimated from the incident PPFD multiplied by the absorptance coefficient of single leaves [-] |
| Isat | the saturation light intensity [μmol/(m2·s)] |
| Pmax | maximum net leaf photosynthetic rate [μmol/(m2·s)] |
| Pmax/Chl | chlorophyll use efficiency of maximum leaf photosynthesis [μmol·g/(m2·s1·mg1)] |
| Rd | dark respiration [μmol/(m2·s)] |
| ΦPSII | PSII operating efficiency [-] |
| Fm | maximal fluorescence [-] |
| F0 | minimal fluorescence [-] |
| F’m | minimal fluorescence yield in the light-adapted state [-] |
| FS | fluorescence yield under actinic light [-] |
| Fv/Fm | maximum quantum efficiency of PSII [-] |
| Fv/F0 | potential quantum efficiency of PSII [-] |
| ΦNPQ | regulated quantum efficiencies of PSII of leaves [-] |
| ΦNO | quantum efficiencies of constitutive thermal dissipation and fluorescence [-] |
| α | leaf photosynthetic efficiency [μmol/μmol photons] |
| β | coefficient [-] |
| γ | coefficient [-] |
| Abbreviations | |
| CK | control |
| 50-Day | 6:00–9:00 and 15:00–18:00 supplemented LED with a PPFD of 50 μmol/(m2·s) |
| 100-Day | 6:00–9:00 and 15:00–18:00 supplemented LED with a PPFD of 100 μmol/(m2·s) |
| 200-Day | 6:00–9:00 and 15:00–18:00 supplemented LED with a PPFD of 200 μmol/(m2·s) |
| 100-Night | 18:00–24:00 supplemented LED with a PPFD of 100 μmol/(m2·s) |
| 300-Night | 18:00–24:00 supplemented LED with a PPFD of 300 μmol/(m2·s) |
| 500-Night | 18:00–24:00 supplemented LED with a PPFD of 500 μmol/(m2·s) |
| PSII | photosystem Ⅱ of the leaf |
| LED | light-emitting diodes |
References
- Tian, M.B.; Ma, W.H.; Xia, N.Y.; Peng, J.; Hu, R.Q.; Duan, C.Q.; He, F. Soil variables and reflected light revealed the plasticity of grape and wine composition: Regulation of the flavoromics under inner row gravel covering. Food Chem. 2023, 414, 135659. [Google Scholar] [CrossRef] [PubMed]
- Cheng, J.; Wei, L.; Wu, J. Effect of light quality selective plastic films on anthocyanin biosynthesis in Vitis vinifera L. cv. Yatomi Rosa. J. Agric. Sci. Technol. 2015, 17, 157–166. [Google Scholar]
- Sanders, R.D.; Boss, P.K.; Capone, D.L.; Kidman, C.M.; Maffei, S.; Jeffery, D.W. Methoxypyrazine concentrations in the grape bunch rachis of Vitis vinifera L. Cv Shiraz: Influence of rootstock, region and light. Food Chem. 2023, 408, 135234. [Google Scholar] [CrossRef]
- Li, C.X.; Chang, S.X.; Khalil-Ur-Rehman, M.; Xu, Z.G.; Tao, J.M. Effect of irradiating the leaf abaxial surface with supplemental light-emitting diode lights on grape photosynthesis. Aust. J. Grape Wine Res. 2017, 23, 58–65. [Google Scholar] [CrossRef]
- Marcelis, L.F.; Costa, J.M.; Heuvelink, E. Achieving sustainable greenhouse production: Present status, recent advances and future developments. In Achieving Sustainable Greenhouse Cultivation, 1st ed.; Marcelis, L., Heuvelink, E., Eds.; Burleigh Dodds Science Publishing Limited: Cambridge, UK, 2019; pp. 1–14. [Google Scholar]
- Katzin, D.; Marcelis, L.F.M.; van Mourik, S. Energy savings in greenhouses by transition from high-pressure sodium to LED lighting. Appl. Energy 2021, 281, 116019. [Google Scholar] [CrossRef]
- Kusuma, P.; Pattison, P.M.; Bugbee, B. From physics to fixtures to food: Current and potential LED efficacy. Hortic. Res. 2020, 7, 56. [Google Scholar] [CrossRef]
- Monteiro, A.I.; Malheiro, A.C.; Bacelar, E.A. Morphology, Physiology and Analysis Techniques of Grapevine Bud Fruitfulness: A Review. Agriculture 2021, 11, 127. [Google Scholar] [CrossRef]
- Hikosaka, K. Photosynthesis, chlorophyll fluorescence and photochemical reflectance index in photoinhibited leaves. Funct. Plant Biol. 2021, 48, 815–826. [Google Scholar] [CrossRef]
- Guo, R.; Lin, L.; Huang, G.; Shi, X.; Wei, R.; Han, J.; Zhou, S.; Zhang, Y.; Xie, T.; Bai, X.; et al. Transcriptome Analysis of ‘Kyoho’ Grapevine Leaves Identifies Heat Response Genes Involved in the Transcriptional Regulation of Photosynthesis and Abscisic Acid. Agronomy 2022, 12, 2591. [Google Scholar] [CrossRef]
- Ji, Y.; Nuñez Ocaña, D.; Choe, D.; Larsen, D.H.; Marcelis, L.F.M.; Heuvelink, E. Far-red radiation stimulates dry mass partitioning to fruits by increasing fruit sink strength in tomato. New Phytol. 2020, 228, 1914–1925. [Google Scholar] [CrossRef]
- Lichtenthaler, H.K.; Buschmann, C. Chlorophylls and Carotenoids: Measurement and Characterization by UV-VIS Spectroscopy. Curr. Protoc. Food Anal. Chem. 2001, 1, F4.3.1–F4.3.8. [Google Scholar] [CrossRef]
- Baker, N.R. Chlorophyll Fluorescence: A Probe of Photosynthesis In Vivo. Annu. Rev. Plant Biol. 2008, 59, 89–113. [Google Scholar] [CrossRef] [PubMed]
- Boasiako, T.A.; Boateng, I.D.; Ma, Y. Valorization of jujube puree using lactic acid bacteria and Acetobacter pasteurianus tri-cultured co-fermentation matrix: Insight into their nutritional, sensory, volatile and non-volatile metabolomics, and physicochemical properties. LWT 2025, 218, 117431. [Google Scholar] [CrossRef]
- Wu, Y.; Duan, S.; Zhao, L.; Gao, Z.; Luo, M.; Song, S.; Xu, W.; Zhang, C.; Ma, C.; Wang, S. Aroma characterization based on aromatic series analysis in table grapes. Sci. Rep. 2016, 6, 31116. [Google Scholar] [CrossRef]
- Boasiako, T.; Hua, F.; YuQing, X.; Boateng, I.; Ma, Y. Enzymatic catalytic dynamics of lactic-acetic acid co-fermentation: Effect of cellulase on the physicochemical, phytochemicals, volatiles, and antioxidant activity of jujube puree extracts. Ind. Crops Prod. 2024, 222, 119590. [Google Scholar] [CrossRef]
- Faust, J.E.; Holcombe, V.; Rajapakse, N.C.; Layne, D.R. The effect of daily light integral on bedding plant growth and flowering. HortScience 2005, 40, 645–649. [Google Scholar] [CrossRef]
- Ye, Z.-P.; Yu, Q. A coupled model of stomatal conductance and photosynthesis for winter wheat. Photosynthetica 2008, 46, 637–640. [Google Scholar] [CrossRef]
- Kaya, A.; Erturk, H.; Yalcin, R.A. Energy efficiency of solar illuminated vertical farms with different illumination strategies. Energy 2024, 307, 132609. [Google Scholar] [CrossRef]
- McCree, K.J. The action spectrum, absorptance and quantum yield of photosynthesis in crop plants. Agric. Meteorol. 1971, 9, 191–216. [Google Scholar] [CrossRef]
- Li, Y.; Liu, C.; Shi, Q.; Yang, F.; Wei, M. Mixed red and blue light promotes ripening and improves quality of tomato fruit by influencing melatonin content. Environ. Exp. Bot. 2021, 185, 104407. [Google Scholar] [CrossRef]
- Zou, J.; Zhang, Y.; Zhang, Y.; Bian, Z.; Fanourakis, D.; Yang, Q.; Li, T. Morphological and physiological properties of indoor cultivated lettuce in response to additional far-red light. Sci. Hortic. 2019, 257, 108725. [Google Scholar] [CrossRef]
- Lima, I.H.A.; Rodrigues, A.A.; Resende, E.C.; da Silva, F.B.; Farnese, F.d.S.; Silva, L.d.J.; Rosa, M.; Reis, M.N.O.; Bessa, L.A.; de Oliveira, T.C.; et al. Light means power: Harnessing light spectrum and UV-B to enhance photosynthesis and rutin levels in microtomato plants. Front. Plant Sci. 2023, 14, 1261174. [Google Scholar] [CrossRef] [PubMed]
- Li, T.; Heuvelink, E.; Dueck, T.A.; Janse, J.; Gort, G.; Marcelis, L.F. Enhancement of crop photosynthesis by diffuse light: Quantifying the contributing factors. Ann. Bot. 2014, 114, 145–156. [Google Scholar] [CrossRef] [PubMed]
- Murchie, E.H.; Niyogi, K.K. Manipulation of photoprotection to improve plant photosynthesis. Plant Physiol. 2011, 155, 86–92. [Google Scholar] [CrossRef]
- Magney, T.S.; Barnes, M.L.; Yang, X. On the Covariation of Chlorophyll Fluorescence and Photosynthesis Across Scales. Geophys. Res. Lett. 2020, 47, e2020GL091098. [Google Scholar] [CrossRef]
- Cao, H.; Wang, R.; Zhao, J.; Shi, L.; Huang, Y.; Wu, T.; Zhang, C. Genome-wide identification and expression analysis of the cryptochromes reveal the CsCRY1 role under low-light-stress in cucumber. Front. Plant Sci. 2024, 15, 1371435. [Google Scholar] [CrossRef]
- Yuan, Y.; Xie, Y.; Li, B.; Wei, X.; Huang, R.; Liu, S.; Ma, L. To improve grape photosynthesis, yield and fruit quality by covering reflective film on the ground of a protected facility. Sci. Hortic. 2024, 327, 112792. [Google Scholar] [CrossRef]
- Cheng, G.; Wu, D.; Yu, H.; Feng, Q.; Zhang, J.; Xie, L.; Bai, Y.; Xie, T.; Zhou, Y.; Zhou, S. Effect of application of reflecting film and leaf removal on microclimate around fruiting zone and fruit quality of Vitis quinquangularis Rehd grape. Southwest China J. Agric. Sci. 2020, 33, 2912–2920. [Google Scholar]
- Xinming, L.; Ting, C.; Jinhui, L.; Yan, L. Effects of reflective film on the coloration and quality of Kyoho grape. Fujian J. Agric. Sci. 2023, 38, 559–565. [Google Scholar]
- Dai, Z.W.; Ollat, N.; Gomès, E.; Decroocq, S.; Tandonnet, J.-P.; Bordenave, L.; Pieri, P.; Hilbert, G.; Kappel, C.; van Leeuwen, C.; et al. Ecophysiological, Genetic, and Molecular Causes of Variation in Grape Berry Weight and Composition: A Review. Am. J. Enol. Vitic. 2011, 62, 413. [Google Scholar] [CrossRef]
- Wu, Y.; Li, X.; Zhang, W.; Wang, L.; Li, B.; Wang, S. Aroma profiling of Shine Muscat grape provides detailed insights into the regulatory effect of gibberellic acid and N-(2-chloro-4-pyridinyl)-N-phenylurea applications on aroma quality. Food Res. Int. 2023, 170, 112950. [Google Scholar] [CrossRef]
- Li, J.; Ma, T.; Bao, S.; Yin, D.; Ge, Q.; Li, C.; Fang, Y.; Sun, X. Suitable crop loading: An effective method to improve “Shine Muscat” grape quality. Food Chem. 2023, 424, 136451. [Google Scholar] [CrossRef] [PubMed]
- Niu, Y.; Han, Y.; Li, Y.; Zhang, M.; Li, H. Low–carbon regulation method for greenhouse light environment based on multi–objective optimization. Expert Syst. Appl. 2024, 252, 124228. [Google Scholar] [CrossRef]


| Supplemental Light Time hh:mm | Intensity of Supplemental Light [μmol·m−2·s−1] | Naming |
|---|---|---|
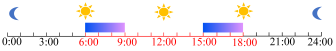 6:00–9:00, 15:00–18:00 | 50 | 50-Day |
| 100 | 100-Day | |
| 200 | 200-Day | |
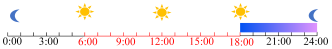 18:00–24:00 | 100 | 100-Night |
| 300 | 300-Night | |
| 500 | 500-Night | |
| Unsupplemented | 0 | CK |
| Treatment | α | Pmax [μmol·m2·s−1] | Rd [μmol·m−2·s−1] | Pmax/Chl [μmol·g·m−2·s−1·mg−1] |
|---|---|---|---|---|
| CK | 0.042 ± 0.002 a | 4.81 ± 2.64 a | 0.95 ± 0.15 a | 3.59 ± 1.81 a |
| 50-Day | 0.038 ± 0.008 a | 6.36 ± 1.55 a | 0.75 ± 0.21 a | 3.90 ± 1.78 a |
| 100-Day | 0.036 ± 0.005 a | 6.12 ± 1.97 a | 0.39 ± 0.13 a | 2.72 ± 0.72 a |
| 200-Day | 0.046 ± 0.009 a | 7.50 ± 3.17 a | 0.75 ± 0.22 a | 3.26 ± 0.67 a |
| 100-Night | 0.047 ± 0.011 a | 7.30 ± 2.33 a | 0.74 ± 0.13 a | 3.36 ± 1.44 a |
| 300-Night | 0.056 ± 0.010 a | 8.04 ± 0.25 a | 0.88 ± 0.10 a | 3.73 ± 1.30 a |
| 500-Night | 0.050 ± 0.012 a | 5.20 ± 2.36 a | 0.88 ± 0.25 a | 2.46 ± 0.06 a |
| Treatment | Vitamin C [mg/100g] | Total Acidity [g/kg] | Total Soluble Solid [%] | Glucose [g/100g] |
|---|---|---|---|---|
| CK | 4.81 ± 0.18 cd | 3.66 ± 0.16 a | 15.83 ± 0.14 a | 14.43 ± 0.10 b |
| 50-Day | 5.45 ± 0.16 b | 3.20 ± 0.19 b | 16.14 ± 0.46 a | 14.79 ± 0.50 b |
| 100-Day | 5.95 ± 0.24 a | 3.01 ± 0.15 bc | 16.38 ± 0.22 a | 14.80 ± 0.51 b |
| 200-Day | 4.42 ± 0.11 d | 2.86 ± 0.07 c | 16.86 ± 0.05 a | 14.98 ± 0.11 b |
| 100-Night | 4.34 ± 0.10 d | 2.84 ± 0.06 c | 16.46 ± 0.86 a | 15.13 ± 0.42 b |
| 300-Night | 3.85 ± 0.05 e | 2.88 ± 0.07 c | 16.82 ± 0.06 a | 17.30 ± 0.36 a |
| 500-Night | 5.02 ± 0.24 bc | 3.18 ± 0.06 b | 16.38 ± 0.42 a | 16.32 ± 0.09 a |
Disclaimer/Publisher’s Note: The statements, opinions and data contained in all publications are solely those of the individual author(s) and contributor(s) and not of MDPI and/or the editor(s). MDPI and/or the editor(s) disclaim responsibility for any injury to people or property resulting from any ideas, methods, instructions or products referred to in the content. |
© 2025 by the authors. Licensee MDPI, Basel, Switzerland. This article is an open access article distributed under the terms and conditions of the Creative Commons Attribution (CC BY) license (https://creativecommons.org/licenses/by/4.0/).
Share and Cite
Yuan, Y.; Liu, S.; Xie, Y.; Nie, J.; Yang, X.; Huang, R. The Effects of Light Duration and Intensity with Supplemental Light-Emitting Diode Lights on Grape Photosynthesis, Yield, and Fruit Quality. Agronomy 2025, 15, 518. https://doi.org/10.3390/agronomy15030518
Yuan Y, Liu S, Xie Y, Nie J, Yang X, Huang R. The Effects of Light Duration and Intensity with Supplemental Light-Emitting Diode Lights on Grape Photosynthesis, Yield, and Fruit Quality. Agronomy. 2025; 15(3):518. https://doi.org/10.3390/agronomy15030518
Chicago/Turabian StyleYuan, Yu, Shuqing Liu, Yuming Xie, Jun Nie, Xin Yang, and Rutao Huang. 2025. "The Effects of Light Duration and Intensity with Supplemental Light-Emitting Diode Lights on Grape Photosynthesis, Yield, and Fruit Quality" Agronomy 15, no. 3: 518. https://doi.org/10.3390/agronomy15030518
APA StyleYuan, Y., Liu, S., Xie, Y., Nie, J., Yang, X., & Huang, R. (2025). The Effects of Light Duration and Intensity with Supplemental Light-Emitting Diode Lights on Grape Photosynthesis, Yield, and Fruit Quality. Agronomy, 15(3), 518. https://doi.org/10.3390/agronomy15030518