Article

Optimized Phosphorus Application Under Water Stress Enhances Photosynthesis, Physiological Traits, and Yield in Soybean During Flowering Stage

1
College of Agronomy, Heilongjiang Bayi Agricultural University, Daqing 163000, China
2
College of Modern Agriculture and Ecological Environment, Heilongjiang University, Harbin 150080, China
3
School of Water Conservancy and Electric Power, Heilongjiang University, Harbin 150080, China
4
National Multigrain Engineering and Technology Center, Daqing 163000, China
*
Author to whom correspondence should be addressed.
Agronomy 2025, 15(2), 444; https://doi.org/10.3390/agronomy15020444
Submission received: 14 January 2025 / Revised: 9 February 2025 / Accepted: 10 February 2025 / Published: 11 February 2025

Abstract

:
Phosphorus application is widely regarded as a key measure for improving crop resistance to drought. This study investigated the effect of appropriate phosphorus fertilization on photosynthesis, physiological traits, and yield under water stress during the soybean flowering stage and selected the drought-sensitive soybean variety “Sui Nong 26” as the pot experiment object under a completely randomized design. The experiment was designed with three irrigation lower limits, corresponding to 70%, 60%, and 50% of the field capacity (FC), referred to as T1, T2, and T3. Four phosphorus fertilizer applications were also included: 0, 40, 50, and 60 mg·kg (designated as P0, P1, P2, and P3), resulting in a total of 12 treatments. Photosynthetic parameters, antioxidant enzyme activities, membrane lipid peroxidation, osmotic adjustment substances, yield, and yield components were measured to assess the effects of phosphorus fertilization on drought resistance. Results showed that under water stress, moderate phosphorus application (P1 and P2) enhanced photosynthetic capacity, antioxidation, osmotic adjustment, and yield, particularly by scavenging excess reactive oxygen species, protecting cells from oxidative damage, and maintaining metabolic balance, leading to increased yield. The average net photosynthetic rate and yield per plant under P1 and P2 levels increased by 33.53% and 37.67%, and 20.7% and 15.6%, respectively, compared to P0. In contrast, excessive phosphorus application (P3) improved the above parameters but had a significantly lower effect than moderate phosphorus application. Thus, appropriate phosphorus application is crucial for soybeans under water stress. Moderate application not only alleviates drought stress but also boosts soybean yield. This study highlights the importance of appropriate phosphorus use for mitigating water stress, offering scientific evidence for its practical application in agriculture. At the same time, with the increasing severity of climate change and water scarcity, phosphorus fertilizer application strategies under varying water conditions provide critical support for the application of precision agriculture technologies and ensuring food security.

1. Introduction

Soybean (Glycine max (L.) Merr., 1917), also known as soja bean or soya bean, is an important economic crop used for both food and oil production [1]. Its main components include high-quality plant proteins and various phytochemicals, making it a crucial crop in addressing global food security challenges by 2050 [2]. China is the fourth largest soybean producer in the world [3], and soybean growing regions are mainly characterized by a continental monsoon climate, with an uneven seasonal rainfall distribution and significant annual fluctuations in precipitation. As a result, agricultural production is often affected by drought [4]. The appropriate application of phosphorus fertilizer helps improve crop drought resistance. However, in many regions, excessive phosphorus fertilization is used to mitigate the adverse effects of drought on agriculture. This practice not only causes environmental problems but also suppresses crop photosynthetic capacity, disrupts reactive oxygen species metabolism and physiological processes in leaves, and interferes with normal plant growth and development, ultimately reducing yield [5].
Water stress is one of the most important limiting factors affecting the productivity of many crops [6]. The impact of water stress on soybeans is multifaceted, and previous studies have shown that different physiological responses occur at various growth stages, particularly during the flowering stage [7]. Water stress inhibits photosynthetic parameters, physiological characteristics, and yield-related traits. Photosynthesis, a core physiological process for plant growth and yield formation, is particularly susceptible to significant impacts under water stress. Under mild water stress, the stomatal conductance (Gs) and transpiration rate (Tr) of soybean leaves decrease markedly, resulting in reduced intercellular CO2 concentration (Ci), restricted carbon assimilation, and decreased photosynthetic efficiency [8,9]. As water stress intensifies, plants reduce water loss by closing their stomata; however, this short-term protective mechanism limits CO2 uptake, further suppressing photosynthesis and reducing the plant’s overall photosynthetic capacity [10]. Water stress can also disrupt the antioxidant system in soybeans, leading to the accumulation of reactive oxygen species (ROS), which damage cell membranes and trigger membrane lipid peroxidation [11]. Additionally, the osmotic regulation system is activated under water stress, and the accumulation of osmotic adjustment substances such as soluble sugars, soluble proteins, and proline helps mitigate the damage caused by stress to the cells [12]. With prolonged water stress, leaf wilting, chlorosis, and even abscission occur, leading to reduced dry matter accumulation. Plant morphological indicators are severely affected, and yield loss can exceed 70% [13]. Therefore, implementing optimized water management practices is crucial for promoting soybean growth and development.
The application of phosphorus fertilizers helps plants tolerate drought stress [14]. Under water stress conditions, phosphorus, as an essential nutrient for plants, plays a crucial role in regulating the drought resistance of soybeans [15]. Phosphorus is not only a fundamental component of vital biomolecules such as nucleic acids, lipids, and adenosine triphosphate (ATP) but also an essential nutrient for photosynthesis. It directly participates in the synthesis and transport of carbohydrates and plays a critical role in maintaining chloroplast structure and the functionality of photosynthetic organs [16,17]. Phosphorus can improve soybean photosynthetic parameters, enhance chlorophyll content, and increase the plant’s photosynthetic efficiency, thereby boosting drought resistance [13]. Phosphorus also plays a role in regulating metabolic pathways within plants, particularly under water-deficient conditions, where it alleviates the adverse effects of water stress. [18]. However, excessive phosphorus fertilization can negatively affect plant growth and development, particularly by reducing the synthesis of antioxidant compounds such as flavonoids, thereby decreasing antioxidant activity [19]. Therefore, the rational use of phosphorus is a key factor for enhancing plant photosynthesis, antioxidant capacity, and further promoting crop growth and yield.
Heilongjiang Province is one of the most important soybean production areas in China, contributing to more than 40% of the total national soybean output. Under the current climate changeable environmental conditions, the western region of Heilongjiang Province has a low precipitation amount with an uneven spatial and temporal distribution. And the frequent shortage of water resources has seriously affected the growth and development of soybeans [20]. Since the 1970s, in order to pursue high grain yields, China has applied chemical fertilizers in large quantities, which has not only led to the waste of fertilizer resources but also caused environmental pollution [21]. Therefore, it is urgent to optimize the water and fertilizer management systems. Previous study showed that phosphorus supply increased canopy photosynthesis and chlorophyll content. However, how phosphorus supply affects the physiological characteristics and yield of soybeans under water stress is not known [13]. Thus, this study uses the “Sui Nong 26” soybean variety as the experimental material, with different water and phosphorus fertilizer levels applied. The aim is to investigate the impact of phosphorus fertilizer application on soybean photosynthetic parameters, physiological traits, and yield indicators under different water stress conditions, with the goal of providing theoretical guidance for efficient soybean cultivation under water-limited conditions and contributing to sustainable green agriculture development.

2. Materials and Methods

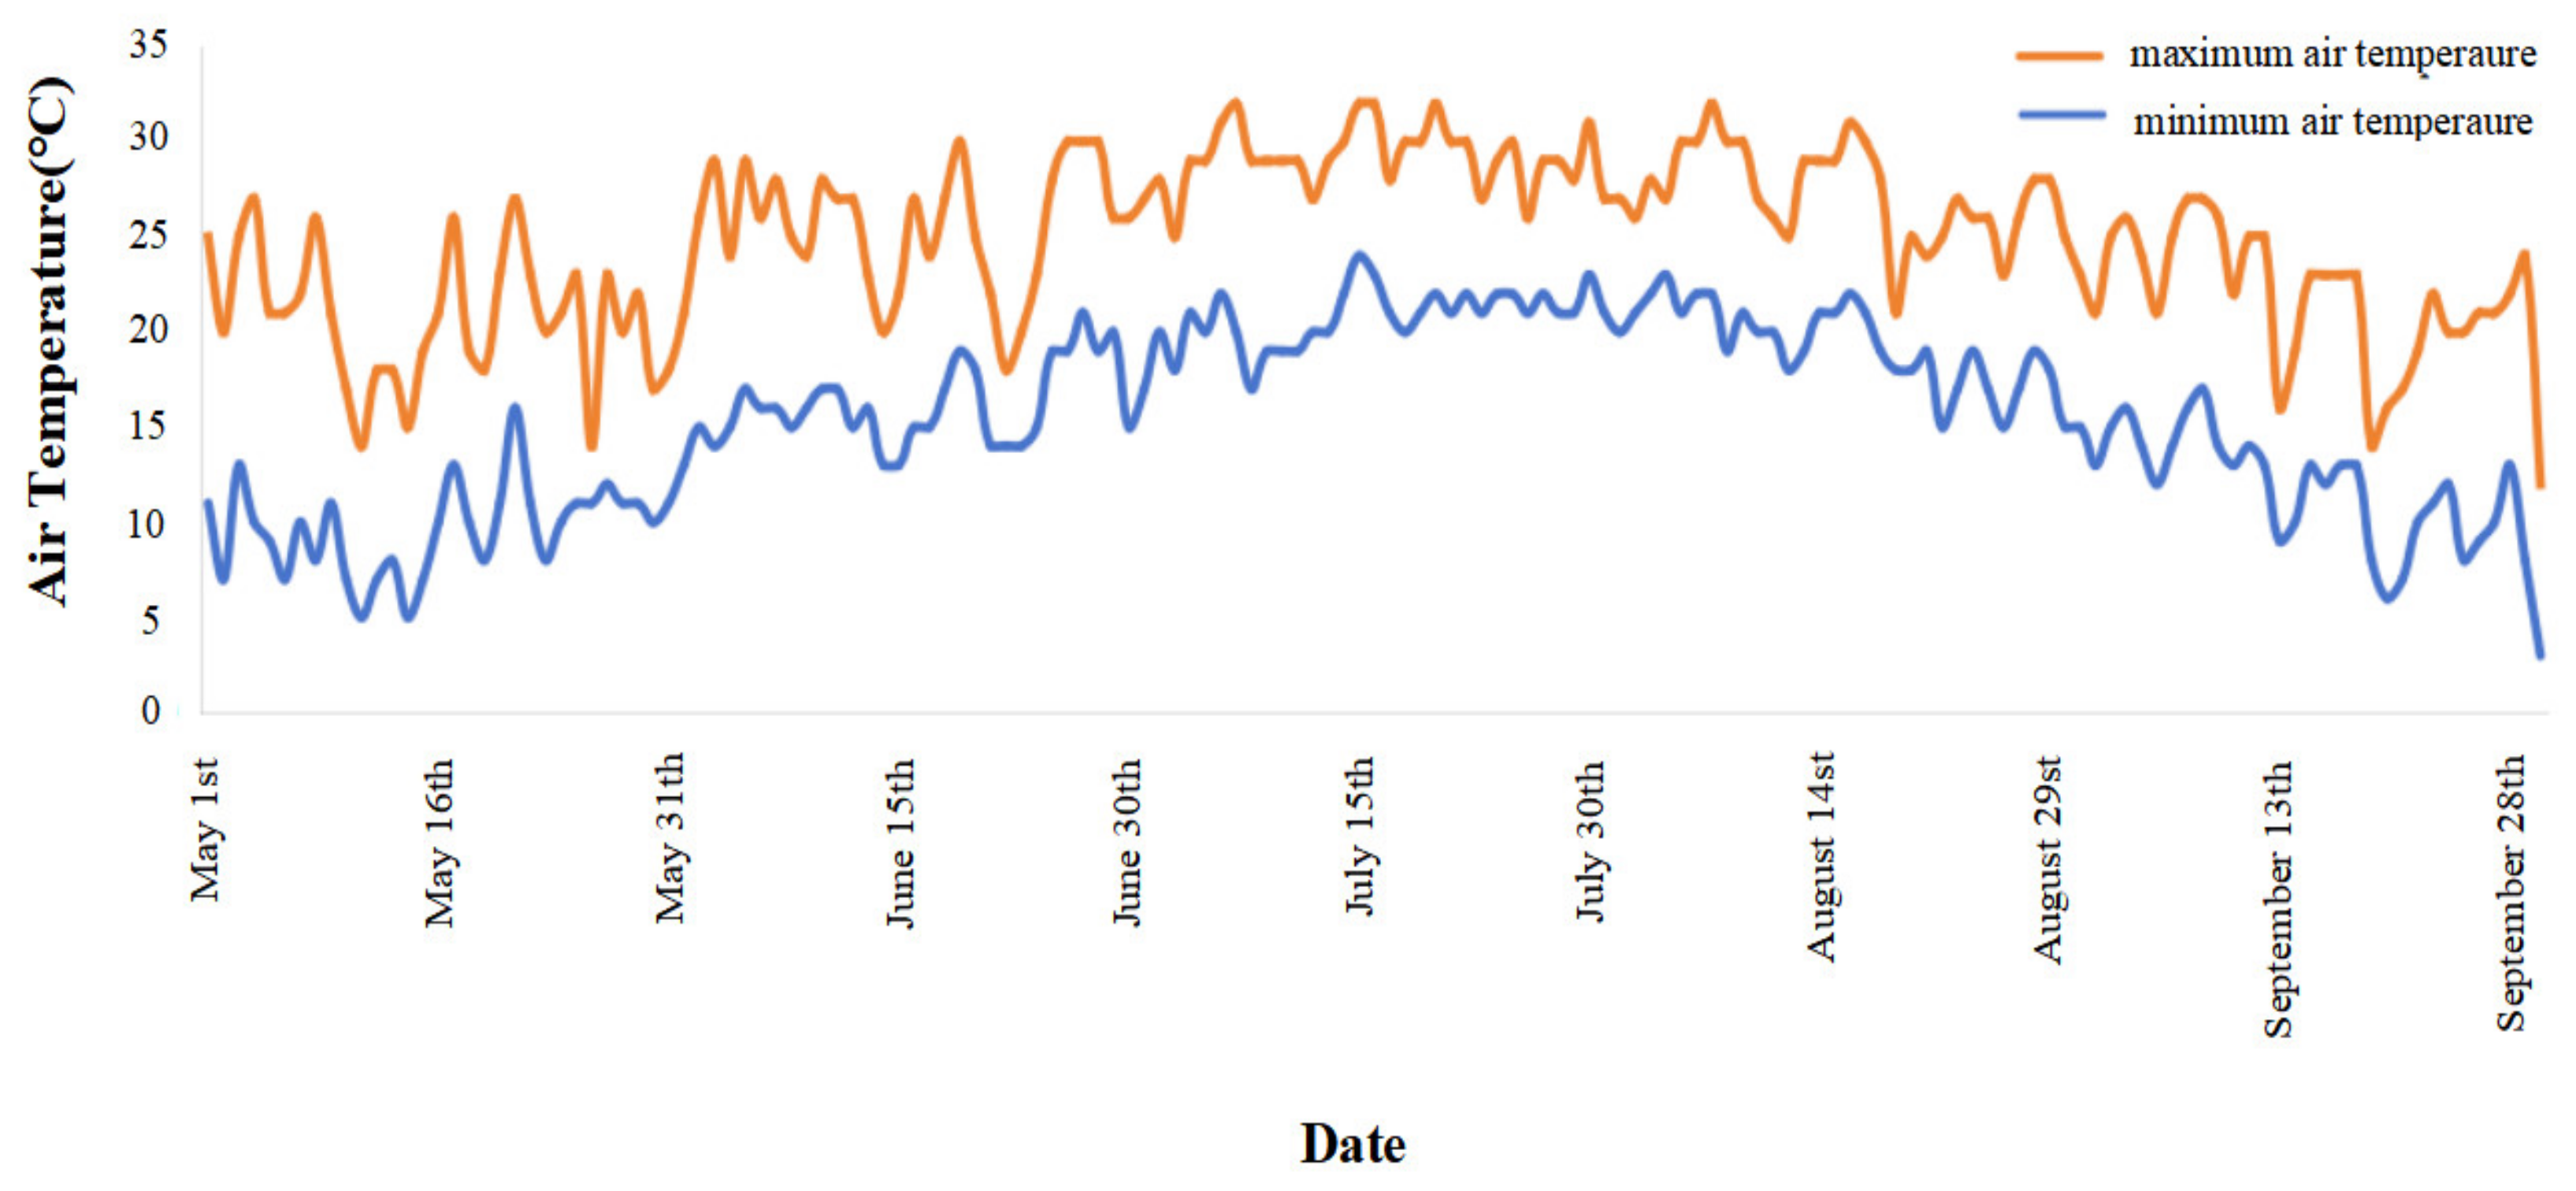
2.1. Experimental Site

The experimental soybean variety used in this study is the drought-sensitive “Sui Nong 26”, which has an indeterminate pod-setting habit and a growth period of approximately 120 days. The experiment was conducted in 2024 at the National Engineering Technology Research Center for Minor Grain Crops in Daqing City, Heilongjiang Province, China (Latitude 46°39′ N, Longitude 124°51′ E). The location experiences an average annual sunshine duration of 2843.5 h and an average annual temperature of 4.9 °C. The maximum and minimum air temperatures are shown in Figure 1. The experimental soil used was calcareous black calcium soil, collected from the plow layer (20 cm depth) of the test base of the University of Heilongjiang Bayi Agricultural. The basic fertility of the soil was as follows: alkali-hydrolyzable nitrogen 74.75 mg kg−1, available phosphorus 31.30 mg kg−1, available potassium 115 mg kg−1, organic matter 37.17 g kg−1, and pH 8.06.

2.2. Experimental Design

Table 1 shows the details of the experimental treatments. This study set two factors: water stress and phosphorus fertilizer. For water stress, three levels were established: mild water stress, moderate water stress, and severe water stress (Table 1). The treatments were as follows: T1: field capacity maintained at 70 ± 5% throughout the growing season; T2: field capacity maintained at 60 ± 5% throughout the growing season; T3: field capacity maintained at 50 ± 5% throughout the growing season. For phosphorus fertilizer, four levels were set: P0: 0 mg/kg, P1: 40 mg/kg, P2: 50 mg/kg (local conventional application rate), and P3: 60 mg/kg.
The experiment adopted a completely randomized design, with a total of 12 treatments, each repeated 6 times. The pot experiment used 18 kg of soil per pot. Before filling the pots, nitrogen and potassium fertilizers were applied according to the local fertilization recommendations. The local standard fertilization rates were as follows: urea at 60 mg/kg (46% N), potassium sulfate at 100 mg/kg (50% K2O), and superphosphate (44% P2O5) applied according to the four phosphorus gradients listed in Table 1. Among them, P2 is the local normal fertilizer application amount. The fertilizers were thoroughly mixed with the soil and filled into the pots (pot diameter: 20 cm and height: 33 cm). Soybean seeds with full grains and a uniform size were selected for sowing on 23 May 2024. Eight seeds were sown per pot and covered with 1 kg of soil. After germination, seedlings were thinned to retain three uniformly growing seedlings per pot.
Water control was achieved using the weighing method, followed by manual irrigation to maintain the target water content for each treatment. Water control was ceased after the sampling at soybean maturity (23 September 2024).

2.3. Measurement Items and Methods

2.3.1. Field Capacity Measurement Using the Ring Knife Method

The purpose of measuring the field water-holding capacity is to provide a scientific basis for accurately replenishing water using the gravimetric method. By determining the soil’s maximum water retention capacity, the required amount of water replenishment can be precisely calculated.

Soil Sample Collection

For collecting soil samples, select a ring knife of appropriate size (diameter 5 cm and height 4 cm), record the weight of the ring knife, and then insert it vertically into the target soil layer at a depth of 20 cm, ensuring that the soil is evenly packed without gaps inside the ring knife. Carefully remove the ring knife and trim off any excess soil at both ends using a knife so that the soil surface is level with the edge of the ring knife. The soil inside the ring knife at this point is considered undisturbed soil. Subtract the weight of the ring knife to determine the weight of the undisturbed soil [22].

Wet Soil Mass Measurement

After removing the ring knife with the soil sample, use gauze and rubber bands to fix the bottom of the ring knife and place it in a dish filled with water, ensuring that the soil sample is in full contact with the water surface to facilitate water absorption. Continue until the soil sample is fully saturated. Once absorption is complete, weigh the ring knife along with the wet soil and record the weight as the wet soil mass.

Dry Soil Mass Measurement

Place the soil sample and ring knife in an aluminum container of known weight; then, place it in a preheated oven at 105 °C. Dry the sample until it reaches a constant weight (typically for 8 h). After drying, remove the sample and weigh the dry soil mass.

Field Capacity Calculation

The field capacity is calculated based on the difference between the wet and dry soil masses using the following formula, where the wet soil mass is the mass of the soil after the absorption of water and the dry soil mass is the mass of the soil after drying at 105 °C until a constant weight is achieved.
T h e   f i e l d   c a p a c i t y % = W e t   s o i l   m a s s D r y   s o i l   m a s s D r y   s o i l   m a s s × 100 %

2.3.2. Measurement of Leaf Photosynthetic Parameters

Maleki et al. proposed that the flowering stage is the most sensitive period for soybean growth and development under water stress conditions [23].
The photosynthetic parameters of functional soybean leaves were measured using a Li-6400 portable photosynthesis system (LI-COR, Lincoln, NE, USA). Measurements were conducted between 9:00 and 11:00 a.m. during the flowering stage. The net photosynthetic rate (Pn), intercellular CO2 concentration (Ci), stomatal conductance (Gs), and transpiration rate (Tr) were measured on fully expanded second leaves from the top of the plant under different treatments. The specific method involved selecting the second functional leaf from the top of each plant. Each leaf was measured three times, and the average value was recorded as the independent phenotypic value of the leaf.

2.3.3. Measurement of Leaf Physiological Parameters

Physiological sampling was conducted during the flowering stage (when flowers appear at any node on the main stem of the soybean plant). Three independent functional leaves were randomly collected for each replicate, chopped along the leaf veins, and quickly placed into bags before being frozen in liquid nitrogen. Afterward, the samples were transferred to a −80 °C freezer for further analysis of the antioxidant system and osmotic regulation system parameters in the lab of National Multigrain Engineering and Technology Center in Heilongjiang Bayi Agricultural University.

Leaf Antioxidant System Parameters

Superoxide dismutase (SOD) activity: The activity of SOD was determined using the nitroblue tetrazolium (NBT) reduction method, as described by Beauchamp et al. [24]. Fresh leaves samples were homogenized in phosphate-buffered saline (PBS, pH 7.8) and centrifuged to obtain the enzyme extract. The reaction mixture consisted of methionine (MET), ethylene–diamine–tetraacetic acid disodium salt (EDTA-Na2), and nitroblue tetrazolium (NBT). An aliquot of the enzyme extract was added to the reaction mixture, followed by the addition of riboflavin. The reaction was conducted in glass test tubes under light illumination. After the reaction, the absorbance was measured at 560 nm to determine SOD activity.
Peroxidase (POD) activity: The POD activity was determined specifically with guaiacol at 470 nm following the method by Egley et al. [25]. One ml of the enzyme extract was added to the reaction mixture containing 0.855 μL of the guaiacol solution and 1.355 μL of the hydrogen peroxide solution in 3 mL of phosphate buffer (pH 7.0). One unit of POD activity was defined as the amount of enzyme that catalyzes the conversion of 0.01 μmol of H2O2 per minute per milligram of tissue protein.
Hydrogen peroxide (H2O2) content: The H2O2 content in the leaf samples was measured colorimetrically using a modified method described by Mukherjee and Choudhuri [26]. Leaf samples were extracted with cold acetone to determine the H2O2 content. An aliquot (1 mL) of the extract was mixed with 200 μL of 0.1% titanium dioxide in 20% H2SO4. The mixture was then centrifuged at 6000× g for 15 min. The intensity of the yellow color in the supernatant was measured at 415 nm.
Malondialdehyde (MDA) content: The content of MDA was determined using the thiobarbituric acid (TBA) method. A total of 0.2 g of fresh leaf tissue was homogenized in 0.25% 2-thiobarbituric acid (TBA) prepared in 10% trichloroacetic acid (TCA) using a mortar and pestle. Lipid peroxidation was assessed by measuring the concentration of TBA-reactive products, which were equated with malondialdehyde (MDA). A reaction mixture consisting of 3 mL of 0.5% TBA and 1 mL of the extract was boiled for 10 min and then rapidly cooled to room temperature. The content of TBA-reactive products (MDA) was expressed as µmol·g−1 fresh weight (FW) following the method outlined by Heath and Packer [27].

Leaf Osmotic Adjustment System Parameters

Soluble sugar content (SS): Soluble sugars were extracted using an alcohol-boiling water bath. After obtaining the supernatant, an aliquot of the soluble sugar extract was mixed with anthrone, and the absorbance was measured at a wavelength of 620 nm to determine the soluble sugar content (following a modified method by Yemm and Willis [28]).
Soluble protein content (SP): A total of 0.1 g of fresh leaves was taken from each treatment and ground in a mortar with 1 mL of a phosphate-buffered solution (PBS, pH 7.8). The homogenate was then centrifuged at 12,000 rpm and 4 °C to obtain the crude protein extract. The soluble protein content was measured according to the method by Zhang et al. [29]. Specifically, the protein extract was mixed with 5 mL of the Coomassie Brilliant Blue reagent and allowed to react for 2 min, and the protein content was determined by measuring the absorbance at 595 nm.
Proline content (PRO): The free proline content was determined according to the method by Bates et al. [30]. A total of 0.5 g of fresh leaf samples from each group was homogenized in 3% (w/v) sulfosalicylic acid, and the homogenate was then filtered through filter paper. After the addition of acid ninhydrin and glacial acetic acid, the resulting mixture was heated at 100 °C for 1 h in a water bath. The reaction was stopped by placing the mixture in an ice bath. The mixture was then extracted with toluene, and the absorbance of the toluene phase was measured at 520 nm. The proline concentration was determined using a calibration curve and expressed as μmol g−1 FW.

2.3.4. Measurement of Yield and Yield Components

At the soybean maturity stage, three additional replicates were taken for yield measurement. The following parameters were measured manually: number of seeds per plant (pieces), number of pods per plant (pieces), number of nodes on the main stem (pieces), seed weight per plant (grams), and hundred-seed weight (grams).

2.4. Data Processing

The data were processed using Excel 2021 (Microsoft, Redmond, WA, USA), and GraphPad Prism 8 was used to plot the bar charts of the photosynthetic and physiological parameters. Duncan’s post hoc test was performed using SPSS 27.0 to assess the significance of photosynthetic, physiological, and yield-related parameters. Spearman’s and Mantel’s correlation analysis was used to determine the relationships between photosynthetic parameters, physiological indicators, and yield components.

3. Results

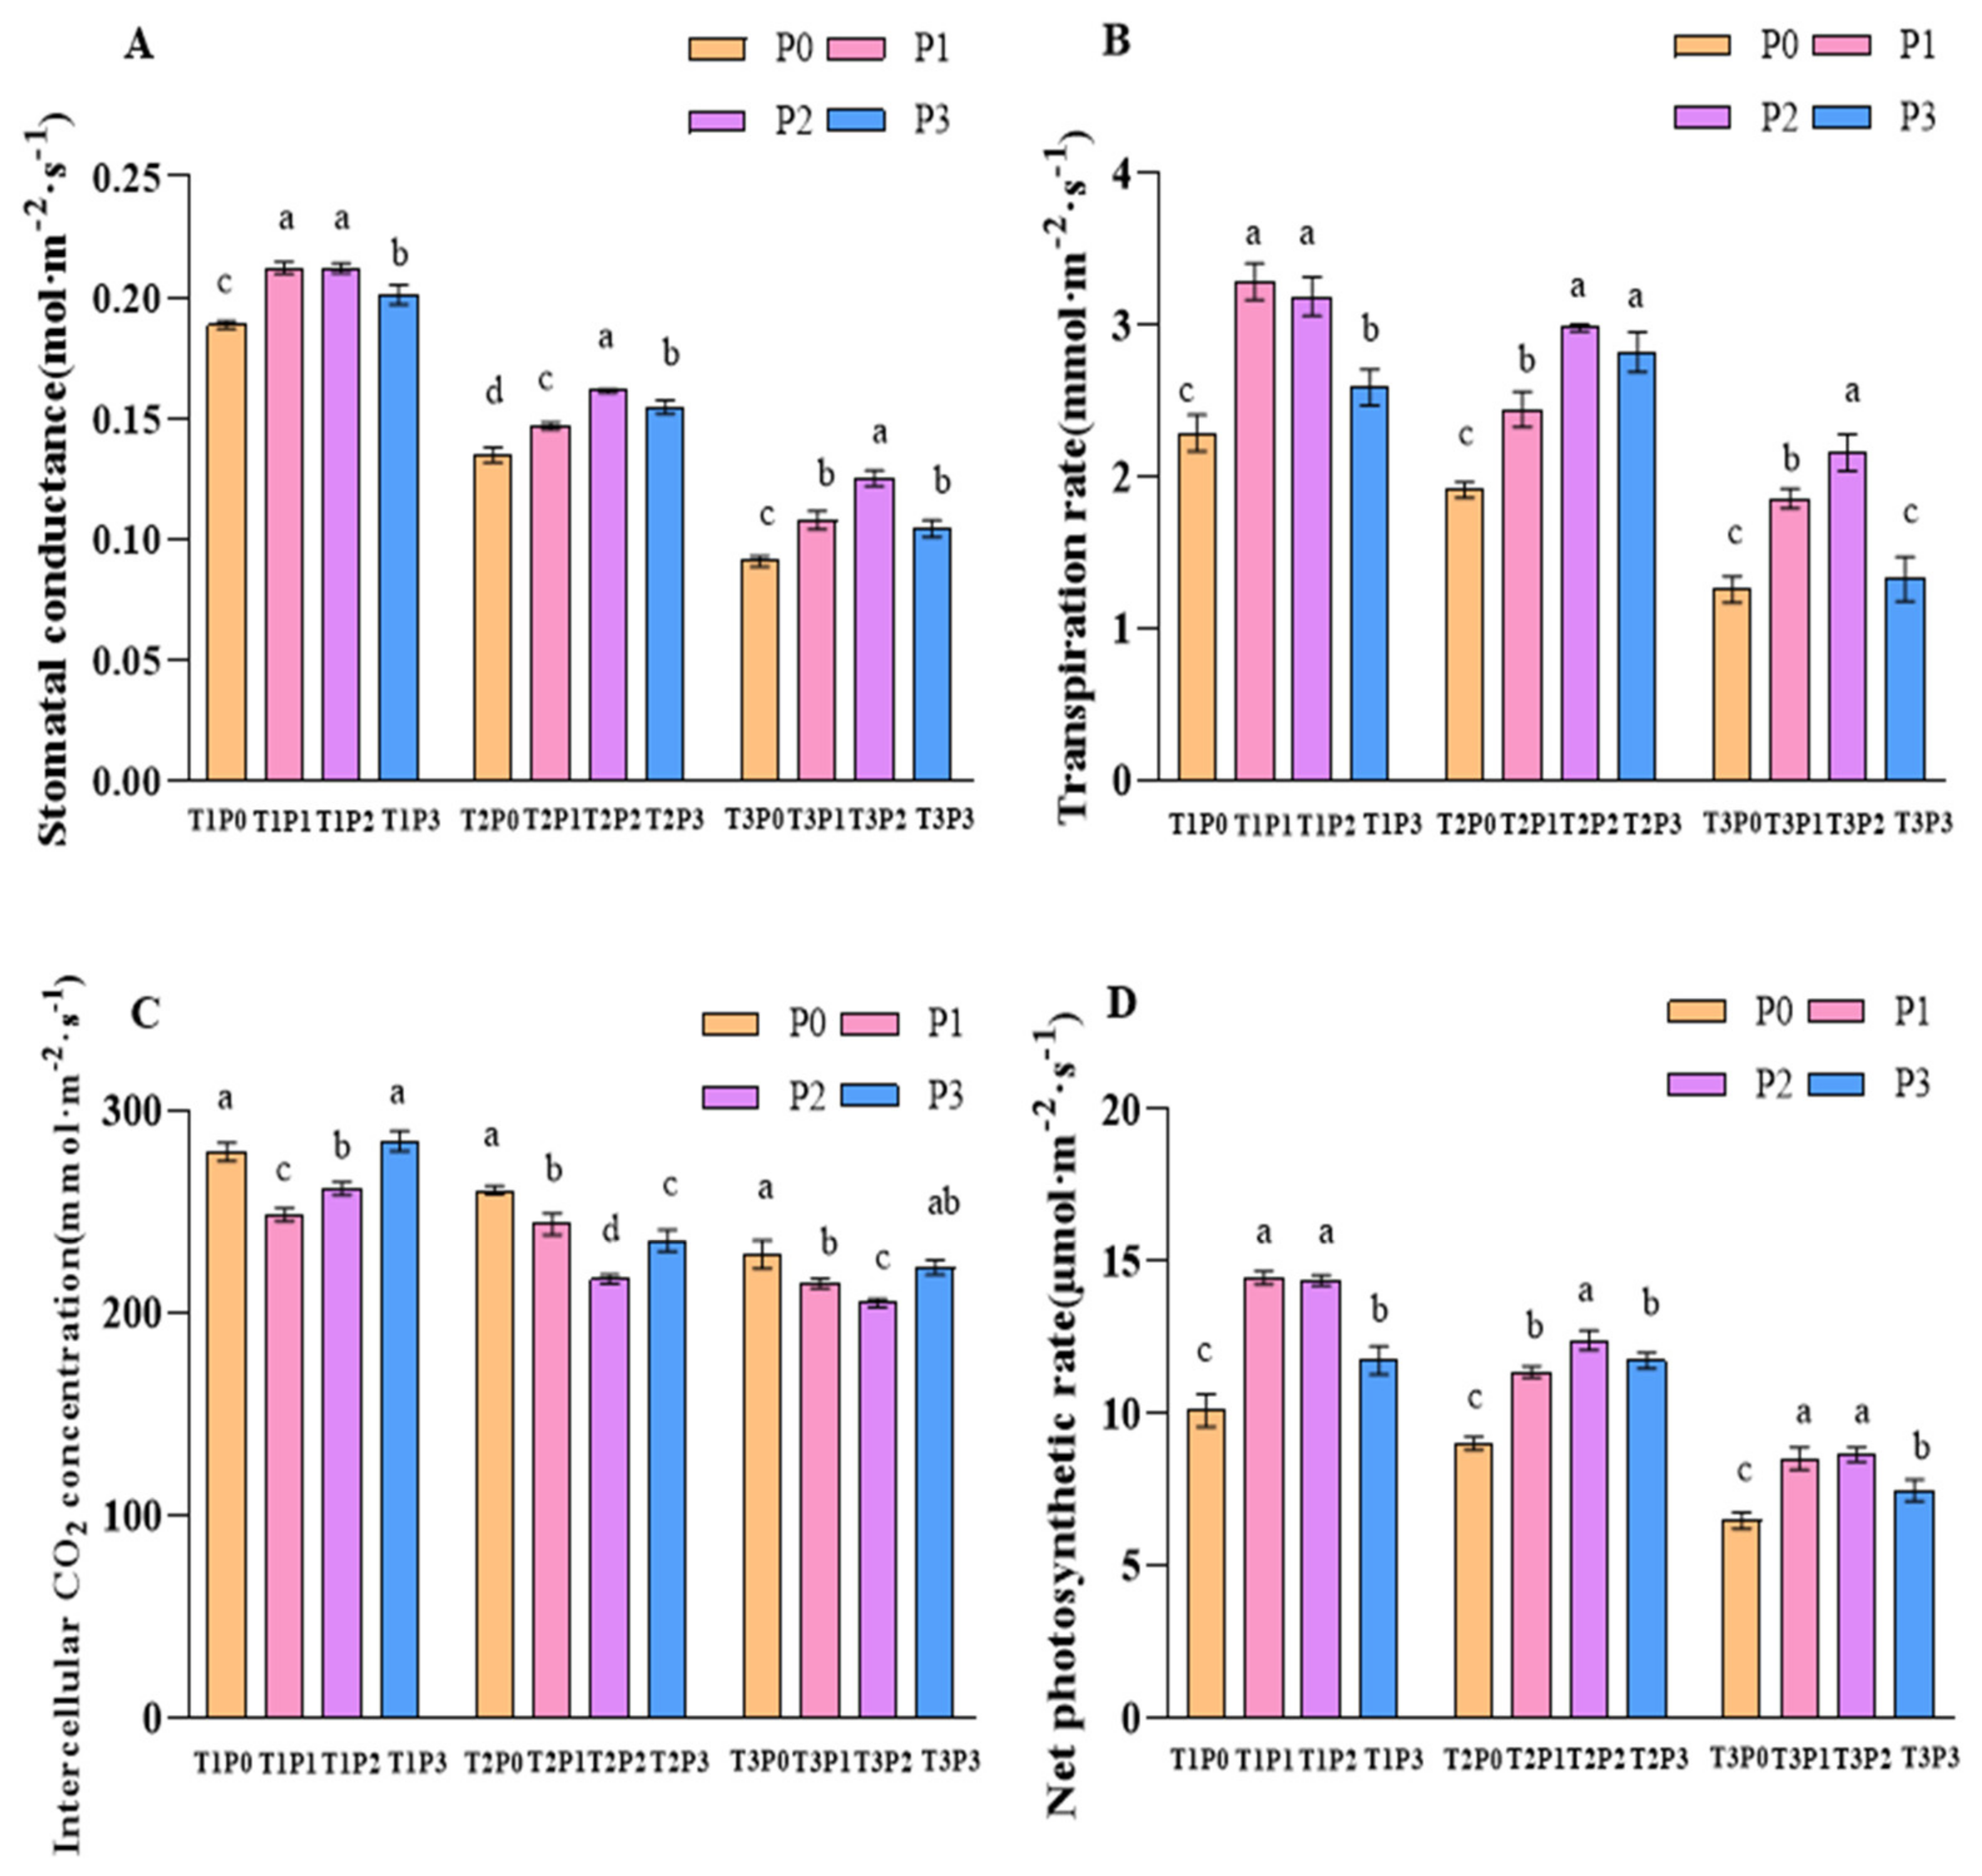
3.1. The Effect of Phosphorus Application on Photosynthetic Parameters Under Water Stress

3.1.1. Stomatal Conductance (Gs)

As shown in Figure 2A, under T1 conditions, Gs significantly increased under the P1 and P2 treatments, with increases of 12.5% and 12.4%, respectively, compared to P0. However, under the P3 treatment, Gs decreased to 0.2011 mol m−2·s−1. Under T2 conditions, moderate phosphorus application (P2) significantly increased by 19.8% compared to P0. Under T3 conditions, overall Gs decreased, and the inhibitory effect of severe water stress on Gs further intensified. The Gs reached its highest value under the P2 treatment, and it significantly increased by 37.9% and 20.1% compared to P0 and P3. There was no significant difference in Gs between the P3 and P1 treatments in the T3 condition.

3.1.2. Transpiration Rate (Tr)

As shown in Figure 2B, under T1 conditions, the Tr under P1 significantly increased by 43.7% compared to P0, while there was no significant difference between P1 and P2. Under T2 conditions, the Tr under P2 significantly increased by 56% compared to P0, while there was no significant difference between P2 and P3. Under T3 condition, the Tr under P2 significantly increased by 71.4% and 62.4% compared to P0 and P3, respectively.

3.1.3. Intercellular Carbon Dioxide Concentration (Ci)

Under T1 conditions, with increasing phosphorus application, Ci initially decreased and then increased. Compared to P0, the P1 and P2 treatments reduced Ci by 11.0% and 6.4%, respectively. P3 resulted in a significant increase in Ci to 285.01 μmol·mol−1, exceeding the level of P0. Under T2 conditions, moderate water stress significantly enhanced the regulatory effect of phosphorus on Ci. The Ci was lowest under the P2 treatment, which was 16.8% lower than that of P0. The P3 treatment also reduced Ci under T2 conditions, but its concentration remained significantly higher than that of P2. Under T3 conditions, overall Ci increased. The Ci under the P2 treatment was 10.5% lower than that under P0, while the P3 treatment was close to the P0 level (Figure 2C).

3.1.4. Net Photosynthetic Rate (Pn)

As shown in Figure 2D, under T1 conditions, the Pn under the P0 treatment was significantly reduced by 30% and 29.6%, respectively, compared to the P1 and P2 treatments where there was no significant difference between P1 and P2. Under T2 conditions, when the Pn under P2 reached 12.76 μmol·m−2·s−1, it significantly increased by 37.4% compared to P0. Under T3 conditions, the Pn under P1 and P2 was significantly increased by 31.4% and 33.4% compared to P0 where there was no significant difference between P1 and P2.

3.2. The Effect of Phosphorus Application on the Antioxidant System Under Water Stress

3.2.1. Antioxidant Enzyme Activity

The activities of SOD and POD showed significant differences across different water and phosphorus levels (Figure 3A,B). Under T1 conditions, as phosphorus application increased, the activities of SOD and POD first increased and then decreased. Specifically, the activities of SOD and POD under the P1 and P2 treatments significantly increased by 34.7% and 34.3%, and 130% and 147%, respectively, compared to P0, with no significant differences observed between P1 and P2. Under T2 conditions, SODs in P1 and P2 were significantly increased by 40.6% and 49.7% compared to P0, respectively, with no significant differences between them. Additionally, under P1 and P2 treatments, PODs were significantly increased by 124.9% and 168.56%, respectively, compared to P0, with significant differences noted between P1 and P2. Under T3 conditions, SOD activity peaked, but POD activity significantly decreased. However, both activities were still significantly higher under the P1 and P2 treatments than under P0, with increases of 20.4% and 22.7% for SOD, and 64.7% and 69.9% for POD, respectively.

3.2.2. Membrane Lipid Peroxidation Content

The application of phosphorus significantly affected the H2O2 and MDA contents in soybean (Figure 4A,B), with the effects varying according to water conditions and fertilization levels. Under T1 conditions, the P1 treatment significantly decreased MDA content by 13.7% compared to P0. Under T2 conditions, the MDA content under the P1, P2, and P3 treatments significantly increased by 5.74%, 9.19%, and 8.97%, respectively, compared to P0, with no significant differences observed among P1, P2, and P3. Under T3 conditions, the accumulation of H2O2 and MDA was more pronounced. Although phosphorus application still provided some alleviation, the effect was less pronounced than under mild and moderate stress. P1 significantly reduced the accumulation of H2O2 and MDA by 20.6% and 12.8%, respectively, compared to P0.

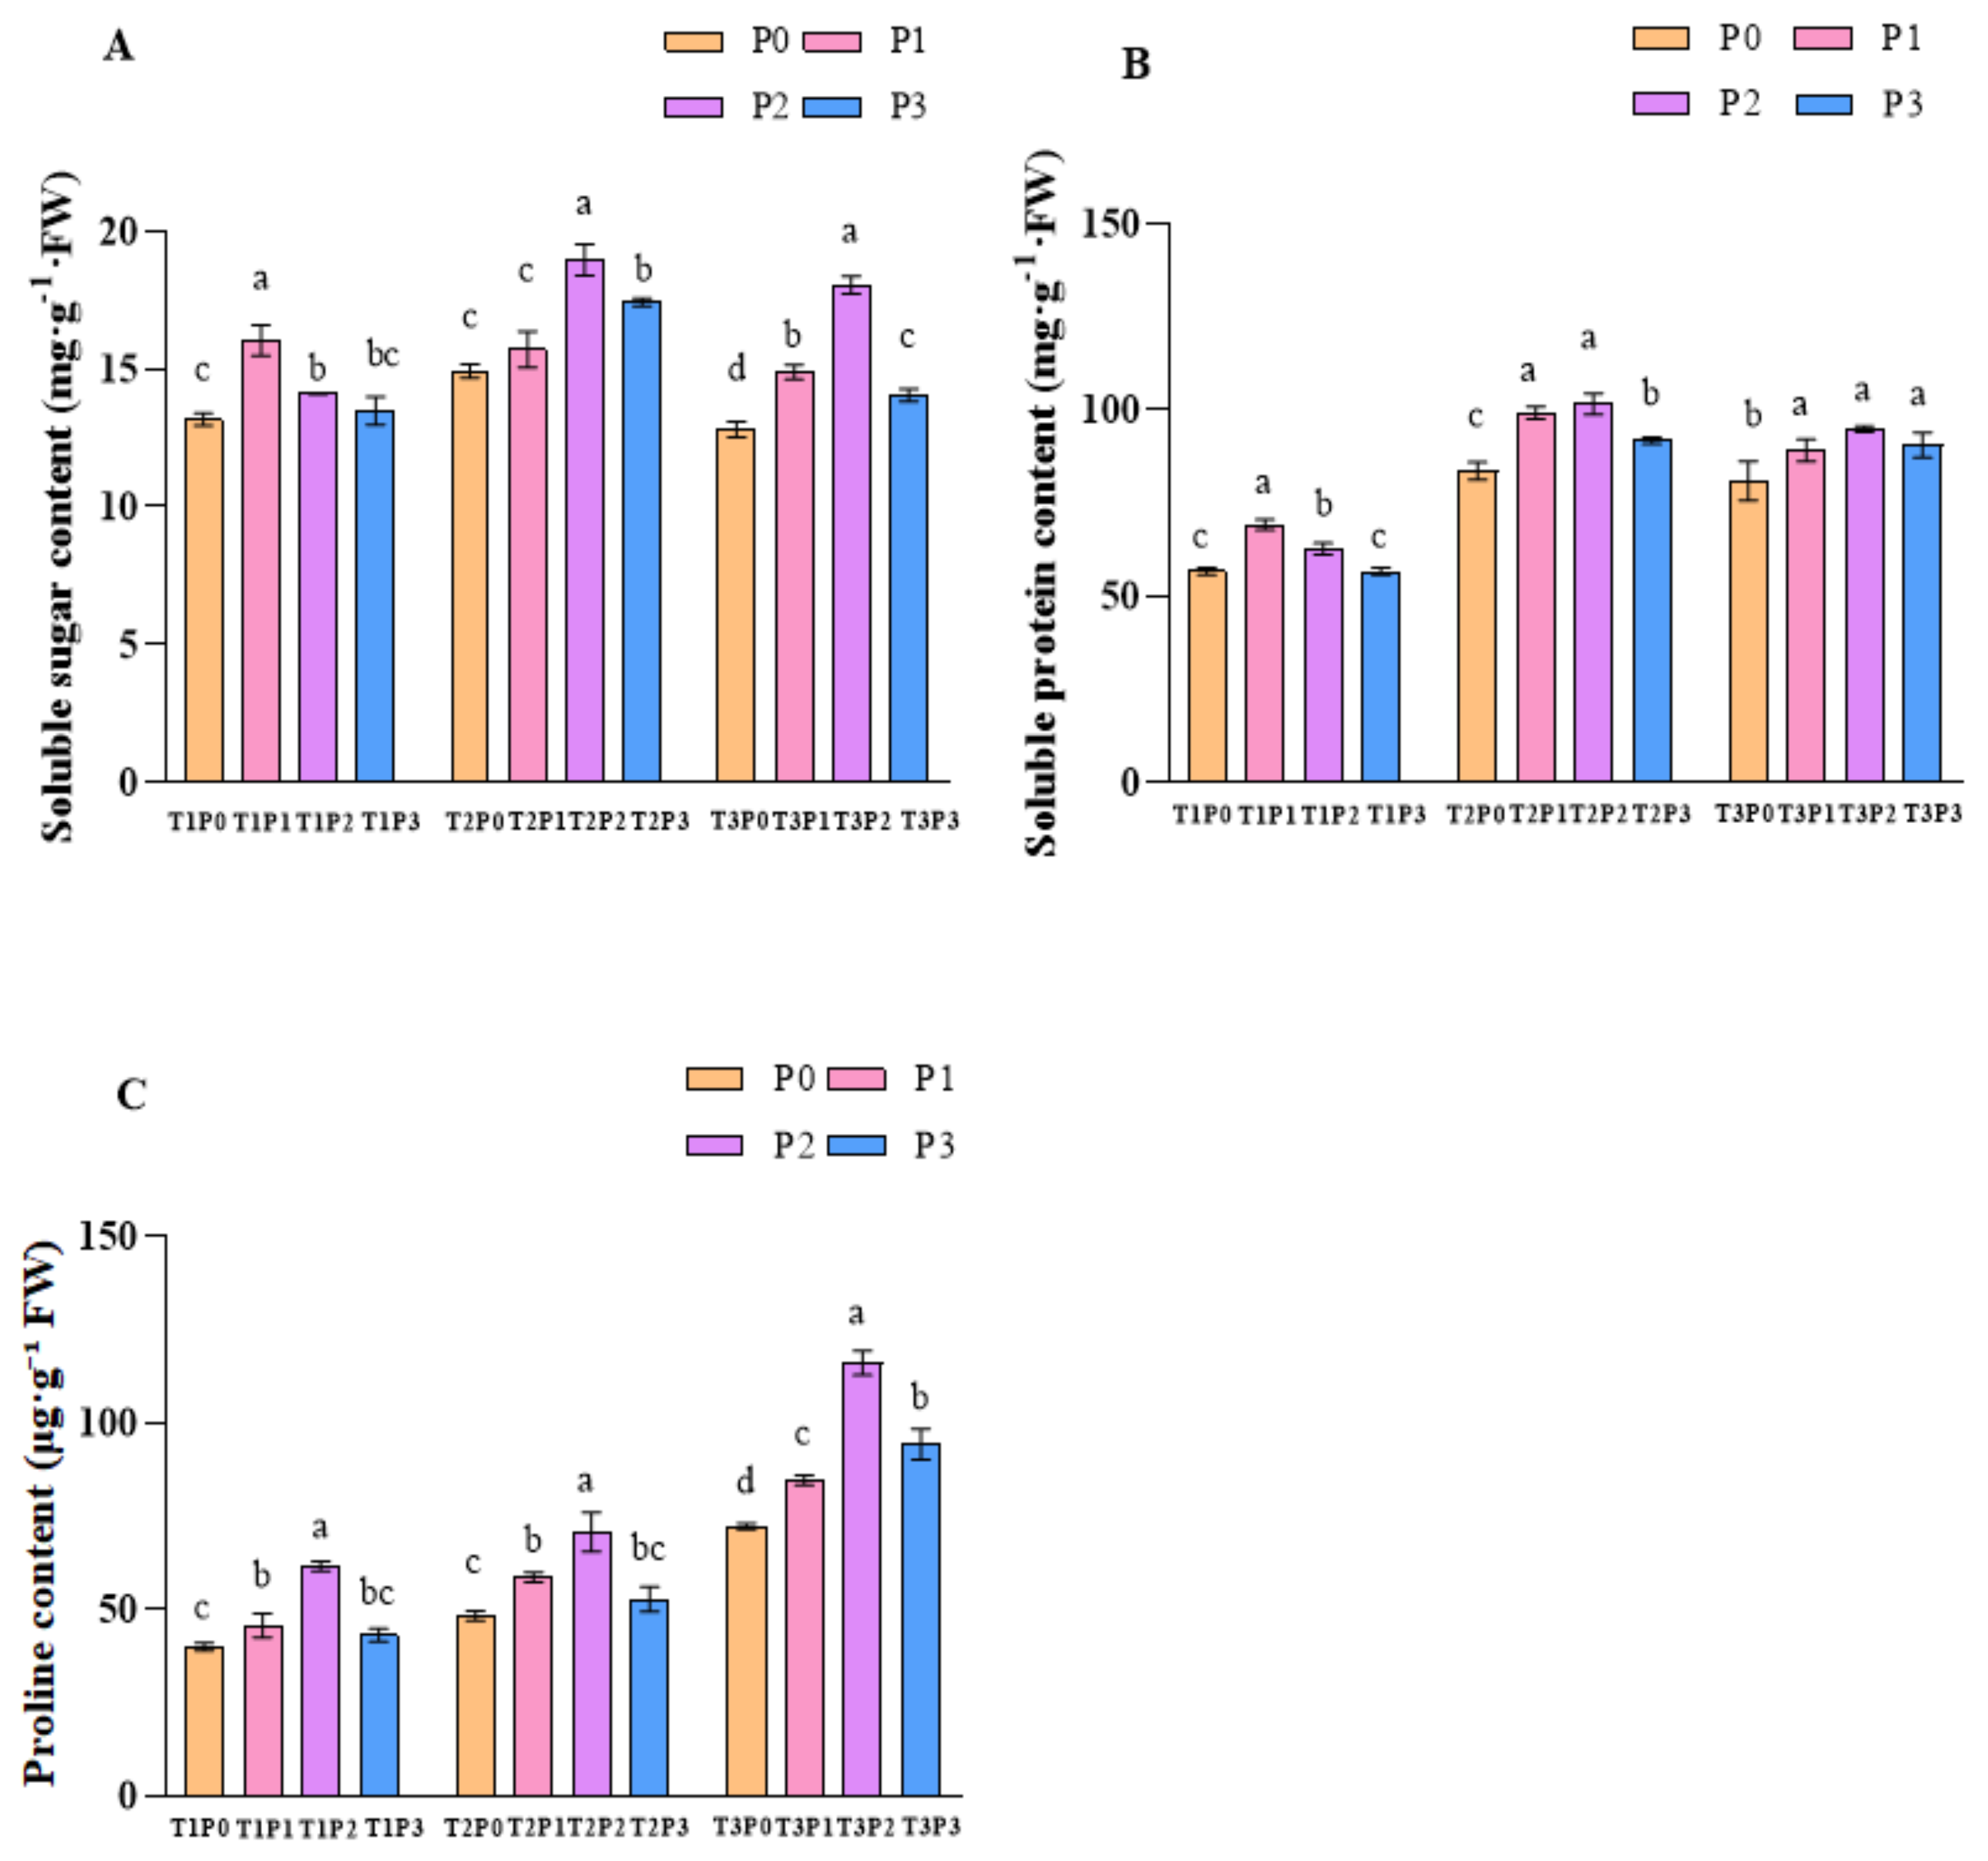
3.3. The Effect of Phosphorus Application on the Osmotic Adjustment System Under Water Stress

As shown in Figure 5A–C, under T1 conditions, as phosphorus application increased, the contents of SS and SP initially increased and then decreased. The contents of SS and SP under P1 significantly increased by 21.7% and 21.8% compared to P0, respectively. The PRO was highest in the P2 treatment, showing a 54.3% increase compared to P0. Under T2 conditions, the P2 treatment resulted in the highest levels of SS, SP, and PRO, which were significantly increased by 27.0%, 21.5%, and 46.5%, respectively, compared to P0 and were significantly higher than in other treatments. Under T3 conditions, the SP under the P1, P2, and P3 treatments significantly increased by 10.03%, 17.13%, and 19.2%, respectively, compared to P0, with no significant differences observed between P1, P2, and P3. In contrast, the PRO increased with higher phosphorus levels, and the P2 treatment had the highest PRO at 116.04 mg/g, which was 60.7% higher than in P0. Moderate phosphorus application (P1 and P2) improved the synthesis of soybean SS, SP, and osmotic adjustment capacity, especially under moderate water stress. It also significantly promoted PRO accumulation in soybean.

3.4. The Effect of Phosphorus Application on Soybean Yield Formation Under Water Stress

In this study, the number of nodes did not differ significantly among the treatment groups (Table 2). The number of pods and seeds per plant increased with phosphorus application but slightly decreased at higher levels. Under T1 and T2 conditions, there were no significant differences among phosphorus treatments. However, under T3 conditions, the P1 treatment showed the largest increase in pods per plant compared to P0, with a significant rise of 30.8%. This suggests that moderate phosphorus application improves pod production, while excessive phosphorus reduces this benefit. Phosphorus application also significantly increased seeds per plant under T1 and T3 conditions. The P1 treatment showed the highest increases, with significant improvements of 24% and 38.7%, respectively, compared to P0. In contrast, the P3 treatment only increased seeds per plant by about 2.7% and 1.4%, indicating that excessive phosphorus might limit seed production. Single-plant yield followed a similar trend. The P1 treatment achieved an average yield of 10.43 g, which was 20.7% higher than P0 (8.64 g). The P2 treatment also had increased yield, with an average improvement of 15.6%. However, yield under P3 was lower than P1 and P2, suggesting that excessive phosphorus reduced its effectiveness. The 100-seed weight was highest under the P1 treatment, with an average increase of 18.9% compared to P0. Moderate phosphorus application (P1 and P2) improved the number of pods, seeds, yield, and 100-seed weight.

3.5. Correlation Analysis

The results of the Spearman correlation analysis revealed significant correlations between various physiological parameters and their relationships with yield and 100-seed weight (Figure 6). SOD and POD showed highly significant positive correlations with SS, SP, and PRO (p < 0.001) and also exhibited positive correlations with Pn and Gs (p < 0.01). Photosynthetic parameters (Pn and Gs) were strongly positively correlated with both yield and 100-seed weight (p < 0.001). In contrast, H2O2 and MDA contents exhibited significant negative correlations with both yield and 100-seed weight (p < 0.01).
The results of the Mantel test showed strong correlations between yield and 100-seed weight with SOD, POD activity, SS, SP, PRO, Pn, and Gs (Mantel’s R > 0.5, p < 0.001), with yield showing a higher correlation than 100-seed weight. In addition, the correlations between H2O2 and MDA and both yield and 100-seed weight were weak (Mantel’s R < 0.25), but they all exhibited a negative correlation trend.

4. Discussion

4.1. Photosynthetic Parameters

Water stress reduces water loss through stomatal closure but simultaneously limits the absorption of carbon dioxide, thereby inhibiting photosynthesis and Pn [31]. In this study, as water stress increased from T1 to T3, Gs, Tr, Ci, and Pn all showed a continuous decline. Stomatal closure is an early response of plants to water stress, which helps maintain carbon assimilation by reducing water loss. On the other hand, it triggers signals transmitted from the roots to regulate a decrease in transpiration rate, thereby reducing water loss caused by transpiration [32,33]. In addition, phosphorus can enhance photosynthetic efficiency by promoting chlorophyll synthesis and improving the light absorption capacity of the leaves [34]. Phosphorus also activates the activity of key enzymes in the carbon fixation process, such as Rubisco and phosphofructokinase, thereby indirectly improving the plant’s photosynthetic capacity [35,36]. Under T1 water conditions, moderate phosphorus application (the P1 and P2 treatments) effectively improved Gs, Tr, Ci, and Pn under different water stress conditions. Notably, under moderate water stress (T2), the P2 treatment performed the best, with Gs and Tr increasing by 12.4% and 43.7%, respectively, compared to the P0 treatment. Meanwhile, the Ci under the P2 treatment significantly decreased by 16.8%, and the Pn reached the highest value among all treatments [31,32,37]. In contrast, excessive phosphorus application (the P3 treatment) performed poorly under all water conditions. Under T1 conditions, Gs and Tr in the P3 treatment were significantly lower than those in the P1 and P2 treatments. Under T3 conditions, Gs in the P3 treatment decreased further, while Ci gradually increased, and the Pn was only 7.52 μmol m−2·s−1. This indicates that excessive phosphorus application inhibited photosynthesis. As the study by Ben et al. suggests, the excessive accumulation of phosphorus in the mesophyll cells of terrestrial plant leaves can lead to necrotic symptoms, a phenomenon known as phosphorus toxicity. Excessive phosphorus has toxic effects on Pn and Gs [38,39].

4.2. Antioxidant Enzyme Activity and Membrane Lipid Peroxidation Content

In this study, under moderate phosphorus application (the P1 and P2 treatments), as water stress intensified, SOD activity and the contents of H2O2 and MDA significantly increased, while POD activity initially increased and then decreased [40]. In contrast to this study, Ying et al. found in their research on the changes in antioxidant enzyme activities under water stress in different provenances of Camptotheca acuminata that SOD activity increased initially and then decreased as water stress intensified. This difference may be due to the species variation between the plants studied [41]. Phosphorus enhances the energy status of plants by promoting ATP synthesis, which in turn facilitates the synthesis and activation of antioxidant enzymes such as SOD and POD, thereby strengthening the plant’s antioxidant capacity [42]. Moreover, the SOD activity in the P1 and P2 treatments was significantly higher than that in the P0 treatment, with an increase of over 30%. The effect on POD activity was even more pronounced, with values in the same water gradient exceeding 150% of those in P0. Under the P2 treatment, the contents of H2O2 and MDA were significantly reduced by 38.8% and 12.8%, respectively, compared to P0. Moderate phosphorus application can enhance enzyme activity to alleviate damage caused by ROS, helping plants resist oxidative damage induced by water stress [43].
However, excessive phosphorus application leads to a significant decrease in SOD and POD activity, particularly under T1 conditions, where P3 was 17.9% lower than P1. Meanwhile, the H2O2 and MDA contents under the P3 treatment were higher compared to the P1 and P2 treatments. Li et al. (2021) pointed out that phosphorus supplementation can have a significant impact on the antioxidant enzyme activity of plants [44], while Jia et al. (2020) also found that exogenous phosphorus, under certain conditions, affects the function of the plant’s antioxidant system [45]. Moderate phosphorus application can significantly reduce H2O2 accumulation and decrease MDA content, with particularly pronounced effects under moderate and severe water stress conditions [46]. Excessive phosphorus application can lead to an abnormally high phosphate concentration in plants, disrupting normal metabolism and enhancing oxidative stress responses, resulting in increased H2O2 and MDA levels. Therefore, phosphorus application must be kept within an optimal range, as overapplication can negatively impact plants and reduce their stress resistance. The primary function of SOD is to scavenge superoxide radicals; however, its activity is inhibited under high phosphorus conditions. This suppression reduces its ability to eliminate ROS, thereby exacerbating ROS accumulation. Moreover, the reduced states of PSII and PSI contribute to excessive ROS production. ROS attack proteins and lipids, including SOD itself, further diminishing its activity [47].

4.3. Osmotic Adjustment System

The accumulation of osmotic regulators is an important mechanism by which plants respond to water stress [48]. We found that moderate phosphorus application (P1 and P2 treatments) significantly promoted the accumulation of SS, SP, and PRO under T1, T2, and T3 conditions, with the most pronounced effect observed under T2 conditions. Under T2 water conditions, the P2 treatment increased SS and SP by 26.9% and 21.5%, respectively, while PRO increased by 46.5% compared to the P0 treatment. This indicates that under mild to moderate water conditions, moderate phosphorus application can promote the accumulation of carbohydrates and proteins, as well as enhance PRO synthesis in plants. Under stress conditions, plants maintain normal physiological metabolism and cellular stability through the coordinated action of various substances. SS, as a source of energy for basic metabolism, provides carbon for plants. SP and PRO are involved in osmotic regulation and cellular protection, and their continuous accumulation helps maintain cellular stability and metabolic activity. Moreover, SS not only provides energy and carbon skeletons for metabolic activities and osmotic regulation but also synergizes with the accumulation of SP and PRO, forming a collaborative metabolic network that significantly enhances the plant’s adaptability to stressful environments [49,50,51].
Under severe water level (T3), the overall contents of SS and SP decreased, while the PRO continued to rise. However, the P2 treatment still maintained relatively high levels, with the PRO reaching 116.04 mg/g, a 60.7% increase compared to the P0 treatment. The continued significant accumulation of PRO indicates its crucial role under severe stress. It helps regulate cell osmotic pressure, scavenges reactive oxygen species (ROS), and protects cell membranes, thereby alleviating the damage caused by stress to the plants [52]. In addition, the synthesis and accumulation of PRO are associated with the protein’s hydrolysis caused by water stress. And the results of this study also showed that the continued accumulation of PRO aligns with the declining trend of SP [53].

4.4. Yield Formation

Under all three moisture conditions, there were no significant differences in the number of nodes among the different phosphorus treatments, indicating that water level and phosphorus levels had a limited effect on the number of nodes in soybeans. This could also be attributed to the experimental variety, as the number of nodes is primarily determined by the genotype [54]. Many studies have shown that appropriate phosphorus fertilization can increase crop yield [13,55]. This study demonstrates that the P1 and P2 treatments achieved the highest values for the number of pods per plant, number of seeds per plant, plant yield, and 100-seed weight under all water conditions, further confirming that the appropriate application of phosphorus fertilizer can improve crop yield. This is because phosphorus can enhance the plant’s photosynthetic efficiency and nutrient distribution ability, promoting an increase in the number of pods and seeds and improving seed quality, thereby increasing overall yield. In contrast, although excessive phosphorus fertilization results in higher values for all indicators compared to P0, it shows a decrease relative to P1 and P2. This may be due to an imbalance in nutrient absorption and distribution caused by excessive phosphorus, which suppresses the positive effect of phosphorus on yield. And under the T3 water level condition, the decline in the number of pods per plant, number of seeds per plant, plant yield, and 100-seed weight for P3 was significant, further suggesting that excessive phosphorus application may increase the metabolic burden on plants under severe stress, thereby weakening their growth and reproductive capacity.
As the T1P1 and T2P2 treatments performed well in terms of photosynthetic parameters, antioxidant defense capacity, and osmotic regulation, which subsequently promoted yield improvement, they can be recommended as suitable water–phosphorus treatment combinations for future application, demonstrating good potential for practical implementation.

4.5. Future Research Directions

This study explored the effects of different water and phosphorus fertilizer application levels on soybean photosynthesis, physiology, and yield through a pot experiment. However, we recognize certain limitations inherent to pot experiments, such as discrepancies in soil conditions, root spatial constraints, and water management compared to field environments, which may impact the practical applicability of the results. Therefore, future studies should validate the conclusions of this research under field conditions that better reflect real-world cultivation practices. Such validation would ensure the feasibility and generalizability of the findings, providing crucial references for water-scarce regions to guide rational phosphorus fertilizer application aimed at enhancing crop yield and improving resource use efficiency.
In addition, future research could further investigate the applicability of these phosphorus management strategies across different crops and climatic conditions, thereby promoting the broader implementation of precision agricultural technologies in diverse agricultural production systems.

5. Conclusions

The conclusions indicated that moderate phosphorus application (P1 and P2) significantly increased stomatal conductance, transpiration rate, and net photosynthetic rate, enhanced SOD and POD activities, reduced H2O2 and MDA contents, and promoted the accumulation of SS, SP, and PRO, thereby improving the number of pods per plant, seed number, and yield. In contrast, excessive phosphorus application (P3) suppressed these parameters and weakened drought resistance. Antioxidant enzyme activities, osmotic adjustment substances, and photosynthetic parameters were significantly positively correlated with yield and 100-seed weight, while membrane lipid peroxides showed a significant negative correlation.
Proper phosphorus application not only has a significant impact on improving soybean drought resistance and yield but also reveals the regulatory effects of phosphorus on photosynthetic parameters, antioxidant capacity, and the osmotic adjustment system. This provides valuable insights for optimizing water–phosphorus management strategies, promoting sustainable agricultural development, and improving soybean production.

Author Contributions

Data curation and Writing—original draft, Q.C.; Validation and Supervision, T.N.; Formal analysis and Software, Y.L.; Formal analysis and Software, H.L., Y.S. and Y.W.; Supervision and Investigation, Y.Z.; Supervision, Validation, and Investigation, M.W. All authors have read and agreed to the published version of the manuscript.

Funding

This study was supported by the National Key Research and Development Programme of China (2022YFD1500105); the “Jiebang Guashuai” Project of Inner Mongolia Autonomous Region (2023JBGS0006) and the postgraduate research and innovation funding project of Heilongjiang Bayi Agricultural and Reclamation University (NXYYJSCX2023-Y18).

Data Availability Statement

The original contributions presented in this study are included in the article. Further inquiries can be directed to the corresponding author.

Conflicts of Interest

The authors declare no conflicts of interest.

Abbreviations

The following abbreviations are used in this manuscript:
GSStomatal conductance
TRTranspiration rate
CIIntercellular CO2 concentration
PNNet photosynthetic rate
SODSuperoxide dismutase activity
PODPeroxidase activity
H2O2Hydrogen peroxide content
MDAMalondialdehyde content
SSSoluble sugar content
SPSoluble protein content
PROProline content

References

  1. Liu, S.; Zhang, M.; Feng, F.; Tian, Z. Toward a “green revolution” for soybean. Mol. Plant 2020, 13, 688–697. [Google Scholar] [CrossRef] [PubMed]
  2. Zhan, J.; Twardowska, I.; Wang, S.; Wei, S.; Chen, Y.; Ljupco, M. Prospective sustainable production of safe food for growing population based on the soybean (Glycine max L. Merr.) crops under Cd soil contamination stress. J. Clean. Prod. 2019, 212, 22–36. [Google Scholar] [CrossRef]
  3. Mei, Q.; Zhang, Z.; Han, J.; Song, J.; Dong, J.; Wu, H.; Xu, J.; Tao, F. ChinaSoyArea10m: A dataset of soybean-planting areas with a spatial resolution of 10 m across China from 2017 to 2021. Earth Syst. Sci. Data 2024, 16, 3213–3231. [Google Scholar] [CrossRef]
  4. Wang, C.; Linderholm, H.W.; Song, Y.; Wang, F.; Liu, Y.; Tian, J.; Xu, J.; Song, Y.; Ren, G. Impacts of drought on maize and soybean production in northeast China during the past five decades. Int. J. Environ. Res. Public Health 2020, 17, 2459. [Google Scholar] [CrossRef]
  5. Wang, S.; Zheng, S.; Bian, T.; Wu, T.; Li, X.; Fu, H.; Sun, Z.; Li, T. Photosynthetic characteristics combined with metabolomics analysis revealed potential mechanisms of cucumber (Cucumis sativus) yield reduction induced by different phosphorus stresses. Sci. Hortic. 2022, 302, 111156. [Google Scholar] [CrossRef]
  6. Laskari, M.; Menexes, G.; Kalfas, I.; Gatzolis, I.; Dordas, C. Water stress effects on the morphological, physiological characteristics of maize (Zea mays L.), and on environmental cost. Agronomy 2022, 12, 2386. [Google Scholar] [CrossRef]
  7. Wang, X.; Wu, Z.; Zhou, Q.; Wang, X.; Song, S.; Dong, S. Physiological response of soybean plants to water deficit. Front. Plant Sci. 2022, 12, 809692. [Google Scholar] [CrossRef]
  8. Dalal, V.K.; Tripathy, B.C. Water-stress induced downsizing of light-harvesting antenna complex protects developing rice seedlings from photo-oxidative damage. Sci. Rep. 2018, 8, 5955. [Google Scholar] [CrossRef]
  9. da Silva, J.A.; de Carvalho, L.G.; Andrade, F.R. Gas exchange and water stress index in soybean cultivated under water deficit and soil compaction. Rev. Ceres 2022, 69, 218–226. [Google Scholar] [CrossRef]
  10. Yuan, X.K.; Yang, Z.Q.; Li, Y.X.; Liu, Q.; Han, W. Effects of different levels of water stress on leaf photosynthetic characteristics and antioxidant enzyme activities of greenhouse tomato. Photosynthetica 2016, 54, 28–39. [Google Scholar] [CrossRef]
  11. Schneider, J.R.; Müller, M.; Klein, V.A.; Rossato-Grando, L.G.; Barcelos, R.P.; Dalmago, G.A.; Chavarria, G. Soybean plant metabolism under water deficit and xenobiotic and antioxidant agent application. Biology 2020, 9, 266. [Google Scholar] [CrossRef] [PubMed]
  12. Gurrieri, L.; Merico, M.; Trost, P.; Forlani, G.; Sparla, F. Impact of drought on soluble sugars and free proline content in selected Arabidopsis mutants. Biology 2020, 9, 367. [Google Scholar] [CrossRef] [PubMed]
  13. Feng, Y.-Y.; He, J.; Turner, N.C.; Siddique, K.H.M.; Li, F.-M. Phosphorus supply increases internode length and leaf characteristics, and increases dry matter accumulation and seed yield in soybean under water deficit. Agronomy 2021, 11, 930. [Google Scholar] [CrossRef]
  14. Basal, O.; Szabó, A. Sole and combined effects of drought and phosphorus application on soybean. J. Central Eur. Agric. 2020, 21, 796–808. [Google Scholar] [CrossRef]
  15. Zheng, H.; Chen, L.; Yu, X.; Zhao, X.; Ma, Y.; Ren, Z. Phosphorus control as an effective strategy to adapt soybean to drought at the reproductive stage: Evidence from field experiments across northeast China. Soil Use Manag. 2015, 31, 19–28. [Google Scholar] [CrossRef]
  16. Mathe, Z.; Stepanic, O.M.; Peredkov, S.; DeBeer, S. Phosphorus Kβ X-ray emission spectroscopy detects non-covalent interactions of phosphate biomolecules in situ. Chem. Sci. 2021, 12, 7888–7901. [Google Scholar] [CrossRef]
  17. Chu, S.; Li, H.; Zhang, X.; Yu, K.; Chao, M.; Han, S.; Zhang, D. Physiological and proteomics analyses reveal low-phosphorus stress affected the regulation of photosynthesis in soybean. Int. J. Mol. Sci. 2018, 19, 1688. [Google Scholar] [CrossRef]
  18. Chen, C.-T.; Lu, C.-T.; Tzen, J.T.C.; Yang, C.-Y. Physiological properties and molecular regulation in different edamame cultivars under drought stress. Agronomy 2021, 11, 939. [Google Scholar] [CrossRef]
  19. Wang, Y.; Shi, R.; Deng, S.; Wang, H.; Hussain, S.; Wang, C.; Gong, C.; Bai, J. Application of low phosphorus on the basis of organic fertilizer can effectively improve yield and quality of tea plants. Beverage Plant Res. 2024, 4, e037. [Google Scholar] [CrossRef]
  20. Dong, J.; Lin, Y.; Yi, S.; Nie, T. Study on Soybean Water Demand and Irrigation Schedule in Western Heilongjiang Province Based on Cropwat Model. Appl. Ecol. Environ. Res. 2024, 22, 443–458. [Google Scholar] [CrossRef]
  21. Zhang, Z.X.; Sun, D.; Li, T.C.; Qi, Z.J.; Du, S.C.; Wang, B.; Huang, Y. Effects of water-saving irrigation and reduced phosphorus fertilizer application on the yield of paddy rice in black soil and the utilization and balance of soil phosphorus. Trans. Chin. Soc. Agric. Eng. 2022, 38, 67–74. [Google Scholar] [CrossRef]
  22. Lier, Q.d.J.v. Field capacity, a valid upper limit of crop available water? Agric. Water Manag. 2017, 193, 214–220. [Google Scholar] [CrossRef]
  23. Maleki, A.; Naderi, A.; Naseri, R.; Fathi, A.; Bahamin, S.; Maleki, R. Physiological performance of soybean cultivars under drought stress. Bull. Environ. Pharmacol. Life Sci. 2013, 2, 38–44. [Google Scholar]
  24. Beauchamp, C.; Fridovich, I. Superoxide dismutase: Improved assays and an assay applicable to acrylamide gels. Anal. Biochem. 1971, 44, 276–287. [Google Scholar] [CrossRef]
  25. Egley, G.H.; Paul, R.N.; Vaughn, K.C.; Duke, S.O. Role of peroxidase in the development of water-impermeable seed coats in Sida spinosa L. Planta 1983, 157, 224–232. [Google Scholar] [CrossRef]
  26. Mukherjee, S.P.; Choudhuri, M.A. Implications of water stress-induced changes in the levels of endogenous ascorbic acid and hydrogen peroxide in Vigna seedlings. Physiol. Plant. 1983, 58, 166–170. [Google Scholar] [CrossRef]
  27. Heath, R.L.; Packer, L. Photoperoxidation in isolated chloroplasts: I. kinetics and stoichiometry of fatty acid peroxidation. Arch. Biochem. Biophys. 1968, 125, 189–198. [Google Scholar] [CrossRef]
  28. Yemm, E.W.; Willis, A.J. The estimation of carbohydrates in plant extracts by anthrone. Biochem. J. 1954, 57, 508. [Google Scholar] [CrossRef]
  29. Zhang, H.; Zhang, N.; Yang, R.; Wang, L.; Sun, Q.; Li, D.; Cao, Y.; Weeda, S.; Zhao, B.; Ren, S.; et al. Melatonin promotes seed germination under high salinity by regulating antioxidant systems, ABA and GA 4 interaction in cucumber (Cucumis sativus L.). J. Pineal Res. 2014, 57, 269–279. [Google Scholar] [CrossRef] [PubMed]
  30. Bates, L.S.; Waldren, R.P.; Teare, I.D. Rapid determination of free proline for water-stress studies. Plant Soil 1973, 39, 205–207. [Google Scholar] [CrossRef]
  31. Cornic, G.; Fresneau, C. Photosynthetic carbon reduction and carbon oxidation cycles are the main electron sinks for photosystem II activity during a mild drought. Ann. Bot. 2002, 89, 887–894. [Google Scholar] [CrossRef] [PubMed]
  32. Liu, E.; Mei, X.; Yan, C.; Gong, D.; Zhang, Y. Effects of water stress on photosynthetic characteristics, dry matter translocation and WUE in two winter wheat genotypes. Agric. Water Manag. 2016, 167, 75–85. [Google Scholar] [CrossRef]
  33. Zhao, W.; Liu, L.; Shen, Q.; Yang, J.; Han, X.; Tian, F.; Wu, J. Effects of water stress on photosynthesis, yield, and water use efficiency in winter wheat. Water 2020, 12, 2127. [Google Scholar] [CrossRef]
  34. Plesniˇar, M.; Kastori, R.; Petrović, N.; Panković, D. Photosynthesis and chlorophyll fluorescence in sunflower (Helianthus annuus L.) leaves as affected by phosphorus nutrition. J. Exp. Bot. 1994, 45, 919–924. [Google Scholar] [CrossRef]
  35. Warren, C.R.; Adams, M.A. Phosphorus affects growth and partitioning of nitrogen to Rubisco in Pinus pinaster. Tree Physiol. 2002, 22, 11–19. [Google Scholar] [CrossRef]
  36. Brooks, A.; Woo, K.C.; Wong, S.C. Effects of phosphorus nutrition on the response of photosynthesis to CO2 and O2, activation of ribulose bisphosphate carboxylase and amounts of ribulose bisphosphate and 3-phosphoglycerate in spinach leaves. Photosynth. Res. 1988, 15, 133–141. [Google Scholar] [CrossRef]
  37. Liu, M.; Yang, C.; Mu, R. Effect of soil water-phosphorus coupling on the photosynthetic capacity of Robinia pseudoacacia L. seedlings in semi-arid areas of the Loess Plateau, China. Environ. Monit. Assess. 2023, 195, 932. [Google Scholar] [CrossRef]
  38. Ben Hamed, S.; Lefi, E.; Chaieb, M. Effect of phosphorus concentration on the photochemical stability of PSII and CO2 assimilation in Pistacia vera L. and Pistacia atlantica Desf. Plant Physiol. Biochem. 2019, 142, 283–291. [Google Scholar] [CrossRef]
  39. Vukmirović, A.; Škvorc, Ž.; Bogdan, S.; Krstonošić, D.; Bogdan, I.K.; Karažija, T.; Bačurin, M.; Brener, M.; Sever, K. Photosynthetic response to phosphorus fertilization in drought-stressed common beech and sessile oak from different provenances. Plants 2024, 13, 2270. [Google Scholar] [CrossRef]
  40. Li, X.; Feng, Y.; Sun, X.; Liu, W.; Yang, W.; Ge, X.; Jia, Y. Effects of various levels of water stress on morpho-physiological traits and spectral reflectance of maize at seedling growth stage. Agronomy 2024, 14, 2173. [Google Scholar] [CrossRef]
  41. Ying, Y.Q.; Song, L.L.; Jacobs, D.F.; Mei, L.; Liu, P.; Jin, S.H.; Wu, J.S. Physiological response to drought stress in Camptotheca acuminata seedlings from two provenances. Front. Plant Sci. 2015, 6, 361. [Google Scholar] [CrossRef] [PubMed]
  42. Carstensen, A.; Herdean, A.; Schmidt, S.B.; Sharma, A.; Spetea, C.; Pribil, M.; Husted, S. The impacts of phosphorus deficiency on the photosynthetic electron transport chain. Plant Physiol. 2018, 177, 271–284. [Google Scholar] [CrossRef] [PubMed]
  43. Guo, X.; Wu, Q.; Zhang, Z.; Zhu, G.; Zhou, G. Nitrogen and phosphorus counteracted the adverse effects of salt on sorghum by improving ROS scavenging and osmotic regulation. Agronomy 2023, 13, 1020. [Google Scholar] [CrossRef]
  44. Li, Y.; Sun, M.; He, W.; Wang, H.; Pan, H.; Yang, Q.; Lou, Y.; Zhuge, Y. Effect of phosphorus supplementation on growth, nutrient uptake, physiological responses, and cadmium absorption by tall fescue (Festuca arundinacea Schreb.) exposed to cadmium. Ecotoxicol. Environ. Saf. 2021, 213, 112021. [Google Scholar] [CrossRef] [PubMed]
  45. Jia, H.; Hou, D.; O’connor, D.; Pan, S.; Zhu, J.; Bolan, N.S.; Mulder, J. Exogenous phosphorus treatment facilitates chelation-mediated cadmium detoxification in perennial ryegrass (Lolium perenne L.). J. Hazard. Mater. 2020, 389, 121849. [Google Scholar] [CrossRef]
  46. Meng, X.; Chen, W.-W.; Wang, Y.-Y.; Huang, Z.-R.; Ye, X.; Chen, L.-S.; Yang, L.-T. Effects of phosphorus deficiency on the absorption of mineral nutrients, photosynthetic system performance and antioxidant metabolism in Citrus grandis. PLoS ONE 2021, 16, e0246944. [Google Scholar] [CrossRef]
  47. Takagi, D.; Miyagi, A.; Tazoe, Y.; Suganami, M.; Yamada, M.K.; Ueda, A.; Suzuki, Y.; Noguchi, K.; Hirotsu, N.; Makino, A. Phosphorus toxicity disrupts Rubisco activation and reactive oxygen species defence systems by phytic acid accumulation in leaves. Plant Cell Environ. 2020, 43, 2033–2053. [Google Scholar] [CrossRef]
  48. Khoyerdi, F.F.; Shamshiri, M.H.; Estaji, A. Changes in some physiological and osmotic parameters of several pistachio genotypes under drought stress. Sci. Hortic. 2016, 198, 44–51. [Google Scholar] [CrossRef]
  49. Rice, A.M.; Rosen, M.K. ATP controls the crowd. Science 2017, 356, 701–702. [Google Scholar] [CrossRef]
  50. Ngwenya, S.P.; Moloi, S.J.; Shargie, N.G.; Brown, A.P.; Chivasa, S.; Ngara, R. Regulation of proline accumulation and protein secretion in sorghum under combined osmotic and heat stress. Plants 2024, 13, 1874. [Google Scholar] [CrossRef]
  51. Salinas, R.; Sánchez, E.; Ruíz, J.M.; Lao, M.T.; Romero, L. Proline, betaine, and choline responses to different phosphorus levels in green bean. Commun. Soil Sci. Plant Anal. 2013, 44, 465–472. [Google Scholar] [CrossRef]
  52. Krishnan, N.; Dickman, M.B.; Becker, D.F. Proline modulates the intracellular redox environment and protects mammalian cells against oxidative stress. Free. Radic. Biol. Med. 2008, 44, 671–681. [Google Scholar] [CrossRef] [PubMed]
  53. Li, X.; Yang, Y.; Jia, L.; Chen, H.; Wei, X. Zinc-induced oxidative damage, antioxidant enzyme response and proline metabolism in roots and leaves of wheat plants. Ecotoxicol. Environ. Saf. 2013, 89, 150–157. [Google Scholar] [CrossRef] [PubMed]
  54. Chang, F.; Guo, C.; Sun, F.; Zhang, J.; Wang, Z.; Kong, J.; He, Q.; Sharmin, R.A.; Zhao, T. Genome-wide association studies for dynamic plant height and number of nodes on the main stem in summer sowing soybeans. Front. Plant Sci. 2018, 9, 1184. [Google Scholar] [CrossRef] [PubMed]
  55. Sarkar, S.; Devi, N.S.; Chia, R.W.; Mirzaei, M.; Reijneveld, A.; Fontana, M.; Lo, K.-J. Changes on phosphorus fractions and paddy yield using different single super phosphate and rock phosphate rates under acid soil. J. Plant Nutr. 2024, 47, 1130–1151. [Google Scholar] [CrossRef]
Figure 1. The maximum and minimum air temperatures of the experimental site in 2024.
Agronomy 15 00444 g001
Figure 2. The effect of phosphorus application on stomatal conductance (A), transpiration rate (B), intercellular carbon dioxide concentration (C), and net photosynthetic rate (D) under water stress. The lowercase letters (a, b, c, and d) in the figure represent the statistical analysis results of significance differences. Identical letters within the same group indicate no significant difference statistically (p > 0.05), while different letters indicate significant differences (p < 0.05).
Agronomy 15 00444 g002
Figure 3. The effect of phosphorus application on (A) superoxide dismutase activity, (B) peroxidase activity under water stress. The lowercase letters (a, b, c, and d) in the figure represent the results of the statistical analysis for significant differences. Identical letters within the same group indicate no significant difference statistically (p > 0.05), while different letters indicate significant differences (p < 0.05).
Agronomy 15 00444 g003
Figure 4. The effect of phosphorus application on (A) hydrogen peroxide content, and (B) malondialdehyde content under water stress. The lowercase letters (a, b, c, and d) in the figure represent the results of the statistical analysis for significant differences. Identical letters within the same group indicate no significant difference statistically (p > 0.05), while different letters indicate significant differences (p < 0.05).
Agronomy 15 00444 g004
Figure 5. The effect of phosphorus application on (A) soluble sugar content, (B) soluble protein content, and (C) proline content under water stress. The lowercase letters (a, b, c, and d) in the figure represent the results of the statistical analysis for significant differences. Identical letters within the same group indicate no significant difference statistically (p > 0.05), while different letters indicate significant differences (p < 0.05).
Agronomy 15 00444 g005
Figure 6. Spearman’s and Mantel’s correlation analysis of soybean SOD, POD activity, soluble sugar (SS), soluble protein (SP), proline content (PRO), hydrogen peroxide (H2O2), Malondialdehyde content (MDA), yield, and 100-grain weight. In the heatmap, colors represent the strength of correlations: red indicates a positive correlation, blue indicates a negative correlation, and the intensity of the color indicates the strength of the correlation. In the figure, *** indicates a significance level of p < 0.001, ** indicates p < 0.01, and * indicates p < 0.05. In the path diagram, the color of the connecting lines indicates the p-value range: red (p < 0.001), green (p < 0.01), blue (p < 0.05), and gray (p ≥ 0.05). The thickness of the lines represents the strength of Mantel’s R value, with thicker lines indicating stronger correlations.
Agronomy 15 00444 g006
Table 1. Experimental grouping.
TreatmentsField CapacityPhosphate
T1P070 ± 5%0 mg/kg
T1P170 ± 5%40 mg/kg
T1P270 ± 5%50 mg/kg
T1P370 ± 5%60 mg/kg
T2P060 ± 5%0 mg/kg
T2P160 ± 5%40 mg/kg
T2P260 ± 5%50 mg/kg
T2P360 ± 5%60 mg/kg
T3P050 + 5%0 mg/kg
T3P150 + 5%40 mg/kg
T3P250 + 5%50 mg/kg
T3P350 + 5%60 mg/kg
Table 2. The effect of phosphorus application on yield and the components of soybean during the flowering stage under water stress. Note: identical letters within the same group indicate no significant difference statistically (p > 0.05), while different letters indicate significant differences (p < 0.05).
TreatmentsPitch NumberNumber of Pods Per PlantPer PlantYield Per PlantGrain Weight/100
Piece (s)Piece (s)Piece (s)(g)(g)
T1P013.75 ± 1.59a23.42 ± 6.70a51.00 ± 14.22b10.18 ± 3.16a18.69 ± 0.19b
T1P113.58 ± 1.32a27.58 ± 4.54a63.25 ± 14.84a11.77 ± 1.13a23.53 ± 0.13a
T1P213.67 ± 1.70a27.25 ± 2.98a51.42 ± 12.82b11.60 ± 2.65a23.21 ± 2.73a
T1P313.25 ± 1.30a26.83 ± 3.24a52.42 ± 4.13b11.54 ± 2.55a20.86 ± 0.21ab
T2P013.50 ± 1.80a21.67 ± 3.79a43.25 ± 6.17a9.10 ± 1.64a20.63 ± 0.54b
T2P112.67 ± 1.11a22.08 ± 3.57a45.25 ± 6.38a9.40 ± 1.20a21.16 ± 0.08b
T2P212.83 ± 0.99a23.42 ± 3.99a48.25 ± 10.69a10.58 ± 2.69a22.10 ± 0.14a
T2P313.33 ± 1.18a23.25 ± 3.59a44.17 ± 8.60a9.64 ± 1.22a22.54 ± 0.38a
T3P012.50 ± 1.19a19.75 ± 5.25b38.92 ± 8.22b7.63 ± 1.50b17.78 ± 0.56b
T3P112.75 ± 0.92a26.25 ± 5.18a54.00 ± 11.06a10.12 ± 1.50a21.40 ± 0.26a
T3P212.83 ± 1.14a25.83 ± 7.81a47.58 ± 13.40ab10.07 ± 2.63a21.25 ± 1.30a
T3P312.50 ± 1.66a22.33 ± 6.25ab39.50 ± 10.11b8.42 ± 2.50ab20.96 ± 1.18a
Disclaimer/Publisher’s Note: The statements, opinions and data contained in all publications are solely those of the individual author(s) and contributor(s) and not of MDPI and/or the editor(s). MDPI and/or the editor(s) disclaim responsibility for any injury to people or property resulting from any ideas, methods, instructions or products referred to in the content.

