Article

Selenium Biofortification with Se-Enriched Urea and Se-Enriched Ammonium Sulfate Fertilization in Different Common Bean Genotypes

by
Filipe Aiura Namorato
1,
Patriciani Estela Cipriano
1,
Stefânia Barros Zauza
2,
Pedro Antônio Namorato Benevenute
1,
Suellen Nunes de Araújo
1,
Raphael Felipe Rodrigues Correia
1,
Ivan Célio Andrade Ribeiro
1,
Everton Geraldo de Morais
1,
Fábio Aurélio Dias Martins
3,
Maria Ligia de Souza Silva
1 and
Luiz Roberto Guimarães Guilherme
1,*
1
Department of Soil Science, Federal University of Lavras, Lavras 37203-202, MG, Brazil
2
Department of Agriculture, School of Agriculture Federal, Federal University of Lavras, Lavras 37203-202, MG, Brazil
3
Agricultural Research Company of Minas Gerais, Aquenta Sol, Lavras 37203-202, MG, Brazil
*
Author to whom correspondence should be addressed.
Agronomy 2025, 15(2), 440; https://doi.org/10.3390/agronomy15020440
Submission received: 13 January 2025 / Revised: 4 February 2025 / Accepted: 7 February 2025 / Published: 11 February 2025
(This article belongs to the Special Issue Agronomic Biofortification Practices on Crops)

Abstract

:
Common beans are an essential food source worldwide, particularly in developing countries, and are grown in soils poor in selenium (Se), a mineral essential for human health. Adding Se to fertilizers is a promising technique; however, more studies are needed on the efficacy of this technique on common beans. This study aimed to evaluate the biofortification utilizing Se-enriched nitrogen fertilizers on common bean seeds’ agronomic, physiological, and nutritional characteristics. The pot experiment used a randomized block design with five treatments (urea, Se-enriched urea, ammonium sulfate, Se-enriched ammonium sulfate, and without N and Se), four genotypes (BRS Cometa, BRS Estilo, BRSMG Madrepérola and Pérola), and three replicates. The highest seed yield was 28.31 g pot−1 with Pérola genotype fertilized Se-enriched ammonium sulfate. Photosynthetic rates ranged from 30.37 to 39.06 µmol m−2 s−1 for Pérola and BRSMG Madrepérola, both with Se-enriched ammonium sulfate. The highest seed Se concentration was 11.17 µg g−1, with BRSMG Madrepérola fertilized with Se-enriched urea being 22.02%, 17.64%, and 22.47% higher than BRS Cometa, BRS Estilo, and Pérola, respectively. Se-enriched nitrogen fertilizers boost seed yield and alter physiological responses based on genotypes and Se-fertilizer interactions. Se-enriched fertilizers applied to soil can increase the Se concentration in common beans.

Graphical Abstract

1. Introduction

The common bean (Phaseolus vulgaris L.) is the most consumed type of legume seed (pulse) globally, standing out mainly in developing countries [1]. With 400 million individuals in tropical regions depending on beans for food and nutritional security, common beans are the most vital, e.g., legumes for direct consumption worldwide [2]. It is estimated that the consumption of beans has been responsible for meeting a significant part of the protein intake in South America, Central America, Asia, and Africa [3]. Common bean-producing regions in Brazil include most states in the south, southeast, and central-west regions and some in the northeast [4]. Grain intake provides a balanced consumption of proteins, carbohydrates, lipids, vitamins, and micronutrients (e.g., minerals) compared with cereals [5]. Among the most relevant minerals in the bean seed are calcium (Ca), iron (Fe), and zinc (Zn), of which an average of 3 g, 40 mg, and 35 mg per kg of seed are provided, respectively [6]. There are also other vital minerals in seeds, but in lower concentrations, such as selenium (Se), which is found, on average, in cooked seeds at a concentration of 5.7 µg kg−1 [7].
The common bean seed can be a valuable source of nutrients that are not abundant in its natural composition. Strategies like biofortification are necessary to enhance its nutritional value with certain elements. Biofortification is a sustainable and cost-effective approach that efficiently addresses micronutrient deficiencies, providing a swift solution for improving overall nutrition [8]. Around the world, approximately 2 billion people suffer from undernutrition, predominantly in developing nations [9]. Biofortification, through various practices, holds the potential to combat malnutrition on a global scale. These practices include foliar, soil fertilization, and genetic and microbial biofortification [10].
Selenium is a human micronutrient that has gained attention for its potential to enhance the nutritional content of food. In mammals, including humans, Se plays a vital role in the formation of selenocysteine (SeCys), a key component of enzymes like glutathione peroxidase (GPx) and thioredoxin reductase (TrxR), which are involved in essential physiological processes [11]. Because Se-dependent antioxidant enzymes like glutathione peroxidase (GPX), iodothyronine deiodinases (ID), and thioredoxin reductases (TrxR) operate, Se is a necessary trace element for both humans and animals [12]. Furthermore, around 30 selenium proteins or enzymes contain selenium (Se) [13]. At least one billion people worldwide are estimated to have an inadequate Se intake [14]. The primary sources of Se for humans are their regular food and dietary supplements [15]. Numerous health conditions, including infertility, growth retardation, and improper thyroid function, can be brought on by a selenium deficit [16].
However, there are two sides to Se, and it is necessary to maintain Se concentrations in crops since it is a micronutrient vital for animals. It has a significant impact on human health. Due to this, there is now more interest in biofortifying staple foods with Se, either by foliar or soil application [17]. Although Se is not essential for plants, it can provide benefits in specific scenarios where cellular health and plant metabolism remain unaffected. Selenium can enhance enzyme activity, such as GPx and TrxR, while improving plant resistance against cold, drought, and metal stress [18,19,20]. Despite its advantages, Se faces a limitation in that it may need to be sufficiently available in food plants for absorption at adequate concentrations [21].
Additionally, Se in the form of selenate and sulfur (S) in the form of sulfate share similar transporters (SULTR) [22]. The similarity extends to the unintentional inclusion of selenocysteine and selenomethionine in proteins, originally sulfur-based amino acids like cysteine and methionine. This similarity between these two compounds can result in antagonism or synergism, depending on the conditions, mainly their concentration. These amino acids are integral to GPx and TrxR enzymes [23]. Besides, once Se is incorporated in the cited organic forms in comestible parts of plants, Se is more bioavailable to humans compared with mineral sources [24].
More than one billion people do not receive enough selenium, making it difficult to raise the recommended daily intake of 50–55 μg of Se in the human diet [8,25]. To address the issue of Se insufficiency in the food chain, biofortification is the primary means of adding Se to staple crops [26]. Around 40 countries possess soils with low Se levels [26]. Brazil is one of the tropical countries that is facing this condition [27]. In Brazil, this condition arises from soils with variable loads and a high capacity to adsorb Se, particularly at a low pH. Consequently, the plant availability of Se is reduced in acidic soils, such as Oxisols [28].
Selenium is often classified as a reasonably mobile element in the environment. Remarkably, the oxyanion selenate has low solid: liquid distribution coefficients (K D), which in the short term vary between 1 and 10 L kg−1 [29], suggesting that most selenate initially stays in solution and is susceptible to leaching after being added to the soil [17]. Selenate acts as a chemical equivalent of sulfate when it is present in the rhizosphere. It can enter plant roots and move inside the plant using sulfate transporters, as is well established in the literature on Se biofortification [8]. Therefore, it is necessary to employ strategies to enhance Se availability in soils. One approach is the utilization of enriched fertilizers, such as urea and ammonium sulfate, which can positively influence Se availability in the soil [30]. The effect of the N source influences Se uptake and use efficiency by plants. For example, upon undergoing hydrolysis, urea dissolution can increase the pH around the granule, favoring Se absorption, whereas ammonium sulfate, due to its sulfur content in the sulfate form, may lead to an S-sulphate vs. Se-selenate competition for adsorption sites in the soil [31,32,33,34]. In addition, N interacts positively with Se, as it is essential for protein synthesis, while Se, once absorbed, is incorporated mainly into selenoproteins [35,36]. Numerous studies on Se biofortification have been conducted on crops with significant food grain relevance in Brazilian soils, including rice [35,36,37,38], common bean [30,39], sorghum [40,41], soybean [20], and wheat [42].
Because it is less expensive and more manageable for plants to absorb, sodium selenate is used as a mineral fertilizer [43], and it is preferred over organic fertilizers [44], which can lead to a lower residual concentration of Se in the soil after application [45]. However, some factors, such as crop species or the Se fertilization method, can affect the success of Se biofortification [46]. This is because the success of these programs is primarily determined by our understanding of the mechanisms of Se uptake, assimilation, and tolerance by plants [26]. Nevertheless, only a few of these studies have specifically examined the efficacy of Se-enriched fertilizers, including nitrogen fertilizers, which are more commonly used than the direct fertilization of Se salts on soil or leaves. Furthermore, no studies have been conducted to compare the efficiency of Se-enriched urea and ammonium sulfate in common bean genotypes. Consequently, further research is required to address these gaps and advance the understanding of biofortification methods.
Given the importance of Se for both plants and humans, as well as the significance of common bean seed as a food source, the novelty of the research lies in its investigation of the effectiveness of selenium Se-enriched fertilizers using different nitrogen carriers on the agronomic, physiological, and nutritional responses of common bean genotypes. Thus, we hypothesize that when Se is applied together with a nitrogen (N) fertilizer to the soil, there is an improvement in its use efficiency and, consequently, in the biofortification of common beans with Se. Thus, this study aimed to assess the effectiveness and response of applying Se-enriched urea and Se-enriched ammonium sulfate fertilizers containing selenate as top-dressing fertilizers in various common bean genotypes, defining the best approach to produce biofortified bean, as well the Se effects on biomolecules, physiological response, and seed production.

2. Materials and Methods

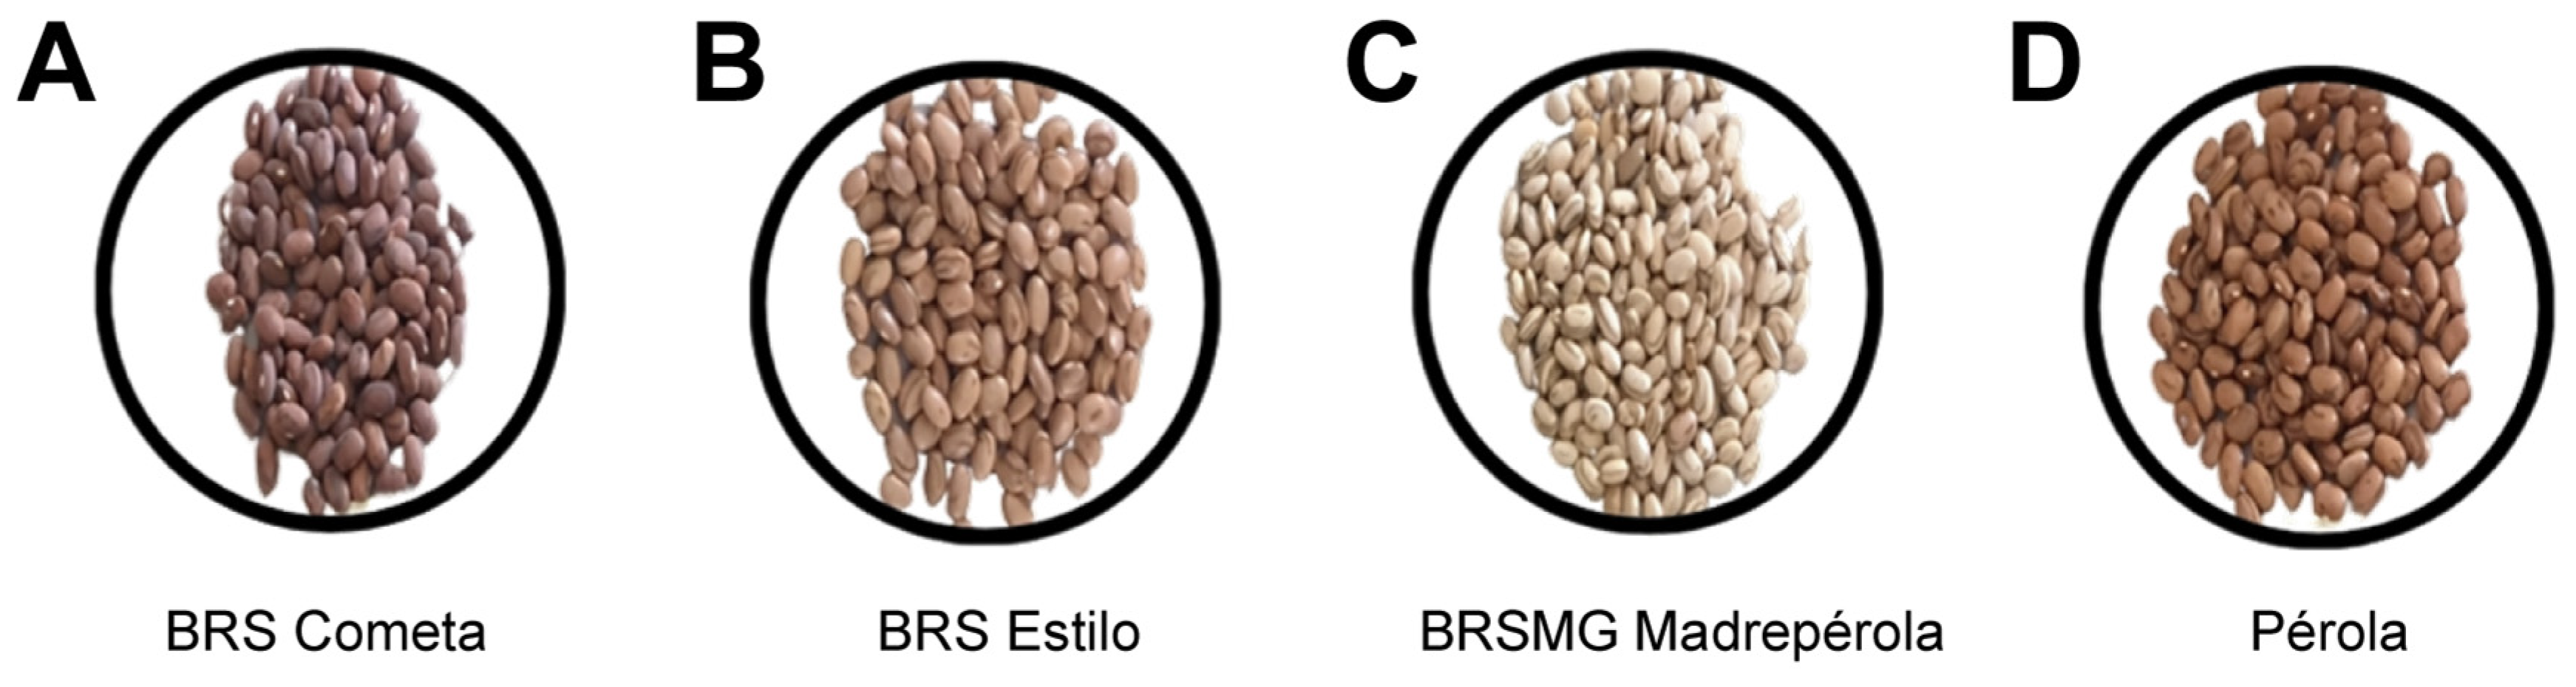
2.1. Experiment Design and Treatments

The experiment, carried out in 2017 from August to November, was conducted in a greenhouse (21°13′33.2″ S 44°58′43.3″ W) at the Federal University of Lavras, Minas Gerais, Brazil, specifically at the Department of Soil Science. During the experiment, the greenhouse temperature was set to 28 ± 2 °C during the day and 15 ± 2 °C at night. The plants were exposed to natural photoperiod conditions and cultivated in pots filled with 5 kg of air-dried soil samples collected from the 0.00–0.20 m layer (<4 mm soil fraction) of a Latossolo Vermelho distrófico [47], which corresponds to Ferralsols [48] or Oxisols, in the Soil Taxonomy [49], a classification used as the official one in this study. The soil particle size distribution was 280 g kg−1 sand, 110 g kg−1 silt, and 610 g kg−1 clay, respectively, assessed using the pipette method [46]. Based on chemical and textural analyses [50], the soil used in the experiment exhibited the following characteristics: pH of 4.6 in water at a ratio of 1:2.5 (w/v) using a pH meter, available phosphorus (P) = 11.81 mg kg−1, available potassium (K) = 61.9 mg kg−1, exchangeable Ca = 0.45 cmolc kg−1, exchangeable magnesium (Mg) = 0.28 cmolc kg−1, exchangeable aluminum (Al) = 1.18 cmolc kg−1, hydrogen + aluminum (H + Al) = 11.62 cmolc kg−1, remaining phosphorus (P-rem) = 18.34 mg L−1, available Fe = 171.29 mg kg−1, and organic matter (OM) = 3.27 dag kg−1. The available contents of potassium (K), phosphorus (P), zinc (Zn), iron (Fe), manganese (Mn), and copper (Cu) were determined by the 1 M KCl/Mehlich−1 soil test. Calcium (Ca2+) and magnesium (Mg2+) exchangeable contents were extracted by a 1 mol L−1 KCl solution-soil test. The available contents of boron (B) were determined by the hot-water extraction method, and the available contents of sulfur (S) were determined by the monocalcium phosphate diluted in acetic acid method. H + Al: Shoemaker, McLean e Pratt (SMP) extractor. Soil organic matter (SOM) was determined using the Walkley-Black method [50].
The samples were dried in a forced-air circulation oven at 45 °C and ground (<0.38 mm) using a stainless-steel mill to determine the Se concentration. Sample digestion was carried out using a microwave oven with a CEM® Mars-5 microwave system (CEM Corp, Matthews, NC, USA), following the USEPA Method 3051A, 0.28 mg kg−1 [51]. The selenium concentration in the digested solution was quantified by inductively coupled plasma mass spectrometry (ICP-MS). During the analyses, certified samples of plant material were employed in quality control and assurance protocols (QA/QC), with a Se recovery rate of 109 ± 9.0%. Tomato leaves—NIST SRM 1573a and White Clover—BCR 402 were used as CRMs.
Based on soil chemical analysis, lime was applied to increase the base saturation to 60%. Calcium carbonate (CaCO3) and magnesium carbonate (MgCO3) with 99% purity were used in a 3:1 molar mixture, the equivalent of 3.31 g kg−1 soil, with 75% calcium carbonate and 25% magnesium carbonate. After pH correction, the soil was dried and sieved (<4 mm). After soil incubation, the achieved soil pH was 5.8 ± 0.03. This procedure was performed 30 days before the beginning of the experiment when pots were maintained with a soil moisture ~70% of the total pore volume (TPV). After liming, sowing was performed using six seeds per pot. Throwing was performed seven days after the seedlings’ emergence, leaving two plants in each pot. Planting fertilization was then conducted during the bean plant sowing.
The experiment was conducted in a randomized complete block design arranged in a 5 × 4 factorial scheme. The first factor encompasses the Se and N fertilization: urea (positive control, without S and Se), Se-enriched urea (without S) at a dose of 0.94 mg Se pot−1, ammonium sulfate (positive control, without Se), Se-enriched ammonium sulfate, at a dose of 0.94 mg Se pot−1, and a control (negative, without the fertilization with N, S, and Se). The second factor was related to four carioca bean genotypes included in the study: BRS Cometa, BRS Estilo, BRSMG Madrepérola, and Pérola (Figure 1). The treatment descriptions are presented in Table 1. BRS means that the Brazilian Agricultural Research Corporation (EMBRAPA) developed and released the bean variety. The experiment had three replications, resulting in sixty experimental units, with two plants per experimental unit (replicates).
The base fertilization (at planting) was applied to all treatments to ensure consistent starting conditions for all genotypes following the recommended doses according to [52] using Nitrogen (N)-150 mg kg−1, Phosphorus (P)-200 mg kg−1, Potassium (K)-75 mg kg−1, Sulfur (S)-25 mg kg−1, Boron (B)-0.5 mg kg−1, Copper (Cu)-1.5 mg kg−1, Iron (Fe)-5 mg kg−1, Molybdenum (Mo)-0.1 mg kg−1, and Zinc (Zn)-5 mg kg−1. The macronutrient sources used were urea (CH4N2O), potassium sulfate (K2SO4), potassium chloride (KCl), and triple superphosphate (Ca(H2PO4)·2H2O). The micronutrient sources included copper sulfate (CuSO4·5H2O), iron sulfate (FeSO4·7H2O), zinc sulfate (ZnSO4·7H2O), boric acid (H3BO3), and ammonium molybdate ((NH4)6Mo7O24) (reagent-grade, Synth, Diadema, São Paulo, Brazil).
Twenty days after seed emergence, the urea and Se-enriched urea treatments received a top-dressing fertilization based on the recommendation, according to [50]. These treatments included urea (CH4N2O), potassium sulfate (K2SO4), and potassium chloride (KCl) sources at rates of N-150 mg kg−1, K-75 mg kg−1, and S-25 mg kg−1. The sulfur concentration was extrapolated for the ammonium sulfate and Se-enriched ammonium sulfate treatments due to fertilization with AS (21% N and 23% S), resulting in N-150 mg kg−1, K-75 mg kg−1, and S-164 mg kg−1. The sources used were ammonium sulfate ((NH4)2SO4), potassium sulfate (K2SO4), and potassium chloride (KCl). The control treatment received only K-75 mg kg−1 fertilization without N, S, and Se fertilization in the top dressing. The experiment was conducted over 90 days until seed harvest, with soil moisture maintained at 70% of its maximum, ensuring it remained close to field capacity throughout the period.

2.2. Method for Preparing Fertilizer and Characterization of Nitrogen Fertilizers

A volume of 1.15 mL of diethanolamine (reagent-grade, Êxodo Científica Química Fina Indústria e Comércio Ltda, Sumaré, Brazil) was utilized to produce Se-enriched fertilizers for the U + Se (Se-enriched urea) and AS + Se (Se-enriched ammonium sulfate) treatments. This additive facilitates the combination of sodium selenate (Na2SeO4) with urea or ammonium sulfate. Additionally, twelve drops of liquid dye (Sherwin-Williams Brasil Indústria e Comércio Ltda, Taboão da Serra, Brazil) were added to ensure the mixture’s uniformity between sodium selenate and the nitrogen sources, thus ensuring successful blending and Se adherence to the fertilization sources. Specifically, 260.8 mg of Se (Table 2) was mixed with sodium selenate in 1 kg of ammonium sulfate containing 21% N. As for urea, considering its 46% N content, 573.6 mg of Se (Table 2) was mixed with sodium selenate in 1 kg of urea.

2.3. Gas Exchanges, Fluorometry, and Soil Plant Analysis Development (SPAD) Index

Gas exchange and fluorometry evaluations were conducted simultaneously using a portable infrared gas analyzer (IRGA, LICOR Biosciences, model LICOR 6400, Lincoln, NE, USA) and a fluorometer (Mini-Pam II, Walz, Effeltrich, Germany) after 14 days of top-dressing fertilization. Gas exchange parameters measured included the net assimilation rate (A-µmol CO2 m−2s−1) calculated by A = F(Cr − Cs(100 − Wr/100 − Ws))/100S, where F = molar flow rate of air entering the leaf chamber, μmol s−1; Cr = mole fraction of CO2 in the reference IRGA, μmol CO2 mol−1 air; Cs = mole fraction of CO2 in the sample IRGA, μmol CO2 mol−1 air; Wr = reference IRGA mole fraction of water vapor, mmol H2O mol air−1; and Ws = sample IRGA mole fraction of water vapor, mmol H2O mol air−1 and S = leaf area, cm−2. Stomatal conductance to water vapor (gsw-mol H2O m−2s−1) was calculated by gsw = (1/(1/gtw) − (kf/gbw)), where gtw = total conductance to water vapor, mol H2O m−2 s−1; kf = (K2 + 1)/(K + 1)2; and gbw = boundary layer conductance to water vapor, mol H2O m−2 s−1. Transpiration (E-mol H2O m−2s−1) was calculated by E = F(Ws − Wr)/100S(1000 − Ws), where F = molar flow rate of air entering the leaf chamber, μmol s−1; Ws = sample IRGA mole fraction of water vapor, mmol H2O mol air−1; Wr = reference IRGA mole fraction of water vapor, mmol H2O mol air−1, and S = leaf area, cm2. Instantaneous water use efficiency was calculated by WUE = A/E (A/E-μmol CO2 mmol−1 H2O), where A is the net assimilation rate (A-µmol CO2 m−2 s−1) and E is Transpiration (E-mol H2O m−2s−1). Fluorometry measurements focused on quantifying the photochemical efficiency of photosystem II [(ΔF/Fm′)], where ΔF represents steady-state fluorescence, and Fm′ denotes the maximum fluorescence of a light-adapted sample after applying a saturation flash. Analysis was taken between 8:00 a.m. and 12:00 a.m. under optimal conditions. The true leaf, located in the middle region of the bean plant, was selected for measurement. The photosynthetically active radiation (PAR) was standardized at 1000 µmol m−2 s−1, and the ambient CO2 concentration was maintained at 420 mg kg−1. The average relative humidity during the experiment was 70%, with a temperature range of 23 to 25 °C. Additionally, chlorophyll levels were indirectly measured in triplicate using the SPAD-502 portable chlorophyll meter (Konica, Minolta, Tokyo, Japan). SPAD is an indirect measure of the leaf chlorophyll content, widely used in plant physiology.

2.4. Seed Yield

After growing beans, the harvested seeds were dried in a forced ventilation oven at 65 °C for 72 h to measure their dry mass and determine seed production. Subsequently, samples from each material were ground and stored appropriately for further analysis.

2.5. The Total Concentration of Selenium and Sulfur

For the analysis of Se and sulfur S in the seeds and Se in the nitrogen fertilizer applied in the top dressing, the extraction method employed was the 3051A methodology from the United States Environmental Protection Agency [51]. The ground samples, weighing 500 mg each, were digested in Teflon® PTFE vessels with 5 mL of concentrated HNO3 (≥65%) under a pressure of 0.76 MPa for 15 min, using microwave oven model MARS 5 (CEM Corporation, Matthews, NC, USA). The pressure corresponded to a temperature of approximately 175 °C. Subsequently, 5 mL of double-distilled water was added to the extract and filtered for elemental analysis. The elemental content in the digested solution was determined using graphite furnace atomic absorption spectrometry.
Certified and blank standards were incorporated into the analysis to ensure its accuracy and quality. The accredited standard was White Clover (BCR 402, Institute for Reference Materials and Measurements, Geel, Belgium), with a known Se concentration of 6.7 mg kg−1. The certified standard and the blank were included in each digestion batch to guarantee and monitor the quality of the analysis. The average recovery of the reference standard used in the analysis was 91.72%.

2.6. Centesimal Composition (Biomolecules)

The centesimal composition (biomolecules) analysis of the ground seed samples followed the method outlined by the Association of Official Analytical Chemists-AOAC [53]. The moisture content was determined by the drying method in an oven at a constant weight of 65 °C. In comparison, the ash content was determined through incineration in a muffle furnace at 550 °C until a constant weight was achieved. The total nitrogen was quantified using the Kjeldahl method, using a Tecnal nitrogen distiller, model TE-036/1, and a conversion factor of 6.25 was applied to obtain the total crude protein content. The lipid content was determined using the Soxhlet method with petroleum ether as the solvent for extraction. The total percentage of carbohydrates was calculated using the following equation:
Total carbohydrates (%) = 100 − As − Lp − Cp
where: Total carbohydrates (%) is the total carbohydrates (soluble and insoluble) in seed, As (%) is the total ashes in seed, Lp (%) is the total lipids in seed, and CP (%) is the total crude protein in seed.

2.7. Statistical Analysis

The data obtained were submitted to the basic assumptions of analysis of variance (normality, homoscedasticity, additivity, and independence of residuals), which were tested and attained and reached significance in the F-test (p < 0.05); the treatment means of variables measured were differentiated using the Scott–Knott test (p < 0.05) through the Speedstat 2.8® software [54].

3. Results

3.1. Gas Exchanges, Fluorometry, and SPAD Index

The soil plant analysis development (SPAD) index ranged from 32.53 (BRSMG Madrepérola/control treatment) to 53.46 (BRS Estilo/urea) (Figure 2A). Significant differences in performance were observed among the genotypes only for the Se-enriched urea and control treatments, with BRSMG Madrepérola exhibiting the lowest average compared with the other treatments. Regarding the fertilization sources, BRSMG Madrepérola performed differently from the different genotypes. The urea, ammonium sulfate, and Se-enriched ammonium sulfate fertilization had the highest averages but no significant differences among themselves; however, they were superior to the others. The Se-enriched urea and control treatments resulted in lower means, but no significant difference existed between them. Additionally, the Se-enriched urea treatment reduced the SPAD index by 26.65% compared with urea.
The maximum quantum efficiency of the photochemical activity of photosystem II (PSII) ranged from 0.69 (BRS Estilo/control treatment) to 0.79 (BRSMG Madrepérola/Se-enriched urea) (Figure 2B). No significant differences in performance were observed among genotypes for the different fertilization sources. However, BRS Estilo’s performance alone differed from the fertilizer sources. Higher averages were observed with Se-enriched urea and Se-enriched ammonium sulfate, although there was no significant difference between the two. The other fertilization sources also showed no significant differences from each other but were inferior.
The photosynthetic rate varied between 30.37 µmol m−2 s−1 (Pérola/Se-enriched ammonium sulfate) and 39.06 µmol m−2 s−1 (BRSMG Madrepérola/Se-enriched ammonium sulfate) (Figure 2C). A significant performance difference was observed among the genotypes only for the Se-enriched ammonium sulfate. Pérola had a lower average than the other genotypes, and its performance significantly differed only between the fertilization sources. Pérola was affected by fertilization sources such as urea, ammonium sulfate, and control treatment, which showed higher averages but did not differ significantly from each other. The fertilizer sources with added Se resulted in the lowest averages, but there was no significant difference between them. The fertilization of Se-enriched urea reduced the net photosynthesis values by 10.43% compared with urea. The same trend was observed for Se-enriched ammonium sulfate, which also resulted in a reduction of 17.14% compared with ammonium sulfate.
The other gas exchange parameters, i.e., stomatal conductance (Figure 2D), transpiration (Figure 2E), and instantaneous water use efficiency (Figure 2F), varied within the ranges of 0.11 to 0.18 mol m−2s−1, 4.57 to 7.07 mmol m−2s−1, and 12.88 to 19.68%, respectively. No significant differences in performance were observed among the genotypes for these parameters within the same fertilization source. Only the BRS Estilo genotype showed a different performance between the fertilization sources. The treatments with ammonium sulfate, both with and without Se, and the control treatment showed higher averages, with no significant differences observed among them. Conversely, fertilization with urea resulted in the lowest averages, but there were no significant differences among them.

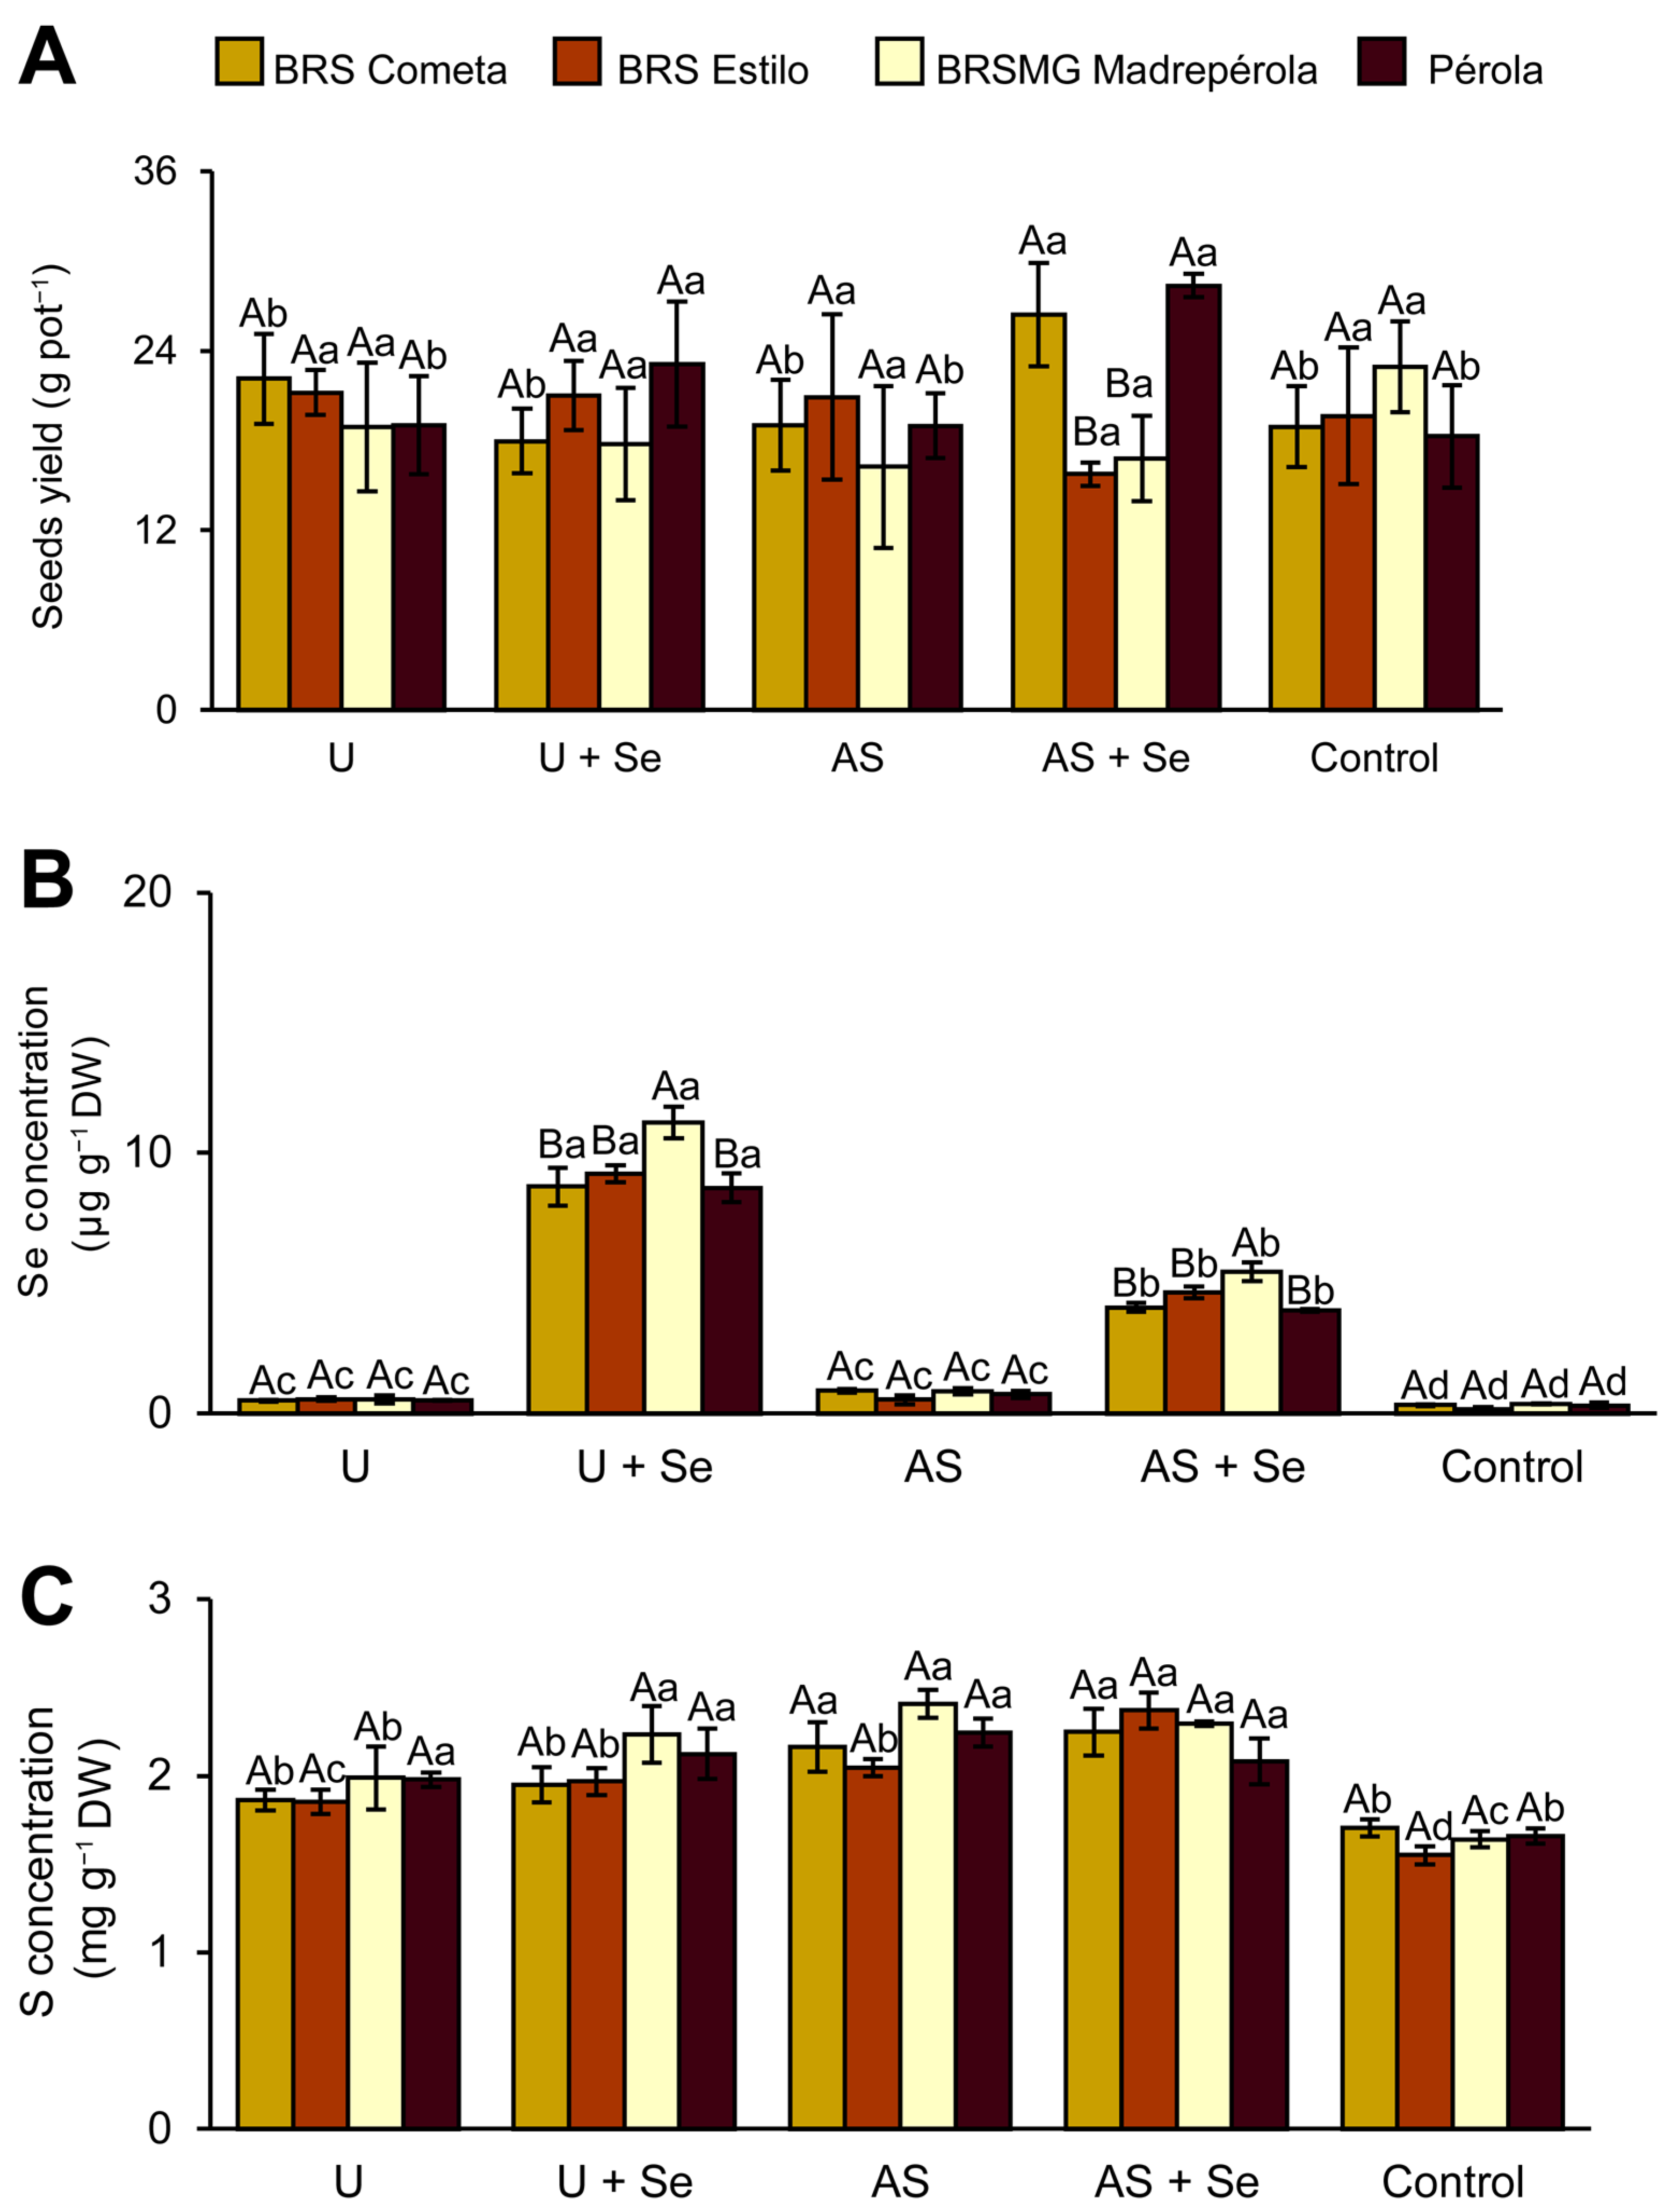
3.2. Seed Yield and Selenium and Sulfur Concentration in the Seeds

Seed production varied between 15.76 g pot−1 (BRS Estilo/Se-enriched ammonium sulfate) and 28.31 g pot−1 (Pérola/Se-enriched ammonium sulfate) (Figure 3A). A significant difference in performance was observed among the genotypes only for the Se-enriched ammonium sulfate treatment, with BRS Cometa and Pérola having higher means than the others. Regarding the fertilization treatments, only BRS Cometa and Pérola differed statistically from the other genotypes. For BRS Cometa, Se-enriched ammonium sulfate had a significantly higher mean, with differences of 32.82%, 20.52%, 33.17%, and 35.46% compared with urea, Se-enriched urea, ammonium sulfate, and the control, respectively. For Pérola, both Se-enriched ammonium sulfate and Se-enriched urea fertilization showed higher averages, yet they did not differ significantly. Ammonium sulfate, urea, and the control treatment had lower means, but no significant differences were observed among them. Applying Se-enriched ammonium sulfate resulted in increments of 27.92%, 31.87%, and 28.19% for the treatments mentioned above, respectively.
The selenium concentration in seeds varied between 0.14 mg kg−1 (BRS Estilo/Control treatment) and 11.17 mg kg−1 (BRSMG Madrepérola/Se-enriched urea) (Figure 3B). A significant difference in performance was observed among the genotypes for the Se-enriched urea and ammonium sulfate + Se treatments, with BRSMG Madrepérola exhibiting a higher average than the other genotypes for these two fertilization sources. The performance of the genotypes also differed between the fertilization sources. Applying Se-enriched urea resulted in statistically higher means, regardless of the genotypes tested. BRSMG Madrepérola had means that were 22.02%, 17.64%, and 22.47% higher than BRS Cometa, BRS Estilo, and Pérola, respectively. The second source with the highest average was Se-enriched ammonium sulfate. BRSMG Madrepérola had averages that were 25.32%, 14.68%, and 27.34% higher than BRS Come-ta, BRS Estilo, and Pérola, respectively. No significant differences were observed among the genotypes in the fertilization sources where Se was not added. However, when applying an N source at the top dressing, the genotypes showed a higher Se concentration than the control treatment. The increase was 45.97% for urea and 61.74% for ammonium sulfate, with no statistical difference. The control had the lowest Se concentration.
Seed’s S concentration varied between 1550.68 g kg−1 (BRS Estilo/control treatment) and 2405.16 g kg−1 (BRSMG Madrepérola/ammonium sulfate) (Figure 3C). No significant differences were observed among the genotypes for the specific fertilization source. However, the genotypes’ performance varied between the different fertilization sources. For BRS Cometa, the highest averages were observed with the fertilization using ammonium sulfate, with and without Se, and there was no statistical difference between them. The fertilization of urea with and without Se also showed no significant difference. The control treatment had the lowest average. On average, the fertilizations with ammonium sulfate were 13.48% higher than those with urea and 22.67% higher than the control. Although urea-based fertilizers do not contain S, they increased S accumulation by 10.63% compared with the control. For BRS Estilo, the highest mean was observed in the fertilization with Se-enriched ammonium sulfate, followed by Se-enriched urea and ammonium sulfate. The treatment with urea without Se had the lowest average compared with the other treatments, except for the control, which had the lowest average overall. Se-enriched ammonium sulfate increased by 21.94%, 17.04%, 13.69%, and 34.61% compared with urea, Se-enriched urea, ammonium sulfate, and control treatment. Using Se-enriched urea resulted in a percentage increase of 5.90% compared with urea and 21.18% compared with the control. For ammonium sulfate, the comparative increase was 9.55% compared with urea and 24.24% compared with the control.
For BRSMG Madrepérola, applying Se-enriched urea and ammonium sulfate with and without Se resulted in higher S concentrations in this genotype, although they did not differ statistically. The urea and control treatments had the lowest averages, and applying urea resulted in a higher S concentration. The Se-enriched urea treatment added 11.05% and 26.61% more S concentration than the urea and the control treatment. For Pérola, only the control treatment differed significantly from the others, showing a lower average. Compared with the control treatment, the ammonium sulfate and urea treatments increased the overall S concentration by 23.34% and 19.10%, respectively.

3.3. Centesimal Analysis

The crude protein content in the seed varied between 16.45% (BRSMG Madrepérola/control treatment) and 31.43% (BRS Cometa/ammonium sulfate) (Figure 4A). A significant difference in performance between the genotypes was observed only in Se-enriched ammonium sulfate, with BRSMG Madrepérola having the highest mean compared with the others. This difference was 34.43% (BRS Cometa), 37.64% (BRS Estilo), and 32.72% (Pérola). The genotypes performed significantly differently between the fertilization sources. BRS Cometa had the highest average percentage when ammonium sulfate was used. The urea and Se-enriched urea treatments showed statistically equal results, superior to the Se-enriched ammonium sulfate and control treatments. BRS Estilo had its highest averages when urea, Se-enriched urea, and ammonium sulfate were applied, with no significant differences observed among these last three treatments. The Se-enriched ammonium sulfate fertilization and control treatment resulted in the lowest averages, which were not significantly different. BRSMG Madrepérola was equally affected by the fertilization of urea, Se-enriched urea, ammonium sulfate, and Se-enriched ammonium sulfate, resulting in the highest averages. The control treatment had the lowest average. The Pérola showed similar trends to those of the BRS Estilo concerning fertilization sources. Compared with the treatment without Se, Se-enriched ammonium sulfate reduced the protein content by 40.24%, 36.30%, and 31.33% for BRS Cometa, BRS Estilo, and Pérola, respectively.
The total carbohydrate content in the seed varied between 64.02% (BRS Cometa/ammonium sulfate) and 79.06% (BRSMG Madrepérola/control treatment) (Figure 4B). A significant difference in performance between genotypes was observed only in treatments with ammonium sulfate without and with Se. Ammonium sulfate showed a difference between the studied genotypes, with BRS Estilo and Pérola having superior averages compared with the others, and no difference was observed between them. In the fertilization of Se-enriched ammonium sulfate, only BRSMG Madrepérola differed significantly from the others, with a lower mean compared with BRS Cometa, BRS Estilo, and Pérola by 15.30%, 16.90%, and 14.82%, respectively. No differences were observed among the other genotypes. The genotypes performed differently in different fertilization sources. For the BRS Cometa genotype, higher averages were observed with fertilization with Se-enriched ammonium sulfate and control treatment, with no significant differences from each other. The treatments with urea, Se-enriched urea, and ammonium sulfate showed lower means than the other fertilization sources, but they did not differ statistically. BRSMG Madrepérola showed a higher mean with the control treatment than the other fertilization sources. The other treatments did not differ statistically from each other. Pérola presented results similar to those of the BRS Cometa and BRS Estilo genotypes. The Se-enriched ammonium sulfate treatment, compared with the ammonium sulfate without Se, increased the percentage of total carbohydrates for the BRS Cometa, BRS Estilo, and Pérola genotypes by 20.17%, 15.16%, and 12.68%, respectively.
The percentage of total ashes in the seed ranged from 2.77% (BRSMG Madrepérola/Se-enriched urea) to 4.07% (Pérola/control treatment) (Figure 3C). A significant difference in performance was observed between genotypes only in treatments with urea, Se-enriched urea, and control treatment. The urea fertilization resulted in a difference between the studied genotypes, with BRSMG Madrepérola and Pérola having higher averages than the others, and no difference was observed between them. No differences were found among the other genotypes. Only the BRSMG Madrepérola genotype showed lower averages in the Se-enriched urea treatment. BRS Cometa and Pérola genotypes for the control treatment had higher averages than the others, with no significant difference. No difference was observed for the other genotypes. The performance of the genotypes was statistically different between the fertilization sources. For BRS Cometa, higher averages were observed with the fertilization of ammonium sulfate and control treatment, with no significant differences between them. The lowest averages were found for urea, Se-enriched urea, and Se-enriched ammonium sulfate treatments, with no significant differences from each other. BRS Estilo had the highest means in the treatments with ammonium sulfate without and with Se and control, showing no differences. Urea and Se-enriched urea treatments had the lowest averages. BRSMG Madrepérola presented the highest averages when urea, ammonium sulfate, Se-enriched ammonium sulfate, and control were applied, with no significant difference from each other. Se-enriched urea treatment had a lower mean compared with the other treatments. For Pérola, only the control treatment differed significantly from the others, with the highest mean, and no differences were observed.
The percentage of total lipids in the seed ranged from 0.57% (Pérola/ammonium sulfate) to 2.96% (BRS Cometa/urea) (Figure 4D). A significant difference in performance between genotypes was observed only in urea and control treatments. BRS Cometa showed a higher mean than the other genotypes under the urea and control treatments, while the other genotypes did not differ. The performance of the genotypes was significantly different between the fertilizer sources, except for BRSMG Madrepérola. BRS Cometa showed a higher average with urea fertilization. The se-enriched urea and control treatments had the second-highest averages, but no significant difference existed between them. The fertilizations with sulfate resulted in the lowest percentage of lipids, with no difference between them. With no difference, higher averages were observed for the BRS Estilo genotype with urea, Se-enriched urea, and control treatment. The ammonium sulfate and Se-enriched ammonium sulfate treatments had the lowest averages, with no significant difference between them. No difference was observed between the fertilization sources for BRSMG Madrepérola. Pérola had the highest averages with urea, Se-enriched urea, Se-enriched ammonium sulfate, and control treatments, with no significant difference observed from each other.

4. Discussion

The Se biofortification technique is crucial for improving the nutritional quality of foods. Genetic and agronomic biofortification can significantly increase the availability of Se in bean crops without compromising their productivity. However, it is crucial to establish the appropriate dose, sources, and methods for applying Se to common beans, evaluate the impacts on agronomic, physiological, and nutritional characteristics, and determine the proper amount of biofortified common beans that should be consumed safely.
Fertilization with selenium-enriched urea reduced the SPAD index in the BRSMG Madrepérola genotype, suggesting a possible toxic effect. In addition, this genotype presented the highest selenium concentration in the seeds. Research on lettuce cultivation in hydroponic systems, which evaluated different selenium concentrations (selenate and selenite) ranging from 2 to 128 µM, failed to include a control group. The results indicated that excess selenium damages photosynthetic organs and impairs photosynthetic function, negatively impacting plant development [55]. High concentrations of selenium in plants can exert an antioxidant effect. However, on the other hand, they can also behave as pro-oxidants, leading to damage to cell membranes and the production of nonspecific selenoproteins. These changes can cause dysfunction in photosynthesis since they inhibit the reaction centers of the plant photosystem [18]. Nitrogen is a fundamental component of chlorophyll, and sulfur deficiency can negatively impact nitrogen use efficiency; this relationship is bidirectional [56]. Imbalances in nitrogen (N) and sulfur (S) supply to plants can negatively affect SPAD analysis, signaling possible disruptions in chlorophyll levels [57].
When applying Se, the BRS Estilo genotype showed an increase in ΔF/Fm′, but this gain did not hurt the seed yield of this genotype. This result can be attributed to the greater vulnerability of the genotype to saline stress caused by the salt-based fertilizers used in this study. Previous studies indicate that selenium (Se) fertilization significantly increased ΔF/Fm’ values by approximately 5% to 7% under saline stress conditions [58]. This finding aligns with the overall increase of 7% recorded in this experiment for the BRS Estilo genotype.
The Pérola genotype demonstrated the lowest photosynthetic rate when exposed to Se application. Applying specific concentrations of selenium can cause symptoms of abiotic stress, impacting plants at both the molecular and physiological levels. These effects may involve rapid adaptations in transcription and metabolism, control of osmotic potential, and decreased leaf expansion pressure [59]. One of the effects on selenium is the accumulation of carbohydrates, which can boost plant development and growth, especially in grain production [60]. Non-stomatal limitations impact photosynthesis negatively, reducing Rubisco’s quantity and activity and causing carbohydrate accumulation [61]. Several studies have demonstrated the benefits of selenium in the photosynthetic system of plants [35,62] when applied in reduced doses, i.e., under these circumstances, Se contributes significantly to plant growth and development. When investigating the gas exchange process in arugula under the influence of residual selenium from different Se sources, [45] identified an increase in the transpiration rate, intrinsic water use efficiency, stomatal conductivity, and instantaneous water use efficiency, all positively correlated with the presence of selenium.
The BRS Estilo genotype was the only one to significantly influence the gas exchange parameters analyzed, such as stomatal conductance, transpiration, and intrinsic water use efficiency, mainly when nitrogen fertilizers were applied. The higher values recorded in the control, ammonium sulfate, and selenium-enriched ammonium sulfate treatments, when compared to the treatments with urea and selenium-enriched urea, can be related to the interaction between nitrogen (N), sulfur (S), and the atmospheric availability of CO2 in plants [63].
Applying selenium as urea or ammonium sulfate as the top dressing did not hurt the seed production of the analyzed genotypes. A significant increase in productivity was observed in some instances, such as BRS Cometa and Pérola. In addition, a variation in seed production was found among the tested genotypes when they received fertilization with ammonium sulfate enriched with selenium. The results indicate that, among the evaluated genotypes, there is genetic variability in the use of selenium in the presence of high concentrations of sulfur, which directly impacts seed production. This phenomenon could be attributed to different genotypes of the same plant species presenting unique gene expression patterns related to sulfate transporters, which influence the efficiency of sulfur (S) and selenium (Se) absorption [64]. When selenate is used, S and Se use sulfate transporters (SULTR), proteins that transport S in plants [65]. Therefore, the plant’s absorption and transport of S are reduced when the Se concentration is high.
Biofortification considers the enrichment of food without negatively affecting the plant cycle [66]. Common beans showed potential for biofortification using the two fertilizers studied as Se transporters for plants. The increase in seed dry mass in some genotypes, in both fertilizers enriched with Se, when compared to its ordinary form, contributes to the reported benefits of Se. A study under greenhouse conditions growing common beans in tropical soils showed no increase in seed dry mass with Se fertilization (selenate form) at doses of 0.25 to 2 mg dm−3 [39]. Araújo et al. [30] also reported no increase in seed dry mass for common beans treated with Se through various strategies, e.g., Se-enriched monoammonium phosphate fertilization, Se-enriched urea, Se foliar fertilization, Se-enriched monoammonium phosphate + Se-enriched urea, Se-enriched monoammonium phosphate + Se foliar fertilization, and Se foliar fertilization + Se-enriched urea. The selenium (as selenate) doses used (without considering the control) ranged from 0.2 to 0.8 mg dm−3. Notably, these studies did not include the possibility of a genotypic variation in the response to Se. In contrast, for soybeans grown under field conditions, applying Se via MAP at a dose of 80 g ha−1 increased the seed yield of the TMG7061 genotype [20].
The inclusion of Se in animal feed and the addition of selenate to NPK fertilizers for use in plantations and pastures in Finland have proven to be efficient, safe, and controlled methods for increasing the population’s Se consumption to recommended levels [66]. The incorporation of Se through fertilizers implies an improvement in the quality of agricultural products. Thus, the concentration of selenoproteins is increased [13]. A study carried out with rice [37] found that incorporating Se into the soil effectively transferred Se to the grain; however, no impacts on seed production were observed. Reis et al. [36] noted an increase in Se concentration in rice crops after including this element in fertilization, suggesting that this strategy effectively increases Se consumption to appropriate levels in the population.
Studies on selenium in plants have demonstrated its crucial role in enhancing the preventive activity against peroxidation, restoring the integrity and functionality of cell membranes, modulating the activity of antioxidant enzymes, and in the repair and reconstruction processes of chloroplasts [39]. Thus, Se can benefit plants in certain situations in which they are subjected to dose-dependent effects. These impacts on plants can significantly contribute to abiotic stress mitigation [67]. Our study observed that the control treatment, which did not receive fertilization with N, S, and Se, did not exhibit a lower grain dry mass than the other treatments despite the potential negative abiotic impact. The results indicated that the fertilization applied during planting was adequate, as [52] mentioned, and fully met the basic nitrogen and sulfur needs of the genotypes evaluated.
The BRSMG Madrepérola genotype exhibited the highest Se concentration in its seeds compared with the other genotypes when Se was fertilized, indicating an effect dependent on genetic variability. This characteristic, specific to this genotype, results in a more pronounced Se accumulation in its seeds. However, this accumulation is unrelated to seed production or the overall concentration effect. Interestingly, when applying Se-enriched ammonium sulfate, the BRSMG Madrepérola genotype maintained a protein content similar to other fertilization sources. In contrast, protein synthesis was significantly reduced in different genotypes, leading to changes in the composition of the seed and alterations in the balance of biomolecules, with a higher proportion of proteins and carbohydrates. These findings suggest a strong relationship between the genotype’s ability to synthesize proteins and its high Se levels in seeds.
The fertilization of Se-enriched urea proved the most effective method for increasing Se concentrations in the seeds of common bean genotypes. This finding is consistent with previous research conducted by Araújo et al. [30] in common beans, where urea was found to be the most effective in increasing Se contents compared with other forms of fertilization, such as monoammonium phosphate and foliar fertilization [68]; similar results were reported in rice, where Se-enriched urea outperformed other fertilization methods, such as soil preparation and Se foliar, in increasing Se levels. In a study conducted by Félix et al. [38] on upland rice, Se-enriched urea (applying 80 g Se ha−1 through selenate) efficiently increased the Se content in polished seeds across 20 rice genotypes. This study further highlighted the existence of genetic variability among the tested genotypes concerning Se concentration in the seeds.
The higher seed’s Se concentration when urea is applied compared with ammonium sulfate can be attributed to various factors related to soil–plant interactions. Ammonium sulfate, composed of ammonium (NH4+), undergoes a nitrification reaction in the soil. This reaction releases two H+ ions for every NH4+ molecule in the ammonium sulfate, containing two moles of NH4+. As a result, four moles of H+ are released. On the other hand, urea is also subject to the same reaction, but due to its chemical composition, only two moles of H+ are released. Another factor is that in the case of urea, reactions generate NH3 in the soil, causing an increase in pH near the urea granule [69], which increases Se availability to plants [46].
It is important to note that due to the lower N percentage in ammonium sulfate fertilizer (21%) compared with urea (46%), a higher amount of ammonium sulfate had to be applied to meet the nutrient requirement specified by Malavolta [52] for top dressing. This increased ammonium sulfate fertilization resulted in a higher S content in the soil, which may have hindered the plant’s Se uptake while promoting an increase in the seed’s S accumulation. Previous studies have shown that selenate primarily moves through sulfate transporters and is metabolized through the S metabolic pathway in plants. An excess of S in grains can induce S starvation in plants, affecting their overall nutrient balance [70]. Therefore, each fertilizer’s specific characteristics and chemical reactions influenced the soil conditions to which Se was exposed. Selenium adsorption is a significant factor controlling its concentration, and soil physicochemical properties, such as pH, play a crucial role in Se availability [71].
The higher seed’s Se and S concentrations resulting from top-dressing fertilization with N sources (urea and ammonium sulfate) compared with the control treatment are attributed to the N supply. Previous studies conducted in crops such as rice [36] and wheat [31] have reported that N can enhance the uptake and translocation of Se in plants. Nitrogen stimulates the production of O-acetyl serine, a key regulator of S metabolism and cysteine synthesis (a S-containing amino acid) in higher plants, leading to increased protein synthesis [32]. This finding is consistent with the results of this study. Although not investigated in this study, root growth is another contributing factor to the absorption of S and Se. Nitrogen promotes root development, enhancing the uptake of P, K, S, and other mineral elements, including Se [33].
Additionally, further studies should be conducted to assess the economic feasibility of using Se-enriched fertilizers, as demonstrated in Ethiopia by Oumer et al. [34], where the biofortification of staple cereals with Se proved to be a cost-effective strategy for mitigating Se deficiency in regions with low soil Se concentrations. Furthermore, it is essential to investigate the bioaccessibility of Se in common bean seeds. Thus, this study, along with the subsequent stages to be developed, significantly improves the nutritional quality of common beans while enhancing global food security, especially in countries where beans are a staple food in the daily diet.

5. Conclusions

Applying selenium via soil through Se-enriched fertilizers has shown potential for increasing grain’s Se contents in common beans. Se-enriched nitrogen fertilizers can enhance seed production and change physiological responses depending on the genotypes vs. Se-fertilizer interactions. The biofortification effectiveness and the observed effects varied depending on the method of Se addition and the specific genotypes evaluated. It was found that grain’s Se concentrations in common beans were higher when applied via Se-enriched urea, likely due to the localized soil pH increase (i.e., near the urea granule) caused by this source providing increased Se availability in oxidic soils. Using ammonium sulfate as a Se carrier had a distinct effect, leading to a higher synthesis of carbohydrates over proteins in most of the tested genotypes. Among the genotypes, BRSMG Madrepérola showed the best response to Se fertilization, maintaining the balance between biomolecules and demonstrating high efficiency in the grain’s Se accumulation. Additionally, top-dressing nitrogen fertilization played a role in increasing the grain’s Se concentration. This study provides valuable insights into using nitrogen fertilizers as Se carriers in tropical soils for food crops’ biofortification with selenium, leveraging agronomic knowledge of fertilization practices.

Author Contributions

Conceptualization, F.A.N., S.B.Z., P.A.N.B., S.N.d.A., F.A.D.M., M.L.d.S.S. and L.R.G.G.; Validation, F.A.D.M., M.L.d.S.S. and L.R.G.G.; Formal analysis, F.A.N. and R.F.R.C.; Inves-tigation, F.A.N., S.B.Z., P.A.N.B., S.N.d.A., I.C.A.R. and R.F.R.C.; Resources, L.R.G.G.; Data curation, F.A.N. and L.R.G.G.; Writing—original draft, F.A.N., P.E.C., S.B.Z., P.A.N.B., S.N.d.A., E.G.d.M., F.A.D.M., M.L.d.S.S. and L.R.G.G.; Writing—review and editing, F.A.N., P.E.C., S.B.Z., P.A.N.B., E.G.d.M., F.A.D.M., M.L.d.S.S. and L.R.G.G.; Visualization, F.A.D.M., M.L.d.S.S. and L.R.G.G.; Supervision, F.A.D.M., M.L.d.S.S. and L.R.G.G.; Project administration, L.R.G.G.; and Funding acquisition, L.R.G.G. All authors have read and agreed to the published version of the manuscript.

Funding

The authors declare that this study received funding from the Coordination for the Improvement of Higher Education Personnel (CAPES) (Grant Code-001) and the National Institute of Science and Technology (INCT) on Soil and Food Security, CNPq grant #406577/2022-6. The funder was not involved in the study design, collection, analysis, interpretation of data, the writing of this article, or the decision to submit it for publication.

Data Availability Statement

The data supporting this study’s findings are available upon request from the corresponding author.

Acknowledgments

The authors are grateful to the Coordination for the Improvement of Higher Education Personnel (CAPES), the National Council for Scientific and Technological Development (CNPq), and the Minas Gerais State Research Foundation (FAPEMIG) for the financial support and scholarships provided to the authors. Special thanks are extended to CNPq grant #406577/2022-6—National Institute of Science and Technology on Soil and Food Security.

Conflicts of Interest

The authors declare no conflicts of interest. The funders had no role in the design of the study, data collection, analysis, interpretation, manuscript writing, or decision to publish the results. The author, Fábio Aurélio Dias Martins, was employed by the Agricultural Research Company of Minas Gerais. The remaining authors declare that the research was conducted without commercial or financial relationships that could be construed as a potential conflict of interest.

References

  1. Nassary, E.K.; Baijukya, F.; Ndakidemi, P.A. Intensification of Common Bean and Maize Production through Rotations to Improve Food Security for Smallholder Farmers. J. Agric. Food Res. 2020, 2, 100040. [Google Scholar] [CrossRef]
  2. CIAT—Centro Internacional de Agricultura Tropical. Beans. Available online: https://ciat.cgiar.org/what-we-do/breeding-better-crops/beans/ (accessed on 21 December 2024).
  3. Torres, A.R.; Brito, B.; Imperial, J.; Palacios, J.M.; Ciampitti, I.A.; Ruiz-Argüeso, T.; Hungria, M. Hydrogen-Uptake Genes Improve Symbiotic Efficiency in Common Beans (Phaseolus vulgaris L.). Antonie Van Leeuwenhoek 2020, 113, 687–696. [Google Scholar] [CrossRef] [PubMed]
  4. Justino, L.F.; Heinemann, A.B.; Matta, D.H.; Stone, L.F.; Gonçalves, P.A.O.; Silva, S.C. Characterization of common bean production regions in Brazil using machine learning techniques. Agric. Syst. 2025, 224, 104237. [Google Scholar] [CrossRef]
  5. Sá, A.G.A.; Moreno, Y.M.F.; Carciofi, B.A.M. Plant Proteins as High-Quality Nutritional Source for Human Diet. Trends Food Sci. Technol. 2020, 97, 170–184. [Google Scholar] [CrossRef]
  6. Grela, E.R.; Samolińska, W.; Kiczorowska, B.; Klebaniuk, R.; Kiczorowski, P. Content of Minerals and Fatty Acids and Their Correlation with Phytochemical Compounds and Antioxidant Activity of Leguminous Seeds. Biol. Trace Elem. Res. 2017, 180, 338–348. [Google Scholar] [CrossRef]
  7. USDA—United States Department of Agriculture (Ed.) Food Data Central; United States Department of Agriculture: Washington, DC, USA, 2019. Available online: https://fdc.nal.usda.gov/ (accessed on 2 February 2024).
  8. Natasha, S.M.; Niazi, N.K.; Khalid, S.; Murtaza, B.; Bibi, I.; Rashid, M.I. A critical review of selenium biogeochemical behavior in soil-plant system with an inference to human health. Environ. Pollut. 2018, 234, 915–934. [Google Scholar] [CrossRef]
  9. Ritchie, H.; Reay, D.S.; Higgins, P. Quantifying, Projecting, and Addressing ‘India’s Hidden Hunger. Front. Sustain. Food Syst. 2018, 2, 11. [Google Scholar] [CrossRef]
  10. Danso, O.P.; Asante-Badu, B.; Zhang, Z.; Song, J.; Wang, Z.; Yin, X.; Zhu, R. Selenium Biofortification: Strategies, Progress and Challenges. Agriculture 2023, 13, 416. [Google Scholar] [CrossRef]
  11. Bela, K.; Horváth, E.; Gallé, Á.; Szabados, L.; Tari, I.; Csiszár, J. Plant Glutathione Peroxidases: Emerging Role of the Antioxidant Enzymes in Plant Development and Stress Responses. J. Plant Physiol. 2015, 176, 192–201. [Google Scholar] [CrossRef] [PubMed]
  12. Wang, M.; Dinh, Q.T.; Qi, M.; Wang, M.; Yang, W.; Zhou, F.; Liang, D. Radicular and foliar uptake, and xylem- and phloem-mediated transport of selenium in maize (Zea mays L.): A comparison of five Se exogenous species. Plant Soil 2020, 446, 111–123. [Google Scholar] [CrossRef]
  13. Rayman, M.P. Selenium and human health. Lancet 2012, 379, 1256–1268. [Google Scholar] [CrossRef]
  14. Adadi, P.; Barakova, N.V.; Muravyov, K.Y.; Krivoshapkina, E.F. Designing Selenium Functional Foods and Beverages: A Review. Food Res. Int. 2019, 120, 708–725. [Google Scholar] [CrossRef]
  15. Zou, C.; Du, Y.; Rashid, A.; Ram, H.; Savasli, E.; Pieterse, P.J.; Ortiz-Monasterio, I.; Yazici, A.; Kaur, C.; Mahmood, K.; et al. Simultaneous biofortification of wheat with zinc, iodine, selenium, and iron through foliar treatment of a micronutrient cocktail in six countries. J. Agric. Food Chem. 2019, 67, 8096–8106. [Google Scholar] [CrossRef]
  16. Yin, H.; Qi, Z.; Li, M.; Ahammed, G.J.; Chu, X.; Zhou, J. Selenium forms and methods of application differentially modulate plant growth, photosynthesis, stress tolerance, selenium content and speciation in Oryza sativa L. Ecotoxicol. Environ. Saf. 2019, 169, 911–917. [Google Scholar] [CrossRef]
  17. Vermeiren, C.; Ceulemans, J.; Thiry, Y.; Smolders, E. Increased soil pH and enhanced microbial activity stimulate the gradual immobilization of selenate added to soils. Soil Biol. Biochem. 2025, 202, 109688. [Google Scholar] [CrossRef]
  18. Gupta, M.; Gupta, S. An Overview of Selenium Uptake, Metabolism, and Toxicity in Plants. Front. Plant Sci. 2017, 7, 2074. [Google Scholar] [CrossRef]
  19. Yuan, Z.; Cai, S.; Yan, C.; Rao, S.; Cheng, S.; Xu, F.; Liu, X. Research Progress on the Physiological Mechanism by Which Selenium Alleviates Heavy Metal Stress in Plants: A Review. Agronomy 2024, 14, 1787. [Google Scholar] [CrossRef]
  20. Silva, M.A.; de Sousa, G.F.; Corguinha, A.P.B.; Lessa, J.H.d.L.; Dinali, G.S.; Oliveira, C.; Lopes, G.; Amaral, D.; Brown, P.; Guilherme, L.R.G. Selenium Biofortification of Soybean Genotypes in a Tropical Soil via Se-Enriched Phosphate Fertilizers. Front. Plant Sci. 2022, 13, 988140. [Google Scholar] [CrossRef] [PubMed]
  21. Nothstein, A.K.; Eiche, E.; Riemann, M.; Nick, P.; Winkel, L.H.E.; Göttlicher, J.; Steininger, R.; Brendel, R.; von Brasch, M.; Konrad, G.; et al. Tracking Se Assimilation and Speciation through the Rice Plant—Nutrient Competition, Toxicity and Distribution. PLoS ONE 2016, 11, e0152081. [Google Scholar] [CrossRef]
  22. Rao, S.; Yu, T.; Cong, X.; Lai, X.; Xiang, J.; Cao, J.; Liao, X.; Gou, Y.; Chao, W.; Xue, H.; et al. Transcriptome, Proteome, and Metabolome Reveal the Mechanism of Tolerance to Selenate Toxicity in Cardamine Violifolia. J. Hazard. Mater. 2021, 406, 124283. [Google Scholar] [CrossRef]
  23. Kolbert, Z.; Molnár, Á.; Feigl, G.; Van Hoewyk, D. Plant Selenium Toxicity: Proteome in the Crosshairs. J. Plant Physiol. 2019, 232, 291–300. [Google Scholar] [CrossRef]
  24. Khanam, A.; Platel, K. Bioaccessibility of Selenium, Selenomethionine and Selenocysteine from Foods and Influence of Heat Processing on the Same. Food Chem. 2016, 194, 1293–1299. [Google Scholar] [CrossRef] [PubMed]
  25. WHO—World Health Organization. Global Health Risks: Mortality and Burden of Disease Attributable to Selected Major Risks; World Health Organization: Geneva, Switzerland, 2009. [Google Scholar]
  26. Wu, Z.; Bañuelos, G.S.; Lin, Z.Q.; Liu, Y.; Yuan, L.; Yin, X.; Li, M. Biofortification and phytoremediation of selenium in China. Front. Plant Sci. 2015, 6, 136. [Google Scholar] [CrossRef] [PubMed]
  27. Carvalho, G.S.; Oliveira, J.R.; Curi, N.; Schulze, D.G.; Marques, J.J. Selenium and Mercury in Brazilian Cerrado Soils and Their Relationships with Physical and Chemical Soil Characteristics. Chemosphere 2019, 218, 412–415. [Google Scholar] [CrossRef]
  28. Leite, G.d.S.d.O.; Nascimento, C.W.A.D.; Nascimento, R.C.; Boechat, C.L.; Morais, P.G.C.; Saraiva, P.C.; Luz, S.L.; da Silva, Y.J.A.B. Geochemical background and geopedological interactions of selenium in soils from Piauí state, Northeastern Brazil. Rev. Bras. Cienc. Solo 2024, 48, e0230110. [Google Scholar] [CrossRef]
  29. Söderlund, M.; Virkanen, J.; Holgersson, S.; Lehto, J. Sorption and speciation of selenium in boreal forest soil. J. Environ. Radioact. 2016, 164, 220–231. [Google Scholar] [CrossRef] [PubMed]
  30. de Araújo, S.N.; Raymundo, J.F.; Costa, F.F.R.; Lessa, J.H.d.L.; Guilherme, L.R.G.; Lopes, G. Selenium Application Methods and Rates for Biofortification of Common Bean and Their Residual Effects on Mombaça Grass. Crop Pasture Sci. 2022, 73, 792–803. [Google Scholar] [CrossRef]
  31. Klikocka, H.; Klikocka, H.; Barczak, B.; Szostak, B.; Kobiałka, A. Effect of Sulphur and Nitrogen Fertilization on the Selenium Content and Uptake by Grain of Spring Wheat. J. Elem. 2017, 22, 985–994. [Google Scholar] [CrossRef]
  32. Kim, H.; Hirai, M.Y.; Hayashi, H.; Chino, M.; Naito, S.; Fujiwara, T. Role of O-Acetyl-l-Serine in the Coordinated Regulation of the Expression of a Soybean Seed Storage-Protein Gene by Sulfur and Nitrogen Nutrition. Planta 1999, 209, 282–289. [Google Scholar] [CrossRef]
  33. Chen, Y.; Liang, D.; Song, W.; Lei, L.; Yu, D.; Miao, S. Effects of Nitrogen Application on Selenium Accumulation, Translocation and Distribution of Winter Wheat at Different Growth Periods. J. Plant Nutr. Fertil. 2016, 22, 395–402. [Google Scholar]
  34. Oumer, A.; Joy, E.J.M.; De Groote, H.; Broadley, M.R.; Gashu, D. Burden of selenium deficiency and cost-effectiveness of selenium agronomic biofortification of staple cereals in Ethiopia. Br. J. Nutr. 2024, 132, 1110–1122. [Google Scholar] [CrossRef] [PubMed]
  35. Boldrin, P.F.; Faquin, V.; Ramos, S.J.; Guilherme, L.R.G.; Bastos, C.E.A.; Carvalho, G.S.; Costa, E.T. de S. Selenato e Selenito na Produção e Biofortificação Agronômica com Selênio em Arroz. Pesqui. Agropecuária Bras. 2012, 47, 831–837. [Google Scholar] [CrossRef]
  36. Reis, H.P.G.; Barcelos, J.P.D.Q.; Furlani, E., Jr.; Santos, E.F.; Silva, V.M.; Moraes, M.F.; Putti, F.F.; Reis, A.R. Agronomic Biofortification of Upland Rice with Selenium and Nitrogen and Its Relation to Grain Quality. J. Cereal Sci. 2018, 79, 508–515. [Google Scholar] [CrossRef]
  37. Lessa, J.H.d.L.; Araujo, A.M.; Ferreira, L.A.; Júnior, E.C.d.S.; de Oliveira, C.; Corguinha, A.P.B.; Martins, F.A.D.; de Carvalho, H.W.P.; Guilherme, L.R.G.; Lopes, G. Agronomic Biofortification of Rice (Oryza sativa L.) with Selenium and Its Effect on Element Distributions in Biofortified Grains. Plant Soil 2019, 444, 331–342. [Google Scholar] [CrossRef]
  38. Félix, M.R.; Zauza, S.B.; Namorato, F.A.; Castro, D.G.; Martins, F.A.D.; de Lima Lessa, J.H.; Guilherme, L.R.G.; Botelho, F.B.S. Biofortification of Upland Rice Using Selenium-Enriched Urea: Evaluation of Potential Genotypes. J. Food Compos. Anal. 2023, 122, 105409. [Google Scholar] [CrossRef]
  39. Ravello, R.A.V.; de Oliveira, C.; Lessa, J.; Boas, L.V.V.; de Castro, E.M.; Guilherme, L.R.G.; Lopes, G. Selenium Application Influenced Selenium Biofortification and Physiological Traits in Water-Deficit Common Bean Plants. Crop Pasture Sci. 2021, 73, 44–55. [Google Scholar] [CrossRef]
  40. Cipriano, P.E.; da Silva, R.F.; de Lima, F.R.D.; de Oliveira, C.; de Lima, A.B.; Celante, G.; Dos Santos, A.A.; Archilha, M.V.L.R.; Pinatto-Botelho, M.F.; Faquin, V.; et al. Selenium Biofortification via Soil and Its Effect on Plant Metabolism and Mineral Content of Sorghum Plants. J. Food Compos. Anal. 2022, 109, 104505. [Google Scholar] [CrossRef]
  41. Cipriano, P.E.; da Silva, R.F.; de Oliveira, C.; de Lima, A.B.; Martins, F.A.D.; Celante, G.; dos Santos, A.A.; Archilha, M.V.L.R.; Pinatto Botelho, M.F.; Faquin, V.; et al. Sodium Selenate, Potassium Hydroxy-Selenide, Acetylselenide and Their Effect on Antioxidant Metabolism and Plant Nutrition and Yield in Sorghum Genotypes. Foods 2023, 12, 2034. [Google Scholar] [CrossRef] [PubMed]
  42. Lara, T.S.; Lessa, J.H.d.L.; de Souza, K.R.D.; Corguinha, A.P.B.; Martins, F.A.D.; Lopes, G.; Guilherme, L.R.G. Selenium Biofortification of Wheat Grain via Foliar Application and Its Effect on Plant Metabolism. J. Food Compos. Anal. 2019, 81, 10–18. [Google Scholar] [CrossRef]
  43. Paciolla, C.; de Leonardis, S.; Dipierro, S. Effects of selenite and selenate on the antioxidant systems in Senecio scandens L. Plant Biosyst. 2011, 145, 253–259. [Google Scholar] [CrossRef]
  44. Dinh, Q.T.; Cui, Z.; Huang, J.; Tran, T.A.T.; Wang, D.; Yang, W.; Zhou, F.; Wang, M.; Yu, D.; Liang, D. Selenium distribution in the Chinese environment and its relationship with human health: A review. Environ. Int. 2018, 112, 294–309. [Google Scholar] [CrossRef]
  45. Siuéia Junior, M.; Silva, D.F.; Cipriano, P.E.; Souza, R.R.; Faquin, V.; Silva, M.L.S.; Guilherme, L.R.G. Residual selenate as selenite in the soil: Effect on the accumulation of selenium, macronutrients, and gas exchange in arugula. Sci. Hortic. 2024, 337, 113569. [Google Scholar] [CrossRef]
  46. Hossain, A.; Skalicky, M.; Brestic, M.; Maitra, S.; Sarkar, S. Selenium biofortification: Roles, mechanisms, responses and prospects. Molecules 2021, 26, 881. [Google Scholar] [CrossRef]
  47. dos Santos, H.G.; Jacomine, P.K.T.; Anjos, L.H.C.D.; de Oliveira, V.A.; Lumbreras, J.F.; Coelho, M.R.; de Almeida, J.A.; de Araujo Filho, J.C.; de Oliveira, J.B.; Cunha, T.J.F. Sistema Brasileiro de Classificação de Solos; Embrapa Solos: Brasilia, Brazil, 2018. [Google Scholar]
  48. IUSS Working Group WRB. World Reference Base for Soil Resources 2014, updated the 2015 international soil classification system for naming soils and creating legends for soil maps. In World Soil Resources Reports No. 106; FAO: Rome, Italy, 2015. [Google Scholar]
  49. Soil Survey Staff. Soil Taxonomy: A Basic System of Soil Classification for Making and Interpreting Soil Surveys, 2nd ed.; Natural Resources Conservation Service, Department of Agriculture: Washington, DA, USA, 1999. [Google Scholar]
  50. Teixeira, P.C.; Donagemma, G.K.; Fontana, A.; Teixeira, W.G. Manual de Métodos de Análise de Solo, 3rd ed.; Embrapa: Pelotas, Brasília, 2017. [Google Scholar]
  51. USEPA—United States Environmental Protection Agengy. Microwave Assisted Acid Digestion of Sediments Sludge, Soils, and Oils. EPA SW 846:3051A; United States Environmental Protection Agengy: Washington, DC, USA, 2007. [Google Scholar]
  52. Malavolta, E. Manual de Química Agrícola: Adubos e Adubação, 3rd ed.; Editora Agronômica Ceres: São Paulo, Brazil, 1981. [Google Scholar]
  53. AOAC—Association of Official Analysis Chemists. Official Methods of Analysis of AOAC International; Association of Official Analysis Chemists International: Washington, DC, USA, 2016. [Google Scholar]
  54. de Carvalho, A.M.X.; Mendes, F.Q.; Mendes, F.Q.; Tavares, L.d.F. SPEED Stat: A Free, Intuitive, and Minimalist Spreadsheet Program for Statistical Analyses of Experiments. Crop Breed. Appl. Biotechnol. 2020, 20, e327420312. [Google Scholar] [CrossRef]
  55. da Cruz Ferreira, R.L.; de Mello Prado, R.; de Souza Junior, J.P.; Gratão, P.L.; Tezotto, T.; Cruz, F.J.R. Oxidative Stress, Nutritional Disorders, and Gas Exchange in Lettuce Plants Subjected to Two Selenium Sources. J. Soil Sci. Plant Nutr. 2020, 20, 1215–1228. [Google Scholar] [CrossRef]
  56. Hawkesford, M.J.; Horst, W.; Kichey, T.; Lambers, H.; Schjoerring, J.; Moller, I.S.; White, P. Functions of Macronutrients. In ‘Marschner’s mineral nutrition of higher plants, 3rd ed.; Marschner, P., Ed.; Academic Press: Amsterdam, The Netherlands, 2012; pp. 135–189. [Google Scholar]
  57. Lee, B.-R.; Zaman, R.; Avice, J.-C.; Ourry, A.; Kim, T.-H. Sulfur Use Efficiency Is a Significant Determinant of Drought Stress Tolerance in Relation to Photosynthetic Activity in Brassica Napus Cultivars. Front. Plant Sci. 2016, 7, 459. [Google Scholar] [CrossRef] [PubMed]
  58. Diao, M.; Ma, L.; Wang, J.; Cui, J.; Fu, A.; Liu, H. Selenium Promotes the Growth and Photosynthesis of Tomato Seedlings Under Salt Stress by Enhancing Chloroplast Antioxidant Defense System. J. Plant Growth Regul. 2014, 33, 671–682. [Google Scholar] [CrossRef]
  59. Liu, H.; Xiao, C.; Qiu, T.; Deng, J.; Cheng, H.; Cong, X.; Cheng, S.; Rao, S.; Zhang, Y. Selenium Regulates Antioxidant, Photosynthesis, and Cell Permeability in Plants under Various Abiotic Stresses: A Review. Plants 2022, 12, 44. [Google Scholar] [CrossRef] [PubMed]
  60. Sager, M. Selenium in Agriculture, Food, and Nutrition. Pure Appl. Chem. 2006, 78, 111–133. [Google Scholar] [CrossRef]
  61. Torralbo, F.; Vicente, R.; Morcuende, R.; González-Murua, C.; Aranjuelo, I. C and N Metabolism in Barley Leaves and Peduncles Modulates Responsiveness to Changing CO2. J. Exp. Bot. 2019, 70, 599–611. [Google Scholar] [CrossRef] [PubMed]
  62. Zhang, M.; Tang, S.; Huang, X.; Zhang, F.; Pang, Y.; Huang, Q.; Yi, Q. Selenium Uptake, Dynamic Changes in Selenium Content and Its Influence on Photosynthesis and Chlorophyll Fluorescence in Rice (Oryza sativa L.). Environ. Exp. Bot. 2014, 107, 39–45. [Google Scholar] [CrossRef]
  63. Treml, V.; Tumajer, J.; Jandová, K.; Oulehle, F.; Rydval, M.; Čada, V.; Treydte, K.; Mašek, J.; Vondrovicová, L.; Lhotáková, Z.; et al. Increasing Water-Use Efficiency Mediates Effects of Atmospheric Carbon, Sulfur, and Nitrogen on Growth Variability of Central European Conifers. Sci. Total Environ. 2022, 838, 156483. [Google Scholar] [CrossRef]
  64. Coppa, E.; Celletti, S.; Sestili, F.; Mimmo, T.; Garcia Molina, M.D.; Cesco, S.; Astolfi, S. Interaction between Sulfate and Selenate in Tetraploid Wheat (Triticum turgidum L.) Genotypes. Int. J. Mol. Sci. 2023, 24, 5443. [Google Scholar] [CrossRef] [PubMed]
  65. White, P.J. Selenium accumulation by plants. Ann. Bot. 2016, 117, 213–235. [Google Scholar] [CrossRef] [PubMed]
  66. Alfthan, G.; Eurola, M.; Ekholm, P.; Venäläinen, E.-R.; Root, T.; Korkalainen, K.; Hartikainen, H.; Salminen, P.; Hietaniemi, V.; Aspila, P.; et al. Effects of nationwide addition of selenium to fertilizers on foods, and animal and human health in Finland: From deficiency to optimal selenium status of the population. J. Trace Elem. Med. Biol. 2015, 31, 142–147. [Google Scholar] [CrossRef] [PubMed]
  67. Khan, Z.; Thounaojam, T.C.; Chowdhury, D.; Upadhyaya, H. The Role of Selenium and Nano Selenium on Physiological Responses in Plant: A Review. Plant Growth Regul. 2023, 100, 409–433. [Google Scholar] [CrossRef]
  68. Premarathna, L.; McLaughlin, M.J.; Kirby, J.K.; Hettiarachchi, G.M.; Stacey, S.; Chittleborough, D.J. Selenate-Enriched Urea Granules Are a Highly Effective Fertilizer for Selenium Biofortification of Paddy Rice Grain. J. Agric. Food Chem. 2012, 60, 6037–6044. [Google Scholar] [CrossRef]
  69. Dai, Y.; Wang, Z.; Li, J.; Xu, Z.; Qian, C.; Xia, X.; Liu, Y.; Feng, Y. Tofu By-Product Soy Whey Substitutes Urea: Reduced Ammonia Volatilization, Enhanced Soil Fertility and Improved Fruit Quality in Cherry Tomato Production. Environ. Res. 2023, 226, 115662. [Google Scholar] [CrossRef]
  70. Drahoňovský, J.; Száková, J.; Mestek, O.; Tremlová, J.; Kaňa, A.; Najmanová, J.; Tlustoš, P. Selenium Uptake, Transformation and Inter-Element Interactions by Selected Wildlife Plant Species after Foliar Selenate Application. Environ. Exp. Bot. 2016, 125, 12–19. [Google Scholar] [CrossRef]
  71. Kushwaha, A.; Goswami, L.; Lee, J.; Sonne, C.; Brown, R.J.C.; Kim, K.-H. Selenium in Soil-Microbe-Plant Systems: Sources, Distribution, Toxicity, Tolerance, and Detoxification. Crit. Rev. Environ. Sci. Technol. 2022, 52, 2383–2420. [Google Scholar] [CrossRef]
Figure 1. Seeds of the carioca genotypes were used: BRS Cometa (A), BRS Estilo (B), BRSMG Madrepérola (C), and Pérola (D).
Agronomy 15 00440 g001
Figure 2. SPAD index (A), ΔF/Fm—maximum quantum efficiency of the photochemical activity of photosystem II (B), A—net assimilation rate, μmol CO2 m−2 s−1 (C); gsw—stomatal conductance to water vapor, mol H2O m−2 s−1 (D); E—transpiration, mol H2O m−2 s−1 (E) and WUE—instantaneous water use efficiency, (μmol CO2/mmol H2O) × 100 (F). The lowercase letter group compares the fertilizer sources in each genotype, and the uppercase letter group compares the genotypes in each fertilizer source by the Scott–Knott test (p  <  0.05). Where: U = urea, U + Se = Se-enriched urea, AS = ammonium sulfate, and AS + Se = Se-enriched ammonium sulfate.
Agronomy 15 00440 g002
Figure 3. Common bean genotypes seed yield (A), selenium (B), and sulfur (C) concentration in seeds of common bean genotypes subjected to sources of top-dressing fertilization. The lowercase letter group compares the fertilizer sources in each genotype, and the uppercase letter group compares the genotypes in each fertilizer source by the Scott–Knott test (p  <  0.05). Where: U = urea, U + Se = Se-enriched urea, AS = ammonium sulfate, and AS + Se = Se-enriched ammonium sulfate.
Agronomy 15 00440 g003
Figure 4. Analysis of centesimal seed composition of common bean genotypes subjected to top-dressing fertilization sources. Crude protein (A); TC (total carbohydrates) (B); ash (C); and lipids (D). The lowercase letter group compares the fertilizer sources in each genotype, and the uppercase letter group compares the genotypes in each fertilizer source by the Scott–Knott test (p  <  0.05). Where: U = urea, U + Se = Se-enriched urea, AS = ammonium sulfate, and AS + Se = Se-enriched ammonium sulfate.
Agronomy 15 00440 g004
Table 1. Description of treatments used in the experiment.
GenotypeAcronymsFertilizer TypeAddition of Selenium
BRS CometaUUrea
BRS CometaU + SeUrea+
BRS CometaASAmmonium sulfate
BRS CometaAS + SeAmmonium sulfate+
BRS CometaControl-
BRS EstiloUUrea
BRS EstiloU + SeUrea+
BRS EstiloASAmmonium sulfate
BRS EstiloAS + SeAmmonium sulfate+
BRS EstiloControl-
BRSMG MadrepérolaUUrea
BRSMG MadrepérolaU + SeUrea+
BRSMG MadrepérolaASAmmonium sulfate
BRSMG MadrepérolaAS + SeAmmonium sulfate+
BRSMG MadrepérolaControl-
PérolaUUrea
PérolaU + SeUrea+
PérolaASAmmonium sulfate
PérolaAS + SeAmmonium sulfate+
PérolaControl-
Table 2. Expected and obtained Se concentration (mg kg−1) in the nitrogen fertilizers studied.
Nitrogen Fertilizers aExpectedObtained b
Urea0.00<DL
Se-enriched urea573.600671.240
Ammonium sulfate0.00<DL
Se-enriched ammonium sulfate260.800332.805
a Sources of nitrogen fertilization were applied as a top dressing. b Determination by graphite furnace atomic absorption spectrometry (GFAAS) and the average of four determinations (n = 4). DL: detection limit.
Disclaimer/Publisher’s Note: The statements, opinions and data contained in all publications are solely those of the individual author(s) and contributor(s) and not of MDPI and/or the editor(s). MDPI and/or the editor(s) disclaim responsibility for any injury to people or property resulting from any ideas, methods, instructions or products referred to in the content.

