Article

Study on the Automatic Selection of Sensitive Hyperspectral Bands for Rice Nitrogen Retrieval Based on a Maximum Inscribed Rectangle

1
School of Information and Communication Engineering, North University of China, Taiyuan 030051, China
2
State Key Laboratory of Efficient Utilization of Arable Land in China, Institute of Agricultural Resources and Regional Planning, Chinese Academy of Agricultural Sciences, Beijing 100081, China
3
Key Laboratory of Agricultural Remote Sensing, Ministry of Agriculture and Rural Affairs, Institute of Agricultural Resources and Regional Planning, Chinese Academy of Agricultural Sciences, Beijing 100081, China
4
Hunan Rice Research Institute, Hunan Academy of Agricultural Sciences, Changsha 410125, China
5
Institute of Agricultural Economics and Regional Planning, Hunan Academy of Agricultural Sciences, Changsha 410125, China
*
Author to whom correspondence should be addressed.
Agronomy 2025, 15(2), 406; https://doi.org/10.3390/agronomy15020406
Submission received: 30 December 2024 / Revised: 1 February 2025 / Accepted: 4 February 2025 / Published: 5 February 2025
(This article belongs to the Section Precision and Digital Agriculture)

Abstract

:
Most existing studies on the optimal bandwidth selection for plant nitrogen are based on the sensitive band center, and determine the optimal bands by manually adjusting the bandwidth, step by step. However, this method has a high level of manual involvement and is time-consuming. This paper focused on rice as the research subject, based on determining the center of the rice plant nitrogen-sensitive bands and the maximum region Ω of the fitted R2 between the narrow-band vegetation indices (N-VIs) and plant nitrogen, a method was proposed to automatically select the optimal bandwidth by constructing inscribed rectangles. UAV hyperspectral images were used to carry out the spatial inversion and precision verification of the rice plant nitrogen, based on the optimal width of sensitive bands. The results revealed that the optimal bandwidths, automatically selected on the basis of N-VIs via the inscribed rectangle method, achieved good results in the remote sensing inversion of plant nitrogen at the rice jointing and flowering stages, with the coefficient of determination (R2) greater than 0.49 to satisfy the requirement of significance (p < 0.05) and the normalized root mean square error (NRMSE) and mean relative error (MRE) of less than 13%. These findings indicate that the method of crop plant nitrogen inversion band center screening and automatic search for the optimal bandwidth in this study has certain feasibility, which provides a new idea for screening the optimal bandwidth on the basis of the sensitive band center and provides technical support for the design of satellite band parameters.

1. Introduction

Nitrogen is one of the main nutritional elements for the growth and development of rice and it directly affects the synthesis of nucleic acids, chlorophyll, and proteins in rice plants, ultimately influencing rice yield and quality [1]. The plant nitrogen content reflects the overall total nitrogen content of rice, is an important indicator for evaluating the nutritional status and quality of rice [2] and is closely related to the crop yield [3,4,5]. Therefore, rapidly and accurately determining the nitrogen content of rice plants is highly important for monitoring rice growth and assessing the nutritional status of rice.
The traditional nitrogen measurement method mainly adopts the manual direct measurement method, and although the obtained data are accurate, it is time-consuming and laborious, and there are problems with human subjective judgment [6,7]. With the introduction of “precision agriculture”, unmanned aerial vehicle (UAV) remote sensing technology has developed rapidly, and is widely used in crop monitoring and nitrogen inversion studies because of its speed and accuracy [8,9,10]. Although multispectral sensors contain multiple bands, the spectral resolution of each band is relatively low, and they cannot provide detailed spectral characteristic information, whereas thermal infrared sensors mainly record the thermal radiation characteristics of crops but cannot obtain information in the visible spectral range [11,12]. Therefore, the amount of spectral information contained in the remote sensing images is relatively small, and it is difficult to construct multiple vegetation indices to accurately monitor the nitrogen content of crops, resulting in the limited accuracy of established models. In contrast, hyperspectral images can solve the above-mentioned problems. The large number of bands in hyperspectral imagery can be used to obtain more crop spectral information and construct diverse vegetation indices, which have been widely used in crop nitrogen inversion studies [13,14,15].
Owing to the large number of hyperspectral data bands, similarities between bands can occur, resulting in redundant data information [16,17,18]. Common sensitive band screening methods in hyperspectral technology-based inversion studies of rice nitrogen content include sequence projection algorithm (SPA) [19], principal component analysis (PCA) [20], Pearson correlation analysis [21,22,23], autoencoder (AE) [24], Gaussian regression process [25], partial least squares (PLSR) [26], XGBoost [27], machine learning [28], deep learning [29,30], and so on. These algorithms usually focus on screening independent sensitive bands. However, factors such as crop varieties, different fertility periods, and environmental changes may lead to a shift in band characteristics, which in turn affects the inversion accuracy. To solve this problem, many researchers have started to focus on the study of continuous band selection methods. Different from the independent band selection methods, continuous band screening considers the correlation between bands, which can better capture the trend of spectral information, and thus improve the inversion accuracy. At present, most of the studies on nitrogen continuous band screening adopt the method of manually expanding the spectral bandwidth to explore the influence of different sensitive band centers and widths on the accuracy of the vegetation index and the nitrogen content inversion, so as to efficiently screen out the optimal sensitive bands and widths, realize the screening of nitrogen-sensitive continuous bands, and improve the accuracy of nitrogen inversion models. In addition, the existing studies on manual continuous band screening mainly focus on wheat, corn, and other crops, while the relevant studies on rice are relatively scarce. Yao et al. [31] established and compared the leaf nitrogen accumulation (LNA) estimation model for winter wheat at different bandwidths by manually expanding the bandwidth of the narrowband vegetation index to determine the optimal bandwidth. Wang et al. [32] determined the optimal bandwidth by analyzing the variation characteristics of the coefficient of determination (R2) between three-band vegetation indices and the leaf nitrogen content (LNC), with respect to the bandwidth. Hasituya et al. [33] focused on determining the center of nitrogen-sensitive bands for maize and gradually, manually expanded the bandwidth to study the predictive accuracy of the normalized difference spectral index (NDSI) and the ratio spectral index (RSI) for the total nitrogen yield of maize, to determine the optimal bandwidth. Liang L. et al. [34] explored the change trend of the determination coefficient R2 of LNC and the spectral indices constructed with different bandwidths. The LNC estimation ability decreased rapidly when the bandwidth exceeded 30 nm, which effectively selected the best bandwidth for the design of agricultural remote sensing sensors. Other researchers [35] have determined the optimal bandwidth by analyzing the accuracy of fixed hyperspectral narrowband and broadband models for predicting potato nitrogen concentrations. Most of the above manual screening methods for continuous sensitive bands are based on determining the center of the nitrogen sensitive band, and the optimal bandwidth is determined by manually expanding the widths of the two bands at the same time, which is a manual search process, with a high degree of manual involvement, and it is time-consuming and labor-intensive. To address the problems mentioned above, this paper proposes a method to automatically determine the optimal bandwidth, based on an inscribed rectangle, which reduces the redundant band expansion process and reduces the time and workload of nitrogen inversion modeling, using rice as the research object.
Owing to the influence of the plant itself and the background environment, the hyperspectral bands sensitive to crop nitrogen often shift. Thus, it is difficult to realize the quantitative inversion of crop nitrogen with the information of a single band, so the current crop nitrogen inversion relies mainly on various vegetation indices, that are closely related to the growth of the crop, to construct a prediction model of crop nitrogen [36,37]. Among them, the normalized difference vegetation index (NDVI), ratio vegetation index (RVI), and difference vegetation index (DVI) are commonly used indices, and there are significant correlations between them and crop nitrogen. Jiang et al. [38] showed that the NDVI can be used to assess nitrogen use efficiency (NUE) in a timely manner. Liu et al. and Yao et al. [39,40] reported that the RVI significantly correlated with the nitrogen content. Zhang et al. [41] constructed a model to estimate the nitrogen content of winter wheat leaves via the NDVI (R578, R490) and DVI (R839, R778), and the model performed well. Jiang et al. [42] noted that the DVI highly correlated with nitrogen accumulation in winter wheat leaves, at all growth stages. However, given the differences in the screening results of the optimal vegetation indices for nitrogen inversion, the nitrogen inversion accuracies of the three vegetation indices need to be further assessed.
In summary, this study took rice plant nitrogen as the research object, combined theoretical modeling and regional observations, and proposed a method for the automatic screening of bandwidths via a maximum inscribed rectangle on the basis of an analysis of the correlation between different narrow-band vegetation indices and measured plant nitrogen to determine the optimal range of bands for rice plant nitrogen inversion. Compared with the previous studies, the present method significantly improves the screening efficiency, and saves time and effort in nitrogen inversion modeling by automating the screening of bandwidths and reducing manual intervention and redundant band expansion processes. Finally, remote sensing inversion studies on the early identification of rice plant nitrogen via the preferred narrowband vegetation indices and the related spectral bands can provide new ideas for high-precision rice plant nitrogen estimation.

2. Materials and Methods

2.1. Materials

2.1.1. Study Area

The research area was established at the Rice Experimental Base in Gaoqiao Town, Changsha County, Hunan Provincial Academy of Agricultural Sciences. It is situated at 28°35′ north latitude and 113°14′ east longitude, with an elevation of 57 m, and the cropping system was biannual. Two rice varieties were used for testing: the hybrid rice variety Zhongzao 39 and the conventional rice variety Xiangzaoxian 24. Each rice variety was divided into 20 plots, for a total of 40 plots, and each plot covered an area of 15 square meters. Among them, six nitrogen application levels were set for each variety plot—0, 3, 6, 9, 12, and 15 kg—and the base fertilizer and additional fertilizer were applied at a ratio of 6:4, with four replications. The nitrogen application levels were set randomly. The specific planting environment of the rice is shown in Table 1, and the distribution of the test plots and the nitrogen application levels are shown in Figure 1.

2.1.2. Hyperspectral Remote Sensing Images

The growth stages of rice include the vegetative growth stage and the reproductive growth stage, as well as the two key stages: the jointing stage and the flowering stage [43]. The jointing stage marks the rapid growth stage of rice, and the demand for nitrogen is greater; however, the flowering stage is the key turning point for rice to enter the reproductive growth stage, and an adequate or inadequate nitrogen supply affects the later grain formation and yield. Rice plant nitrogen inversion studies at the jointing stage and the flowering stage can help gain a deeper understanding of the nitrogen utilization law of rice and provide a scientific basis for rational fertilization, thereby improving crop yield and quality [44]. In this study, UAV hyperspectral remote sensing data were acquired via a DJI RuFeng WIND4 UAV, equipped with an AisaKESTREL 10 hyperspectral imager, during two critical fertility periods of rice growth: the jointing stage (7 June 2021) and the flowering stage (24 June 2021). AisaKESTREL 10 captures spectral bands ranging from 395 nm to 1001 nm with a spectral resolution of 3 nm and outstanding spatial resolution of 2040 pixels. To obtain stable hyperspectral remote sensing data of the rice, the weather was clear, windless, or breezy at the time of data collection, and the flight altitude of the UAV was fixed at 40 m.
The preprocessing of hyperspectral remote sensing data mainly includes the extraction of pure rice pixels, average spectral curve calculations, and spectral curve smoothing. First, ENVI 5.3 software was used to perform radiometric calibration, geometric correction, atmospheric correction, image stitching and relative calibration on the remote sensing images for each period. The normalized difference vegetation index (NDVI) threshold method was subsequently employed to extract the pure rice pixels, and the average spectral curve of the pure rice pixels for each plot was calculated. Finally, using MATLAB 2019 software, the Savitzky–Golay smoothing filter and interpolation smoothing method were applied to filter and denoise the average spectral curve of each plot to obtain the hyperspectral curve for each plot of rice.

2.1.3. Measurement of Rice Plant Nitrogen Content

While the hyperspectral remote sensing data of the rice were captured, simultaneous ground sample collection was conducted to measure the rice plant nitrogen content. As the rice plants grew, some samples were lost, resulting in a total of 77 samples used for plant nitrogen content determination, with 40 samples collected during the jointing stage and 37 samples collected during the flowering stage. Samples of 3 × 3 rice plants were collected from each plot, and the samples were placed in storage bags and returned to the laboratory. The rice samples from each plot were placed into an oven, and the rice plants were subjected to 105 °C for 3 h to stop metabolic activity and dried at 70 °C until the mass was constant. After being weighed, the rice plants were crushed, and the rice plant nitrogen content (g/kg) was determined via the traditional Kjeldahl method. Finally, ENVI 5.3 software was used to calculate the number of pixels corresponding to the 3 × 3 rice samples in the remote sensing images. Formula (1) was then used to convert the measured ground plant nitrogen content to the corresponding hyperspectral remote sensing pixels:
P = M N
where P represents the measured plant nitrogen data for each pixel, M represents the measured plant nitrogen data on the ground in the 3 × 3 samples, and N represents the total number of pixels in the 3 × 3 samples.
During the growth and development of rice, some plants may exhibit poor growth or even die due to various factors, such as pests, environmental stress, or nutrient deficiencies. To improve the accuracy and reliability of the data, it is necessary to handle these outliers. Therefore, in this work, the 77 sets of measured data obtained in the experiment were processed to remove the outliers via the method of the mean plus two times the standard deviation. Simultaneously, the Monte Carlo algorithm was used to eliminate abnormal hyperspectral data effectively. After removing the outliers, the measured data and hyperspectral data with the outliers removed were screened by linear model residuals, and the data with large differences between the spectrum and the measured values were eliminated. Finally, 35 sets of experimental data were obtained at each jointing stage and the flowering stage, among which 25 measured data points were used for modeling and 10 measured data points were used for accuracy verification.

2.2. Methods

In this study, we propose a method to automatically find the optimal bandwidth by constructing a maximum inner rectangle in a region with a high fitting accuracy R2 between different narrow-band vegetation indices and measured values of rice plant nitrogen. The specific technical flowchart is shown in Figure 2.

2.2.1. Vegetation Index Selection

Rice leaves exhibit different reflectance characteristics at different wavelengths of light. The red light band (620–780 nm) is absorbed by chlorophyll for photosynthesis, resulting in lower reflectance, especially near 680 nm. In contrast, the near-infrared band (780–1100 nm) is mainly scattered and reflected through cell structures, leading to higher reflectance [25,45]. Most studies have constructed various traditional vegetation indices, such as the normalized difference vegetation index (NDVI), difference vegetation index (DVI), and ratio vegetation index (RVI), on the basis of the reflectance differences between red and near-infrared light. Many studies have shown that these vegetation indices are significantly correlated with the nitrogen content [38,39,40,41]. Therefore, this study utilized the NDVI, DVI, and RVI to investigate the inversion of rice plant nitrogen content in the early stage. The specific calculation formulas are as follows:
N D V I = ( R N I R R R E D ) / ( R N I R + R R E D )
D V I = R N I R R R E D
R V I = R N I R / R R E D
where RNIR represents the near-infrared spectral reflectance and RRED represents the red spectral reflectance.
The vegetation indices mentioned above are all calculated on the basis of the reflectances of the near-infrared and red spectral bands, with a relatively limited range of band combinations. However, hyperspectral data provide a wealth of band information. To fully exploit hyperspectral data, this study combines the hyperspectral reflectance data of rice canopies from any two bands to calculate the narrowband normalized difference vegetation index (N-NDVI), narrowband difference vegetation index (N-DVI) and narrowband ratio vegetation index (N-RVI). The specific calculation formulas are as follows:
N-NDVI i j = ( R i R j ) / ( R i + R j )
N-DVI i j = R i R j
N-RVI i j = R i / R j
where i and j are any two hyperspectral bands and Ri and Rj are the hyperspectral reflectances corresponding to the i and j bands, respectively.

2.2.2. Determination of the Optimal Bandwidth for Rice Plant Nitrogen

The screening of hyperspectral sensitive bands for crops and the determination of the optimal bandwidths are highly important for accurately estimating crop nitrogen and guiding the design of satellite sensor parameters. First, a linear model between the narrow-band vegetation index and the measured plant nitrogen content of rice was established. Then, the fitting accuracy R2 of each narrow-band vegetation index to the measured plant nitrogen of rice was plotted and analyzed, and the centers of the bands that are sensitive to the plant nitrogen of crops were obtained by determining the region of the extreme value of R2 and the center of gravity of the region of the extreme value. On this basis, along a given direction, starting point, and specified step, the intersection of the horizontal line and the vertical line at each step, within the maximum value region, can be determined, and an inscribed rectangle can be constructed until it intersects with the maximum value region, effectively determining the optimal bandwidth. This method ensures that the sensitivity of the bands in the selected band range is guaranteed while avoiding the inclusion of irrelevant or unnecessary bands and realizing the selection of the optimal band range. This approach automatically searches for the optimal bandwidth, avoids blind searching of the entire area, saves computational resources and time, and improves the accuracy and effectiveness of monitoring rice plant nitrogen content. The specific steps for automatically selecting the optimal bandwidth are as follows:
(1) Based on Formula (8), a linear fitting model between the narrow-band vegetation index (N-VI) and the measured nitrogen content of rice plants was established. The coefficient of determination R2 was analyzed to determine the spectral band range with the strongest correlation between the two, and the point of maximum R2 within that range was identified. Next, we traverse all the points within the 8 neighborhoods of that point that satisfy the threshold condition and the set of these points as the region Ω with the maximum R2 values is designated. Finally, the center of gravity for each region with maximum R2 values is calculated as the sensitive band center within that region via Formula (9) [46]:
y = a x + b
where x is the N-NDVI, N-DVI, or N-RVI; y is the aboveground rice plant nitrogen, g/kg; a is the primary term coefficient; and b is the constant term coefficient.
u ¯ = ( u , v ) Ω u f ( u , v ) ( u , v ) Ω f ( u , v ) v ¯ = ( u , v ) Ω v f ( u , v ) ( u , v ) Ω f ( u , v )
where f(u,v) is the value of R2 at band coordinates (u, v); Ω is the region of maximum values; and ( u ¯ , v ¯ ) represents the sensitive band center coordinates.
(2) Based on the Determination of the maximum value region Ω, the coordinates of all boundary points are extracted, a small threshold value θ is set, and each boundary point that satisfies the conditions in Formula (10) is traversed, ensuring that the selected boundary points are closest to the target point. Finally, the coordinates of the two intersection points of the horizontal line and the vertical line with the boundary are determined.
( x 0 , y 0 ) = Ω ( m , l ) l v ¯ < θ ( x 1 , y 1 ) = Ω ( m , l ) m u ¯ < θ
where Ω(m,l) represents the coordinates of the boundary points of the maximum value region Ω; θ represents the threshold; (x0,y0) represents the coordinates of the intersection of the horizontal line and the boundary of the maximum value; and (x1, y1) represents the coordinates of the intersection of the vertical line and the boundary of the maximum value.
(3) According to Formula (11), the calculated coordinates (x2, y2) serve as the starting point. They are extended step by step along the horizontal and vertical directions with the minimum resolution as the step size until the intersections of both the horizontal and vertical lines exceed the specified boundary contour. On the basis of Formula (12), all the coordinates of the intersection points satisfying the discriminant conditions under the specified step size can be calculated:
x 2 = min ( x 0 ) y 2 = min ( y 1 )
x 3 = u ¯ + k d x | x 2 + k d x < u ¯ y 2 + k d y < v ¯ y 3 = v ¯ + k d y | x 2 + k d x < u ¯ y 2 + k d y < v ¯
where k is the intersection variable; dx = dy is the step size; x2 is the minimum value of x0; y2 is the minimum value of y1;and (x3, y3) represents the coordinates of the intersection for each specified step in the region of the maximum value.
(4) According to Formula (13), the half-diagonal length of the square is calculated with the center of the sensitive band as the center, the position and size of the inscribed rectangle is determined, the construction of the inscribed rectangle is completed, and all points are traversed within the inscribed rectangle to check if they are inside the boundary contour of the maximum value. If inside the boundary contour, the above steps are repeated. When the inscribed rectangle just exceeds the boundary of the maximum value region Ω, the optimal bandwidth is calculated via Formula (14). At this point, the corresponding rectangular width represents the optimal bandwidth. The specific band extension of the inscribed rectangle is shown in Figure 3.
d = 2 ( x 3 u ¯ ) 2 + ( y 3 v ¯ ) 2
x w i d = x 3 u ¯ y w i d = y 3 v ¯
where x3 and y3 are the coordinates of the intersection point of the specified step; and xwid and ywid are the optimal bandwidths.

2.2.3. Evaluating the Accuracy of Rice Plant Nitrogen Estimation Models

In this study, 35 rice UAV hyperspectral data and rice-measured plant nitrogen data were obtained at the jointing stage and flowering stage, respectively. In the process of determining the nitrogen-sensitive band center and selecting the optimal bandwidth of rice plants, a linear fitting model was established by using 25 sample data points at the jointing stage and the flowering stage, and the remaining 10 sample data points were used for accuracy verification.
The coefficient of determination (R2), normalized root mean square error (NRMSE), and mean relative error (MRE) were used to evaluate the model’s accuracy. The closer R2 is to 1, the smaller the NRMSE and MRE values are, indicating a better fit between the predicted and actual values, thus leading to more accurate predictions. When the NRMSE and MRE are both less than 10%, the model accuracy is considered excellent; when the NRMSE and MRE are between 10% and 20%, the model accuracy is deemed good; when the NRMSE and MRE are between 20% and 30%, the model accuracy is rated as moderate; and if the NRMSE and MRE are both greater than 30%, the model accuracy is classified as poor [46]. Among the evaluation criteria, priority is given to the magnitude of the NRMSE. The calculation formulas for R2, NRMSE, and MRE are as follows:
R 2 = i = 1 n ( o i o ¯ ) ( p i p ¯ ) i = 1 n ( o i o ¯ ) 2 i = n n ( p i p ¯ ) 2 2
NRMSE = i = 1 n ( o i p i ) 2 n o ¯ × 100 %
MRE = 1 n i = 1 n p i o i o i × 100 %
where oi is the measured rice plant nitrogen, g/kg; pi is the predicted rice plant nitrogen, g/kg; o ¯ and p ¯ are the mean values of oi and pi, respectively, g/kg; and n is the sample number.

3. Results

3.1. Narrowband Vegetation Index Calculations

In this study, on the basis of the preprocessing of unmanned aerial vehicle hyperspectral data, MATLAB 2019 software was used to calculate the N-NDVI, N-DVI, and N-RVI formed by any two bands during the rice jointing and flowering stages according to (5) to (7). Two-dimensional distribution plots of the N-NDVI, N-DVI, and N-RVI were subsequently generated. The calculation results of different narrowband vegetation indices during the rice jointing and flowering stages for a single rice sample plot are shown in Figure 4. Within the hyperspectral range of 395 to 1001 nm, there are a total of 178×178 combinations of narrowband vegetation indices formed by any two wavelengths (λ1 and λ2). The graph clearly shows that the values of the N-NDVI and N-DVI exhibit an axisymmetric distribution along the line connecting points (395, 395) and (1001, 1001). The red sections on the upper left side represent positive values, whereas the blue sections on the lower right side represent negative values; only one side needs to be analyzed. The N-RVI has a different calculation formula than the other narrow-band vegetation indices do, and its values are only positive. Therefore, this study takes the positive red part of the upper left side as an example for analysis.
The N-NDVI showed three distinct areas of change. The N-NDVI values are significantly greater in the range of 395 to 720 nm on the horizontal axis and 680 to 1001 nm on the vertical axis. In this area, during the jointing stage the N-NDVI ranged from 0.48 to 0.80, with an average of 0.71, and during the flowering stage it ranged from 0.53 to 0.87, with an average of 0.80. In the ranges of 395 to 510 nm on the horizontal axis and 520 to 680 nm on the vertical axis, there was a slight variation in the N-NDVI. During the jointing stage, the N-NDVI ranged from 0.02 to 0.33, with an average of 0.21, and during the flowering stage, it ranged from 0.01 to 0.36, with an average of 0.20. Significant changes in the N-NDVI were observed in the range of 520 to 580 nm on the horizontal axis and 640 to 690 nm on the vertical axis. During the jointing stage, the N-NDVI ranged from −0.22 to −0.18, with an average of −0.16, and during the flowering stage, it ranged from −0.30 to −0.11, with an average of −0.22. The N-DVI shows notable variations in the range of 395 to 720 nm on the horizontal axis and 710 to 1001 nm on the vertical axis. In this area, during the jointing stage, the N-DVI ranged from 0.07 to 0.30, with an average of 0.26, and during the flowering stage, it ranged from 0.10 to 0.48, with an average of 0.43. Areas with larger N-RVI values are distributed mainly in the range of 395 to 510 nm on the horizontal axis and 740 to 1001 nm on the vertical axis. During the jointing stage, the N-RVI ranged from 6.30 to 8.85, with an average of 7.95, and during the flowering stage, it ranged from 8.70 to 13.86, with an average of 12.40. In contrast, the N-RVI values in the range of 610 to 690 nm on the horizontal axis and 730 to 1001 nm on the vertical axis are relatively small and show significant variations. During the jointing stage, the N-RVI ranged from 4.05 to 7.11, with an average of 5.92, and during the flowering stage, it ranged from 5.44 to 12.14, with an average of 9.08. The specific statistical data for each N-VI regarding the distinct bands of change, maximum values, minimum values, and averages are shown in Table 2.

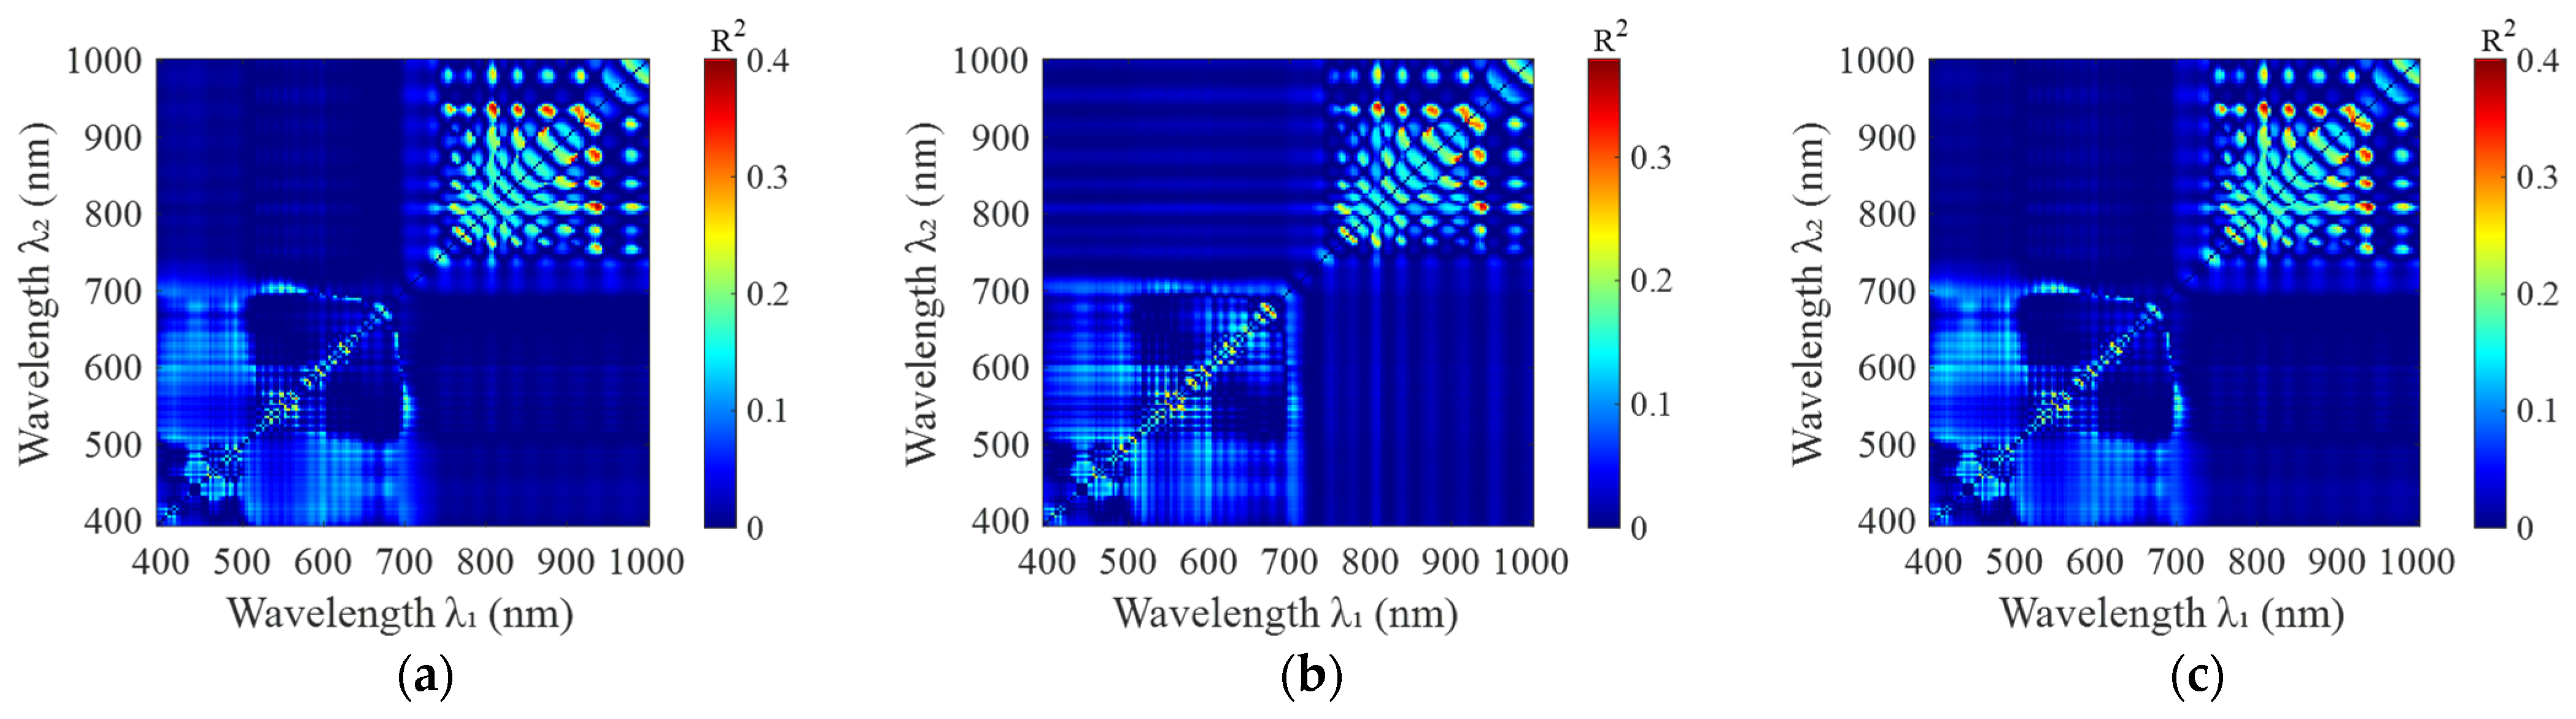
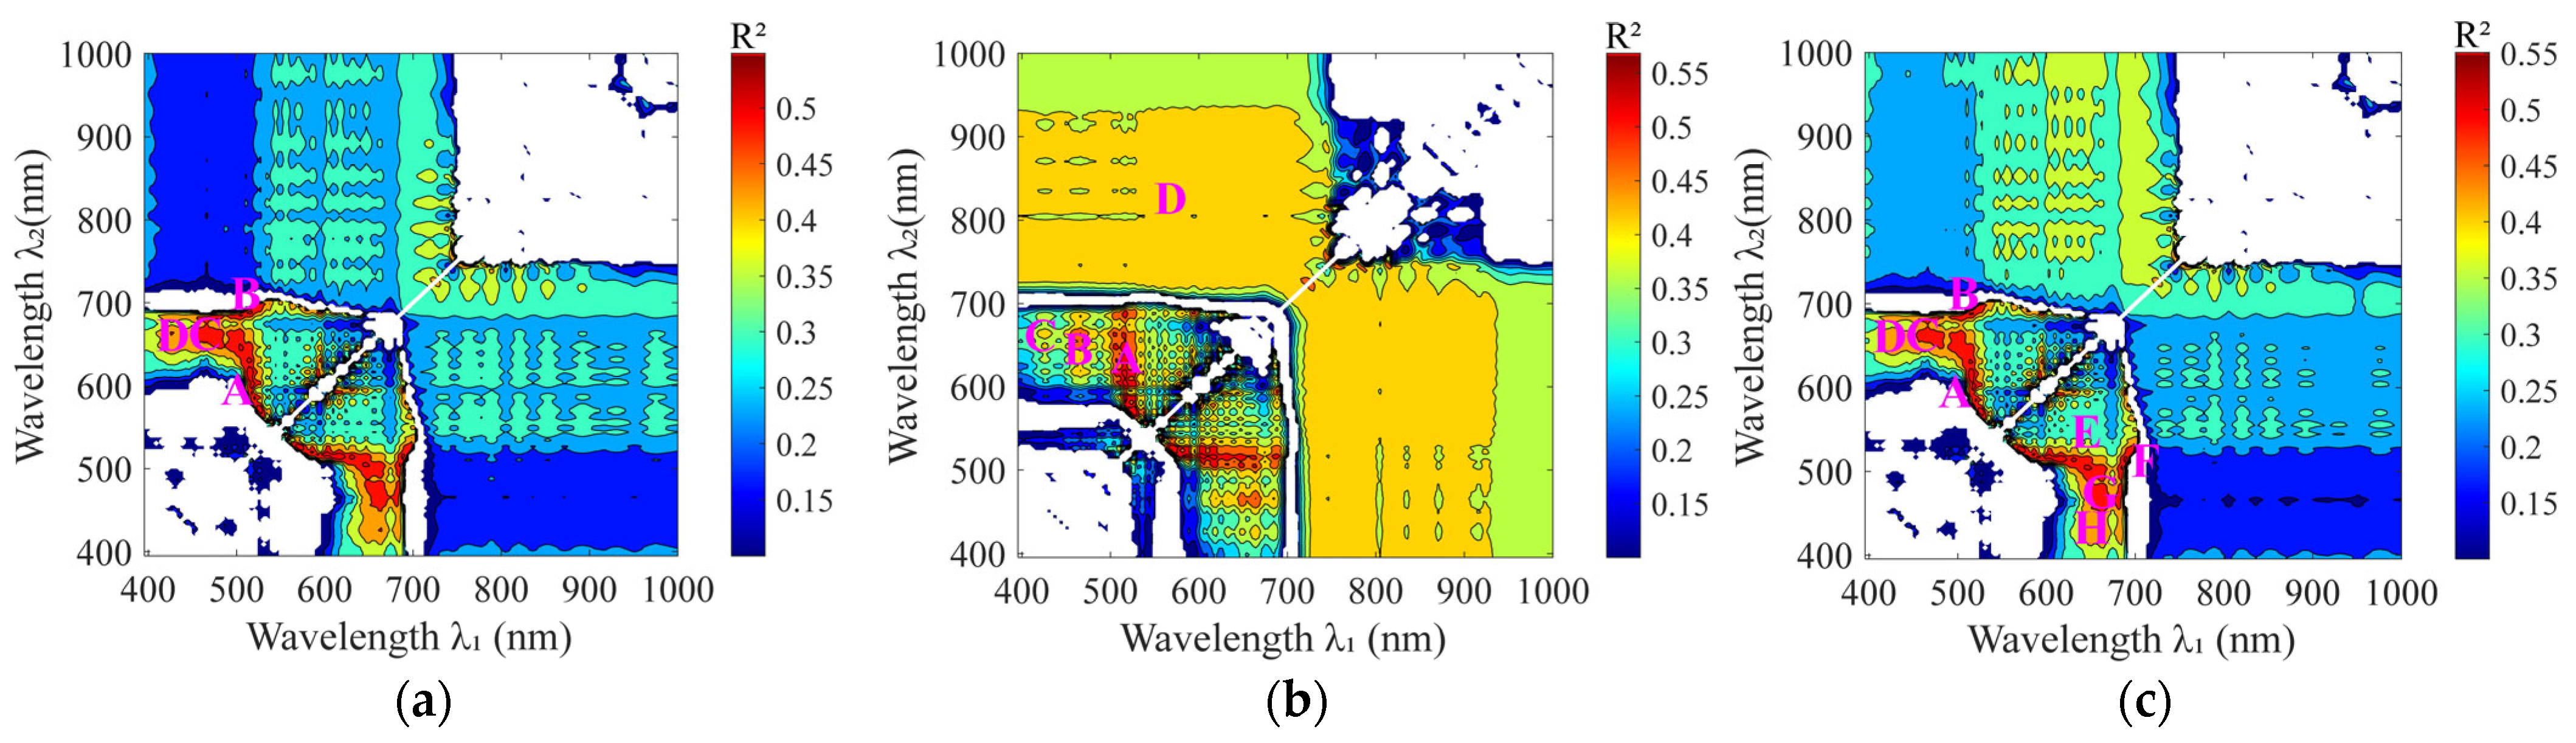
3.2. Determination of Rice Plant Nitrogen-Sensitive Centers

This study analyzed the fitting accuracy between multiple narrowband vegetation indices and the measured rice plant nitrogen content to conduct a subsequent study on the centers of rice plant nitrogen-sensitive spectral bands. Using MATLAB software, 25 measured plant nitrogen data at each stage of jointing and flowering were linearly modeled with 178 × 178 N-NDVI, N-DVI, and N-RVI data, and ultimately, the fitted R2 two-dimensional graphs between each N-VI and the measured plant nitrogen were obtained for each of the two fertility stages. As shown in Figure 5 and Figure 6, each pair of wavelengths (λ1 and λ2) corresponds to one R2 value, resulting in a total of 178 × 178 R2 two-dimensional spatial points. In addition to the N-RVI, the coefficient of determination R2 values of the other N-VIs all exhibited an axisymmetric distribution, and the correlation regions between different N-VIs and rice plant nitrogen contents at different growth stages are also different. It is evident that during the jointing stage, the correlation between narrow-band vegetation indices and rice plant nitrogen content was greater than that during the flowering stage. In addition, spectral region information with a strong correlation between N-VIs and the measured plant nitrogen content can be obtained through an R2 two-dimensional map, which provides a basis for selecting the central wavelength of sensitive bands in the subsequent stage.
According to the significance test table of correlation coefficients, when the number of samples was 25, the confidence interval was 90%, R2 > 0.10, and N-VIs were significantly correlated with rice plant nitrogen. To ensure the accuracy and reliability of sensitive band center selection, this study selected significant correlation criteria with R2 > 0.10 during both growth stages for sensitive band center and sensitive band screening. In the fitting R2 two-dimensional graph, we searched for the maximum value points and traversed all points within the eight neighborhoods of these maximum value points that satisfied R2 > 0.10. The collection of these points was marked as the local maximum region Ω. The R2 > 0.10 distribution area is shown as a gradient of R2 = 0.05. Since the area satisfying R2 > 0.10 at the flowering stage is small, the display effect is not good, and this paper displays the result of R2 > 0.05 at the flowering stage, as shown in Figure 7 and Figure 8.
The correlation areas between N-VIs and rice plant nitrogen content vary at different growth stages. To improve the accuracy of the inversion of plant nitrogen via the selected sensitive band centers and bandwidths, this study selected high-fit precision R2 two-dimensional areas on the basis of the characteristics of the fitted R2 two-dimensional graphs of N-VIs and plant nitrogen content at each growth stage. Specifically, the sensitive band centers and widths were optimally selected in the jointing and flowering stages by choosing R2 two-dimensional areas with R2≥ 0.4 and R2 ≥ 0.25, respectively, in the R2 two-dimensional graphs fitting the rice plant nitrogen content with the N-VIs. Areas A~D in Figure 7a,b and areas A~H in Figure 7c represent the local maximum value regions Ω satisfying R2 ≥ 0.4 at the jointing stage; areas A~D in Figure 8a,b and areas A~H in Figure 8c represent the local maximum value regions Ω satisfying R2 ≥ 0.25 at the flowering stage.
After each maximum value region Ω of R2 is determined, the centroid of gravity of each region Ω is calculated as the center of the sensitive band for that region via (9). The sensitive band centers of A~D in Figure 7a are 510.32/623.00 nm, 513.72/688.19 nm, 469.60/660.72 nm, and 483.16/650.43 nm, respectively. The sensitive band centers of A~D in Figure 7b are 517.11/633.28 nm, 466.22/653.86 nm, 425.70/664.15 nm, and 575.09/818.77 nm, respectively. The sensitive band centers of A to H in Figure 7c are 510.32/623.00 nm, 513.72/688.19 nm, 469.60/660.72 nm, 483.16/650.43 nm, 623.00/510.32 nm, 688.19/513.72 nm, 660.72/469.60 nm and 650.43/483.16 nm, respectively. The sensitive band centers of A~D in Figure 8a,b are 914.77/931.87 nm, 877.11/935.28 nm, 839.38/935.28 nm, and 808.47/935.28 nm, respectively. The sensitive band centers of A~H in Figure 8c are 914.77/931.87 nm, 877.11/935.28 nm, 889.38/935.28 nm, 808.47/935.28 nm, 931.87/914.77 nm, 935.28/877.11 nm, 935.28/839.38 nm, and 935.28/808.47 nm, respectively, which shows that the combinations of sensitive band centers of the different N-VIs are highly consistent in flushes during the flowering period.

3.3. Selection of the Optimal Bandwidth for Rice Plant Nitrogen

By determining the maximum value region Ω of the fitted R2 between the narrow-band vegetation index and the measured plant nitrogen data, and the sensitive band center, along a given direction, starting point, and specified step, the intersection of the horizontal line and vertical line at each step within the maximum value region can be determined, and an inscribed rectangle can be constructed until it intersects with the maximum value region, effectively determining the optimal bandwidth. The specific optimal bandwidth screening results are shown in Table 3.
At the same time, the mean N-VIs within the inscribed rectangle at each optimal bandwidth were calculated and fitted to the measured plant nitrogen data of rice, and the accuracy of the corresponding plant nitrogen prediction models was evaluated by modeling data to better illustrate the selection of optimal bandwidths. To better verify that the bandwidth is optimal, this study evaluates the accuracy of the optimal bandwidth one step inward and one step outward. Due to space limitations, this study analyzes the results of the optimal bandwidth of the N-DVI-sensitive centers in two growth periods, as shown in Table 4.
As shown in Table 4, the coefficient of determination R2 of the linear fitting model between the mean N-DVI values, corresponding to the bandwidths obtained based on the optimal bandwidths one step further outward and rice plant nitrogen, decreased significantly, the NRMSE and MRE increased significantly, the error increased, and it was more pronounced in the flowering stage. The main reason was that the N-DVI values corresponding to most sensitive band centers had the strongest correlation with rice plant nitrogen, and the correlation gradually weakened with the increasing bandwidth. The method proposed in this study for screening the optimal bandwidth by the inscribed rectangle is using the bandwidth when the internal connecting rectangle exactly intersects with the region with the greatest value of R2, Ω. If it continues to be expanded, the R2 in the region of the inscribed rectangle decreases, the correlation coefficient between the N-DVI and rice plant nitrogen, corresponding to the width of its bandwidth, also decreases rapidly, and the error increases rapidly. Therefore, in this study, the optimal bandwidth, selected automatically by constructing the inscribed rectangle, is the best. When the bandwidth increases, the error increases significantly. The same is true for other N-VIs.

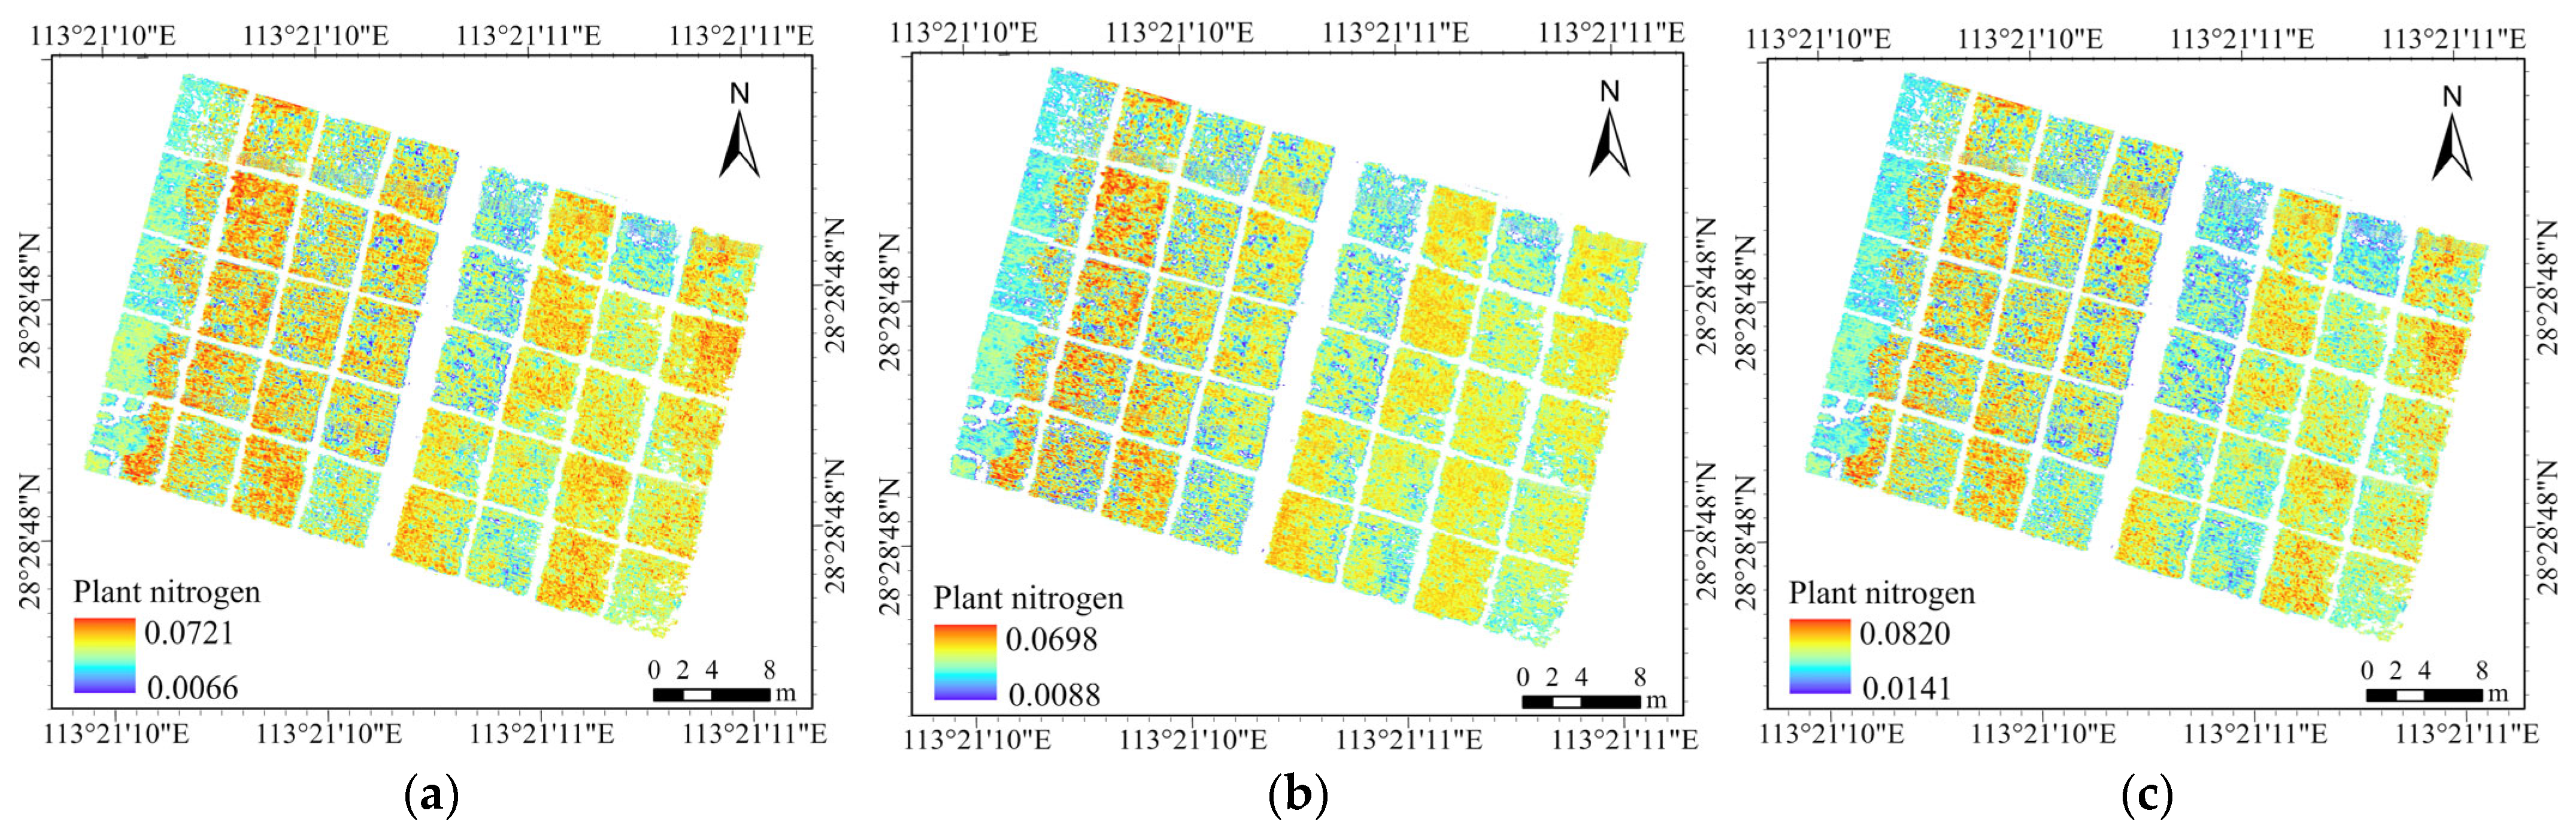
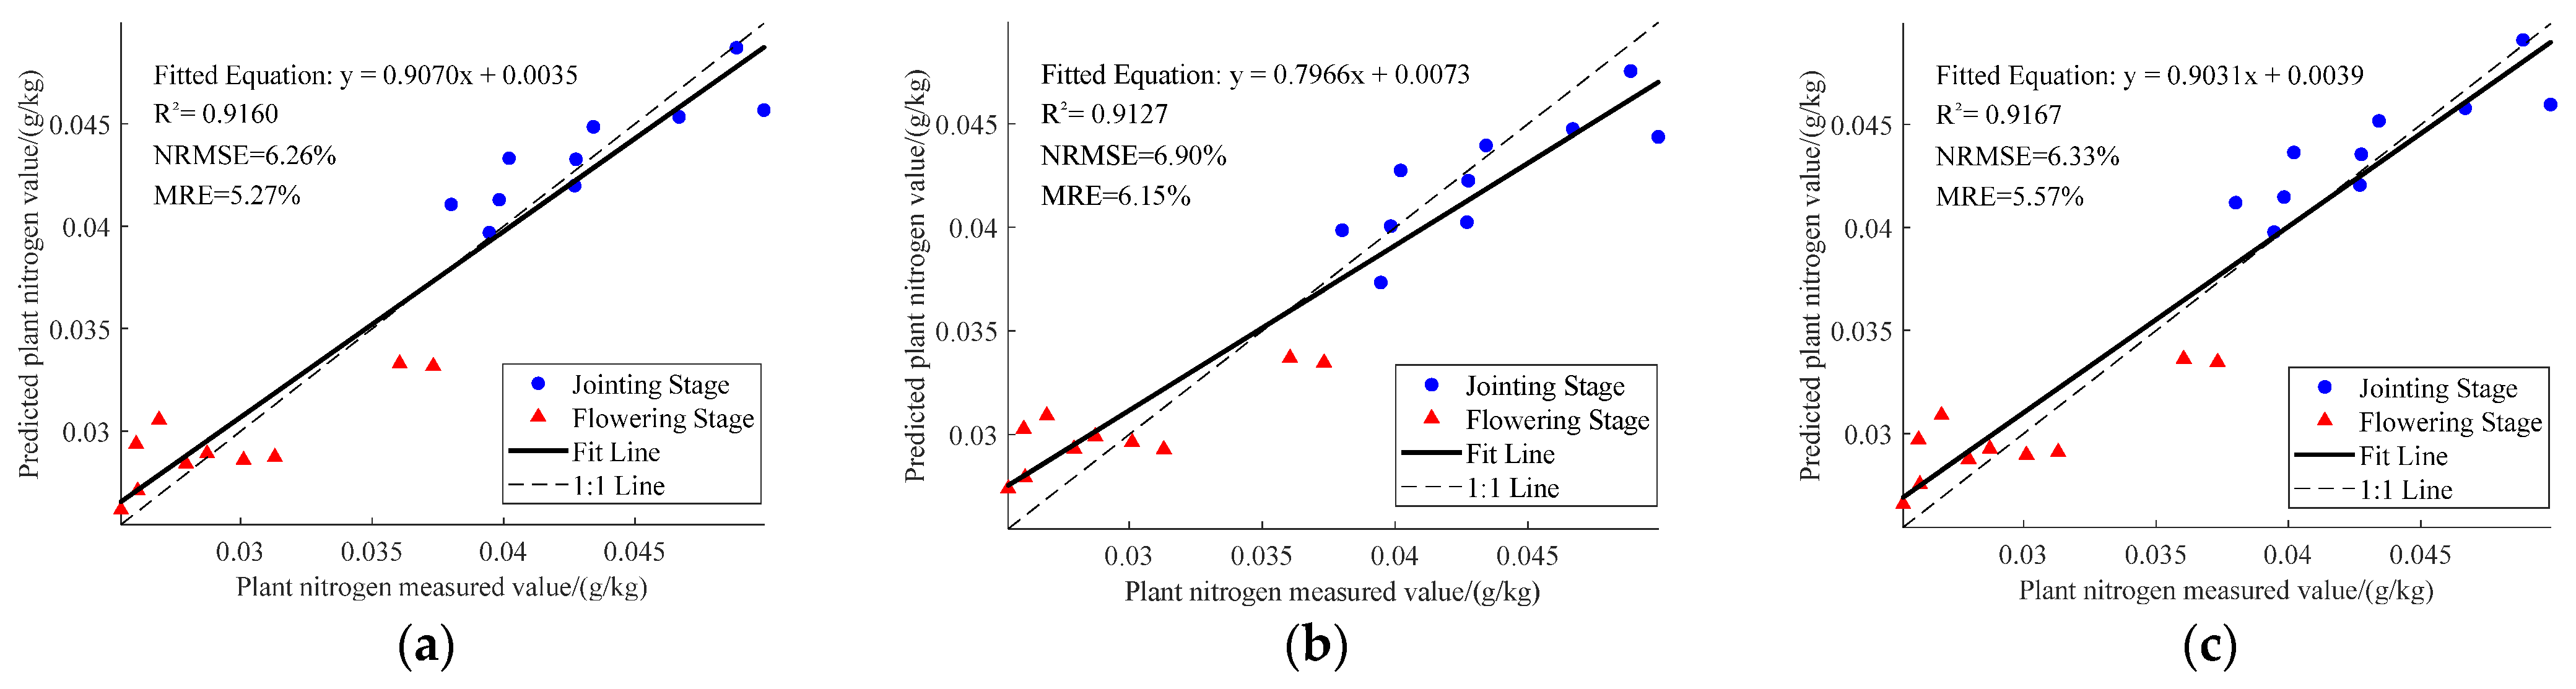
3.4. Verification of Accuracy of Plant Nitrogen Estimation with Optimal Bandwidth

The average N-VIs were calculated on the basis of the center of the selected sensitive band and the optimal bandwidths; a linear estimation model was established with the measured plant nitrogen of rice, and spatial inversion was performed on the basis of the hyperspectral remote sensing images from a UAV. Finally, the accuracy of the plant nitrogen estimation model was verified with reserved validation data, which included 10 plots at the jointing stage and 10 plots at the flowering stage.

3.4.1. Validating the Accuracy of Plant Nitrogen at the Jointing Stage

The overall accuracy verification results for rice plant nitrogen at the jointing stage are shown in Table 5. By using a total of 16 sensitive band centers and optimal bandwidths to construct the N-NDVI, N-DVI, and N-RVI, accurate estimations of rice plant nitrogen were achieved, with most reaching a highly significant level (p < 0.01). In the N-NDVI-based plant nitrogen estimation model, the coefficient of determination between the measured plant nitrogen and estimated plant nitrogen ranged from 0.6721 to 0.7656, the NRMSE ranged from 4.84% to 5.55%, and the MRE ranged from 3.79% to 4.47%. Among them, the most accurate sensitive band center for plant nitrogen estimation was 510.32/623.00 nm, with an R2 value of 0.7656 within a bandwidth range of ±3 nm and NRMSE and MRE values of 4.84% and 3.79%, respectively. According to the N-DVI-based plant nitrogen estimation model, the coefficient of determination between the measured plant nitrogen and estimated plant nitrogen ranged from 0.4939 to 0.6807, the NRMSE ranged from 5.52% to 7.07%, and the MRE ranged from 4.31% to 5.28%. The most accurate sensitive band center for plant nitrogen estimation was 517.11/633.28 nm, with an R2 value of 0.6807 within a bandwidth range of ±9 nm, and the NRMSE and MRE were 5.52% and 4.31%, respectively. According to the N-RVI-based plant nitrogen estimation model, the coefficient of determination between the measured plant nitrogen and estimated plant nitrogen ranged from 0.6708 to 0.7593, the NRMSE ranged from 4.93% to 5.92%, and the MRE ranged from 3.74% to 5.10%. Among them, the most accurate sensitive band center for plant nitrogen estimation was 510.32/623.00 nm, with an R2 value of 0.7593 within a bandwidth range of ±3 nm and NRMSE and MRE values of 4.93% and 3.96%, respectively.
The rice plant nitrogen estimation model constructed using narrow-band vegetation indices, calculated on the basis of sensitive band centers and optimal bandwidths of plant nitrogen, achieved good accuracy. According to the accuracy evaluation criteria of this study, the overall accuracies of each N-VI at the jointing stage were, from highest to lowest, N-NDVI, N-RVI, and N-DVI. Owing to space limitations, this study only listed the results of the spatial inversion of nitrogen in rice plants, with the highest accuracy in the N-NDVI, N-DVI, and N-RVI at the jointing stage, as shown in Figure 9. According to the inversion of plant nitrogen for each of the N-VI in Figure 9a–c, the results are consistent with the fertilizer gradient in Figure 1, which is in accordance with the objective law. With increasing nitrogen application level, the plant nitrogen content of rice gradually increased, which further verified the accuracy of the plant nitrogen inversion results. According to the accuracy evaluation criteria of this study, the N-NDVI index constructed with a sensitive band center of 510.32 nm/623.00 nm and a corresponding optimal bandwidth of ±3 nm was chosen as the rice plant nitrogen inversion result with the highest accuracy at the jointing stage.

3.4.2. Validating the Accuracy of Plant Nitrogen at the Flowering Stage

The overall accuracy verification results for rice plant nitrogen at the flowering stage are shown in Table 6. A total of 16 sensitive band centers and bandwidths were used to construct the N-NDVI, N-DVI, and N-RVI for an accurate estimation of the significance level of rice (p < 0.01). According to the accuracy verification evaluation criteria, the coefficient of determination between the measured plant nitrogen and estimated plant nitrogen in the N-NDVI plant nitrogen estimation-based model ranged from 0.6379 to 0.7312, the NRMSE ranged from 8.28% to 10.43%, and the MRE ranged from 6.75% to 9.41%. Among them, the most accurate sensitive band center for plant nitrogen estimation was 877.11/935.28 nm, with an R2 value of 0.6989 within a bandwidth range of ±3 nm and NRMSE and MRE values of 8.28% and 6.75%, respectively. The coefficient of determination between the measured plant nitrogen and the estimated plant nitrogen in the N-DVI plant nitrogen estimation-based model ranged from 0.6252 to 0.7266, the NRMSE ranged from 8.90% to 12.03%, and the MRE ranged from 7.99% to 11.21%. Among them, the most accurate sensitive band centers for plant nitrogen estimation were 877.11/935.28 nm, with an R2 value of 0.6995 within a bandwidth range of ±3 nm and NRMSE and MRE values of 8.90% and 7.99%, respectively. The coefficient of determination between the measured plant nitrogen and the estimated plant nitrogen in the N-RVI plant nitrogen estimation-based model ranged from 0.6371 to 0.7314, the NRMSE ranged from 8.33% to 10.90%, and the MRE ranged from 6.41% to 10.02%. Among them, the most accurate sensitive band centers for plant nitrogen estimation were 877.11/935.28 nm, with an R2 value of 0.7003 within a bandwidth range of ±3 nm and NRMSE and MRE values of 8.33% and 7.18%, respectively. The above results indicate that the sensitive band centers and optimal bandwidths of the three narrow-band vegetation indices, N-NDVI, N-DVI, and N-RVI, which are related to the nitrogen of the rice plant at the flowering stage of anthesis, are the same at 877.11/935.28 nm, and the optimal widths of the corresponding bands are ±3 nm.
It can be observed that the rice plant nitrogen estimation model constructed using narrow-band vegetation indices, calculated on the basis of the sensitive band center and optimal bandwidth of plant nitrogen at the flowering stage, achieved good accuracy. According to the accuracy evaluation criteria of this study, the overall verification accuracy of each N-VI during the flowering period was N-NDVI, N-RVI and N-DVI from high to low. Owing to space limitations, this paper only lists the results of spatial inversion of rice plant nitrogen with the highest accuracy in the N-NDVI, N-DVI, and N-RVI at the flowering stage, as shown in Figure 10. According to the spatial inversion results of plant nitrogen for each N-VI in Figure 10a–c, the results are consistent with the fertilizer gradient in Figure 1, which is in line with the objective law and further verifies the accuracy of the plant nitrogen inversion results. In this study, according to the accuracy evaluation criteria of this study, the N-NDVI constructed with a sensitive band center of 877.11/935.28 nm and a corresponding optimal spectral bandwidth of ±3 nm was chosen as the rice plant nitrogen inversion result with the highest accuracy at the flowering stage.
In summary, at the jointing stage, by using the hyperspectral sensitive band screening method of rice plant nitrogen, based on the inscribed rectangle, it was found that the plant nitrogen inversion model constructed based on the basis of the N-NDVI index composed of the sensitive band center of 510.32 nm/623.00 nm, corresponding to the hyperspectral optimal bandwidth of ±3 nm, had the best prediction, with an R2 of 0.7656 and NRMSE and MRE of 4.84% and 3.79%, respectively. At the flowering stage, the same screening method was used, and it was found that the N-NDVI index constructed on the basis of the sensitive band center at 877.11 nm/935.28 nm, corresponding to a hyperspectral optimal bandwidth of ±3 nm, which had the highest accuracy in estimating plant nitrogen, with an R2 of 0.6989 and NRMSE and MRE of 8.28% and 6.75%, respectively. Figure 11 shows the nitrogen accuracy validation results for each rice plant with the highest N-VI accuracy, where the R2 value of the N-NDVI index is 0.9160, and the NRMSE and MRE values are 6.26% and 5.27%, respectively, indicating the highest overall validation accuracy.

4. Discussion

4.1. Nitrogen Inversion Models Based on Different Narrow-Band Vegetation Indices

In the study of nitrogen inversion based on hyperspectral data, different combinations of bands are mainly used to construct a variety of vegetation indices to effectively determine the nitrogen content [36,37]. Several traditional vegetation indices (NDVI, DVI, and RVI) are significantly correlated with nitrogen [42]; therefore, these indices are widely used in nitrogen inversion studies. In this study, the above three vegetation indices were used to carry out the inversion studies on rice plant nitrogen, and the results showed that during the jointing stage, based on the sensitive band center of 510.32/623.00 nm and the N-NDVI index constructed with the optimal hyperspectral bandwidth of ±3 nm, the best prediction of rice plant nitrogen content was achieved (R2 = 0.7656 NRMSE = 4.84%, MRE = 3.79%). During the flowering stage, on the basis of the sensitive band center of 877.11/935.28 nm and the N-NDVI index constructed with the optimal hyperspectral bandwidth of ±3 nm, the best prediction of rice plant nitrogen content was achieved (R2 = 0.6989, NRMSE = 8.28%, MRE = 6.75%). The relevant band combinations for the optimal vegetation indices, in the two periods, are located mainly in the green, red and near-infrared bands, whereas many scholars have found that there is a significant correlation between the green, red, and near-infrared bands and the nitrogen content [47,48]; the findings of this paper are consistent with those of previous studies. On the basis of the sensitive band centers and optimal bandwidths of various narrow-band vegetation indices, a model for the inversion of rice plant nitrogen content was established. A comparison revealed that the inversion model exhibited smaller values of NRMSE and MRE during the jointing stage than during the flowering stage, indicating the greater predictive accuracy of the jointing stage model. In the optimal inversion models for both growth periods, the coefficient of determination, R2, was greater than 0.65, indicating that the models had high correlation and satisfied the requirement of significance; however, in the flowering stage, the NRMSE and MRE were greater, at 8.28% and 6.75%, respectively, showing greater prediction errors. In contrast, at the jointing stage, both the NRMSE and MRE are less than 5%, indicating that the prediction error is smaller and that the model prediction effect is better. The above results are consistent with the objective law. With the growth and development of rice, the nitrogen content will be transferred. At the jointing stage, the nitrogen content of the rice plants was mainly concentrated in the canopy leaves. At the flowering stage, the plant nitrogen content moved toward the ear, and the plant nitrogen content in the canopy was relatively low. Therefore, the accuracy of remote sensing inversion of plant nitrogen at the jointing stage is relatively high [49,50,51].

4.2. Automatic Determination of Sensitive Bandwidths on the Basis of the Maximum Inscribed Rectangle

The selection of sensitive band centers and optimal bandwidths can optimize satellite band parameter settings and enhance the estimation capabilities of multispectral vegetation indices [52]. Existing research on satellite band design has focused mainly on information that is highly relevant to crops, such as crop biomass and the leaf area index [53,54], and less research has focused on relatively weak information on crop nitrogen content. This study focused on the screening of sensitive bands and optimal widths for rice plant nitrogen, with the aim of providing technical support for plant nitrogen monitoring based on satellite remote sensing. Most existing studies on determining the optimal bandwidths have determined the optimal bandwidths by using the sensitive band center as the central point and manually adjusting the bandwidth step by step to determine the optimal bandwidth [31,32]. This method involves many redundant band extension steps, resulting in low work efficiency. Spectral vegetation indices tend to be more highly correlated with target parameters, such as crop biomass and the leaf area index, and less so for weak information, such as plant nitrogen, which may lead to excessive band extension in this method. Additionally, when the sensitive band center is located at the edge of the entire spectrum, the band extension process is constrained by the boundaries. This study proposed a method for screening the hyperspectral bands of rice plant nitrogen, based on the inscribed rectangle, based on determining the center of the nitrogen-sensitive band of rice plants and the maximum region Ω of the fitted R2 between the narrow-band vegetation index and plant nitrogen; the maximum inscribed rectangle in the Ω range was constructed to determine the optimal bandwidth. The mean N-VI value within the range of the inscribed rectangle under the optimal bandwidth was used to accurately estimate the nitrogen content of the rice plants, and good results were obtained. The final accuracy verification, whether during the jointing stage or the flowering stage, consistently showed an R2 value above 0.49, indicating a significant correlation with nitrogen in rice plants. Both the NRMSE and MRE are less than 13%, further demonstrating the feasibility of the automated method proposed in this study. This method reduces the expansion process of band redundancy, which saves considerable time and resources, and the method based on the inscribed rectangle maximizes the correlation between the narrow-band vegetation index and plant nitrogen, which can provide more accurate estimation accuracy and technical support for the design of satellite band parameters.

4.3. Limitations of This Study and Future Directions for Improvement

This study proposes a method that automatically searches for the optimal bandwidth on the basis of the center of the hyperspectral sensitive bands. Although the method achieves better accuracy in estimating rice plant nitrogen, some improvements are needed. First, to establish a more generalized crop vegetation index model, the data are usually divided according to the gradient of nitrogen application levels in farmlands [55]. There were differences in the growth of different crops at different levels of nitrogen application, which led to a gradient in both the measured and hyperspectral data. This study employed a method of arranging the dataset in order of the nitrogen application horizontal gradient and considered the differences in samples under different fertilization levels when establishing the crop vegetation index model. However, the way in which the dataset is divided by placing samples of the same level of nitrogen application together has not yet been investigated, and future research could further investigate the effect of dataset division on model accuracy. Second, in this study, only N-VIs constructed in any two bands were investigated in the screening study of optimal bandwidths for nitrogen in rice plants; N-VIs constructed in any three bands have not yet been investigated, and the allowable bandwidths of three-band vegetation indices were previously investigated by researchers who succeeded in achieving an accurate estimation of nitrogen concentrations in the leaves of rice and wheat [32]. Therefore, future studies should consider three-band indices (e.g., the red-edge triangular vegetation index (RTVI), triangular vegetation index (TVI), and enhanced vegetation index (EVI)), that are strongly correlated with nitrogen in rice plants for optimal bandwidth screening studies; Finally, current research does not consider the importance of frames per second (FPS) for real-time research. In nitrogen inversion research, FPS can ensure real-time data acquisition and processing, quickly feedback the nitrogen nutrition status of rice, and support the timely adjustment of the fertilization strategy. Moreover, when a UAV collects hyperspectral data, a high FPS can more accurately capture the spectral reflection characteristics of the canopy, improving the inversion precision of plant nitrogen. Therefore, in future studies, we plan to further explore the application of FPS and improve the accuracy and efficiency of real-time nitrogen content monitoring on the basis of UAV hyperspectral images through frame-by-frame verification.

5. Conclusions

This study focused on rice as the research subject and obtained unmanned aerial vehicle (UAV) hyperspectral remote sensing images during the jointing and flowering stages. On the basis of the determination of the maximum value region Ω of the fitted accuracy R2 among the N-NDVI, N-DVI, N-RVI and measured plant nitrogen data and the sensitive band center, a method was proposed to automatically select the optimal bandwidth by constructing an inscribed rectangle. Rice plant nitrogen spatial inversion and precision verification were conducted on the basis of the optimal bandwidth of sensitive bands via UAV hyperspectral images. The overall accuracies of various N-VI during the jointing stage were ranked from high to low as follows: N-NDVI, N-RVI, and N-DVI. Among them, the N-NDVI constructed with a sensitive band center of 510.32/623.00 nm and a corresponding optimal bandwidth of ±3 nm had the highest accuracy in estimating the nitrogen content in rice plants, with a coefficient of determination R2 of 0.7656, an NRMSE of 4.84%, and an MRE of 3.79%. During the flowering stage, the overall prediction accuracy of each N-VI is N-NDVI, N-RVI, and N-DVI, in order from high to low, which was consistent with the jointing stage. Among them, the N-NDVI, constructed with a sensitive band center of 877.11/935.28 nm and a corresponding optimal bandwidth of ±3 nm, has the highest accuracy in estimating the nitrogen content in rice plants, with a coefficient of determination R2 of 0.6989, an NRMSE of 8.28%, and an MRE of 6.75%. The above results indicate that, compared with the measured nitrogen content in plants, the optimal narrowband vegetation index achieved good performance in constructing a rice plant nitrogen prediction model within the optimal band range selected on the basis of the inscribed rectangle. The method of crop plant nitrogen inversion band center screening and automatic identification of the optimal bandwidth in this study is feasible, provides a new approach for screening the optimal bandwidth on the basis of sensitive band centers and provides technical support for the design of satellite band parameters.

Author Contributions

Conceptualization, S.W.; methodology, Y.F. and S.W.; validation, Y.F., Y.C. and J.T.; investigation, W.K. and J.T.; resources, W.K.; data curation, Y.F.; writing—original draft preparation, Y.F.; writing—review and editing, Y.C.; supervision, S.W., Y.Z., B.F. and P.Y. funding acquisition, Y.Z., B.F. and P.Y. All authors have read and agreed to the published version of the manuscript.

Funding

This research was funded by the National Key Research and Development Program of China (P.Y. 2022YFD2001104), the National Natural Science Foundation of China (S.W. 42271374), the Youth Innovation Program of the Chinese Academy of Agricultural Sciences (S.W. Y2023QC18) and the Technology Innovation Center for Land Engineering and Human Settlements, Shaanxi Land Engineering Construction Group Co, Ltd. and Xi’an Jiaotong University (P.Y. 2021WHZ0072).

Data Availability Statement

Data are contained within the article.

Conflicts of Interest

The authors declare no conflicts of interest.

References

  1. Alam, I.; Zhang, H.Y.; Du, H.; Rehman, N.U.; Manghwar, H.; Lei, X.; Khan, Z.; Batool, K.; Ge, L.F. Bioengineering Techniques to Improve Nitrogen Transformation and Utilization: Implications for Nitrogen Use Efficiency and Future Sustainable Crop Production. J. Agric. Food Chem. 2023, 71, 3921–3939. [Google Scholar] [CrossRef]
  2. Maltese, N.E.; Maddonni, G.A.; Melchiori RJ, M.; Caviglia, O.P. Plant nitrogen status at flowering and kernel set efficiency in early- and late-sown maize crops. Field Crop. Res. 2021, 270, 108216. [Google Scholar] [CrossRef]
  3. Fortunato, S.; Nigro, D.; Lasorella, C.; Marcotuli, I.; Gadaleta, A.; De Pinto, M.C. The Role of Glutamine Synthetase (GS) and Glutamate Synthase (GOGAT) in the Improvement of Nitrogen Use Efficiency in Cereals. Biomolecules 2023, 13, 1771. [Google Scholar] [CrossRef]
  4. Ertekin, I. influence of nitrogen rose and plant density of the yield and quality properties of dual purpose barley grown under the mediterranean climatic aonditions. J. Elem. 2022, 27, 113–126. [Google Scholar] [CrossRef]
  5. Ata-Ul-Karim, S.T.; Cang, L.; Wang, Y.J.; Zhou, D.M. Effects of soil properties, nitrogen application, plant phenology, and their interactions on plant uptake of cadmium in wheat. J. Hazard. Mater. 2020, 384, 121452. [Google Scholar] [CrossRef] [PubMed]
  6. Vigneau, N.; Ecarnot, M.; Rabatel, G.; Roumet, P. Potential of field hyperspectral imaging as a non destructive method to assess leaf nitrogen content in Wheat. Field Crop. Res. 2011, 122, 25–31. [Google Scholar] [CrossRef]
  7. Konara, B.; Krishnapillai, M.; Galagedara, L. Recent Trends and Advances in Utilizing Digital Image Processing for Crop Nitrogen Management. Remote Sens. 2024, 16, 4514. [Google Scholar] [CrossRef]
  8. Shahi, T.B.; Xu, C.Y.; Neupane, A.; Guo, W. Recent Advances in Crop Disease Detection Using UAV and Deep Learning Techniques. Remote Sens. 2023, 15, 2450. [Google Scholar] [CrossRef]
  9. Narmilan, A.; Gonzalez, F.; Salgadoe, A.S.A.; Kumarasiri, U.; Weerasinghe, H.A.S.; Kulasekara, B.R. Predicting Canopy Chlorophyll Content in Sugarcane Crops Using Machine Learning Algorithms and Spectral Vegetation Indices Derived from UAV Multispectral Imagery. Remote Sens. 2022, 14, 1140. [Google Scholar] [CrossRef]
  10. Tian, F.K.; Ransom, C.J.; Zhou, J.F.; Wilson, B.; Sudduth, K.A. Assessing the impact of soil and field conditions on cotton crop emergence using UAV-based imagery. Comput. Electron. Agric. 2024, 218, 108738. [Google Scholar] [CrossRef]
  11. Maimaitijiang, M.; Ghulam, A.; Sidike, P.; Hartling, S.; Maimaitiyiming, M.; Peterson, K.; Shavers, E.; Fishman, J.; Peterson, J.; Kadam, S.; et al. Unmanned Aerial System (UAS)-based phenotyping of soybean using multisensor data fusion and extreme learning machine. ISPRS-J. Photogramm. Remote Sens. 2017, 134, 43–58. [Google Scholar] [CrossRef]
  12. Blekanov, I.; Molin, A.; Zhang, D.; Mitrofanov, E.; Mitrofanova, O.; Li, Y. Monitoring of grain crops nitrogen status from uav multispectral images coupled with deep learning approaches. Comput. Electron. Agric. 2023, 212, 108047. [Google Scholar] [CrossRef]
  13. Gallo, I.; Boschetti, M.; Rehman, A.U.; Candiani, G. Self-Supervised Convolutional Neural Network Learning in a Hybrid Approach Framework to Estimate Chlorophyll and Nitrogen Content of Maize from Hyperspectral Images. Remote Sens. 2023, 15, 4765. [Google Scholar] [CrossRef]
  14. Colovic, M.; Yu, K.; Todorovic, M.; Cantore, V.; Hamze, M.; Albrizio, R.; Stellacci, A.M. Hyperspectral Vegetation Indices to Assess Water and Nitrogen Status of Sweet Maize Crop. Agronomy 2022, 12, 2181. [Google Scholar] [CrossRef]
  15. Berger, K.; Verrelst, J.; Féret, J.B.; Wang, Z.H.; Wocher, M.; Strathmann, M.; Danner, M.; Mauser, W.; Hank, T. Crop nitrogen monitoring: Recent progress and principal developments in the context of imaging spectroscopy missions. Remote Sens. Environ. 2020, 242, 111758. [Google Scholar] [CrossRef] [PubMed]
  16. Vaddi, R.; Kumar, B.; Manoharan, P.; Agilandeeswari, L.; Sangeetha, V. Strategies for dimensionality reduction in hyperspectral remote sensing: A comprehensive overview. Egypt. J. Remote Sens. Space Sci. 2024, 27, 82–92. [Google Scholar] [CrossRef]
  17. Macfarlane, F.; Murray, P.; Marshall, S.; White, H. Investigating the Effects of a Combined Spatial and Spectral Dimensionality Reduction Approach for Aerial Hyperspectral Target Detection Applications. Remote Sens. 2021, 13, 1647. [Google Scholar] [CrossRef]
  18. Moharram, M.A.; Sundaram, D.M. Dimensionality reduction strategies for land use land cover classification based on airborne hyperspectral imagery: A survey. Environ. Sci. Pollut. Res. 2023, 30, 5580–5602. [Google Scholar] [CrossRef] [PubMed]
  19. Yu, F.H.; Feng, S.; Du, W.; Wang, D.K.; Guo, Z.H.; Xing, S.M.; Jin, Z.Y.; Cao, Y.L.; Xu, T.Y. A Study of Nitrogen Deficiency Inversion in Rice Leaves Based on the Hyperspectral Reflectance Differential. Front. Plant Sci. 2020, 11, 573272. [Google Scholar] [CrossRef]
  20. Stellacci, A.M.; Castrignanò, A.; Troccoli, A.; Basso, B.; Buttafuoco, G. Selecting optimal hyperspectral bands to discriminate nitrogen status in durum wheat: A comparison of statistical approaches. Environ. Monit. Assess. 2016, 188, 4. [Google Scholar] [CrossRef]
  21. Zhang, Y.F.; Liang, K.M.; Zhu, F.F.; Zhong, X.H.; Lu, Z.H.; Chen, Y.B.; Pan, J.F.; Lu, C.S.; Huang, J.C.; Ye, Q.H.; et al. Differential Study on Estimation Models for Indica Rice Leaf SPAD Value and Nitrogen Concentration Based on Hyperspectral Monitoring. Remote Sens. 2024, 16, 4604. [Google Scholar] [CrossRef]
  22. Mahajan, G.R.; Pandey, R.N.; Sahoo, R.N.; Gupta, V.K.; Datta, S.C.; Kumar, D. Monitoring nitrogen, phosphorus and sulphur in hybrid rice (Oryza sativa L.) using hyperspectral remote sensing. Precis. Agric. 2017, 18, 736–761. [Google Scholar] [CrossRef]
  23. Tian, T.; Wang, J.L.; Tao, Y.Y.; Ji, F.F.; He, Q.Q.; Sun, C.M.; Zhang, Q. Estimating Rice Leaf Nitrogen Content and Field Distribution Using Machine Learning with Diverse Hyperspectral Features. Agronomy 2024, 14, 2760. [Google Scholar] [CrossRef]
  24. Yu, F.H.; Bai, J.C.; Jin, Z.Y.; Zhang, H.G.; Yang, J.X.; Xu, T.Y. Estimating the rice nitrogen nutrition index based on hyperspectral transform technology. Front. Plant Sci. 2023, 14, 1118098. [Google Scholar] [CrossRef] [PubMed]
  25. Du, W.; Xu, T.Y.; Yu, F.H.; Chen, C.L. Measurement of nitrogen content in rice by inversion of hyperspectral reflectance data from an unmanned aerial vehicle. Cienc. Rural 2018, 48, e20180008. [Google Scholar] [CrossRef]
  26. Wang, L.; Chen, S.S.; Li, D.; Wang, C.Y.; Jiang, H.; Zheng, Q.; Peng, Z.P. Estimation of Paddy Rice Nitrogen Content and Accumulation Both at Leaf and Plant Levels from UAV Hyperspectral Imagery. Remote Sens. 2021, 13, 2956. [Google Scholar] [CrossRef]
  27. Peng, Y.P.; Zhong, W.L.; Peng, Z.P.; Tu, Y.T.; Xu, Y.G.; Li, Z.X.; Liang, J.Y.; Huang, J.C.; Liu, X.; Fu, Y.Q. Enhanced Estimation of Rice Leaf Nitrogen Content via the Integration of Hybrid Preferred Features and Deep Learning Methodologies. Agronomy 2024, 14, 1248. [Google Scholar] [CrossRef]
  28. Lai, J.K.; Lin, W.S. Real-Time Detection of Rice Growth Phase Transition for Panicle Nitrogen Application Timing Assessment. Agronomy 2021, 11, 2465. [Google Scholar] [CrossRef]
  29. Hu, T.; Liu, Z.H.; Hu, R.; Tian, M.; Wang, Z.W.; Li, M.; Chen, G.H. Convolutional Neural Network-Based Estimation of Nitrogen Content in Regenerating Rice Leaves. Agronomy 2024, 14, 1422. [Google Scholar] [CrossRef]
  30. Zhu, Y.M.; Abdalla, A.; Tang, Z.; Cen, H.Y. Improving rice nitrogen stress diagnosis by denoising strips in hyperspectral images via deep learning. Biosyst. Eng. 2022, 219, 165–176. [Google Scholar] [CrossRef]
  31. Yao, X.; Zhu, Y.; Tian, Y.C.; Feng, W.; Cao, W.X. Exploring hyperspectral bands and estimation indices for leaf nitrogen accumulation in wheat. Int. J. Appl. Earth Obs. Geoinf. 2010, 12, 89–100. [Google Scholar] [CrossRef]
  32. Wang, W.; Yao, X.; Yao, X.F.; Tian, Y.C.; Liu, X.J.; Ni, J.; Cao, W.D.; Zhu, Y. Estimating leaf nitrogen concentration with three-band vegetation indices in rice and wheat. Field Crop. Res. 2012, 129, 90–98. [Google Scholar] [CrossRef]
  33. Hasituya; Li, F.; Elsayed, S.; Hu, Y.C.; Schmidhalter, U. Passive reflectance sensing using optimized two- and three-band spectral indices for quantifying the total nitrogen yield of maize. Comput. Electron. Agric. 2020, 173, 105403. [Google Scholar] [CrossRef]
  34. Liang, L.; Di, L.P.; Huang, T.; Wang, J.H.; Lin, L.; Wang, L.J.; Yang, M.H. Estimation of Leaf Nitrogen Content in Wheat Using New Hyperspectral Indices and a Random Forest Regression Algorithm. Remote Sens. 2018, 10, 1940. [Google Scholar] [CrossRef]
  35. Zhou, J.; Wang, B.W.; Fan, J.H.; Ma, Y.C.; Wang, Y.; Zhang, Z. A Systematic Study of Estimating Potato N Concentrations Using UAV-Based Hyper and Multi-Spectral Imagery. Agronomy 2022, 12, 2533. [Google Scholar] [CrossRef]
  36. Burns, B.W.; Green, V.S.; Hashem, A.A.; Massey, J.H.; Shew, A.M.; Adviento-Borbe, M.A.A.; Milad, M. Determining nitrogen deficiencies for maize using various remote sensing indices. Precis. Agric. 2022, 23, 791–811. [Google Scholar] [CrossRef]
  37. Holzhauser, K.; Räbiger, T.; Rose, T.; Kage, H.; Kühling, I. Estimation of Biomass and N Uptake in Different Winter Cover Crops from UAV-Based Multispectral Canopy Reflectance Data. Remote Sens. 2022, 14, 4525. [Google Scholar] [CrossRef]
  38. Jiang, R.; Sanchez-Azofeifa, A.; Laakso, K.; Wang, P.; Xu, Y.; Zhou, Z.Y.; Luo, X.W.; Lan, Y.B.; Zhao, G.P.; Chen, X. UAV-based partially sampling system for rapid NDVI mapping in the evaluation of rice nitrogen use efficiency. J. Clean Prod. 2021, 289, 125705. [Google Scholar] [CrossRef]
  39. Liu, S.S.; Li, L.T.; Fan, H.Y.; Guo, X.Y.; Wang, S.Q.; Lu, J.W. Real-time and multistage recommendations for nitrogen fertilizer topdressing rates in winter oilseed rape based on canopy hyperspectral data. Ind. Crop. Prod. 2020, 154, 112699. [Google Scholar] [CrossRef]
  40. Yao, L.L.; Wang, Q.; Yang, J.B.; Zhang, Y.; Zhu, Y.; Cao, W.X.; Ni, J. UAV-Borne Dual-Band Sensor Method for Monitoring Physiological Crop Status. Sensors 2019, 19, 816. [Google Scholar] [CrossRef] [PubMed]
  41. Zhang, J.J.; Cheng, T.; Shi, L.; Wang, W.W.; Niu, Z.; Guo, W.; Ma, X.M. Combining spectral and texture features of UAV hyperspectral images for leaf nitrogen content monitoring in winter wheat. Int. J. Remote Sens. 2022, 43, 2335–2356. [Google Scholar] [CrossRef]
  42. Jiang, J.; Zhang, Z.Y.; Cao, Q.; Liang, Y.; Krienke, B.; Tian, Y.C.; Zhu, Y.; Cao, W.X.; Liu, X.J. Use of an Active Canopy Sensor Mounted on an Unmanned Aerial Vehicle to Monitor the Growth and Nitrogen Status of Winter Wheat. Remote Sens. 2020, 12, 3684. [Google Scholar] [CrossRef]
  43. Bai, H.Z.; Xiao, D.P. Spatiotemporal changes of rice phenology in China during 1981-2010. Theor. Appl. Climatol. 2020, 140, 1483–1494. [Google Scholar] [CrossRef]
  44. Gobbo, S.; Migliorati, M.D.; Ferrise, R.; Morari, F.; Furlan, L.; Sartori, L. Evaluation of different crop model-based approaches for variable rate nitrogen fertilization in winter wheat. Precis. Agric. 2022, 23, 1922–1948. [Google Scholar] [CrossRef]
  45. Inoue, Y. Synergy of Remote Sensing and Modeling for Estimating Ecophysiological Processes in Plant Production. Plant Prod. Sci. 2003, 6, 3–16. [Google Scholar] [CrossRef]
  46. Zhang, N.D.; Liu, X.R.; Ren, J.Q.; Wu, S.R.; Li, F.J. Estimating the winter wheat harvest index with canopy hyperspectral remote sensing data based on the dynamic fraction of postanthesis phase biomass accumulation. Int. J. Remote Sens. 2022, 43, 2029–2058. [Google Scholar] [CrossRef]
  47. Colorado, J.D.; Cera-Bornacelli, N.; Caldas, J.S.; Petro, E.; Rebolledo, M.C.; Cuellar, D.; Calderon, F.; Mondragon, I.F.; Jaramillo-Botero, A. Estimation of Nitrogen in Rice Crops from UAV-Captured Images. Remote Sens. 2020, 12, 3396. [Google Scholar] [CrossRef]
  48. Liu, H.Y.; Zhu, H.C.; Li, Z.H.; Yang, G.J. Quantitative analysis and hyperspectral remote sensing of the nitrogen nutrition index in winter wheat. Int. J. Remote Sens. 2020, 41, 858–881. [Google Scholar] [CrossRef]
  49. Muhammad, S.; Kumazawa, K.J.S.S.; Nutrition, P. Use of optical spectrograpiuc 15N-analyses to trace nitrogen applied at tile heading stage of rice. Soil Sci. Plant Nutr. 1972, 18, 143–146. [Google Scholar] [CrossRef]
  50. Muhammad, S.; Kumazawa, K.J.S.S.; Nutrition, P. The absorption, distribution, and redistribution of 15N-labelled ammonium and nitrate nitrogen administered at different growth stages of rice. Soil Sci. Plant Nutr. 1974, 20, 47–55. [Google Scholar] [CrossRef]
  51. Wada, G.; Shoji, S.; Takahashi, J. The fate of fertilizer nitrogen applied to the paddy field and its absorption by rice plant: 4. Distribution of basal and top-dressed nitrogen in rice plant. Jpn. J. Crop Sci. 1973, 42, 84–90. [Google Scholar] [CrossRef]
  52. Verrelst, J.; Malenovsky, Z.; Van Der Tol, C.; Camps-Valls, G.; Gastellu-Etchegorry, J.P.; Lewis, P.; North, P.; Moreno, J. Quantifying Vegetation Biophysical Variables from Imaging Spectroscopy Data: A Review on Retrieval Methods. Surv. Geophys. 2019, 40, 589–629. [Google Scholar] [CrossRef] [PubMed]
  53. Zhao, D.H.; Huang, L.M.; Li, J.L.; Qi, J.G. A comparative analysis of broadband and narrowband derived vegetation indices in predicting LAI and CCD of a cotton canopy. ISPRS-J. Photogramm. Remote Sens. 2007, 62, 25–33. [Google Scholar] [CrossRef]
  54. Liang, L.; Huang, T.; Di, L.P.; Geng, D.; Yan, J.; Wang, S.G.; Wang, L.J.; Li, L.; Chen, B.Q.; Kang, J.R. Influence of Different Bandwidths on LAI Estimation Using Vegetation Indices. IEEE J. Sel. Top. Appl. Earth Observ. Remote Sens. 2020, 13, 1494–1502. [Google Scholar] [CrossRef]
  55. Goswami, S.; Choudhary, S.S.; Chatterjee, C.; Mailapalli, D.R.; Mishra, A.; Raghuwanshi, N.S. Estimation of nitrogen status and yield of rice crop using unmanned aerial vehicle equipped with multispectral camera. J. Appl. Remote Sens. 2021, 15, 042407. [Google Scholar] [CrossRef]
Figure 1. Distribution of test plots and nitrogen application levels.
Agronomy 15 00406 g001
Figure 2. The specific technical flowchart.
Agronomy 15 00406 g002
Figure 3. Schematic diagram of inscribed rectangular band expansion.
Agronomy 15 00406 g003
Figure 4. Distribution of rice N-VIs in a two-dimensional plot. (a) Jointing stage N–NDVI. (b) Jointing stage N-DVI. (c) Jointing stage N-RVI. (d) Flowering stage N-NDVI. (e) Flowering stage N-DVI. (f) Flowering stage N-RVI.
Agronomy 15 00406 g004
Figure 5. Two-dimensional plot of fitted R2 between N-VIs and rice plant nitrogen at the jointing stage. (a) N-NDVI. (b) N-DVI. (c) N-RVI.
Agronomy 15 00406 g005
Figure 6. Two-dimensional plot of fitted R2 between N-VIs and rice plant nitrogen at the flowering stage. (a) N-NDVI. (b) N-DVI. (c) N-RVI.
Agronomy 15 00406 g006
Figure 7. Two-dimensional isopotential plot of fitted R2 between N-VIs and rice plant nitrogen at the jointing stage. (a) N-NDVI. (b) N-DVI. (c) N-RVI.
Agronomy 15 00406 g007
Figure 8. Two-dimensional isopotential plot of fitted R2 between N-VIs and rice plant nitrogen at the flowering stage. (a) N-NDVI. (b) N-DVI. (c) N-RVI.
Agronomy 15 00406 g008
Figure 9. Results of plant nitrogen inversion based on N-VIs (jointing stage): (a) Plant nitrogen inversion results based on the N-NDVI. (b) Plant nitrogen inversion results based on the N-DVI. (c) Plant nitrogen inversion results based on the N-RVI.
Agronomy 15 00406 g009
Figure 10. Results of plant nitrogen inversion based on N-VIs (flowering stage): (a) Plant nitrogen inversion results based on the N-NDVI. (b) Plant nitrogen inversion results based on the N-DVI. (c) Plant nitrogen inversion results based on the N-RVI.
Agronomy 15 00406 g010
Figure 11. Verification results of rice N-VI estimation accuracy. (a) Accuracy validation of plant nitrogen based on the N-NDVI. (b) Accuracy validation of plant nitrogen based on the N-DVI. (c) Accuracy validation of plant nitrogen based on the N-RVI.
Agronomy 15 00406 g011
Table 1. Plant environment and nitrogen fertilizer application level of rice.
ParameterDetail
LocationRice Experimental Base, Gaoqiao Town, Changsha County, Hunan Provincial Academy of Agricultural Sciences.
Latitude28°35′ N
Longitude113°14′ E
Elevation57 m
Cropping SystemBiannual
Rice VarietiesZhongzao 39 (Hybrid), Xiangzaoxian 24 (Conventional)
Number of Plots per Variety20
Total Number of Plots40
Plot Area15 m2
Nitrogen Application Levels0, 3, 6, 9, 12, 15 kg
Fertilizer Application RatioBase fertilizer: Additional fertilizer = 6:4
Table 2. Statistical Distribution of Spectral N-VIs at Rice Key Growth Stages.
Narrowband Vegetation IndexAxisJointing StageFlowering Stage
X-AxisY-AxisMaxMinMeanMaxMinMean
N-NDVI395–720680–10010.800.480.710.870.530.80
395–510520–6800.330.020.210.360.010.20
520–580640–690−0.08−0.22−0.16−0.11−0.30−0.22
N-DVI395–720710–10010.300.070.260.480.100.43
N-RVI395–510740–10018.856.307.9513.868.7012.40
610–690730–10017.114.055.9212.145.449.08
Table 3. Screening results of the optimal bandwidth at different fertility periods.
Growth PhasesN-VIs
Indicators
Sensitive Band Center Wavelength/nmOptimal Bandwidth
λ 1 / n m λ 2 / n m
Jointing stageN-NDVI510.32623.00±3
513.72688.19±3
469.60660.72±6
483.16650.43±12
N-DVI517.11633.28±9
466.22653.86±9
425.70664.15±3
575.09818.77±33
N-RVI510.32623.00±3
469.60660.72±6
513.72688.19±3
483.16650.43±12
623.00510.32±3
660.72469.60±6
688.19513.72±3
650.43483.16±12
Flowering stageN-NDVI914.77931.87±3
877.11935.28±3
839.38935.28±3
808.47935.28±3
N-DVI914.77931.87±3
877.11935.28±3
839.38935.28±3
808.47935.28±3
N-RVI914.77931.87±3
877.11935.28±3
839.38935.28±3
808.47935.28±3
931.87914.77±3
935.28877.11±3
935.28839.38±3
935.28808.47±3
Table 4. Accuracy evaluation of the optimal bandwidth of the N-DVI.
Growth PhasesBand CenterOptimal BandwidthModeling Set Accuracy
Evaluation (n = 25)
λ1/nmλ2/nmR2NRMSE/%MRE/%
Jointing stage517.11633.28±60.5108 **7.44085.7564
±90.5101 **7.44615.7604
±120.5089 **7.45485.7654
466.22653.86±60.4769 **7.69486.2468
±90.4690 **7.75286.2946
±120.4540 **7.86116.3830
425.70664.15±00.4497 **7.89236.5407
±30.4330 **8.01106.6303
±60.4138 **8.14496.7307
575.09818.77±300.4355 **7.99376.2000
±330.4356 **7.99256.2012
±360.4353 **7.99486.2031
Flowering stage914.77931.87±00.2952 **12.312010.6291
±30.2941 **12.321410.6503
±60.2586 **12.628010.8877
877.11935.28±00.3096 **12.185410.5608
±30.2995 **12.274110.6372
±602616**12.602210.8363
839.38935.2800.3182 **12.109010.3255
±30.2951 **12.313610.4368
±60.2328 **12.845810.8436
808.47935.2800.2963 **12.303110.8818
±30.3029 **12.243910.7597
±60.2921 **12.338410.5477
Note: n is the number of modeling sets at the jointing and flowering stages; bold text is the optimal bandwidth; ** indicates a very significant correlation at the p < 0.01 level; R2 is the coefficient of determination; NRMSE is the normalized root-mean-square error; and MRE is the mean relative error.
Table 5. Accuracy validation of the plant nitrogen estimation model at the jointing stage.
N-VIsSensitive Band CenterOptimum BandwidthFitting Equations Between N-VIs and Plant NitrogenResults of Validation of Plant Nitrogen Estimation Accuracy n = 10
λ1/nmλ2/nmR2NRMSE/%MRE
/%
N-NDVI510.32623.00±3y = 0.05031 + 0.13084*x0.7656 **4.843.79
469.60660.72±6y = 0.04985 + 0.08360*x0.7043 **5.384.29
513.72688.19±3y = 0.05001 + 0.10144*x0.7149 **5.103.96
483.16650.43±12y = 0.05316 + 0.09278*x0.6721 **5.554.47
N-DVI517.11633.28±9y = 0.03941 + 0.93806*x0.6807 **5.524.31
466.22653.86±9y = 0.05072 + 0.91247*x0.5627 **6.075.21
425.70664.15±3y = 0.04531 + 0.80783*x0.5364 **6.235.28
575.09818.77±33y = 0.02477−0.05313*x0.4939 *7.074.98
N-RVI510.32623.00±3y = −0.02209 + 0.07230*x0.7593 **4.933.96
469.60660.72±6y = 0.00101 + 0.04930*x0.7041 **5.924.99
513.72688.19±3y = −0.00571 + 0.05519*x0.7208 **5.033.87
483.16650.43±12y = −0.00301 + 0.05705*x0.6708 **5.605.10
623.00510.32±3y = 0.10757 − 0.05730*x0.7401 **4.943.74
660.72469.60±6y = 0.08383 − 0.03449*x0.7105 **4.994.17
688.19513.72±3y = 0.09449 − 0.04416*x0.7455 **5.103.87
650.43483.16±12y = 0.08837 − 0.03619*x0.6769 **5.244.18
Note: x in the fitted equation is the mean value of N-VI constructed within the optimal bandwidth for the UAV hyperspectral bands λ1 and λ2; y is the fitted rice plant nitrogen (g/kg); n is the number of validation sets at the jointing stage; ** indicates a highly significant correlation at the p < 0.01 level; * indicates a significant correlation at the p < 0.05 level; R2 is the coefficient of determination; NRMSE is the normalized root mean square error; and MRE is the mean relative error.
Table 6. Accuracy validation of the plant nitrogen estimation model at the flowering stage.
N-VIsSensitive Band CenterOptimum BandwidthFitting Equations Between N-VIs and Plant NitrogenResults of Validation of Plant Nitrogen Estimation Accuracy n = 10
λ1/nmλ2/nmR2NRMSE
/%
MRE
/%
N-NDVI914.77931.87±3y = 0.02365 + 0.65680*x0.6379 **10.439.41
877.11935.28±3y = 0.02351 + 0.48638*x0.6989 **8.286.75
839.38935.28±3y = 0.02686 + 0.41471*x0.7056 **8.847.12
808.47935.28±3y = 0.03554 + 0.33679*x0.7312 **9.999.08
N-DVI914.77931.87±3y = 0.02432 + 0.53284*x0.6252 **11.0510.35
877.11935.28±3y = 0.02437 + 0.38232*x0.6995 **8.907.99
839.38935.28±3y = 0.02710 + 0.34652*x0.7117 **9.408.45
808.47935.28±3y = 0.03520−0.29567*x0.7266 **12.0311.21
N-RVI914.77931.87±3y = −0.29774 + 0.32143*x0.6406 **10.9010.02
877.11935.28±3y = −0.21282 + 0.23641*x0.7003 **8.337.18
839.38935.28±3y = −0.17749 + 0.20435*x0.7063 **8.847.51
808.47935.28±3y = −0.13896 + 0.17459*x0.7314 **10.289.40
931.87914.77±3y = 0.35896 − 0.33535*x0.6371 **10.138.95
935.28877.11±3y = 0.27344 − 0.25001*x0.6976 **8.396.41
935.28839.38±3y = 0.23719 − 0.21032*x0.7044 **8.976.80
935.28808.47±3y = 0.19771 − 0.16225*x0.7310 **9.738.76
Note: x in the fitted equation is the mean value of N-VIs constructed within the optimal bandwidth for the UAV hyperspectral bands λ 1 and λ 2; y is the fitted rice plant nitrogen (g/kg); n is the number of validation sets at the flowering stage; ** indicates a highly significant correlation at the p < 0.01 level; R2 is the coefficient of determination; NRMSE is the normalized root mean square error; and MRE is the mean relative error.
Disclaimer/Publisher’s Note: The statements, opinions and data contained in all publications are solely those of the individual author(s) and contributor(s) and not of MDPI and/or the editor(s). MDPI and/or the editor(s) disclaim responsibility for any injury to people or property resulting from any ideas, methods, instructions or products referred to in the content.

