Article

Combined Mineral and Organic Fertilizer Application Enhances Soil Organic Carbon and Maize Yield in Semi-Arid Kenya: A DNDC Model-Based Prediction

1
Hebei Key Laboratory of Soil Ecology, Center for Agricultural Resources Research, Institute of Genetic and Developmental Biology, The Chinese Academy of Sciences, 286 Huaizhong Road, Shijiazhuang 050021, China
2
University of Chinese Academy of Sciences, 19A Yuquan Road, Beijing 100049, China
3
Key Laboratory of Environment Change and Resources Use in Beibu Gulf, Ministry of Education, Nanning Normal University, 175 East Mingxiu Road, Nanning 530001, China
4
Guangxi Key Laboratory of Earth Surface Processes and Intelligent Simulation, Nanning Normal University, 175 East Mingxiu Road, Nanning 530001, China
5
School of Life Sciences, Hebei University, Baoding 071002, China
6
Jomo Kenyatta University of Agriculture and Technology, Nairobi 62000-00100, Kenya
*
Author to whom correspondence should be addressed.
Agronomy 2025, 15(2), 346; https://doi.org/10.3390/agronomy15020346
Submission received: 23 December 2024 / Revised: 27 January 2025 / Accepted: 27 January 2025 / Published: 28 January 2025
(This article belongs to the Section Farming Sustainability)

Abstract

:
The application of mineral fertilizers can effectively enhance crop yields. However, this potential benefit may be diminished if the use of mineral fertilizers leads to a substantial decline in soil organic carbon (SOC) and an increase in soil greenhouse gas (GHG) emissions. This study aimed to determine the optimal fertilizer combinations and rates for improving SOC and maize yield while reducing GHG emissions in the semi-arid uplands of Kenya. Data were collected from five different fertilizer treatments (N50, N100, N150, N100+manure, and N100+straw) compared to a control (N0) in a long-term experimental field, which was used to run and validate the DNDC model before using it for long-term predictions. The results showed that the combination of mineral fertilizer and straw resulted in the highest SOC balance, followed by that of fertilizer and manure. All fertilized treatments had higher maize grain yields compared to low-fertilizer treatment (N50) and control (N0). Daily CO2 fluxes were highest in the treatment combining mineral fertilizer and manure, whereas there were no significant differences in N2O fluxes among the three tested treatments. The findings of this study indicate that the judicious application of mineral fertilizer, animal manure, and straw has great potential in enhancing SOC and maize yields while reducing GHG emissions, thereby providing practical farming management strategies in semi-arid Kenya.

1. Introduction

Optimizing soil health, including soil organic carbon (SOC), is crucial for smallholder farmers in Africa. It increases crop yield, manages fertilizer use, and enhances resilience to climate change [1]. To achieve these benefits, farmers must simultaneously apply carbon-rich organic materials, such as manure and crop residues, along with mineral fertilizers [1,2]. The growing human population has led to the expansion of agriculture into previously fallow land, significantly affecting SOC and its role in ecosystem functions, such as climate regulation [3]. The amount of SOC in cultivated soils has continued to decrease [1]. Arable agriculture reduces plant litter inputs to the soil, as harvested crops remove a significant portion of organic carbon compounds stored in plant residues. It also contributes to soil erosion, which displaces C-rich surface soil and makes organic matter more susceptible to biological decay. This occurs because soil aggregates are disrupted, and new litter is added to the soil [4]. A previous study [5] reported that overall, irrigated agriculture increased SOC stocks by 5.9%, with changes in SOC varying by climate and soil depth. The greatest increase in SOC was observed on irrigated semi-arid sites at the 0–10 cm depth (14.8%). However, in Kenya, less than 2% of the total cultivated area is irrigated. Therefore, crop production in Kenya primarily relies on rain-fed conditions [6], further contributing to the decline in SOC stocks. This irrigated area also experiences nutrient imbalance due to consistently low fertilizer use, which is a major cause of low soil fertility in sub-Saharan Africa [7]. Low soil fertility undermines SDGs, including poverty alleviation, hunger reduction, and environmental sustainability.
In Kenya and sub-Saharan Africa, maize is one of the most important staple crops [8,9]. However, prolonged cultivation of maize without sufficient external assistance has been linked to a decline in SOC and yield. A recent study incorporating data from four long-term experiments found that continuous maize farming in sub-Saharan Africa without organic resource inputs resulted in significant SOC losses, averaging 2% per year of initial SOC [8]. These experiments were established with identical treatments in moist to dry climates of western and central Kenya, on coarse to clayey soil textures, for at least 16 years. Another long-term field trial using silage maize monoculture showed a deterioration of soil organic matter. In unfertilized control plots, the amount of carbon in the topsoil dropped by 22% over a 26-year period [10]. Integrated Soil Fertility Management (ISFM) is a potential solution to this problem by increasing soil organic matter [11,12,13]. A past study [14] found that adding organic carbon to the soil significantly increased SOC content in treatments with crop residues, mineral fertilizer, and animal manure compared to the control. Similarly, a study in China [15] reported a significant increase (16–132%) in the amount of carbon sequestered in vertisols after 34 years of continuous organic fertilization, as opposed to inorganic fertilization. Based on their findings, the authors of [11] concluded that applying goat manure, intercropping with legumes, and incorporating maize residues into the soil systematically increased SOC in most examined soil fractions and depths, highlighting the importance of organic inputs in sustaining and enhancing SOC.
Due to the massive resources and lengthy duration required to establish and maintain long-term field trials, crop and soil modeling has emerged as a crucial tool for rapidly and effectively assessing the best management approaches [16]. Once the models are calibrated and their outcomes evaluated with local on-farm experiment results, they can provide valuable insights into improving food production for growing populations [16]. In this study, the DNDC model was applied to predict SOC, maize grain yield, and daily CO2 and N2O fluxes in a long-term field experiment in central Kenya. In semi-arid Kenya, such studies aim to inform farmers about effective fertilizer and plant residue application strategies that can enhance maize yields and sequester more carbon [17]. The DNDC model is widely used and has successfully simulated carbon and nitrogen cycles, as well as greenhouse gas emissions, in agricultural settings worldwide [18]. According to [19], the DNDC model accurately predicts these variables in agricultural land. Similarly, ref. [20] used the DNDC model to compare predicted and measured nitrous oxide fluxes and maize yields under different soil fertility management practices in Kenya.
While ISFM is progressively recommended for African agricultural practices across distinct agroecological zones [21], typically, farm-level organic inputs like manure are insufficient to supply all the necessary nutrients [22]. Furthermore, a lack of fundamental knowledge needed to develop and promote sustainable, integrated fertilizer recommendations specific to crops and soils hinders farmers in various agroecological zones from maximizing yields and utilizing fertilizers effectively [22]. Therefore, further exploration through field data and model simulations is needed to optimize the use of fertilizers with manure and straw, particularly in semi-arid regions of Kenya where traditional research has proved inadequate [23]. This study hypothesizes that applying fertilizer alongside manure or straw over time will increase soil organic carbon, enhance maize yields, and reduce greenhouse gas emissions associated with exclusive use of mineral fertilizers. The current study conducted in central Kenya aims to (1) investigate the impact of sole mineral N or combined with animal manure or straw or both on SOC, grain yield of maize, and CO2 and N2O emissions; (2) evaluate DNDC for simulating the SOC dynamics of soil and for predicting yield, CO2, and N2O; and (3) estimate equilibrium quantities of N, manure and maize residue for SOC sequestration, maize yield, and greenhouse gas mitigation based on their sensitivity to different N, manure, and maize straw application rates.

2. Materials and Methods

2.1. Site Description

2.1.1. Location

The data were continuously collected from a long-term experiment established in 2014 and conducted until 2022. The site was at the Jomo Kenyatta University of Agriculture and Technology farm (1°05′ S, 37°01′ E) in Juja, approximately 35 km from Nairobi in Kenya. The area has a semi-arid, subtropical highland climate. The area experiences bimodal rainfall: a long rainfall season from March to May and a short rainfall season from October to November [16,24]. The area remains mostly dry throughout the year. Timely land preparation, maize planting, and farm management activities in relation to unpredictable rains are crucial for crop yield. The area has a low water table, and in some years, heavy rains in April cause flooding, mainly due to the vertisol soils. These two extremes, long dry spells and short heavy rains (accompanied by floods), significantly impact soil processes and nutrient flow. As a result, microbial biomass carbon and crop yield are affected [25,26].

2.1.2. Soil

The site’s soil is a poorly drained chromic vertisol [27]. The basal soil properties at the beginning (2014) of this study were 62.9% clay, 23.6% sand, and 13.6% silt, with available nitrogen at 175 ppm, soil organic carbon at 20.53 g kg−1, bulk density at 1.58 g cm−3, and total nitrogen at 1.55 g kg−1. The soil also had a pH of 5.5 and a cation exchange capacity of 36.5 (cmol kg−1). These soil properties were analyzed in the laboratory using particle size analysis, alkaline permanganate, the Nelson and Sommer, core sampling, Kjeldahl digestion, pH meter, and barium chloride methods, respectively.

2.1.3. Layout of Experiment

The experiment was set up in a randomized complete block design (RCBD) with six treatments replicated four times. The treatments were (1) no nitrogen (N0), (2) N at 25 kg ha−1 as a basal dose using diammonium phosphate (DAP) followed by another 25 kg ha−1 as topdressing using urea (N50), (3) N at 50 kg ha−1 as a basal dose using DAP followed by another 50 kg ha−1 as topdressing using urea (N100), (4) N100 along with 3 t ha−1 of cattle manure containing 2.0% N (N100M), (5) N at 75 kg ha−1 as a basal dose using DAP followed by another 75 kg ha−1 as topdressing using urea (N150), and (6) N100 along with 5 t ha−1 of maize straw containing 0.5% N (N100S). The experimental plots were 80 m2 (10 m × 8 m).

2.2. Field Management and Data Collection

The treatments and management practices during the experiment are summarized in Table 1. The data include five crops grown during the long rainy season and one during the short rainy season, totaling six growing seasons. However, crop failure occurred in most short rainy seasons due to insufficient rainfall. Additionally, during the long seasons of 2016, some plots had missing yield data due to livestock invasion. Therefore, the decision was made to exclude the entire 2016 yield data in this study. Data for CO2 and N2O emissions were collected for only three treatments (N0, N100, and N100M) due to limited gas collection and analysis resources. However, we acknowledge that the choice of these three treatments may limit some conclusions in this study and that future studies may need a broader choice of treatments.
The field was plowed to a depth of 20–30 cm before the seasonal rains. The soil was then allowed to dry for at least two days before being harrowed to break up any large lumps. Maize (Zea mays L.) planting was always conducted at the onset of the rainfall, mainly in April and November for long rain and short rain seasons, respectively. Maize seeds were manually sown with a string marking each row and spaced 30 cm apart, using a sharpened stick for digging. The seeds were placed 2.5 cm deep, with two seeds per hole. Each plot contained 15 rows, averaging 33 plants per row and a density of 500 plants per plot. The spacing between rows was intentionally alternated between 40 and 70 cm for ease of movement in the field. At maturity, the crop was manually harvested by cutting each plant close to the ground. The cobs were air-dried for weeks before being shelled and weighed. Maize growing was purely rainfed. However, occasionally during the germination stage or very dry month when the maize crop showed very serious signs of water stress (wilting), sprinkle overhead irrigation was applied to supplement the rainwater. During the growing seasons of 2017 and 2018, there was the use of a pesticide (ESCORT 19 EC Emulsifiable Concentrate) to control the potential threat of the fall armyworms that had invaded the neighboring farms. The pesticide was applied regularly on the plants using a hand manual knapsack sprayer pump to inhibit possible armyworm invasion.
Soil samples were taken at five random locations within each plot, at a depth of 0–15 cm, at the beginning of the first season and at the end of each season. Five soil samples from each experimental plot were combined and thoroughly mixed to make a composite sample per experimental plot. The composite samples were placed in zip-lock sampling bags for laboratory analyses. After air drying, the samples were sieved through a 2 mm mesh screen. The SOC for each sample was analyzed using the Nelson and Sommer method [28].
The plant growth parameter was monitored by randomly selecting 4 maize plants per treatment. The plant growth parameters recorded included plant growth date, plant height, and leaf count. The biomass (dry matter) data were collected by cutting randomly selected plants. The whole plant samples were dried at 70 °C for 48 h in an oven, and the dry weight of each treatment was recorded.
After complete drying, cobs were shelled, and the grains were air-dried to a final moisture content of 12% under ambient conditions. The weight was recorded and converted into grain yield (kg ha−1). As a result of the DNDC model simulating the crop biomass as the C content in grain, root, and leaf (kg C/ha−1), the maize crop yields used to compare the predicted yields were estimated from measured grain yields (kg ha−1), multiplied by 0.4 (1 kg dry matter contains 0.4 kg C based on DNDC manual: https://www.dndc.sr.unh.edu/model/GuideDNDC95.pdf; accessed on 16 January 2025). After maize harvesting, a portion of the residues was cut into smaller pieces using a tractor-mounted cutting machine and stored in sacks for use in the next season’s N100S treatment.

2.3. Gas Measurement and Chromatography
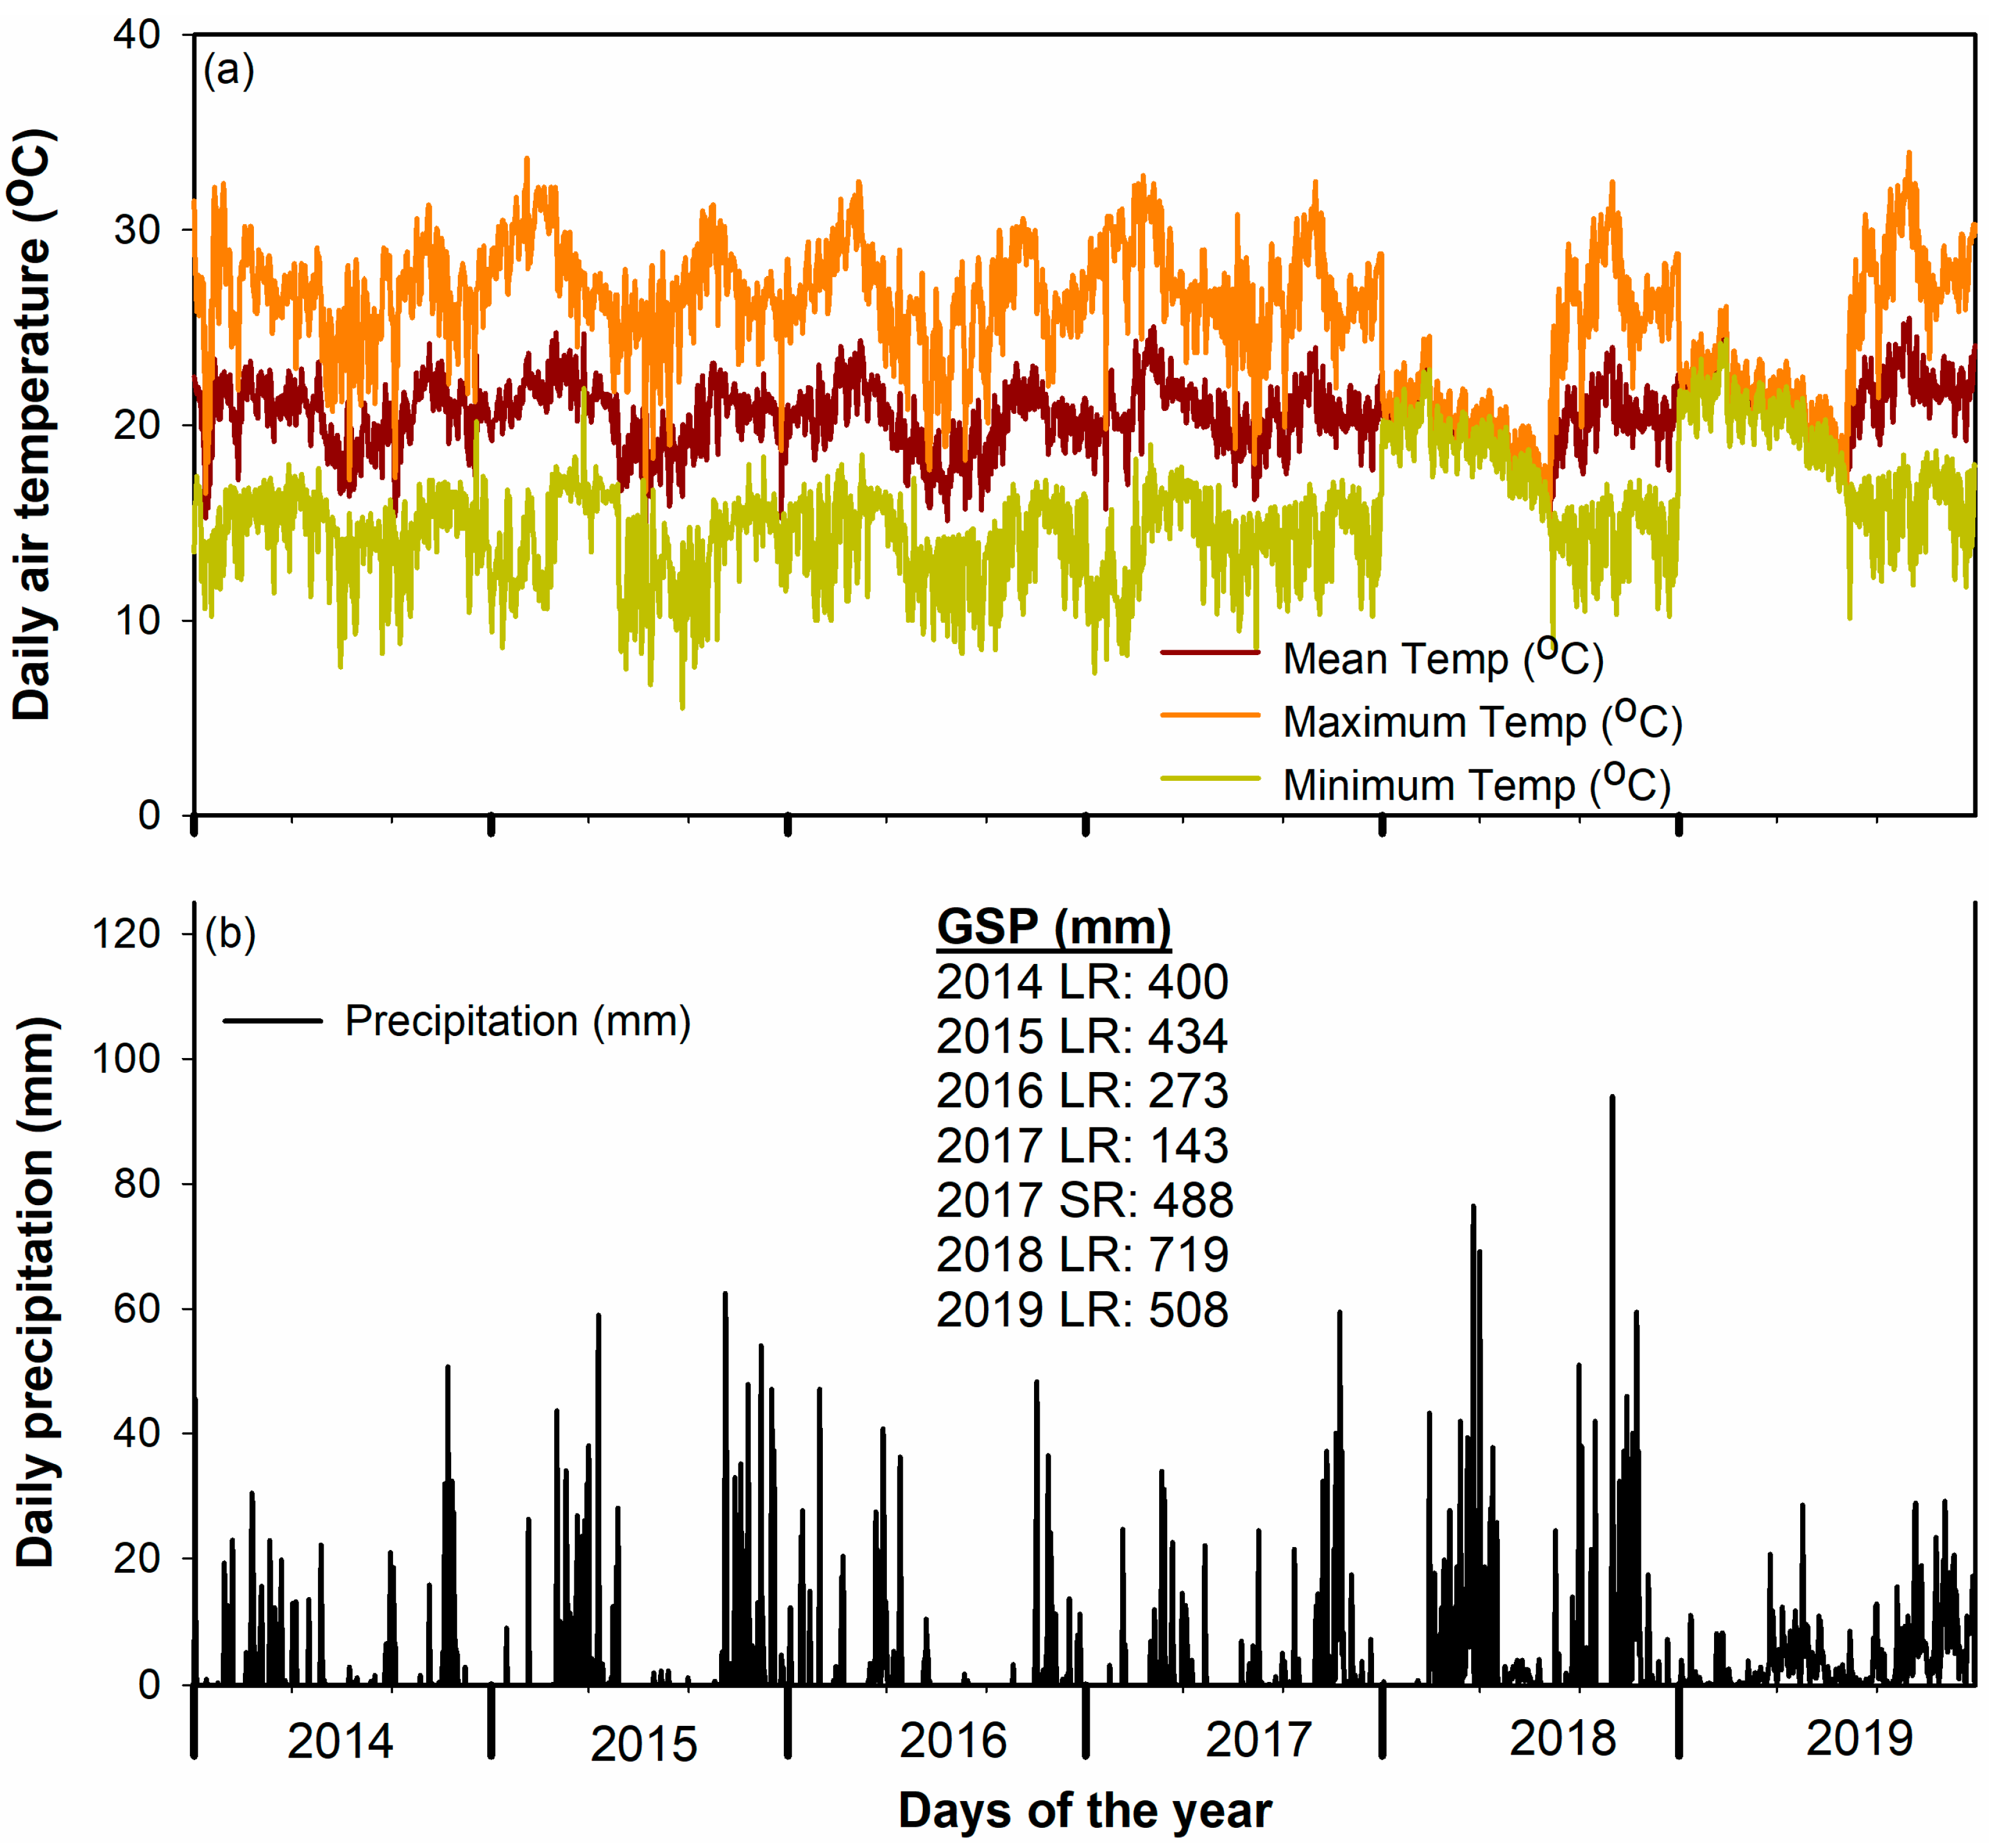
The soil CO2 and N2O fluxes were determined using a manual, non-flow-through, non-steady-state chamber [24]. Sampling took place twice a week during the rainy season (April-May), for the two weeks after fertilization, and once a week for the rest of the growing seasons [29]. Briefly, each treatment’s opaque plastic bases (25 × 35 cm) were positioned 7.5 cm into the ground after plowing and remained there throughout the growing season. The chamber’s height was measured from the outside to record any minor variations from soil compaction. Vented and ventilated opaque plastic lids (25 × 35 × 12.5 cm) were clamped to the bases during deployment to ensure an airtight seal. To reduce temperature fluctuations during chamber deployment and obtain accurate daily mean fluxes, gas samples were taken between 9:00 and 11:00 in the morning [30], and the top of the chamber was lined with reflective duct tape. Gas samples were taken every 10 min starting at T0 (shortly after the gas chamber was closed) and continuing until T4 (30 min after the gas chamber was closed). Each sampling involved drawing 20 mL of gas from each of the two replicates per plot (due to limited gas chambers, a limitation already acknowledged) using a propylene syringe equipped with a Luer-lock. The entire 40 mL was then injected into a glass vial that had been previously emptied to store the gas [31]. The gas-filled glass vials were transported immediately to the laboratory in a box for analysis. Where analysis was not possible, the vials were stored in the laboratory for a few days before being analyzed.
The concentrations of CO2 and N2O were analyzed using SRI gas chromatographs (8610C; SRI). Carbon dioxide was detected using a flame ionization detector (FID) after going through a methanizer, while nitrous oxide was detected using an electron capture detector (ECD). The chromatograph’s operation involved Hayesep-D packed columns, and N2 was fed into both detector lines at a flow rate of 30 mL min−1. The methanizer and ECD were set to 350 °C, while the oven was set at 65 °C [32]. The peak areas of the samples were then compared to the areas of standard gases with known concentrations of CO2 and N2O, allowing conversion of the peak areas from the GC into concentrations.
Gas flux rate Fr (µg m−2 h−1) was calculated using the following equation as described in the recent publication [33]:
F r = d c d t × M V 0 × V A × 273 273 + T × P P 0 × 60
where dc/dt is the regression slope of the changes in gas concentration over time in the chamber (ppbv min−1); M is the relative molecular mass of N2O (44 g mol−1), CO2 (44 g mol−1), and CH4 (16 g mol−1); V0 is the volume of an ideal gas (22.41 g mol−1); V is the volume of the chamber (m3); A is the soil surface area occupied by the chamber base (m2); T is the temperature (°C) inside the chamber; P is the atmospheric pressure (hPa) during gas sampling; P0 is the standard atmospheric pressure (hPa); and 60 is the conversion factor for minutes to hour.
Finally, the daily flux rate for determining the effects of variables such as fertilizer input and rainfall was calculated using Equation (2).
DFr = Fr × 24/100,000 (kg ha−1 day−1)
where DFr is the daily flux rate, Fr is the hourly flux rate, and 100,000 is for converting from µg m−2 to kg ha−1.

2.4. Weather Data

Weather parameters required for running and calibrating the DNDC model (e.g., daily precipitation, solar radiation, maximum and minimum air temperatures) were collected from an automated weather station (ET107, Campbell Scientific, Logan, Utah) installed in the field in November 2016. For the period before installation, weather data were obtained from the Kenya Agricultural and Livestock Research Organization weather station, located about 9 km away in Thika. Figure 1a,b summarize the monthly mean air temperatures, precipitation, and growing season precipitation for the six years. Notably, monthly average temperatures ranged from 17.2 °C in July 2018 to 23.0 °C in February 2019. The monthly rainfall varied between 0 mm and 395.3 mm, while the annual rainfall ranged from 771 mm to 1443.6 mm. The six growing seasons experienced varying levels of rainfall, ranging from 143 mm in 2017 to 719 mm in 2018.

2.5. Simulation

The latest version of the DNDC model, version 9.5, was downloaded from http://www.dndc.sr.unh.edu, accessed on 3 March 2024 and used for simulations from March to June 2024. The DNDC model, originally developed to predict greenhouse gas emissions, was later enhanced to simulate soil water movement, crop growth, and soil carbon and nitrogen dynamics through integrated sub-models [34]. The DNDC model comprises two main components: (1) modules for soil climate, crop growth, and decomposition, which estimate soil temperature, moisture content, and carbon and nitrogen dynamics, and (2) modules for nitrification, denitrification, and fermentation, which simulate greenhouse gas emissions (e.g., CO2, N2O, NH3) from plant–soil systems [35]. In this study, the DNDC model was employed to simulate carbon and nitrogen turnover, focusing on SOC dynamics, maize yield, and greenhouse gas emissions under different management practices in semi-arid Kenya.
The model was calibrated to predict the measured SOC, maize grain yields, and fluxes of carbon dioxide and nitrous oxide from the treatment N100, which represented the most representative conditions. The model was initially run with measured and default input parameters (Table 2 and Table 3). Then, it was calibrated by optimizing soil characteristics such as bulk density, pH, texture, and initial soil organic carbon, as well as crop growth parameters including maximum biomass output, thermal degree days, and ideal temperature. The soil parameters were modified uniformly across all layers, and crop growth parameters were specific to maize in this study. Each parameter value was adjusted by ± 5%, informed by the prior literature and expert knowledge, and the optimal values were identified by minimizing the root mean square error (RMSE) between predicted and measured values. The predicted SOC, grain yields, and fluxes of N100 were evaluated using the deviation statistics to ensure that the predicted values closely matched the actual values. The five deviation statistics included root mean square error (RMSE), mean error (E), normalized RMSE (nRMSE), index of agreement (d), and modeling efficiency (EF) [34,36]. These statistical analyses were performed to evaluate the model’s performance (accuracy of predictions and robustness of outputs). Following this, the model outputs were validated using the remaining five treatments.
A detailed sensitivity analysis was conducted for key weather and soil parameters across four treatments (N0, N100, N100M, and N100S). Parameters were adjusted incrementally (±5–30%) on a one-at-a-time approach to evaluate their influence on SOC, yield, and gas fluxes. As a result, the 24 manually created weather datasets differed greatly across different years in the sequence. For weather variables, soil CO2 and N2O fluxes were analyzed under temperature variations of −3 °C to +3 °C and precipitation changes of −30% to +30%. These range of variations were based on observed climate variability in the study region.

2.6. Statistical Analysis

The following formulas were employed to calculate the five deviation statistics:
E = i = 1 n ( S i M i ) n
R M S E = i = 1 n ( S i M i ) 2 n
n R M S E = R M S E M ¯ × 100
d = 1 i = 1 n S i M i 2 i = 1 n S i M ¯ + M i M ¯ 2
E F = 1 i = 1 n S i M i 2 i = 1 n M i M ¯ 2
where Si is the simulated or predicted value, Mi is the actual or measured value, n is the number of values, and M ¯ is the average of the measured values. The average difference between observed and anticipated values is summarized by the RMSE [34]. The nRMSE is an unbounded statistic that indicates the relative magnitude of the average difference without units [34]. We consider nRMSE < 15% to be “good” agreement, 15–30% to be “moderate”, and ≥30% to be “poor” agreement for small sample datasets (e.g., n = 5, 6, or 14) used in this study [35,37]. The index of agreement (d) (0 ≤ d ≤ 1) is intended to be a descriptive measure, and it is both a relative and bounded measure [34]. As recommended by [37], when d ≥ 0.9, this indicates “excellent” agreement; when 0.8 ≤ d < 0.9, then we consider this as “good” agreement; when 0.7 ≤ d < 0.8, there is “moderate” agreement; and when d < 0.7, there is “poor” agreement between measured and predicted values.
The paired t-test was used to determine the statistical significance of discrepancies between the predicted and measured values. The efficacy of the model was assessed by fitting a linear regression (y = bx + a) to establish the relationship between predicted (y) and measured (x) values [16,20]. The significance of the slope, intercept, and correlation coefficient was analyzed to indicate the extent of systemic bias. Analysis of variance to compare the differences in values among treatments was conducted using Minitab software version 17. Where a significant effect was found, a post hoc test was conducted using the least significant difference (LSD) test at a significance level of p < 0.05.

2.7. Scenario Analysis for Optimal Practices

Following the statistical validation of the model, long-term scenario simulations were conducted to explore the effects of varying nitrogen inputs and application methods on key outputs. This study utilized the validated DNDC model to run different long-term (40 years) scenarios. Usually, the annual average change in SOC per unit area of cultivated land is slight. Therefore, a long period of 40 years was considered to accurately reflect the true long-term change in SOC [38]. The scenario analysis included inorganic fertilizer treatments (N50, N100, N150) and organically amended treatments (N100S, N100M, N100S1, and N100SM). Straw and manure application rates and methods were varied to represent different nitrogen input scenarios ranging from 125 to 185 kg N ha−1. Additionally, two manure and straw application scenarios were created: one where all the straw produced from the N100 treatment was returned to the field, estimated at 10 tons ha−1 (N100S1), and a second scenario where N100 was organically amended by applying both straw (5 tons ha−1) and manure (3 tons ha−1), referred to as N100SM. The manure treatment (N100M) included 3 tons ha−1 of 2% nitrogen-rich manure, translating into a total nitrogen input of 160 kg ha−1 (N100 from inorganic fertilizer + N60 from farmyard manure). In contrast, 5 tons ha−1 of 0.5% nitrogen-rich maize straw was used to mulch the N100S treatment, resulting in a nitrogen input of 125 kg ha−1 (N100 from inorganic fertilizer + N25 from maize straw). Thus, on average, N100S1 and N100SM corresponded to total N inputs of N150 and N185 kg ha−1, respectively. These two treatments (N100S1 and N100SM) were selected to represent high organic fertilizer input (viable locally) and to compare their effects on SOC, yield, and greenhouse gas emissions when each or both are combined with mineral fertilizer.
Besides the application rates, this study also predicted the impact of various methods for applying straw and manure using four organically amended treatments: N100S, N100M, N100S1, and N100SM. It evaluated the long-term effects of applying straw or manure to the soil surface and incorporating it into the soil at two depths of 15 cm and 30 cm, based on agronomic practices. The model was run under three climatic regimes based on historical weather patterns in Juja, a semi-arid area. The first regime, “normal climate”, was based on data from years when all measured weather parameters fell within the typical range for a semi-arid climate, such as 2015 (annual rainfall: 1098.9 mm; monthly mean temperature: 18.4 °C to 22 °C). The second regime, “dry climate”, utilized data from arid years, exemplified by 2017 (annual rainfall: 771 mm; monthly mean temperature: 19 °C to 22.9 °C). Lastly, the “wet climate” regime was based on data from wet years, such as 2018 (annual rainfall: 1409.1 mm; monthly mean temperature: 17.2 °C to 21.5 °C).

3. Results

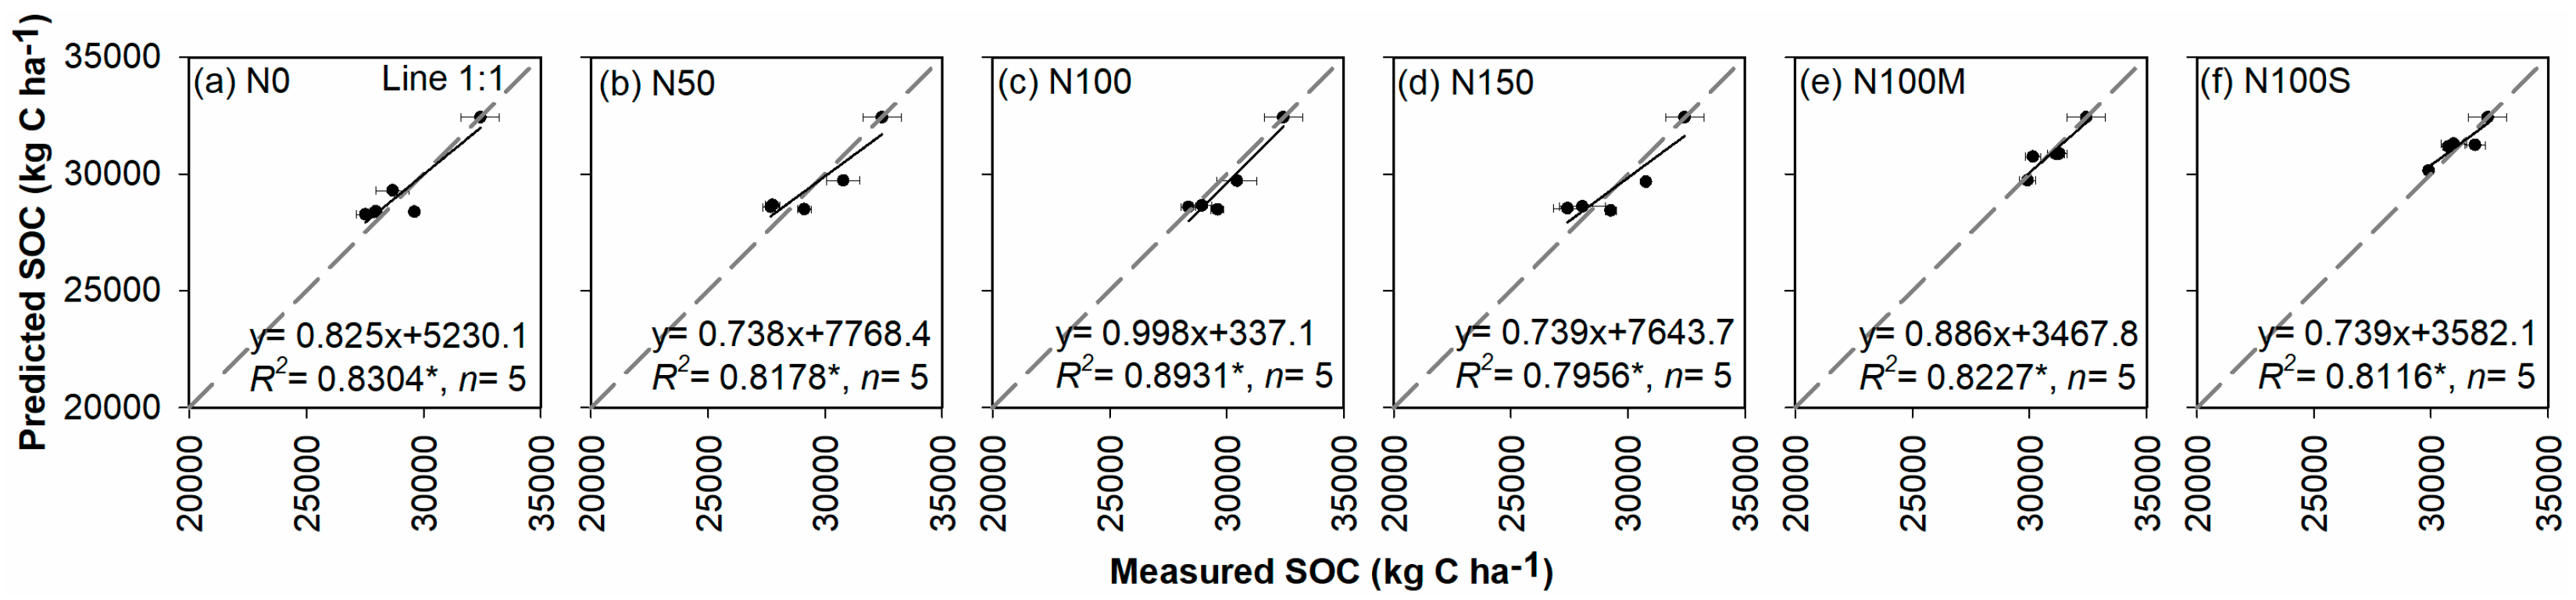
3.1. Dynamics and Evaluation of Soil Organic Carbon

The measured topsoil SOC, averaged over six years (2014–2019), varied among treatments. SOC was lowest in the control (N0: 29,238 ± 1951 kg C ha−1) and increased with fertilizer-only treatments (e.g., N100: 29,956 ± 1581 kg C ha−1). The highest SOC was observed in organically amended treatments, with N100M (30,982 ± 1002 kg C ha−1) and N100S (31,183 ± 991 kg C ha−1) outperforming all other treatments (Table 3). SOC decreased over time in treatments receiving only fertilizer (N0, N50, N100, N150; Figure 2a–d). In contrast, organically amended treatments (N100M and N100S) showed stable SOC levels from 2016 to 2019, likely due to the sustained addition of organic material (Figure 2e,f). The average SOC was lower under N0 and all the treatments that received only fertilizer N (N50, N100, and N150) compared to the two organically amended treatments (N100M and N100S) as shown in Figure 2a–f, though not significantly. Consequently, this highlights the agronomic sustainability, enhanced soil health, and climate change mitigation achieved through the combined use of mineral and inorganic fertilizers.
The model validation results demonstrated its effectiveness in predicting SOC under various N conditions: nRMSE = (1.1% to 2.8%), d = (0.93 to 0.96), EF = (0.79 to 0.84) across all individual treatments. These results justify the model’s effectiveness in studies involving long-term SOC management or adaptation to varying N conditions. Pooled SOC data analysis showed excellent agreement between measured and predicted values with nRMSE = 2.2%, d = 1, and EF = 1 (Table 3). A robust linear regression (R2 = 0.74 to 0.89) was observed between measured and predicted SOC in each treatment (Figure 3a–f). The slope of the regression in all treatments was not significantly different from 1 (p > 0.05), and the intercepts of all treatments were also not significantly different from zero (p > 0.05) (slope of regression= 0.8 to 1, R2 = 0.74 to 0.89). There was a significant positive correlation between predicted and measured SOC values in all treatments (p < 0.05). The paired t-tests also showed that the predicted SOC did not significantly differ from the measured SOC in any of the treatments, with the highest agreement seen in N50 (p = 0.95) and lowest agreement in N100 (p = 0.19), as shown in Table 3.

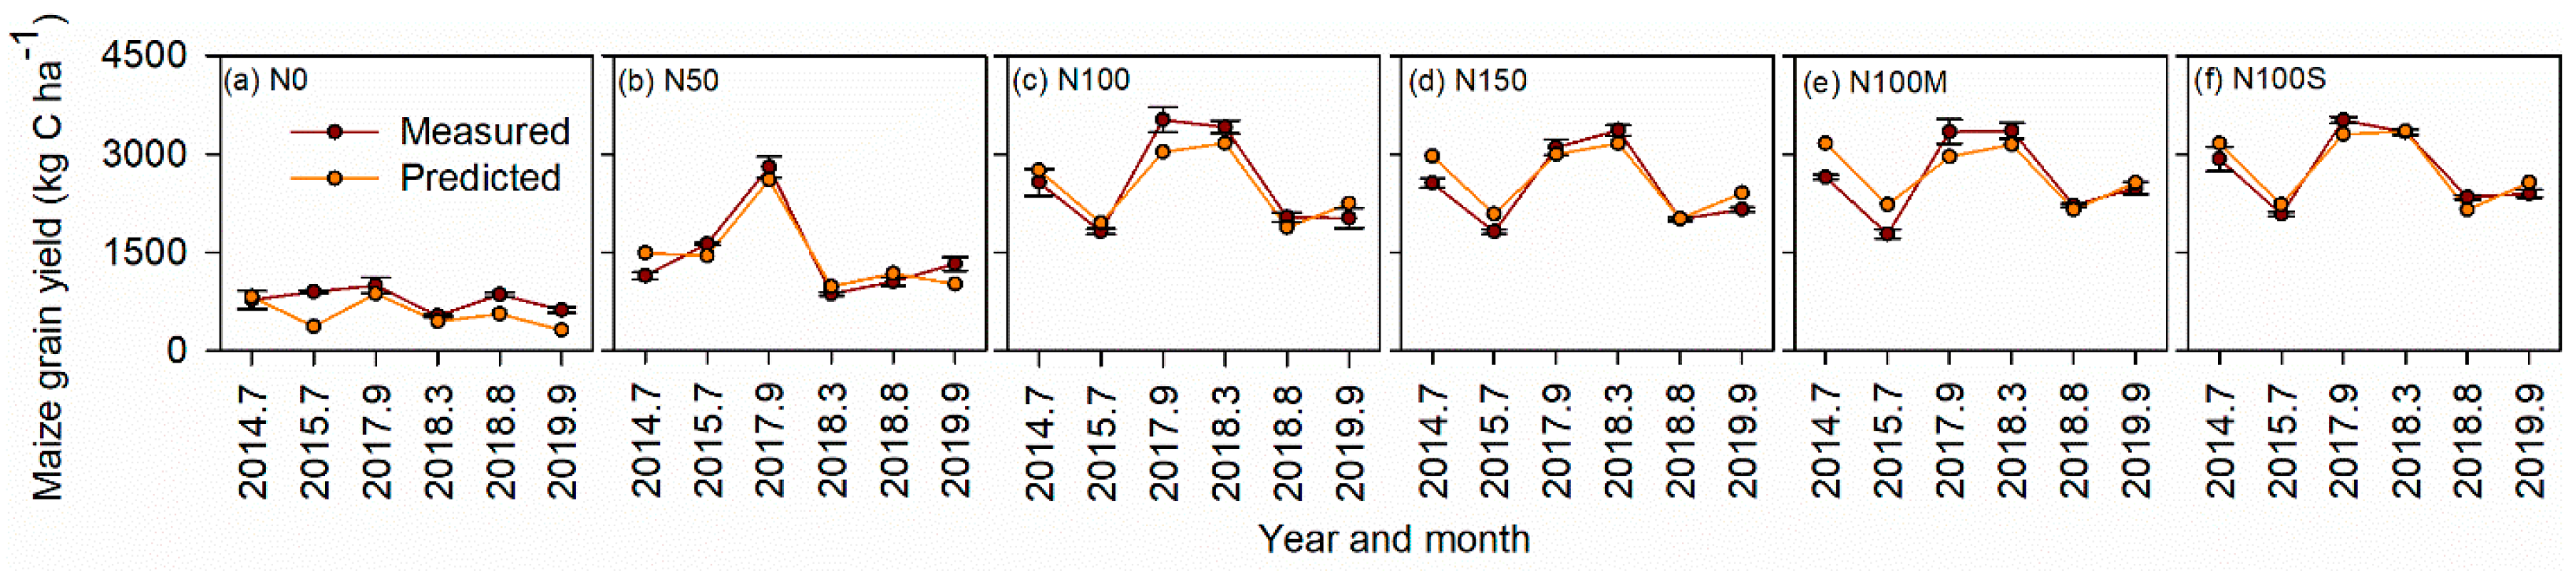
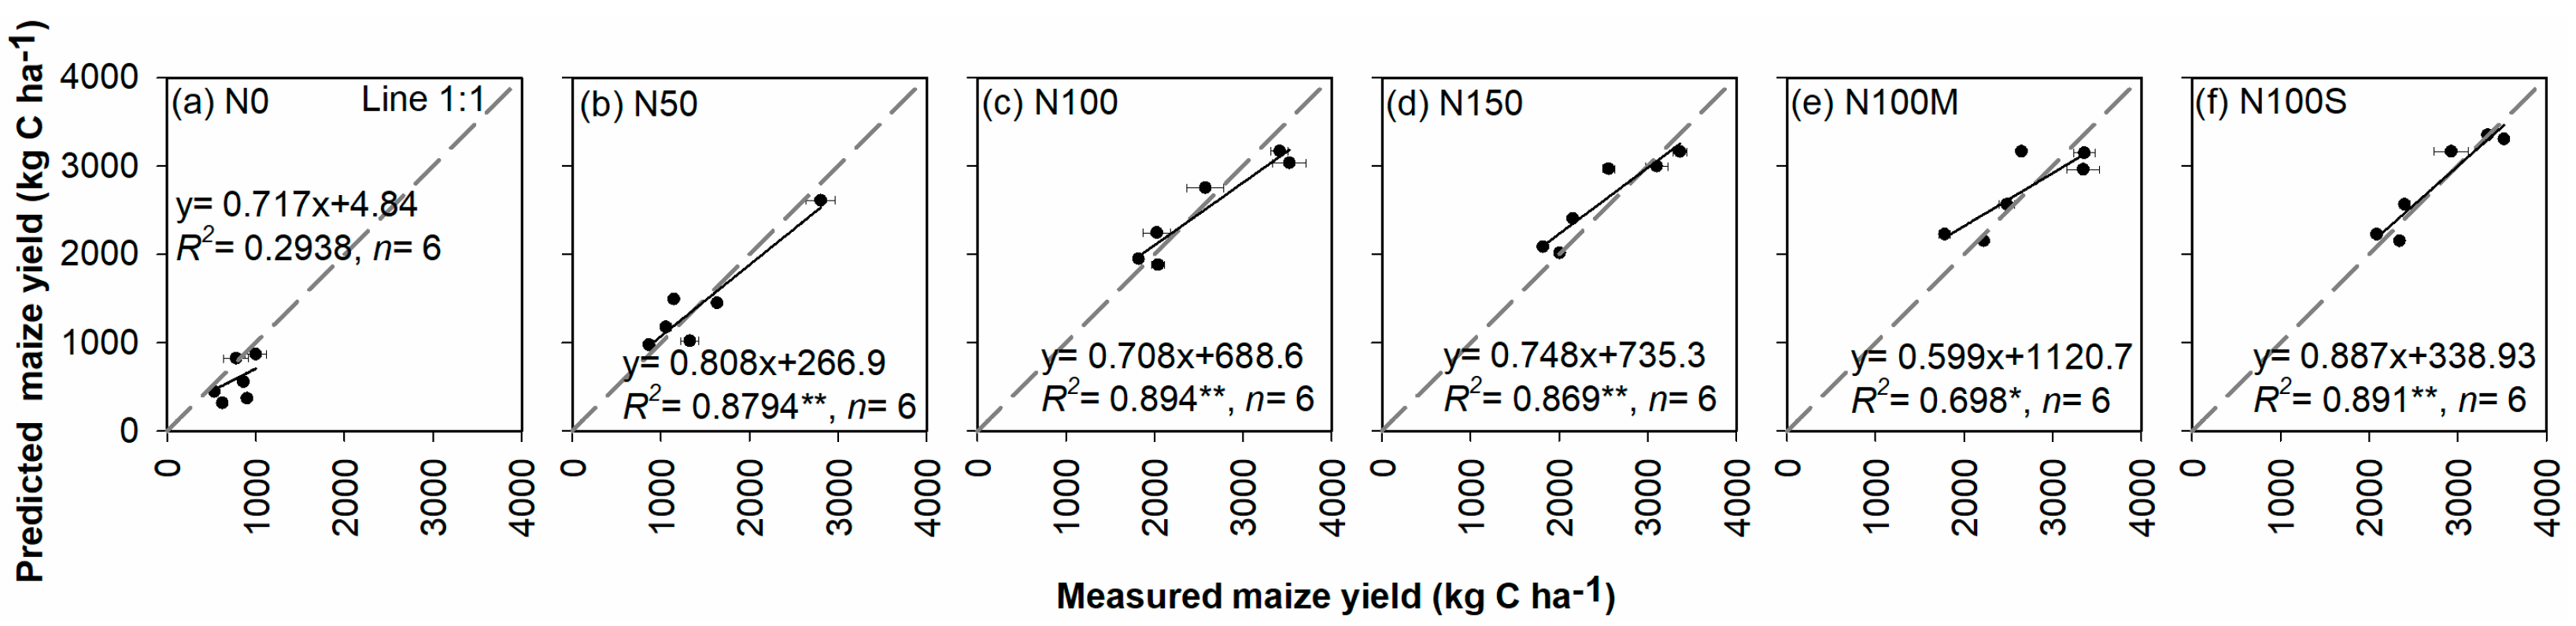
3.2. Dynamics and Evaluation of Maize Grain Yield

Grain yields varied significantly by year, with fluctuations likely influenced by inter-annual weather variability, including rainfall distribution and temperature extremes (Figure 4a–f). During the period of six years, from 2014 to 2019, the average measured maize yield for the control treatment (N0) was 780 ± 177 kg C ha−1, while those for the mineral-fertilizer-only treatments (N0, N50, N100, N150) were 1471 ± 702 kg C ha−1, 2565 ± 744 kg C ha−1, 2501 ± 623 kg C ha−1, respectively. In comparison, the average measured yields for the organically amended treatments (N100M, N100S) were 2640 ± 624 kg C ha−1 and 2769 ± 583 kg C ha−1, respectively. Statistical analysis revealed that average yields for N0 and N50 were significantly lower than those for the other four fertilized treatments (p < 0.0001), while no significant differences were detected among N100, N150, N100M, and N100S. Over six years, grain yields consistently improved with increasing nitrogen rates up to N100 but plateaued at N150. Organically amended treatments (N100M and N100S) achieved comparable yields to N150, indicating the potential for organic amendments to sustain high yields with moderate nitrogen inputs.
The DNDC-predicted maize grain yields showed strong agreement with measured values in all the fertilized treatments with consistently high significance levels, except for the control treatment (N0) (Figure 5). The zero-to-intercept linear regression slope varied among the treatments, with the lowest value witnessed for N100M (0.59), while the rest remained consistently high (0.71 to 0.89). Comparatively, R2 for N0 was 0.29, whereas the rest of the treatments had a consistently high range of 0.68 to 0.89. (Figure 5a–f). These variations suggest that other than N input, the model relied on a wide range of factors such as soil and weather dynamics in predicting maize yield. Consequently, alongside the paired t-test values for all fertilizer treatments (0.33 ≤ p ≤ 0.88), the model can be said to have shown “good to excellent” accuracy in predicting maize yield for the treatments involving N fertilizer as shown in Table 3.
Nonetheless, the model’s ability to simulate maize yields under N0 was poor, with nRMSE =36.4%, EF = −2.11, and d = 0.48. Table 3 highlights statistical differences (p = 0.05) between the measured and predicted maize grain yields, suggesting that the model underestimated the yield of maize grains under this treatment (N0). Further analysis of the pooled maize grain yield data for all the treatments also revealed an excellent match between the measured and the predicted values (nRMSE = 12.2%, d = 1, EF = 0.99) and the paired t-test (p= 0.71) (Table 3).

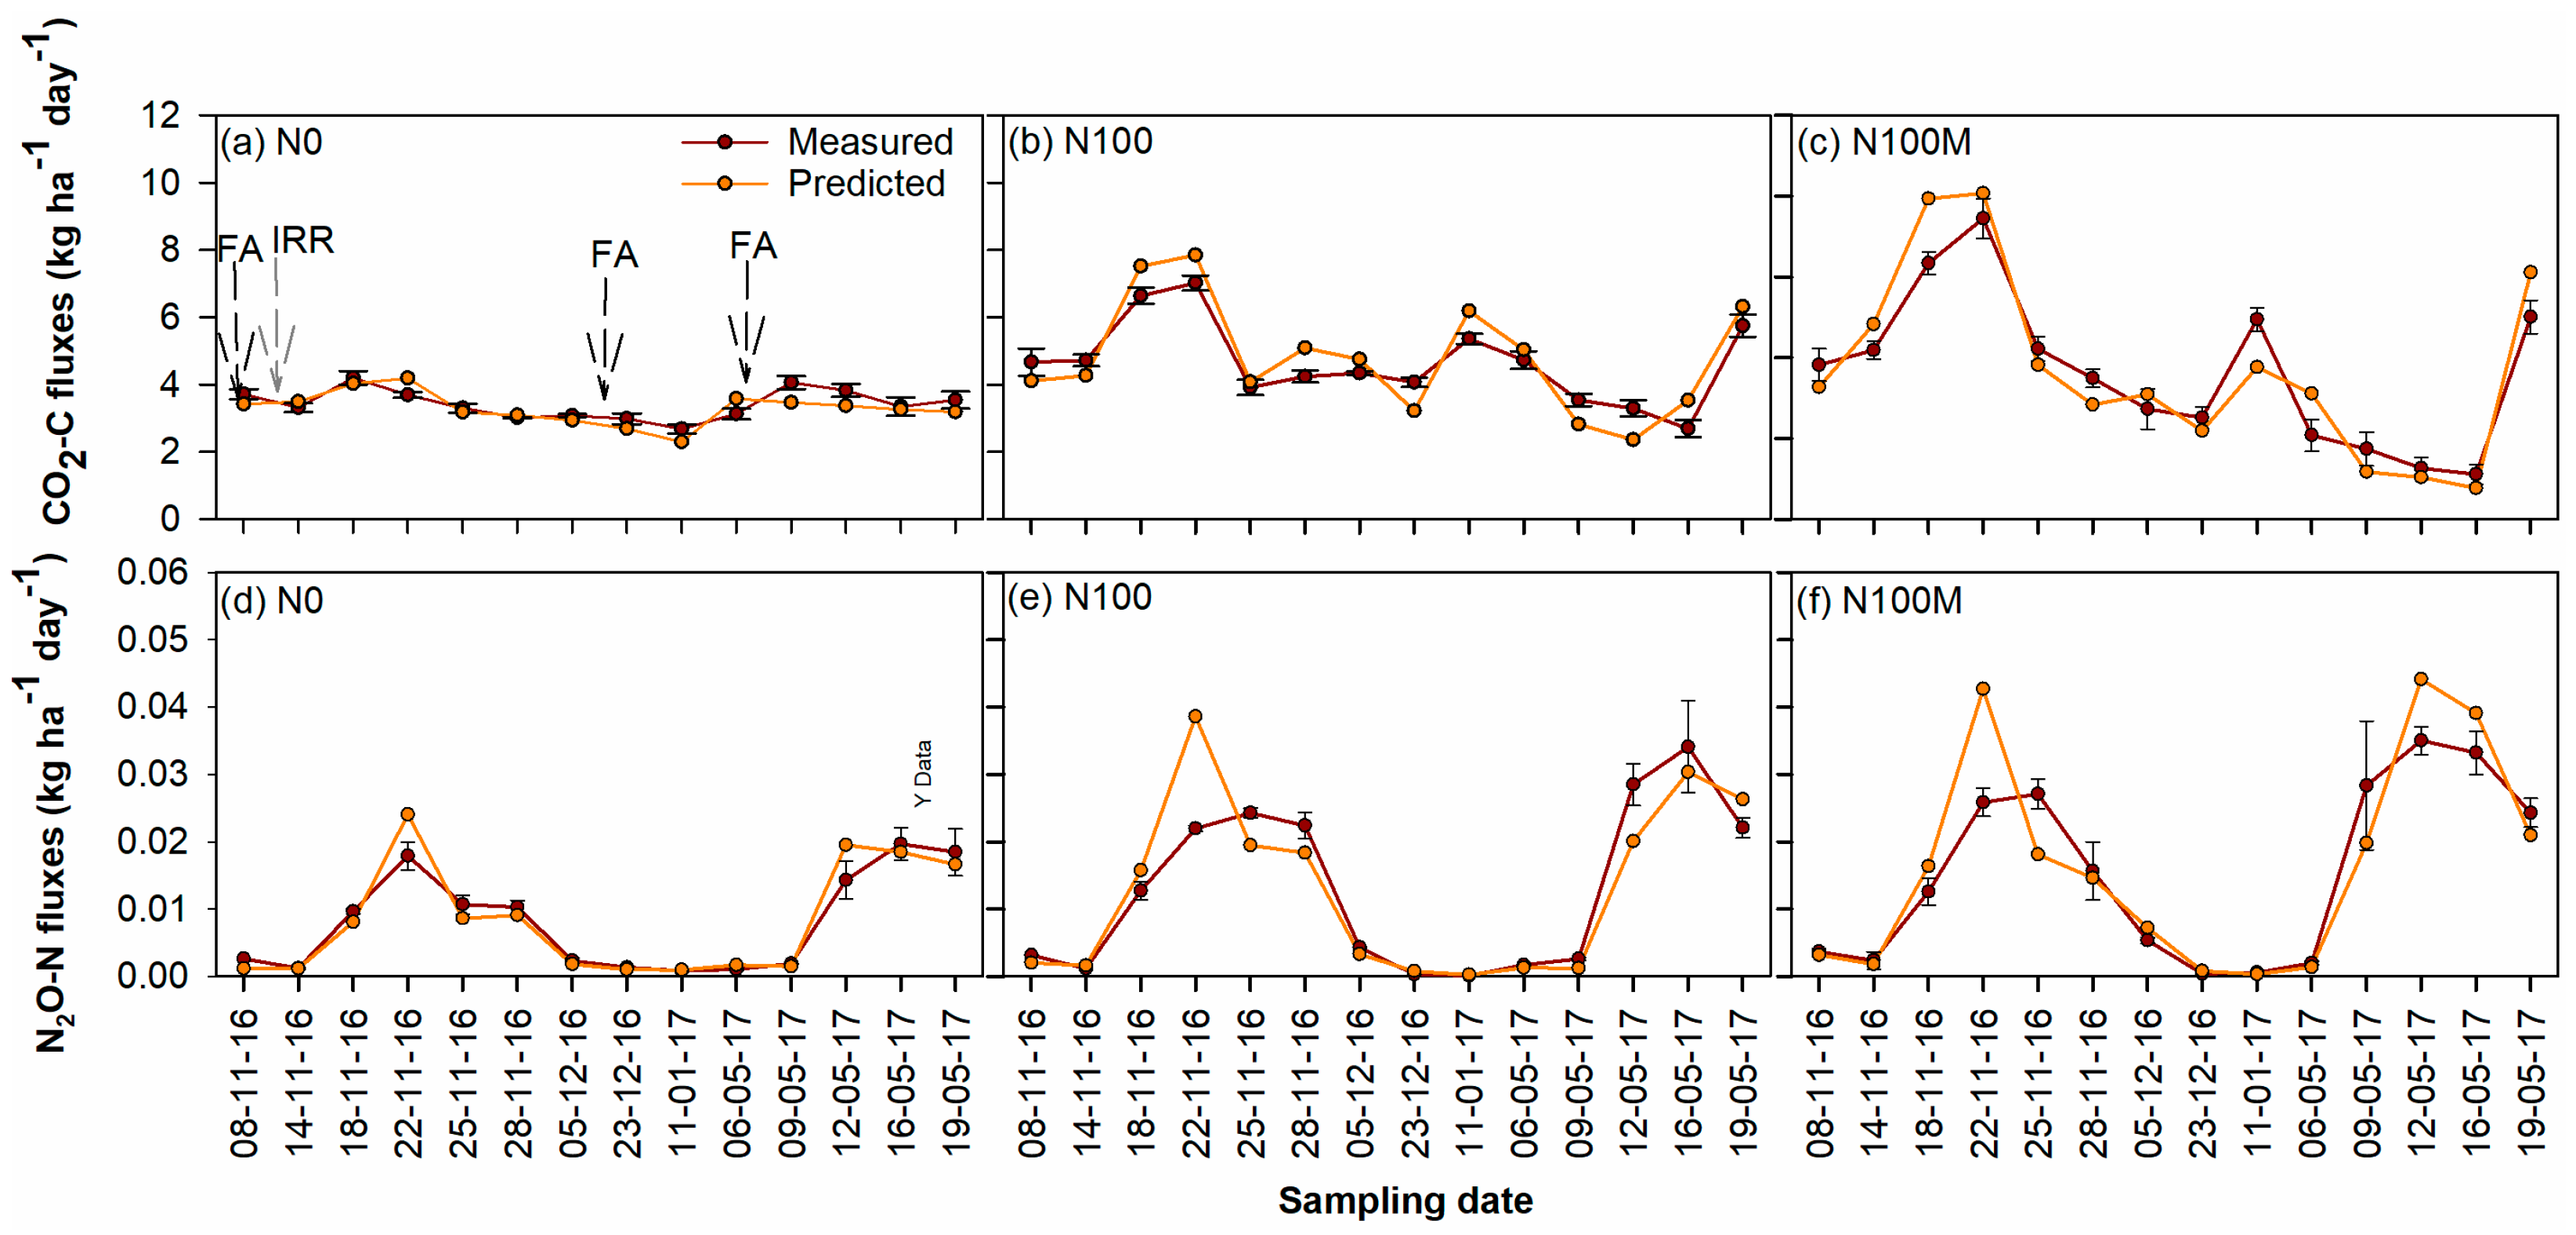
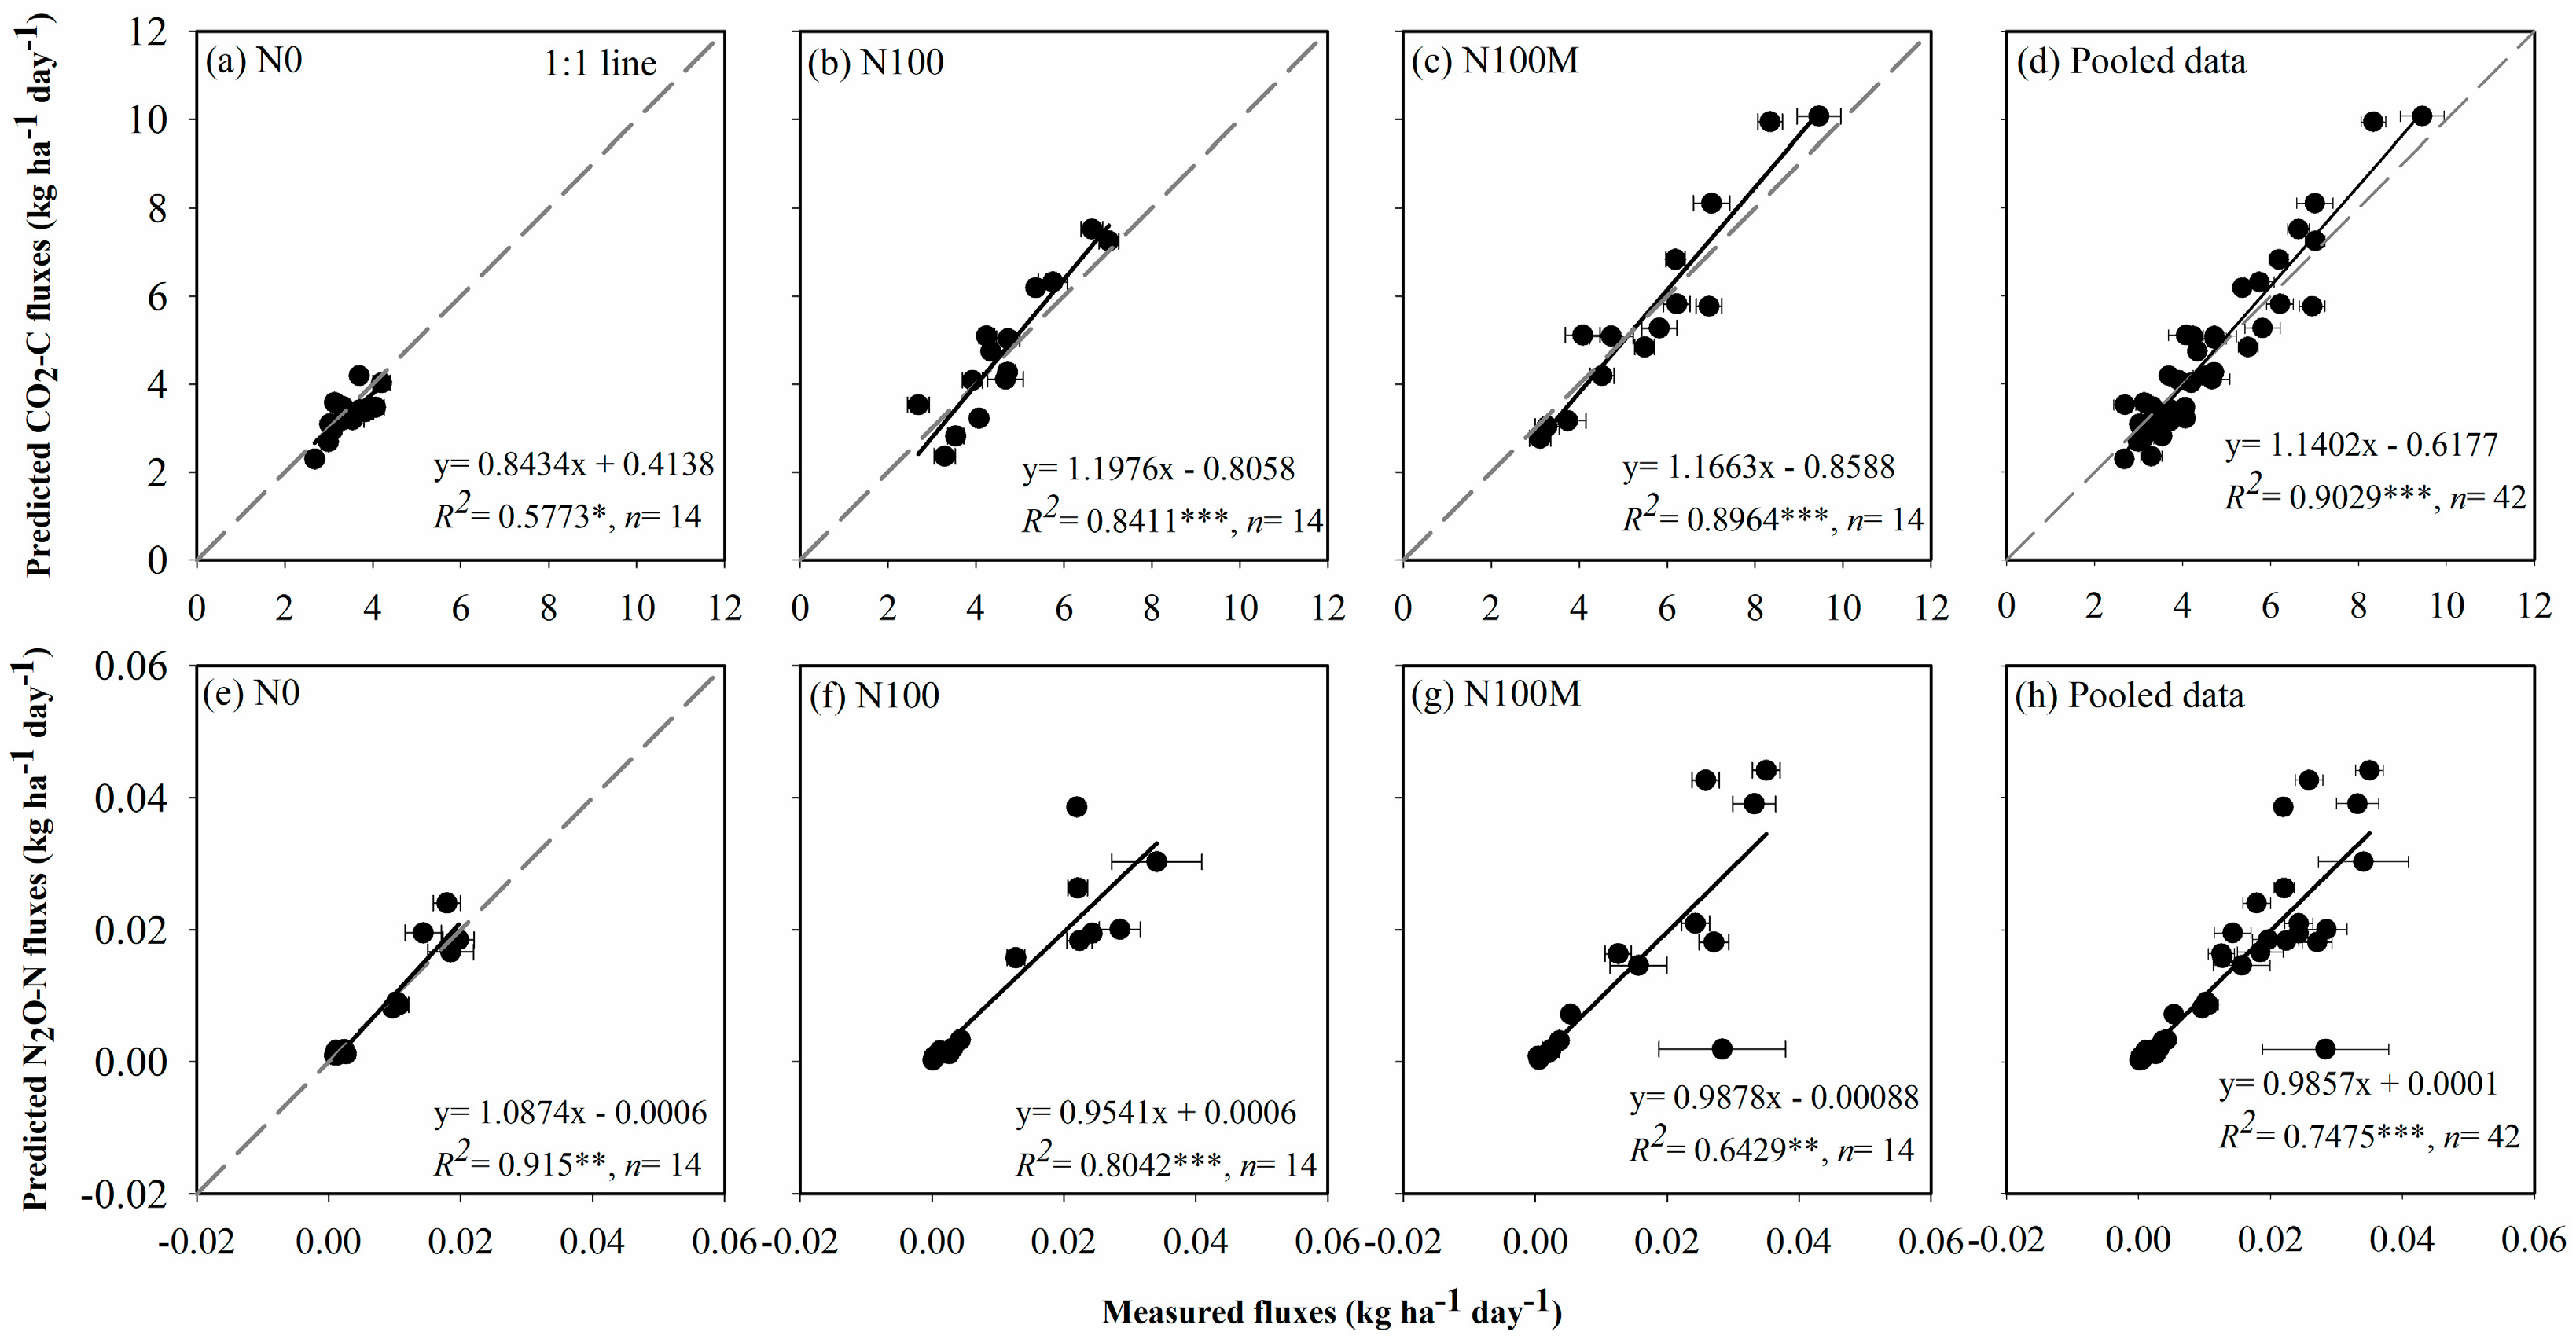
3.3. Carbon Dioxide Fluxes

The predicted daily CO2 fluxes ranged from 2.3 to 10.07 kg CO2-C ha−1 day−1, while the measured daily soil CO2 across different soil fertility technologies varied from 2.68 to 9.45 kg CO2-C ha−1 day−1 (Figure 6a–c). Peak CO2 fluxes were observed following the application of fertilizer and after precipitation. This phenomenon highlights the importance of timely fertilizer application. For instance, in high rainfall areas, fertilizer application should be restricted to periods when rainfall is expected to be below the high norms. This practice can help reduce the compounded effect of fertilizer application and rainfall on greenhouse gas emissions. The measured and predicted CO2 had a similar trend. The average CO2 for the N0 treatment was significantly lower than for any of the other two fertilized treatments (N100 and N100M) (p ≤ 0.001).
The DNDC-model-predicted CO2-C ha−1 day−1 showed a strong correlation with the measured daily emissions in all the treatments (Figure 7). The zero-to-intercept linear regression slope varied from 0.84 to 1.19, and the R2 ranged from 0.58 to 0.9 (Figure 7a–d). All the computed statistical evaluation values for all three treatments (nRMSE 9.6% to 14.3%, with d > 0.99 and EF > 0.98) in Table 4 indicated high accuracy in model prediction. The paired t-test showed that the predicted and measured daily CO2 emissions for all three treatments were not statistically different from zero (p = 0.18–0.72) (Table 4).

3.4. Nitrous Oxide Fluxes

The daily fluxes of N2O for the three treatments did not differ significantly (p = 0.215). This could be a result of relatively low microbial activities and water in the soil. However, Table 4 indicates that on average, the daily fluxes were highest under N100M and gradually decreased from N100 to N0. Overall, the results demonstrate this trend. The daily predicted N2O fluxes ranged from 0.001 to 0.044 kg N2O-N ha−1 day−1, while the measured daily soil N2O across different treatments varied from 0.00085 to 0.035 kg N2O-N ha−1 day−1 (Figure 6d,e). Similar to the CO2 fluxes, peak N2O fluxes were observed following the application of fertilizer and after precipitation. At some sampling points, very low N2O fluxes were recorded, but no soil N2O uptake was observed, most likely due to the weather conditions during the sampling sessions.

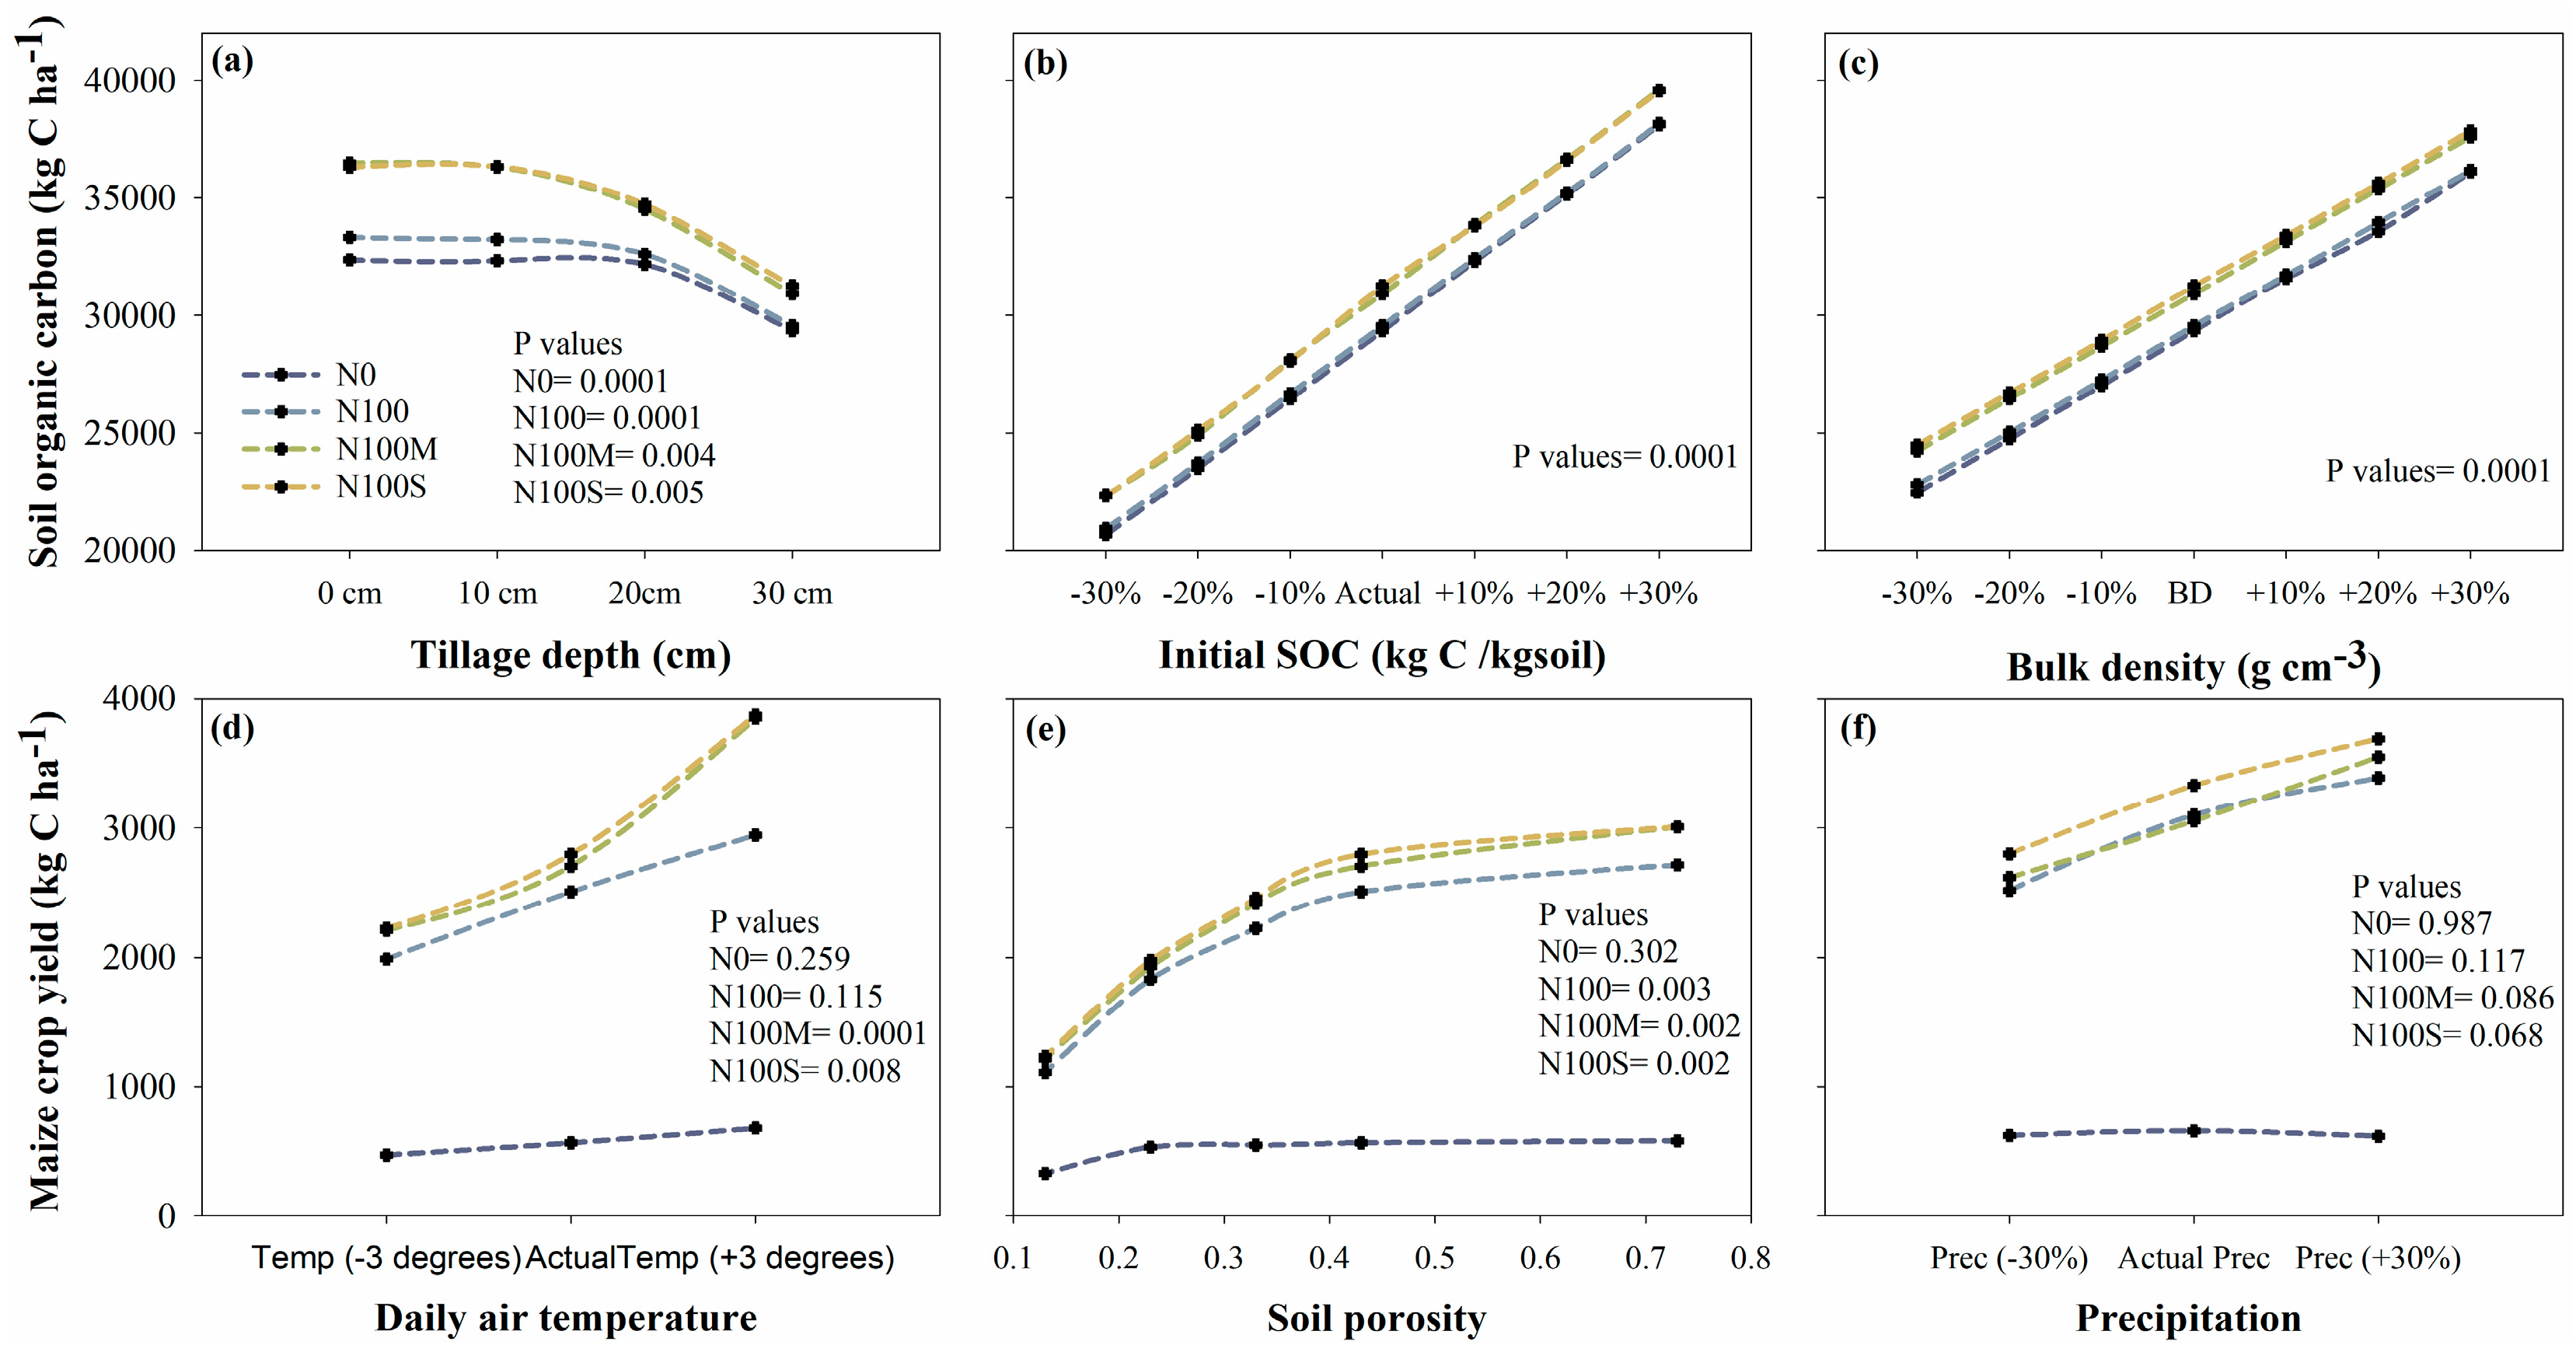
3.5. Sensitivity of the Model

The daily temperatures, daily precipitation, bulk density, initial SOC, tillage depth, and soil porosity all had a significant impact on the DNDC model (Figure 8).

3.5.1. SOC Sensitivity to Generated Soil Data and N Input

Over the six-year period, the predicted SOC contents of each treatment significantly increased as tillage depth decreased (Figure 8a). Treatments with organic amendments (N100M and N100S) were more sensitive to tillage depth compared to the control (N0) and N100. The effect of tillage depth on SOC sequestration was evident, with SOC increasing by 11% to 14% (N0) and 13% to 18% (N100) when tillage depths were reduced from 30 cm to 20 cm, 10 cm, and 0 cm. Similarly, reducing tillage depths for treatments N100M and N100S resulted in SOC increases of 16% to 28% and 15% to 25%, respectively.
Adjusting the initial SOC within the range of −30% to +30% resulted in predicted SOC changes from −31% to 28% across all treatments (Figure 8b). Similarly, altering the bulk density within the range of −30% to +30% resulted in predicted SOC changes from −31% to 21% across the treatments (Figure 8c). Additionally, changing other parameters such as microbial activity, root biomass CN ratio, and daily precipitation had minimal impact on SOC prediction.

3.5.2. Yield Sensitivity to Generated Weather and Soil Data

Over the course of six years, the highest and lowest annual average air temperatures were 27.3 °C and 13.8 °C, respectively. Referring to Figure 1a, the monthly average temperatures ranged from 17.2 °C in July 2018 to 23.0 °C in February 2019. The monthly rainfall varied between 0 mm and 395.3 mm, while the annual rainfall ranged from 771 mm to 1443.6 mm. The six growing seasons experienced varying levels of rainfall, ranging from 143 mm in 2017 to 719 mm in 2018. The extended rainy season, as shown in Figure 1b, had both extremes of rainfall. Regular droughts occurred in January and July–August, while the months of March–May and October–November received the highest amounts of rainfall (Figure 1b).
When daily air temperatures were adjusted within the range of −3 to +3 degrees Celsius, predicted changes in maize grain yield ranged from −21% to 42% across the four treatments. Comparing the average predicted yields, changes in daily air temperatures had no significant effect on treatments N0 and N100 (p = 0.05), as shown in Figure 8d, likely due to nitrogen deficiency. Reducing daily air temperatures did not significantly affect maize grain yield for any of the four treatments. However, increasing daily air temperatures significantly increased predicted maize grain yield for treatments N100S and N100M (Figure 8d).
Changing daily precipitation within the range of −30% to +30% moderately influenced maize grain yield, resulting in changes from −19% to 16% across the four treatments. As shown in Figure 8f, these changes in daily precipitation had no significant effect on maize grain yield in any of the four treatments compared to predicted results from actual weather data (p = 0.05). This study categorized growing seasons into normal, dry, and wet years based on precipitation levels. Thus, 2014 and 2015 were classified as normal years, 2017 as a dry year, and 2018 as a wet year. The prediction results indicated that changes in daily precipitation had a minimal effect on both normal and wet years. However, changes in daily precipitation, particularly an increase of +30%, notably increased maize grain yield for the dry year 2017, although not significantly.
The soil was altered by reducing the calibrated porosity from 0.43 to 0.13 in intervals of one unit. Increasing soil porosity beyond 0.43 had minimal effect on maize grain yield, with only the result for 0.73 shown, indicating further increases had no effect. The model was highly sensitive to low soil porosity; changing it from 0.43 to 0.13 significantly reduced maize grain production, resulting in yield reductions of 11% to 56% (Figure 8e). Conversely, increasing porosity from 0.43 to 0.73 resulted in an increase of 3% to 11%.

3.5.3. CO2 and N2O Sensitivity to Generated Weather Data

The alteration in daily precipitation by −30% to +30% significantly influenced daily fluxes. In contrast, changes in daily air temperatures of −3 degrees Celsius to +3 degrees Celsius had a moderate effect. Modifications in daily precipitation caused fluctuations in daily CO2 fluxes from −39% to 56% and N2O from −42% to 47%. Changes in daily air temperatures resulted in variations in daily CO2 fluxes from −17% to 24% and N2O from −11% to 18%. Consequently, fluctuations in greenhouse gas emissions may help determine the best time to fertilize the fields and mitigate emissions, taking into account expected seasonal rainfall and temperature patterns.

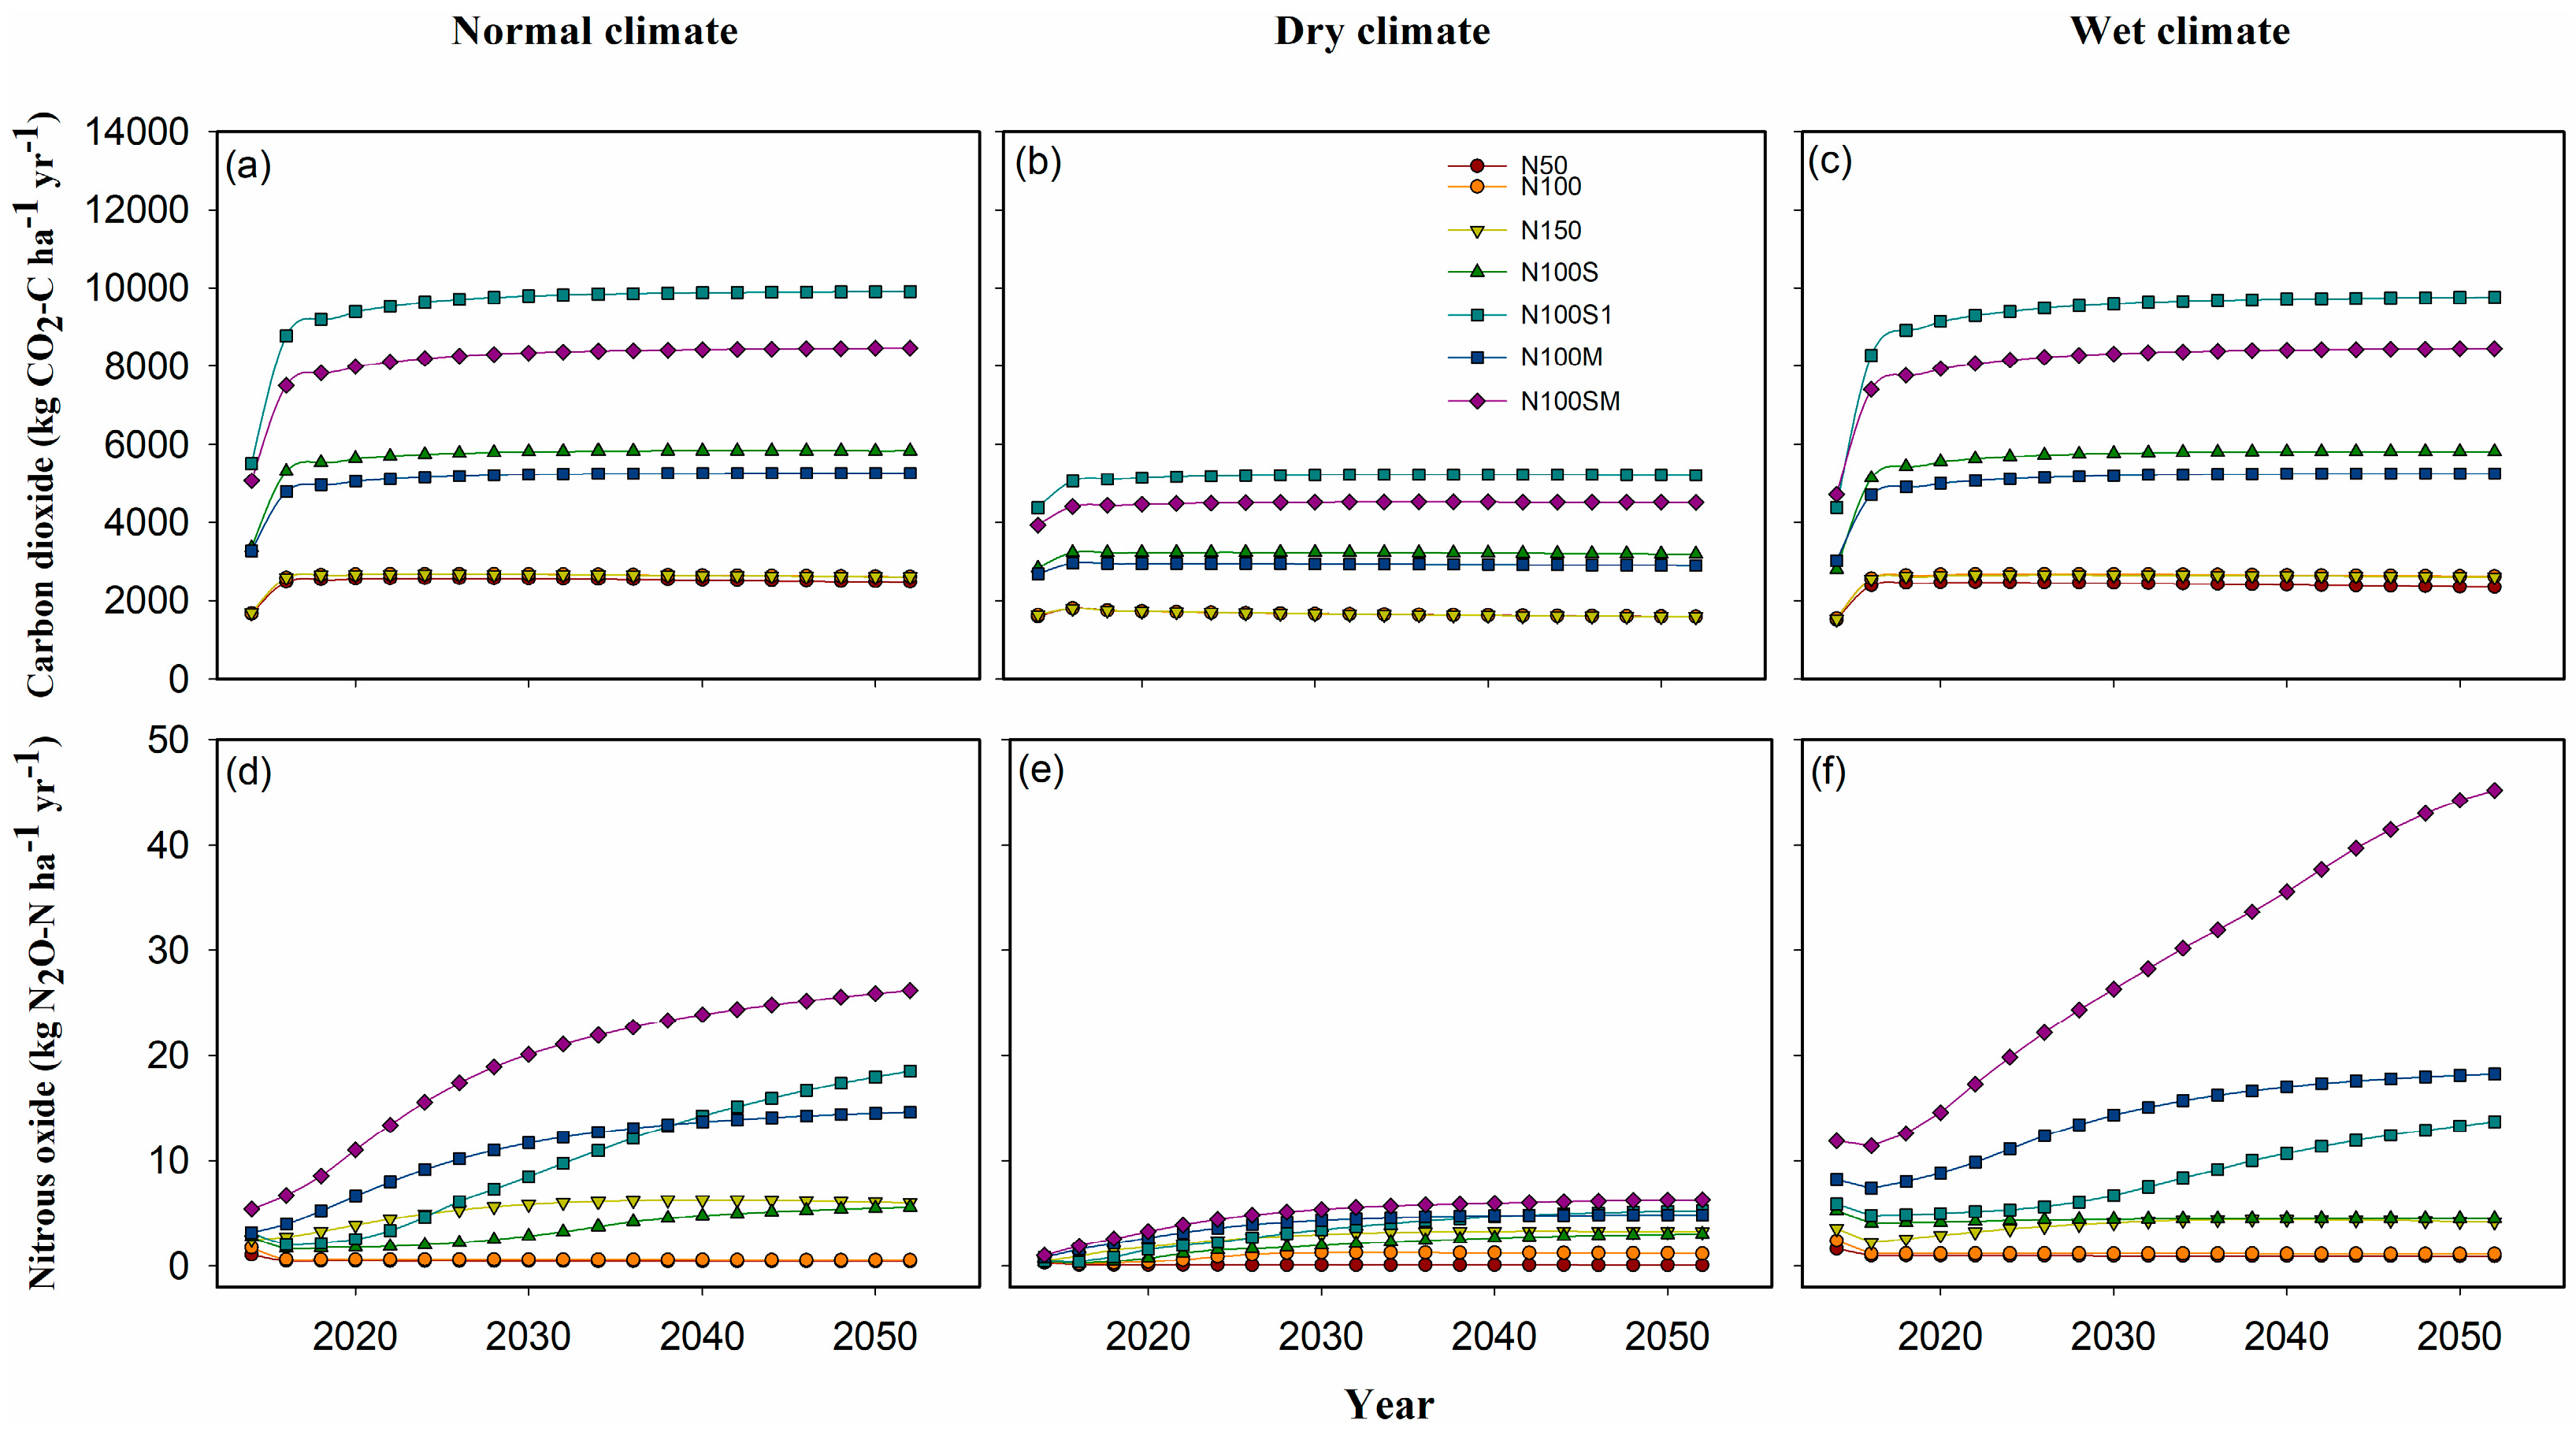
3.6. Scenario Analysis for High Yield, SOC Sequestration, and Greenhouse Gas Emission Mitigation

The predicted long-term response of SOC sequestration to varying N inputs and climatic regimes indicated that all treatments using only inorganic fertilizers showed a decline in topsoil SOC stocks, regardless of the climatic regime (Figure 9a–c). The organically amended treatments, N100S and N100M, showed a decline in SOC at the beginning of the simulations, leveling off over the years in both normal and wet climatic regimes (Figure 9a,c). The high-straw-mulch treatment (N100S1) and the treatment with both straw and manure amendment (N100SM) exhibited a steady increase in SOC in both normal and wet climatic regimes. This trend can be associated with slower decomposition of straw and enhanced microbial activity. Overall, this highlights an insightful practice that farmers may adopt to enhance cultivated land SOC for agronomic sustainability in similar climatic zones. However, in the dry climate regime, all treatments demonstrated a consistent decline in SOC stocks (Figure 9b). Similarly, in the dry climate regime, all treatments showed a low and steady decline in maize yields (Figure 9e), with the lowest inorganic fertilizer registering a relative change of −29%. In the normal and wet climate regimes, all treatments showed a low but steady increase in maize yields (ranging from 0.3% to 11%), except for the low-fertilizer treatments (N50 and N100), most likely due to water and nutrient limitations. Hence, plants in such areas could benefit greatly only when straw mulching and manure application are irrigated [16].
The long-term prediction of CO2 emissions indicated that all inorganic treatments had a positive relative change (49% to 71%) in both normal and wet climate regimes. However, under the dry climate regime, these treatments exhibited a low negative relative change, ranging from −3% to −1%. Generally, the dry climate regime showed the lowest CO2 emissions of the three climatic regimes (Figure 10a–c). All organically amended treatments showed a positive relative change in CO2 emissions, ranging from 8% to 123%. Emissions were highest in the wet climate regime, followed by the dry climate regime (Figure 10a–c). For N2O emissions, the low nitrogen input treatment (N50) exhibited a negative relative change across all three climate regimes. All other treatments displayed a positive relative change in N2O emissions, except for the N100 and N100S treatments, which recorded negative relative changes of −53% and −14%, respectively, in the wet climate regime.
Based on long-term predictions, the depth of straw and manure application had varying effects on SOC, maize yield, CO2, and N2O. Incorporating straw and manure at depths of 15 cm and 30 cm for treatments N100S1 and N100SM significantly increased SOC compared to surface application, as indicated by Tukey pairwise comparisons in Table 5. However, for treatments N100S and N100M, the application depth showed no significant differences. The significant SOC increases with deeper incorporation suggest potential benefits for long-term soil health, though labor requirements and costs associated with deeper application should be considered.
For maize yield, surface application of straw and manure in treatments N100S, N100S1, and N100SM resulted in significantly higher yields compared to sub-surface incorporation. In contrast, treatment N100M showed no significant differences in maize yields based on manure application depth (Table 5). Finally, there were no significant differences in CO2 and N2O emissions based on straw and manure application depth across the four treatments. Significant differences were observed only among the treatments.

4. Discussion

4.1. Dynamics of SOC, Yield, and Greenhouse Gas Emissions in Response to Fertilizer Nitrogen

The validation metrics demonstrated that the DNDC model accurately predicted SOC, maize yield, CO2, and N2O fluxes, with ’good’ to ’excellent’ agreement for most treatments (Table 3 and Table 4). These results confirm the model’s suitability for evaluating nitrogen management strategies in semi-arid regions. A more detailed explanation and description of each deviation statistic and its expected value in the statistical analysis of the model output is provided in the preceding methodology section and in a past publication [39].
The findings of [13,14,16] align with studies on the effects of different fertilizer and organic amendment regimes on topsoil SOC and maize crop yield. Similar results were reported by [39], supporting our conclusion that combined inorganic and organic N application is necessary to enhance SOC sequestration. According to [16], the treatment with maize residues, goat manure, and legume intercropping had the highest SOC sequestration, regardless of soil depth, followed by the maize residue, goat manure, and inorganic fertilizer treatments, with the lowest amount observed in the inorganic fertilizer treatment. Similarly, this study observed the lowest SOC in the control treatment (N0), followed by the chemical fertilizer treatments. The combined mineral and inorganic fertilizer treatments (N100M, N100S) registered higher SOC. Manure and straw provided a balanced input of organic carbon, attributed to slower organic matter decomposition and enhanced microbial activity compared to the other treatments. Furthermore, substantial accumulation of SOC in the surface (0–20 cm) during both the short and long terms in manure treatment can be attributed to manure preventing priming effect typically associated with mineral nitrogen [40,41]. It is widely recognized that incorporating easily degradable substrates, such as mineral nitrogen fertilizer, can have a priming effect in the soil, facilitating the decomposition of organic materials as witnessed in mineral fertilizer treatments in this study. Again, findings from [1,3] suggest that continuously applying fertilizers alone may not restore lost SOC and may even result in no change or a decrease. This explains our study’s findings regarding treatments that received only mineral fertilizer throughout the six years. Despite receiving 150 kg N season−1, treatment N150 showed decreasing topsoil SOC stocks. Conversely, supplementing mineral N with organic amendments is vital for promoting SOC sequestration. While farmyard manure can significantly reduce SOC losses, the amounts required to effectively build SOC are often impractical for smallholder farmers in Africa [8], making combined mineral fertilizer and manure application more feasible. This is certainly the case in this region where manure handling and storage is still very poor among farmers.
This research was conducted in a semi-arid area prone to droughts. According to [42], droughts can negatively affect soil quality, crop yields, and food security. For instance, droughts can decrease SOC concentration and alter soil carbon dynamics. Additionally, drought conditions can reduce terrestrial ecosystems’ ability to store carbon or even cause carbon release into the atmosphere [43]. These findings agree with this study’s drought scenario analysis. Regardless of the type and amount of fertilizer applied in drought, the SOC steadily declined over time. This is most probably due to alteration in soil carbon dynamics as a result of water-related inhibited microbial activity. Additionally, high water-level fluctuation (WLF) associated with drought can break down soil aggregates and lead to a loss of soil organic carbon [44]. Consequently, crop yields become low and food insecurity sets in. Comparatively, the scenario analysis of this study provides a reflection of low crop yields as a result of drought. Populations in such drought-prone semi-arid areas are regularly faced with hunger and high food prices. Given these findings, it is necessary to replicate this field experiment in drought-prone areas to provide clear recommendations for best management practices to optimize SOC sequestration and maize crop yield and minimize greenhouse gas emissions.
When calibrated using cultivar data under N100, the DNDC accurately predicted grain yields for all fertilized treatments. The overall performance of the model in predicting grain yield in this study is comparable to that reported earlier by [18,45,46]. Equally, ref. [47] reported “good” to “excellent” agreement between predicted and measured maize yields and above-ground biomass. In the present study, the model demonstrated a high degree of accuracy in predicting maize grain yields across all fertilized treatments, thereby further validating its effectiveness in predicting maize yields under diverse climatic conditions in different regions. However, the model’s predictions for N0 were less accurate, as it underestimated maize grain yields. Most likely, the model primarily relied on nitrogen deficiency to predict the yields of this treatment. This could be one of the limitations of the model’s design and utilization in simulating low-input or resource-constrained systems. All fertilized treatments yielded significantly higher maize grain than the lowest N input treatment (N50) and the control treatment (N0). Although there were no significant differences among the other four fertilized treatments, there were notable seasonal variations in yields. The primary causes of inter-annual yield variation under any given treatment were differences in cumulative growing season precipitation (GSP) and rainfall distribution during the growing season. Grain yield trends from 2014, 2015, and 2019 closely aligned with cumulative growing season precipitation (GSP). However, in 2017, grain yield remained unaffected despite a low cumulative GSP of 143 mm (Figure 1b), which is attributed to evenly distributed rainfall. Conversely, the grain yield for the 2018 long rainy season was affected despite a high cumulative GSP of 719 mm, primarily due to a dry spell in water logging in the field. Besides rainfall, daily air temperatures could also have influenced the inter-annual variations in maize yields. Consequently, warmer temperatures of a dry year (2017) could have contributed to higher yields as compared to cooler temperatures of a wet year (2018).
The results of the present study indicated that the peak of daily CO2 and N2O fluxes resulted from precipitation following fertilizer application. Similarly, ref. [45] reported that increased soil moisture promotes the denitrification of soil microorganisms, leading to significant N2O release. Additionally, ref. [48] found that peak N2O fluxes occurred shortly after nitrogen fertilizer application during basal application and topdressing, coinciding with rainfall or irrigation events, lasting 1–2 weeks before returning to background emissions. The same study also showed that organic soil amendment significantly increased CO2 fluxes, aligning with our findings that CO2 fluxes in treatment N100M were significantly higher than those in control treatment N0. According to [49], appropriate manure management techniques can effectively sequester carbon and nutrients while promoting GHG mitigation. A past study, ref. [46] emphasized that significant changes in CH4 and CO2 fluxes were observed based on the amount of manure applied, suggesting that manure application predictably increases the emissions of both gases. Notably, total CO2 emissions were much higher with larger manure doses compared to lower doses. This finding is particularly significant, making it imperative to consider manure amounts that do not increase CO2 emissions beyond controllable levels.

4.2. Optimal Practices for High Yield, SOC Sequestration, and Greenhouse Gas Emission Reduction

The application of nitrogen (N) can increase the nitrogen supply in the soil, potentially restoring and maintaining soil organic carbon (SOC) levels, leading to higher yields. However, excessive application can significantly increase greenhouse gas emissions [50,51]. Additionally, best management practices for fertilizer N contribute to minimizing residual soil nitrate, thereby reducing the risk of increased N2O emissions. A review by [52] reported that while many land and crop management practices adopted by farmers enhance SOC sequestration, the benefits are constrained by various adverse forces. Similarly, based on the model predictions of this study, combining high inputs of inorganic and organic nitrogen can be considered a strategy for achieving high maize yields and soil organic carbon (SOC) sequestration. However, this approach also has the drawback of resulting in increased CO2 emissions as witnessed in high-organic-input treatments (N100S1 and N100SM). Similarly, there were increased N2O emissions with increased manure and straw application (N100M and N100SM), especially under normal and wet climatic regimes. Wet soils particularly increase nitrous oxide emissions by creating an environment that is more conducive to denitrification in the presence of high nutrient sources such as manure [53]. Hence, care must be taken in quantities of both mineral and organic fertilizers applied depending on the climate and field conditions.
The intensive use of mineral fertilizers can adversely affect the environment through leaching and greenhouse gas emissions, deplete soil fertility due to the loss of soil organic matter, and pose economic challenges for producers due to their high cost. Based on various scenarios in this study, the exclusive use of inorganic nitrogen fertilizer hindered soil organic carbon (SOC) sequestration and balance, regardless of the climate regime. The topsoil SOC in these treatments steadily declined from the onset of the simulations over the years, resulting in the lowest SOC levels in the long term. Contrary to N150 treatment which experienced a continuous decline in SOC throughout the years in all the climate regimes, for N100 combined with either 5 tons of straw or 3 tons of manure (N100S and N100M), SOC levels initially declined slightly but stabilized well in both normal and wet climate regimes and only had a steady decline in dry climate regime. It is also well recognized that drought has a detrimental effect on SOC sequestration, primarily because it reduces the input and breakdown of plant litter. According to [54], the main causes of the drought-induced decrease in soil organic carbon content (−3.3%) were lower plant litter intake (−8.7%) and reduced litter breakdown (−13.0%) across all three ecosystem types. This is witnessed in this present study as the dry climate regime registered the lowest SOC sequestration and balance across all the treatments throughout the simulation years. Therefore, irrigation can be of very great importance in areas that are mostly dry. Overall, ecosystem type, drought duration, and intensity regulated the impacts of drought on soil carbon and nitrogen cycles [54].
This study also demonstrated that prolonged fertilizer application increased soil CO2 and N2O emissions, particularly with higher nitrogen input. Both straw and manure serve as sources of carbon, and their aerobic decomposition results in the release of CO2 and N2O. However, when applied in controlled amounts alongside organic fertilizers, they have the potential to reduce CO2 and N2O, as found in the present study. The depth of straw or manure application did not impact CO2 and N2O emissions of all other treatments except N100S1. This can be linked to the slower decomposition rate of straw; therefore, burying it deeper into the soil may further slow decomposition and even reduce potential microbial activity. Again, the application method significantly affected yield and soil organic carbon (SOC), particularly when all the straw was returned to the soil (N100S1). To achieve a long-term optimal balance of SOC sequestration while ensuring high grain yields and low greenhouse gas emissions, mineral nitrogen should be applied at a rate of 100 kg ha−1. This should be combined with either 5 tons ha−1 of straw or 3 tons ha−1 of farmyard manure, or the incorporation of all straw into the soil at a depth of 15 cm (N100S; 100M; 100S1).

5. Conclusions

The results from this study showed that fertilizer application in crop fields significantly influenced SOC balance, yield, and GHG emissions, depending on the type and quantity of fertilizer used. Comparing three different fertilizer strategies, this study found that the increased sole application of mineral fertilizers increased yield in the short term, which subsequently declined as SOC decreased. In contrast, combining mineral fertilizer with either manure or maize straw enhanced SOC and maize yields over time. However, this approach also resulted in increased greenhouse gas emissions, particularly CO2 with straw treatment and N2O with manure treatment. Similarly, combining both manure and straw with mineral fertilizer led to increased SOC, yield, and greenhouse gas emissions. Overall, our findings contribute to a comprehensive understanding of how different fertilizer regimes influence SOC and GHG emissions, providing valuable insights into effective agroecosystem management for long-term food security and soil sustainability while mitigating GHG emissions. Notably, the strategic application of mineral fertilizer, particularly in combination with either 5 tons ha−1 of straw or 3 tons ha−1 of manure, remains crucial for enhancing SOC and achieving higher grain yields while mitigating GHG emissions. However, longer field experiments on drought resilience and organic fertilizer application depth will better justify the findings of this study and help scale them to other regions.

Author Contributions

Conceptualization, X.L., W.D. and C.H.; methodology, S.O.A., X.L., P.S.M. and D.M.M.; software, S.O.A. and Z.L.; validation, C.H.; formal analysis, S.O.A., M.R., Z.L. and P.S.M.; investigation, S.O.A. and D.M.M.; resources, X.L.; writing—original draft preparation, S.O.A.; writing—review and editing, S.O.A., M.R., X.L., Z.L., F.B., Z.Y., D.M.M., G.W., W.D. and C.H.; visualization, S.O.A., M.R. and G.W.; supervision, C.H., D.M.M. and X.L.; project administration, C.H.; funding acquisition, C.H. All authors have read and agreed to the published version of the manuscript.

Funding

This work was financially supported by the International Partnership Program of the Chinese Academy of Sciences, grant number 151542KYSB20200017, National Key Research and Development Program of China (2023YFC3707401, 2023YFD1900103, 2021YFD1700901); the first author was financially supported by a Chinese Academy of Sciences–The World Academy of Sciences (CAS-TWAS) fellowship.

Data Availability Statement

The data presented in this study are available on request.

Conflicts of Interest

The authors declare that they have no known competing financial interests or personal relationships that could have appeared to influence the work reported in this paper.

References

  1. Atoloye, I.A. Revitalizing soil health for climate resilience in Africa: The need for high rates of carbon inputs. Farm. Syst. 2024, 2, 100096. [Google Scholar] [CrossRef]
  2. Spohn, M.; Bagchi, S.; Biederman, L.A.; Borer, E.T.; Bråthen, K.A.; Bugalho, M.N.; Caldeira, M.C.; Catford, J.A.; Collins, S.L.; Eisenhauer, N. The positive effect of plant diversity on soil carbon depends on climate. Nat. Commun. 2023, 14, 6624. [Google Scholar] [CrossRef] [PubMed]
  3. Beillouin, D.; Corbeels, M.; Demenois, J.; Berre, D.; Boyer, A.; Fallot, A.; Feder, F.; Cardinael, R. A global meta-analysis of soil organic carbon in the Anthropocene. Nat. Commun. 2023, 14, 3700. [Google Scholar] [CrossRef] [PubMed]
  4. Janzen, H. The soil carbon dilemma: Shall we hoard it or use it? Soil Biol. Biochem. 2006, 38, 419–424. [Google Scholar] [CrossRef]
  5. Emde, D.; Hannam, K.D.; Most, I.; Nelson, L.M.; Jones, M.D. Soil organic carbon in irrigated agricultural systems: A meta-analysis. Glob. Change Biol. 2021, 27, 3898–3910. [Google Scholar] [CrossRef]
  6. FAO. AQUASTAT Database. 2005. Available online: https://www.fao.org/aquastat/en/databases/subnational-irrigation/ (accessed on 20 June 2024).
  7. Burke, W.J.; Frossard, E.; Kabwe, S.; Jayne, T.S. Understanding fertilizer adoption and effectiveness on maize in Zambia. Food Policy 2009, 86, 101721. [Google Scholar] [CrossRef]
  8. Laub, M.; Corbeels, M.; Couëdel, A.; Ndungu, S.M.; Mucheru-Muna, M.W.; Mugendi, D.; Six, J. Managing soil organic carbon in tropical agroecosystems: Evidence from four long-term experiments in Kenya. Soil 2023, 9, 301–323. [Google Scholar] [CrossRef]
  9. Ochieng, J.; Kirimi, L.; Makau, J. Adapting to climate variability and change in rural Kenya: Farmer perceptions, strategies and climate trends. Nat. Resour. Forum. 2017, 41, 195–208. [Google Scholar] [CrossRef]
  10. Balík, J.; Kulhánek, M.; Černý, J.; Sedlář, O.; Suran, P. Soil Organic Matter Degradation in Long-Term Maize Cultivation and Insufficient Organic Fertilization. Plants 2020, 9, 1217. [Google Scholar] [CrossRef]
  11. Githongo, M.; Kiboi, M.; Muriuki, A.; Fliessbach, A.; Musafiri, C.; Ngetich, F.K. Organic Carbon Content in Fractions of Soils Managed for Soil Fertility Improvement in Sub-Humid Agroecosystems of Kenya. Sustainability 2022, 15, 683. [Google Scholar] [CrossRef]
  12. Mucheru-Muna, M.; Mugendi, D.; Pypers, P.; Mugwe, J.; James, K.U.; Vanlauwe BE RN AR, D.; Merckx, R. Enhancing maize productivity and profitability using organic inputs and mineral fertilizer in central Kenya small-hold farms. Exp. Agric. 2013, 50, 250–269. [Google Scholar] [CrossRef]
  13. Otieno, E.; Kiboi, M.; Gian, N.; Muriuki, A.; Musafiri, C.; Ngetich, F. Uptake of integrated soil fertility management technologies in heterogeneous smallholder farms in sub-humid tropics. Environ. Chall. 2021, 5, 100394. [Google Scholar] [CrossRef]
  14. Githongo, M.; Ngatia, L.; Kiboi, M.; Muriuki, A.; Fliessbach, A.; Musafiri, C.; Fu, R.; Ngetich, F. The Structural Quality of Soil Organic Matter under Selected Soil Fertility Management Practices in the Central Highlands of Kenya. Sustainability 2023, 15, 6500. [Google Scholar] [CrossRef]
  15. Guo, Z.; Zhang, Z.; Zhou, H.; Wang, D.; Peng, X. The effect of 34-year continuous fertilization on the SOC physical fractions and its chemical composition in a Vertisol. Sci. Rep. 2019, 9, 2505. [Google Scholar] [CrossRef] [PubMed]
  16. Aluoch, S.O.; Li, Z.; Li, X.; Hu, C.; Mburu, D.M.; Yang, J.; Xu, Q.; Yang, Y.; Su, H. Effect of mineral N fertilizer and organic input on maize yield and soil water content for assessing optimal N and irrigation rates in Central Kenya. Field Crops Res. 2022, 277, 108420. [Google Scholar] [CrossRef]
  17. Mo, F.; Wang, J.; Xiong, Y.; Nguluu, S.N.; Li, F. Ridge-furrow mulching system in semiarid Kenya: A promising solution to improve soil water availability and maize productivity. Eur. J. Agron. 2016, 80, 124–136. [Google Scholar] [CrossRef]
  18. Deng, Q.; Hui, D.; Wang, J.; Yu, L.; Li, C.; Reddy, K.C.; Dennis, S. Assessing the impacts of tillage and fertilization management on nitrous oxide emissions in a cornfield using the DNDC model. J. Geophys. Res. Biogeosci. 2016, 121, 337–349. [Google Scholar] [CrossRef]
  19. Gheisari, A.; Asgharipour, M.R.; Mousavi-Nik, M.; Ghanbari, A.; Javaheri, M.A. Utilization of the DNDC model to estimate yield and CO2 and CH4 emissions in a cotton-wheat rotation under the influence of various tillage treatments. Ecol. Model. 2023, 481, 110357. [Google Scholar] [CrossRef]
  20. Musafiri, C.M.; Macharia, J.M.; Kiboi, M.N.; Ng’etich, O.K.; Shisanya, C.A.; Okeyo, J.M.; Okwuosa, E.A.; Ngetich, F.K. Comparison between observed and DeNitrification-DeComposition model-based nitrous oxide fluxes and maize yields under selected soil fertility management technologies in Kenya. Plant Soil 2021, 463, 395–413. [Google Scholar] [CrossRef]
  21. Kouame, K.P.; Agrahari, R.K.; Konjengbam, N.S.; Koyama, H.; Kobayashi, Y. Ability of Nutrient Management and Molecular Physiology Advancements to Overcome Abiotic Stress: A Study on Sub-Saharan African Crops. Agriculture 2024, 14, 285. [Google Scholar] [CrossRef]
  22. Kibunja, C.N.; Ndungu-Magiroi, K.W.; Wamae, D.K.; Mwangi, T.J.; Nafuma, L.; Koech, M.N.; Ademba, J.; Kitonyo, E.M. Optimizing fertilizer use within the context of integrated soil fertility management in Kenya. In Fertilizer Use Optimization in Sub-Saharan Africa; CABI: Wallingford, UK, 2017; pp. 82–99. [Google Scholar]
  23. Wafula, B.M. Applications of crop simulation in agricultural extension and research in Kenya. Agric. Syst. 1994, 49, 399–412. [Google Scholar] [CrossRef]
  24. Mosongo, P.S.; Pelster, D.E.; Li, X.; Gaudel, G.; Wang, Y.; Chen, S.; Li, W.; Mburu, D.; Hu, C. Greenhouse Gas Emissions Response to Fertilizer Application and Soil Moisture in Dry Agricultural Uplands of Central Kenya. Atmosphere 2022, 13, 463. [Google Scholar] [CrossRef]
  25. Qu, Q.; Xu, H.; Ai, Z.; Wang, M.; Wang, G.; Liu, G.; Geissen, V.; Ritsema, C.J.; Xue, S. Impacts of extreme weather events on terrestrial carbon and nitrogen cycling: A global meta-analysis. Environ. Pollut. 2023, 319, 120996. [Google Scholar] [CrossRef] [PubMed]
  26. Iizumi, T.; Iseki, K.; Ikazaki, K.; Sakai, T.; Shiogama, H.; Imada, Y.; Batieno, B.J. Increasing heavy rainfall events and associated excessive soil water threaten a protein-source legume in dry environments of West Africa. Agric. For. Meteorol. 2024, 344, 109783. [Google Scholar] [CrossRef]
  27. Luo, C.; Zhang, X.; Duan, H.; Mburu, D.M.; Ren, H.; Kavagi, L.; Dai, R.; Xiong, Y. Dual plastic film and straw mulching boosts wheat productivity and soil quality under the El Nino in semiarid Kenya. Sci. Total Environ. 2020, 738, 139808. [Google Scholar] [CrossRef]
  28. Nelson, D.W.; Sommers, L.E. Total carbon, organic carbon, and organic matter. Methods Soil Anal. Part 3 Chem. Methods 1996, 5, 961–1010. [Google Scholar] [CrossRef]
  29. Barton, L.; Wolf, B.; Rowlings, D.; Scheer, C.; Kiese, R.; Grace, P.; Stefanova, K. Sampling frequency affects estimates of annual nitrous oxide fluxes. Sci. Rep. 2015, 5, 15912. [Google Scholar] [CrossRef]
  30. Alves, B.J.; Smith, K.A.; Flores, R.A.; Cardoso, A.S.; Oliveira, W.R.; Jantalia, C.P.; Urquiaga, S.; Boddey, R.M. Selection of the most suitable sampling time for static chambers for the estimation of daily mean N2O flux from soils. Soil Biol. Biochem. 2012, 46, 129–135. [Google Scholar] [CrossRef]
  31. Arias-Navarro, C.; Díaz-Pinés, E.; Kiese, R.; Rosenstock, T.S.; Rufino, M.C.; Stern, D.; Neufeldt, H.; Verchot, L.V.; Butterbach-Bahl, K. Gas pooling: A sampling technique to overcome spatial heterogeneity of soil carbon dioxide and nitrous oxide fluxes. Soil Biol. Biochem. 2013, 67, 20–23. [Google Scholar] [CrossRef]
  32. Rosenstock, T.S.; Mpanda, M.; Pelster, D.E.; Butterbach-Bahl, K.; Rufino, M.C.; Mutuo, P.; Abwanda, S.; Rioux, J.; Kimaro, A.A.; Neufeldt, H. Greenhouse gas fluxes from agricultural soils of Kenya and Tanzania. J. Geophys. Res. Biogeosci. 2016, 121, 1568–1580. [Google Scholar] [CrossRef]
  33. Raseduzzaman, M.; Dong, W.; Gaudel, G.; Aluoch, S.O.; Timilsina, A.; Li, X.; Hu, C. Maize-soybean intercropping reduces greenhouse gas emissions from the fertilized soil in the North China Plain. J. Soils Sediments 2024, 24, 3115–3131. [Google Scholar] [CrossRef]
  34. Li, C.; Frolking, S.; Frolking, T.A. A model of nitrous oxide evolution from soil driven by rainfall events: 2. Model applications. J. Geophys. Res. D Atmos. 1992, 97, 9777–9783. [Google Scholar] [CrossRef]
  35. Willmott, C.J. Some comments on the evaluation of model performance. Bull. Am. Meteorol. Soc. 1982, 63, 1309–1313. [Google Scholar] [CrossRef]
  36. Li, Z.T.; Yang, J.Y.; Smith, W.N.; Drury, C.F.; Lemke, R.L.; Grant, B.; He, W.T.; Li, X.G. Simulation of long-term spring wheat yields, soil organic C, N and water dynamics using DSSAT-CSM in a semi-arid region of the Canadian prairies. Nutr. Cycl. Agroecosyst. 2015, 101, 401–419. [Google Scholar] [CrossRef]
  37. Liu, S.; Yang, J.; Zhang, X.; Drury, C.; Reynolds, W.; Hoogenboom, G. Modelling crop yield, soil water content and soil temperature for a soybean–maize rotation under conventional and conservation tillage systems in Northeast China. Agric. Water Manag. 2013, 123, 32–44. [Google Scholar] [CrossRef]
  38. He, G.; Zhang, Z.; Zhang, J.; Huang, X. Soil Organic Carbon Dynamics and Driving Factors in Typical Cultivated Land on the Karst Plateau. Int. J. Environ. Res. Public Health 2020, 17, 5697. [Google Scholar] [CrossRef] [PubMed]
  39. Li, Z.T.; Yang, J.; Drury, C.; Hoogenboom, G. Evaluation of the DSSAT-CSM for simulating yield and soil organic C and N of a long-term maize and wheat rotation experiment in the Loess Plateau of Northwestern China. Agric. Syst. 2015, 135, 90–104. [Google Scholar] [CrossRef]
  40. Rodrigues LA, T.; Giacomini, S.J.; Aita, C.; Lourenzi, C.R.; Brunetto, G.; Bacca, A.; Ceretta, C.A. Short- and long-term effects of animal manures and mineral fertilizer on carbon stocks in subtropical soil under no-tillage. Geoderma 2021, 386, 114913. [Google Scholar] [CrossRef]
  41. You, M.; Li, J.; Tian, Q.; He, P.; He, G.; Hao, X.; Horwath, W.R. Residue decomposition and priming of soil organic carbon following different NPK fertilizer histories. Soil Sci. Soc. Am. J. 2020, 84, 1898–1909. [Google Scholar] [CrossRef]
  42. Schimel, J.P. Life in dry soils: Effects of drought on soil microbial communities and processes. Annu. Rev. Ecol. Evol. Syst. 2018, 49, 409–432. [Google Scholar] [CrossRef]
  43. Soares, P.R.; Harrison, M.T.; Kalantari, Z.; Zhao, W.; Ferreira, C.S. Drought effects on soil organic carbon under different agricultural systems. Environ. Res. Commun. 2023, 5, 112001. [Google Scholar] [CrossRef]
  44. Sun, X.; Liu, S.; Tang, H.; Zhang, F.; Jia, L.; Li, C.; Ma, L.; Liu, J.; Jiang, K.; Ding, Z.; et al. Effects of Water-Level Fluctuation on Soil Aggregates and Aggregate-Associated Organic Carbon in the Water-Level Fluctuation Zone of the Three Gorges Reservoir, China. Land 2024, 13, 313. [Google Scholar] [CrossRef]
  45. Wang, C.; Zhao, J.; Gao, Z.; Feng, Y.; Laraib, I.; Chen, F.; Chu, Q. Exploring wheat-based management strategies to balance agricultural production and environmental sustainability in a wheat−maize cropping system using the DNDC model. J. Environ. Manag. 2022, 307, 114445. [Google Scholar] [CrossRef] [PubMed]
  46. Phan, N.; Kim, K.; Parker, D.; Jeon, E.; Sa, J.; Cho, C. Effect of beef cattle manure application rate on CH4 and CO2 emissions. Atmos. Environ. 2012, 63, 327–336. [Google Scholar] [CrossRef]
  47. Jiang, R.; He, W.; Zhou, W.; Hou, Y.; Yang, J.; He, P. Exploring management strategies to improve maize yield and nitrogen use efficiency in northeast China using the DNDC and DSSAT models. Comput. Electron. Agric. 2019, 166, 104988. [Google Scholar] [CrossRef]
  48. Raseduzzaman, M.; Gaudel, G.; Ali, M.R.; Timilsina, A.; Bizimana, F.; Aluoch, S.O.; Li, X.; Zhang, Y.; Hu, C. Cereal-Legume Mixed Residue Addition Increases Yield and Reduces Soil Greenhouse Gas Emissions from Fertilized Winter Wheat in the North China Plain. Agronomy 2024, 14, 1167. [Google Scholar] [CrossRef]
  49. Duchateau, K.; Vidal, C. Between 1990 and 2000, European agriculture has reduced its greenhouse gas emissions by 6.4%. Environ. Energy 2003. Available online: https://www.europeansources.info/record/between-1990-and-2000-european-agriculture-has-reduced-its-greenhouse-gas-emissions-by-6-4/ (accessed on 15 September 2024).
  50. Zhang, L.; Qin, R.; Chai, N.; Wei, H.; Yang, Y.; Wang, Y.; Li, F.; Zhang, F. Optimum fertilizer application rate to ensure yield and decrease greenhouse gas emissions in rain-fed agriculture system of the Loess Plateau. Sci. Total Environ. 2022, 823, 153762. [Google Scholar] [CrossRef]
  51. Snyder, C.; Bruulsema, T.; Jensen, T.; Fixen, P. Review of greenhouse gas emissions from crop production systems and fertilizer management effects. Agric. Ecosyst. Environ. 2009, 133, 247–266. [Google Scholar] [CrossRef]
  52. Jat, M.L.; Chakraborty, D.; Ladha, J.K.; Parihar, C.M.; Datta, A.; Mandal, B.; Nayak, H.S.; Maity, P.; Rana, D.S.; Chaudhari, S.K.; et al. Carbon sequestration potential, challenges, and strategies towards climate action in smallholder agricultural systems of South Asia. Crop Environ. 2022, 1, 86–101. [Google Scholar] [CrossRef]
  53. Elberling, B.B.; Kovács, G.M.; Hansen, H.F.; Fensholt, R.; Ambus, P.; Tong, X.; Gominski, D.; Mueller, C.W.; Poultney, D.M.; Oehmcke, S. High nitrous oxide emissions from temporary flooded depressions within croplands. Commun. Earth Environ. 2023, 4, 463. [Google Scholar] [CrossRef]
  54. Deng, L.; Peng, C.; Kim, D.; Li, J.; Liu, Y.; Hai, X.; Liu, Q.; Huang, C.; Shangguan, Z.; Kuzyakov, Y. Drought effects on soil carbon and nitrogen dynamics in global natural ecosystems. Earth-Sci. Rev. 2021, 214, 103501. [Google Scholar] [CrossRef]
Figure 1. Weather data, 2014–2019: (a) daily mean, maximum, and minimum air temperatures; (b) daily precipitation in each year (GSP is the cumulative precipitation during each growing season, LR indicates long rains, and SR indicates short rains).
Agronomy 15 00346 g001
Figure 2. Measured and predicted topsoil SOC (kg C ha−1) from the six treatments, namely (a) 0 (kg ha−1) of N (the control, or N0), (b) 50 (kg ha−1) of N (N50), (c) 100 (kg ha−1) of N (N100), (d) 150 (kg ha−1) of N (N150) (e) 100 (kg ha−1) of N combined with manure (N100M), and (f) 100 (kg ha−1) of N combined with mulching with straw (N100S).
Agronomy 15 00346 g002
Figure 3. The correlation and regression between predicted and measured SOC from (a) N0, (b) N50, (c) N100, (d) N150, (e) N00M, and (f) N100S. R2 marked with “*” indicates the significance of the slope of regression at a 0.05 probability level. Error bars represent standard deviation (n = 5).
Agronomy 15 00346 g003
Figure 4. Measure and predicted maize grain yield from six treatments: (a) N0, (b) N50 (c) N100, (d) N150 (e) N100M, and (f) N100S.
Agronomy 15 00346 g004
Figure 5. The correlation and regression between predicted and measured maize grain yield from (a) N0, (b) N50, (c) N100, (d) N150, (e) N00M, and (f) N100S (see Figure 2 for an explanation of the abbreviations of the treatment). R2 marked with asterics indicates the significance of the slope of regression: * p < 0.05, ** p < 0.01. Error bars represent standard deviation (n = 6).
Agronomy 15 00346 g005
Figure 6. Daily measured and predicted CO2 (ac), and N2O (df) fluxes from three treatments: N0, N100, and N100M. The abbreviations FA and IRR stand for fertilizer application and irrigation, respectively.
Agronomy 15 00346 g006
Figure 7. The correlation and regression between predicted and measured CO2 and N2O daily fluxes: (a) CO2 from N0; (b) CO2 from N100; (c) CO2 from N100M; (d) CO2 from the pooled data; (e) N2O from N0; (f) N2O from N100; (g) N2O from N100M; and (h) N2O from the pooled data (see Figure 2 for explanation of the abbreviations of the treatments). R2 marked with astericsindicates the significance of the slope of regression: * p < 0.05, ** p < 0.01, *** p < 0.001. Error bars represent standard deviation (n = 14).
Agronomy 15 00346 g007
Figure 8. Predicted responses of soil organic carbon to (a) tillage depth, (b) initial SOC, and (c) bulk density and maize grain yield to (d) daily air temperatures, (e) soil porosity, and (f) daily precipitation.
Agronomy 15 00346 g008
Figure 9. Predicted long-term responses of SOC sequestration and maize yield to different N input and climatic regimes for (a,d) normal climate, (b,e) dry climate, and (c,f) wet climate.
Agronomy 15 00346 g009
Figure 10. Predicted long-term responses of CO2 and N2O emissions to different N input and climatic regimes for (a,d) normal climate, (b,e) dry climate, and (c,f) wet climate.
Agronomy 15 00346 g010
Table 1. Field management and layout for all six treatments from 2014 to 2019 at the experimental site.
Season
Sequence
YearRainy
Season
CropTillage
Date
Planting
Date
Row
Space
(cm)
Harvest
Date
N0N50N100N100MN150N100S
FertilizerFertilizerFertilizerFertilizerManureFertilizerFertilizerStraw
Residue
(Kg N ha−1)
12014Long
rains
Maize29-March-
14
31-March-
14
7030-July-
14
0501001006015010025
22015Long
rains
Maize8-April-
15
9-April-
15
7020-July-
15
0501001006015010025
32016Long
rains
Maize2-April-
16
4-April-
16
7017-August-
16
0501001006015010025
42017Long
rains
Maize19-March-
17
22-April-
17
7012-September-
17
0501001006015010025
52017Short
rains
Maize31-October-
17
2-November-
17
7027-March-
18
0501001006015010025
62018Long
rains
Maize2-April-
18
5-April-
18
708-August-
18
0501001006015010025
72019Long
rains
Maize15-April-
19
18-April-
19
7012-August-
19
0501001006015010025
Table 2. Climatic, soil, and crop measured parameters used to calibrate and run the DNDC model.
ParameterValue/Unit
Climatic
Latitude1.05
Climate filesObserved data from weather station
Climate files formatJday, MaxT, MinT, radiation
All other weather parametersDNDC default values
Soil parameters
Land useUpland crop field
CropMaize (DKC 9089)
Soil textureClay (clay 62.9%, silt 13.6%, sand 23.6%)
Bulk densityObserved
Soil pHObserved
Field capacity0.75
Wilting point0.45
Porosity0.43
Hydrological conductivity0.1
Depth of water retentionDNDC default values
Drainage efficiency1
SOC partitioning (factions of resistant litter, humads, and humus)DNDC default values
CN ratio (of resistant litter, humads, and humus)DNDC default values
Slope5
Table 3. Statistical evaluation of predicted topsoil organic carbon and maize grain yield in different treatments against measured values.
TreatmentSOC (kg C ha−1)
MeasuredS.DPredictedS.DPrediction C.VSample No.ERMSEnRMSE % dEFPaired t (p)
N029,238 b195129,350 d17666.051127272.50.950.830.77
N5029,547 b204429,574 c16685.65277972.70.940.810.95
N10029,956 b158129,569 c16715.653886232.10.950.830.19
N15029,588 b203829,532 c16905.75−568342.80.930.790.90
N100M30,982 a100230,923 b9633.15−593551.10.960.840.75
N100S31,183 a99131,253 a8072.65703881.20.940.810.73
Pooled data30,082169130,03315505.230−496492.20.99990.99950.69
TreatmentYield (kg C ha−1)
N0780 b177564 c23441.46−21628436.40.48−2.110.05
N501471 b7021455 b60541.66−1622915.50.960.870.88
N1002565 a7442505 a55722.26−6026510.30.950.850.62
N1502501 a6232606 a50019.261052439.70.940.820.33
N100M2640 a6242704 a45416.866433312.60.880.660.68
N100S2769 a5832795 a54819.66251786.40.970.890.76
Pooled data2121933210595145.236−1626012.20.9970.9870.71
Values that share same letter within a column are not significantly different.
Table 4. Statistical evaluation of predicted carbon dioxide and nitrous oxide fluxes in different treatments against measured values.
TreatmentCO2-C Fluxes (kg C ha−1 day−1)
MeasuredS.DPredictedS.DPrediction CVSample No.ERMSEnRMSE % dEFPaired t (p)
N03.42 b0.443.30 b0.4914.714−0.120.3339.60.9970.990.18
N1004.64 a1.224.75 a1.5933.5140.110.66414.30.9950.980.55
N100M5.64 a1.895.72 a2.3240.6140.080.78613.90.9950.980.72
Pooled data4.571.584.591.9041.3420.020.62413.70.9960.980.82
TreatmentN2O-N Fluxes (kg N ha−1 day−1)
N00.008 a0.0070.008 a0.008101.6140.000100.00229.90.9880.950.88
N1000.013 a0.0120.013 a0.013101.414−0.000010.00643.40.9750.901.00
N100M0.015 a0.0130.015 a0.016106.314−0.000280.00960.20.9490.790.92
Pooled data0.0120.0110.0120.013107.242−0.000060.00653.01.0460.850.95
Values that share same letter within a column are not significantly different.
Table 5. The long-term effects of organic N application depth on SOC sequestration, maize yield, CO2, and N2O emissions.
TreatmentSurface ApplicationIncorporated (15 cm)Incorporated (30 cm)
N100S30,395 d30,947 d30,907 d
SOC (kg C ha−1)N100M30,546 d31,569 d31,418 d
N100S135,801 bc37,058 a3641 ab
N100SM34,879 c36,449 ab36,251 ab
N100S3238 c3135 fg3132 g
Yield (kg C ha−1) N100M3188 de3159 efg3161 ef
N100S13408 a3215 cd3220 c
N100SM3333 b3212 cd3218 c
N100S5691 c5574 cd5529 cd
CO2 (kg CO2-C ha−1 yr−1)N100M5129 de4987 e4963 e
N100S19578 a9312 a9196 a
N100SM8180 b7931 b7863 b
N100S3.63 de2.8 e2.58 e
N2O (kg N2O-N ha−1 yr−1)N100M11.15 b11.18 b11.15 b
N100S110.29 bc7.54 c6.86 cd
N100SM19.37 a18.09 a17.67 a
Values that share same letter within a column are not significantly different.
Disclaimer/Publisher’s Note: The statements, opinions and data contained in all publications are solely those of the individual author(s) and contributor(s) and not of MDPI and/or the editor(s). MDPI and/or the editor(s) disclaim responsibility for any injury to people or property resulting from any ideas, methods, instructions or products referred to in the content.

