Article

Genotypic Differences in Maize Root Morphology in Response to Low-Nitrogen Stress

1
Agro-Environmental Protection Institute, Ministry of Agriculture and Rural Affairs, Tianjin 300191, China
2
Key Laboratory of Tobacco Biology and Processing, Ministry of Agriculture and Rural Affairs, Tobacco Research Institute, Chinese Academy of Agricultural Sciences, Qingdao 266101, China
3
College of Resources and Environmental Sciences, National Academy of Agriculture Green Development, Key Laboratory of Plant-Soil Interactions, Ministry of Education, China Agricultural University, Beijing 100193, China
*
Author to whom correspondence should be addressed.
Agronomy 2025, 15(2), 332; https://doi.org/10.3390/agronomy15020332
Submission received: 24 December 2024 / Revised: 19 January 2025 / Accepted: 25 January 2025 / Published: 28 January 2025
(This article belongs to the Section Soil and Plant Nutrition)

Abstract

:
The root system plays an important role in the efficient absorption of nitrogen (N), but there is limited understanding of the growth characteristics of maize roots of different genotypes and their dynamic response to N supply. In this study, landraces in the 1950s and modern hybrids, modern hybrids and their parents, inbred lines with different N efficiency and standard inbred line B73 were used, combined with the dynamic culture method, to observe the dynamic changes in root growth under long-term N stress conditions. The results showed that there were genotypic differences in the response of maize roots to low N. Low N enhances root growth earlier than the increases in shoot-to-root dry matter allocation. With the extension of low N stress, the root biomass of each genotype basically increased significantly from 3 to 6 days and then was gradually reversed by high N on the 12th day. As for shoot biomass, 11 genotypes began to decrease significantly from 6 to 9 days after low-N stress. The total axial root length, primary root length, seminal root length, and the first and second whorl crown root length of seven genotypes were increased more or less under low N. With the extension of N stress, the number of third and fourth whorl crown roots decreased significantly, which indicated that regulation of root elongation is earlier than that of crown root initiation. As the degree of low-N stress increased, the trend of total lateral root length changes in different genotypes could be divided into three categories, indicating that the response of lateral root growth to low-N stress is genotype-dependent. With the advancement of the breeding process, the roots of modern hybrids become smaller but more responsive to low-N stress. The root phenotypes of Zhengdan958 and Xianyu335 come from different genetic models. Compared with embryonic roots, the crown roots of B73 have a more active role in adapting to low-N stress. Shoot N concentration may reflect plant internal N status, which plays a regulatory role in root morphogenesis.

1. Introduction

N is one of the most important nutrients limiting crop growth [1]. In the past half century, the amount of N fertilizer used in global agricultural production has increased multiple folds, but the average N fertilizer utilization rate in the current season is relatively low [2]. The excessive use of N fertilizer has brought serious environmental problems. Maize has become a very important crop for food, economy, feed, energy and other purposes. Therefore, improving the N efficiency of maize is crucial to ensure food security and environmental sustainability [3]. Cultivating new varieties of N-efficient crops can obtain higher yields under low-N conditions [4,5]. In the maize breeding process, there are relatively few studies on how root characteristics change. In fact, approximately 2/3 of the fertilizer N is immobilized in the soil through diverse chemical and biological processes occurring within the soil matrix. Consequently, organic N emerges as the most prevalent form of N in the soil [6]. As N deficiency intensifies, plants are compelled to rely increasingly on organic N resources. These resources are mineralized at a slow pace and are under the regulatory control of soil-dwelling microbes [7]. Even in fertilized agricultural soils, over half of the N required by plants is sourced from the natural mineralization process within the soil [8]. Thus, in the pool of available N for crop uptake, only a fraction is transported to the roots via the mass flow of water. A substantial portion is derived from the gradual mineralization of organic N. From this perspective, the adaptive strategies manifested in root morphology play a crucial role. They enable plants to explore larger volumes of soil, thereby enhancing their capacity to access N resources. This could potentially elucidate why root morphology, namely, root biomass, length and surface area, plays an extremely important role in N absorption [9].
As is well known, insufficient N supply leads to an increase in the distribution of photosynthetic products to the roots, resulting in an increase in the root to shoot ratio. Sun et al. found that when the N supply decreased from optimal (10 mM) to mild N deficiency (about 1 mM), the shoot biomass decreased but the root biomass increased. When the N supply further decreased, the root biomass also decreased [10]. The impact of N supply on root morphology is much more complex than the change in biomass [11]. In terms of axial roots, studies have shown that one of the important responses of maize to low-N stress is to increase the elongation of axial roots [12]. On the contrary, fewer axial roots number are produced [13]. However, Wang et al. found that compared with the control, the N efficient and medium genotype increased or maintained the total axial root length under low-N stress, while the N inefficient genotype decreased the total axial root length under low-N stress [14]. In terms of lateral roots, low N stress was shown to decrease the total lateral root length in a solution culture [13], while other researchers found lateral root elongation was increased by low N stress in aeroponic or sand culture [15], and under an extended low-N supply, the first-order lateral root density was either decreased [13] or increased [15].
It seems that the effect of low-N stress on root growth is affected by genotypes, level of low-N stress, plant growth stages, root types, growth conditions, etc. Up to now, a detailed time-course analysis of different maize genotypes and root types is lacking. In this study, the dynamic analysis of root growth under long-term low-N stress was carried out by using landraces in the 1950s and modern hybrids, modern hybrids and their parents, inbred lines with different N efficiency and standard inbred line B73. It is hoped that we can deeply understand the influence of genotype and N interaction on root growth and development, can more clearly understand the important role of root morphology in N absorption and select an appropriate root phenotype to improve N efficiency from the perspective of root breeding.

2. Materials and Methods

2.1. Plant Materials

Two main commercial hybrids in North China, Zhengdan958 (ZD958) and Xianyu335 (XY335), as well as their parents, Zheng58 (Z58, female parent), Chang7-2 (C7-2, male parent), PH6WC (female parent), PH4CV (male parent), N efficient inbred line Ye478, N inefficient inbred line Wu312, standard inbred line B73 with complete sequence genome and two open pollination landraces, Baimaya (BMY) and Jinhuanghou (JHH), bred in the 1950s.

2.2. Experimental Procedures

The experiment was conducted in May 2016. First, the seeds underwent surface sterilization. They were immersed in a 10% (v/v) H2O2 solution for 40 min. After that, the seeds were rinsed three times with deionized water. Subsequently, they were soaked in a saturated CaSO4 solution for around 8 h. Next, the seeds were positioned between layers of filter paper moistened with deionized water. They were then left to germinate in the dark at room temperature. Once the roots reached approximately 2 cm in length, which took about 1 day, uniform seedlings were selected. These seedlings were placed around 2 cm below the top edge of the filter paper. Another piece of wet filter paper was used to cover them. The filter paper with the seedlings was then rolled up straight and put into a plastic container filled with distilled water to allow for continued growth. When the seedlings developed one fully expanded leaf, the endosperm was removed. The seedlings were then transferred into porcelain pots. Each pot contained 2 L of nutrient solution and held five seedlings. Hydroponic experiments were conducted as described previously by Sun et al. [12].

2.3. Shoot Sampling and Determination

Six uniform seedlings from each treatment were sampled on 1, 3, 6, 9 and 12 days after N treatment. Plants were divided into shoots and roots by cutting at the position where the first whorl crown roots occur on the stem. Shoots were then dried at 65 °C in an oven for 3 days, and the shoot dry weight was measured. The roots were placed into plastic Ziplock bags and stored at −20 °C until they were measured. After the determination of root traits, roots were then dried and weighed, and root to shoot ratio was calculated.

2.4. Root Sampling and Determination

The primary root length, seminal root length and different whorl crown root length were measured with a ruler. The total axial root length was obtained by adding the length of these roots. The numbers of seminal roots and different whorl crown roots were manually counted. The root samples were then floated in water in a transparent plastic tray and scanned with an Epson V700 scanner (Seiko Epson Corporation, Suwa City, Japan). Scanned root images were analyzed using the WinRHIZO Pro 2014b software (Regent Instruments, Quebec, QC, Canada) to obtain the total root length and total root surface area. The total lateral root length was obtained by subtracting the total root length from the total axial root length.

2.5. Determination of N Concentration

The dried shoot and root samples were ground into powder and concentrated through sulfuric acid–hydrogen peroxide digestion. Shoot and root N concentration was measured by the Kjeldahl method.

2.6. Determination of Plant Height, Leaf Area and SPAD

On the 12th day after N treatment, 6 uniform plants were selected to measure the plant height, leaf area and SPAD of the first to fifth leaves. The plant height was measured from the position where the first whorl crown roots occur on the stem to the top of the plant with a ruler. Leaf area was calculated by leaf length × leaf width × 0.75 [16]. SPAD of the first to fifth leaves was measured with a SPAD-502 chlorophyll analyzer (Minolta Camera Co., Ltd., Osaka, Japan).

2.7. Statistical Analysis

Data were subjected to an ANOVA procedure implemented in SPSS Statistics 19.0 (SPSS Inc., Chicago, IL, USA). The differences in different root phenotypic traits under high- and low-N treatments at the same sampling time were compared using the t test at the 0.05, 0.01 and 0.001 level of probability. The data were then mapped with GraphPad Prism 7 software.

3. Results

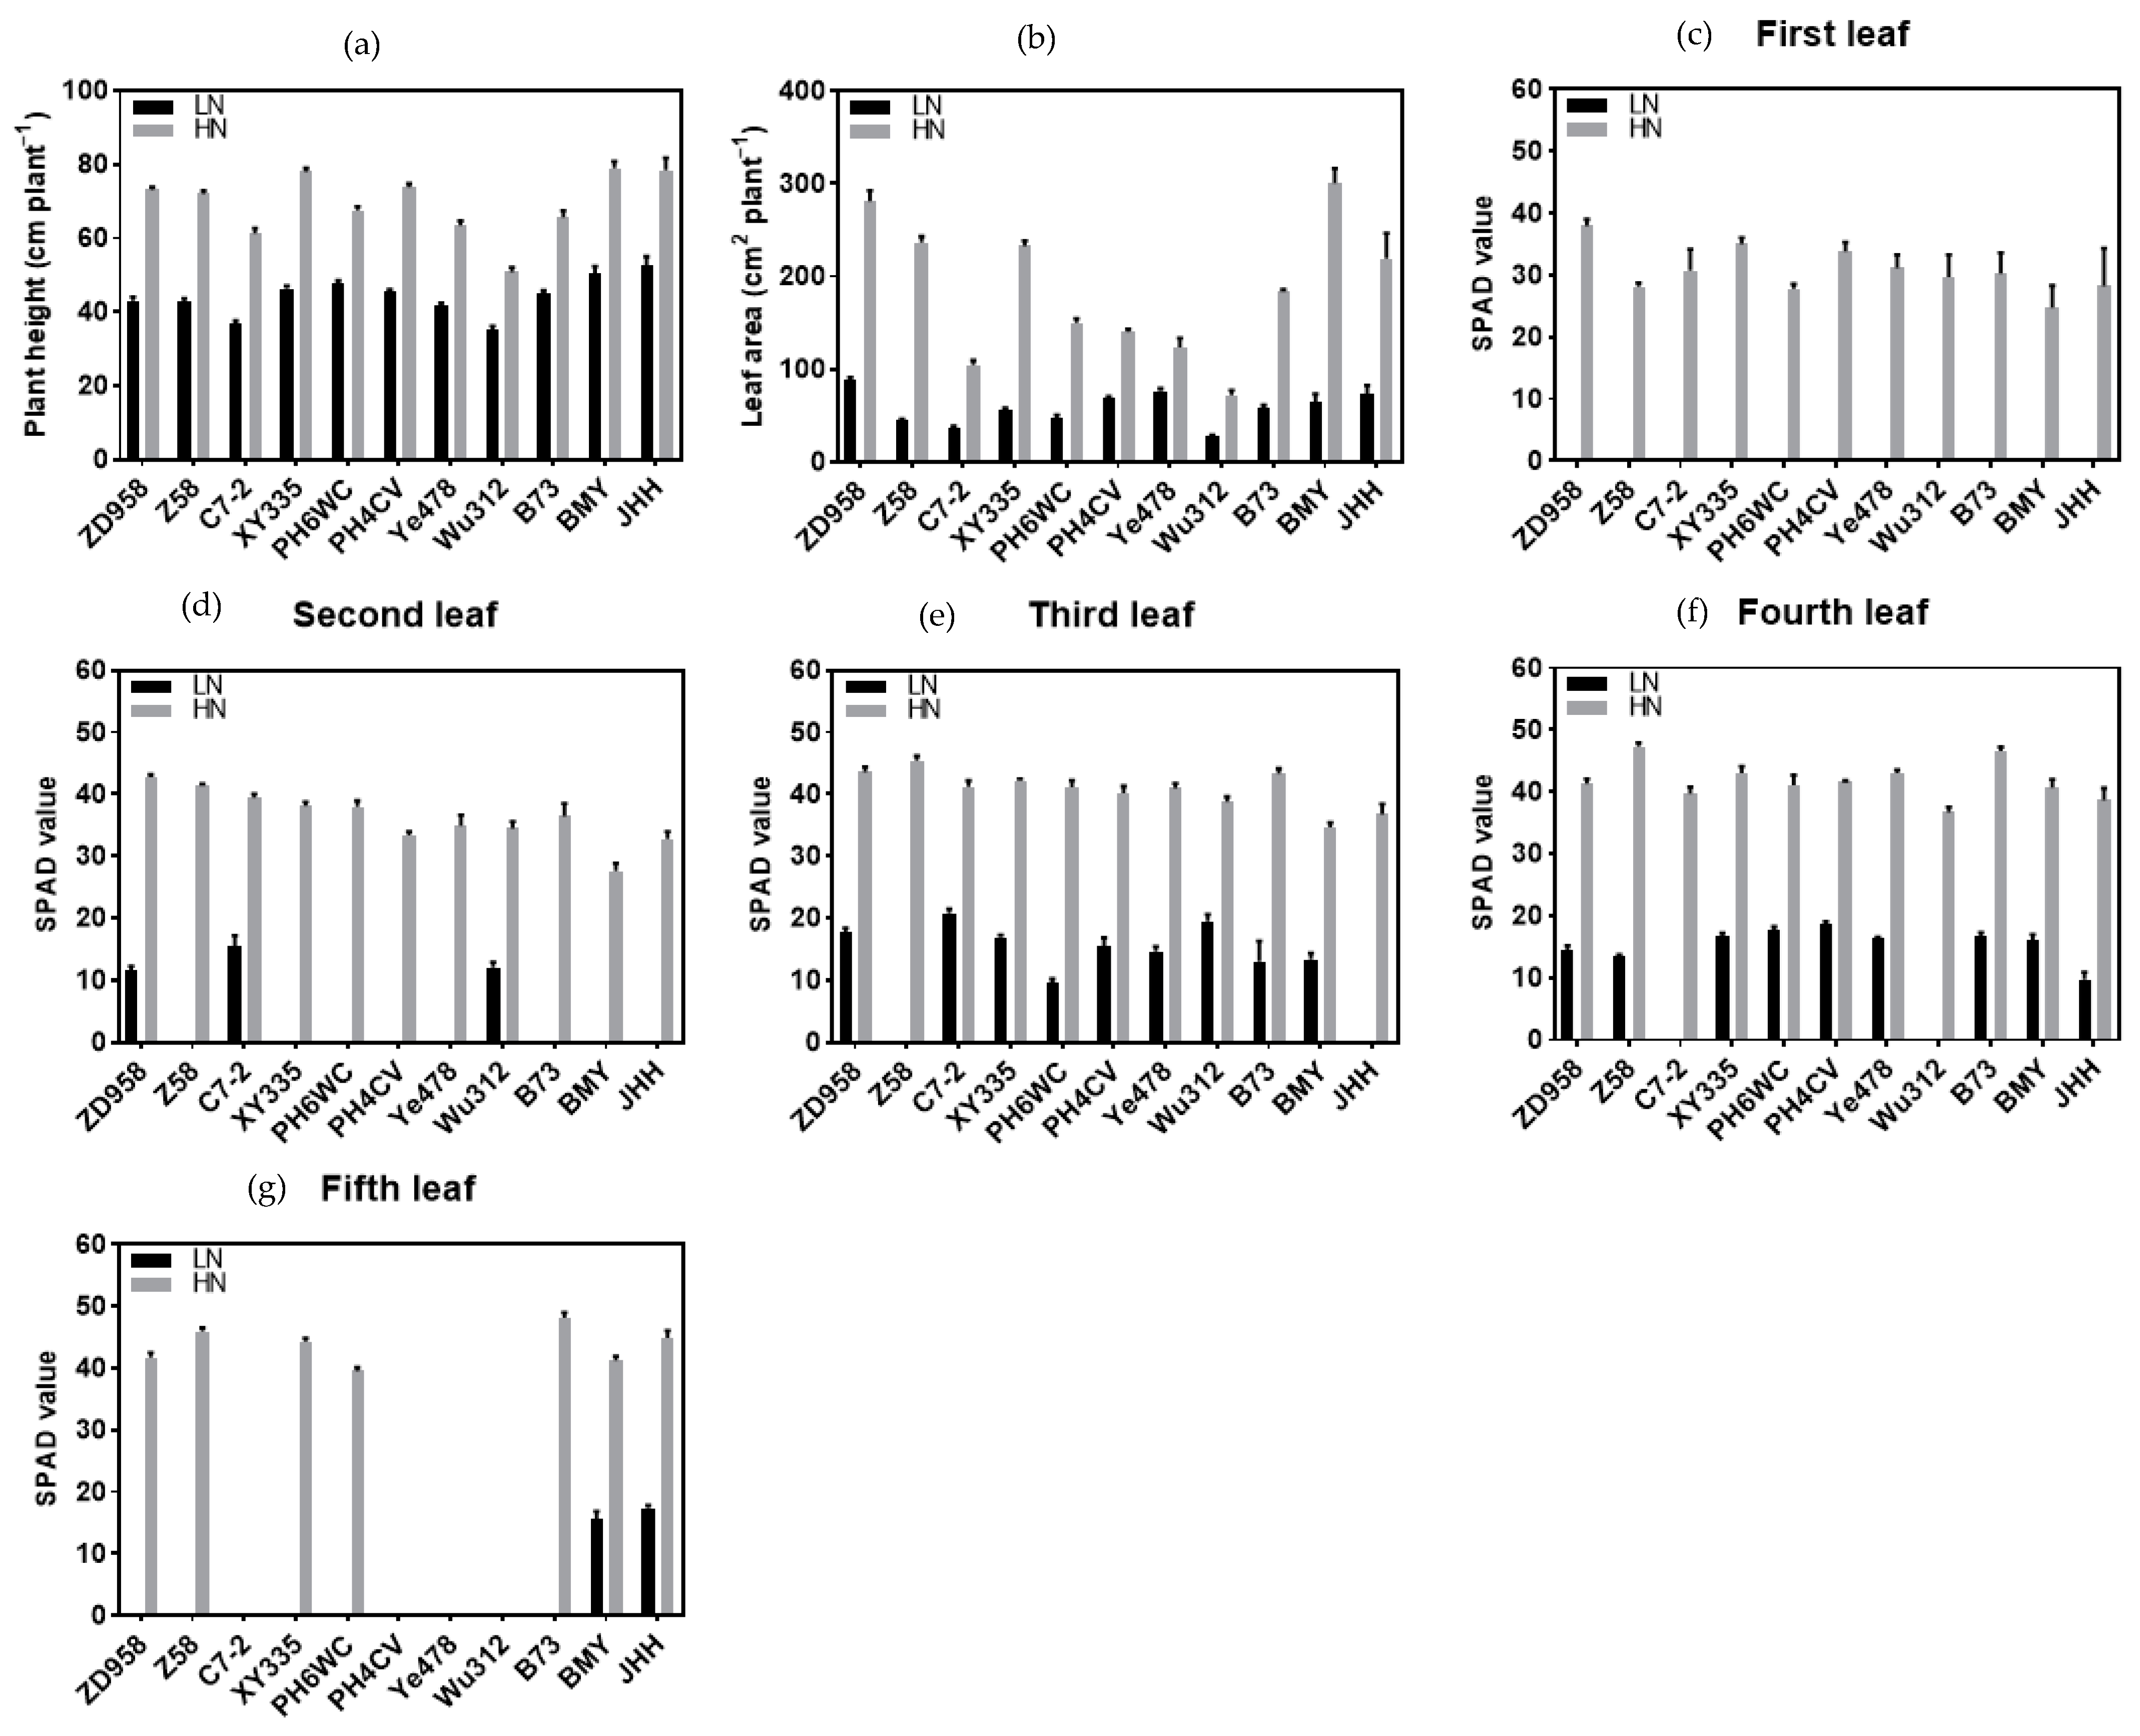
3.1. Plant Height, Leaf Area and SPAD
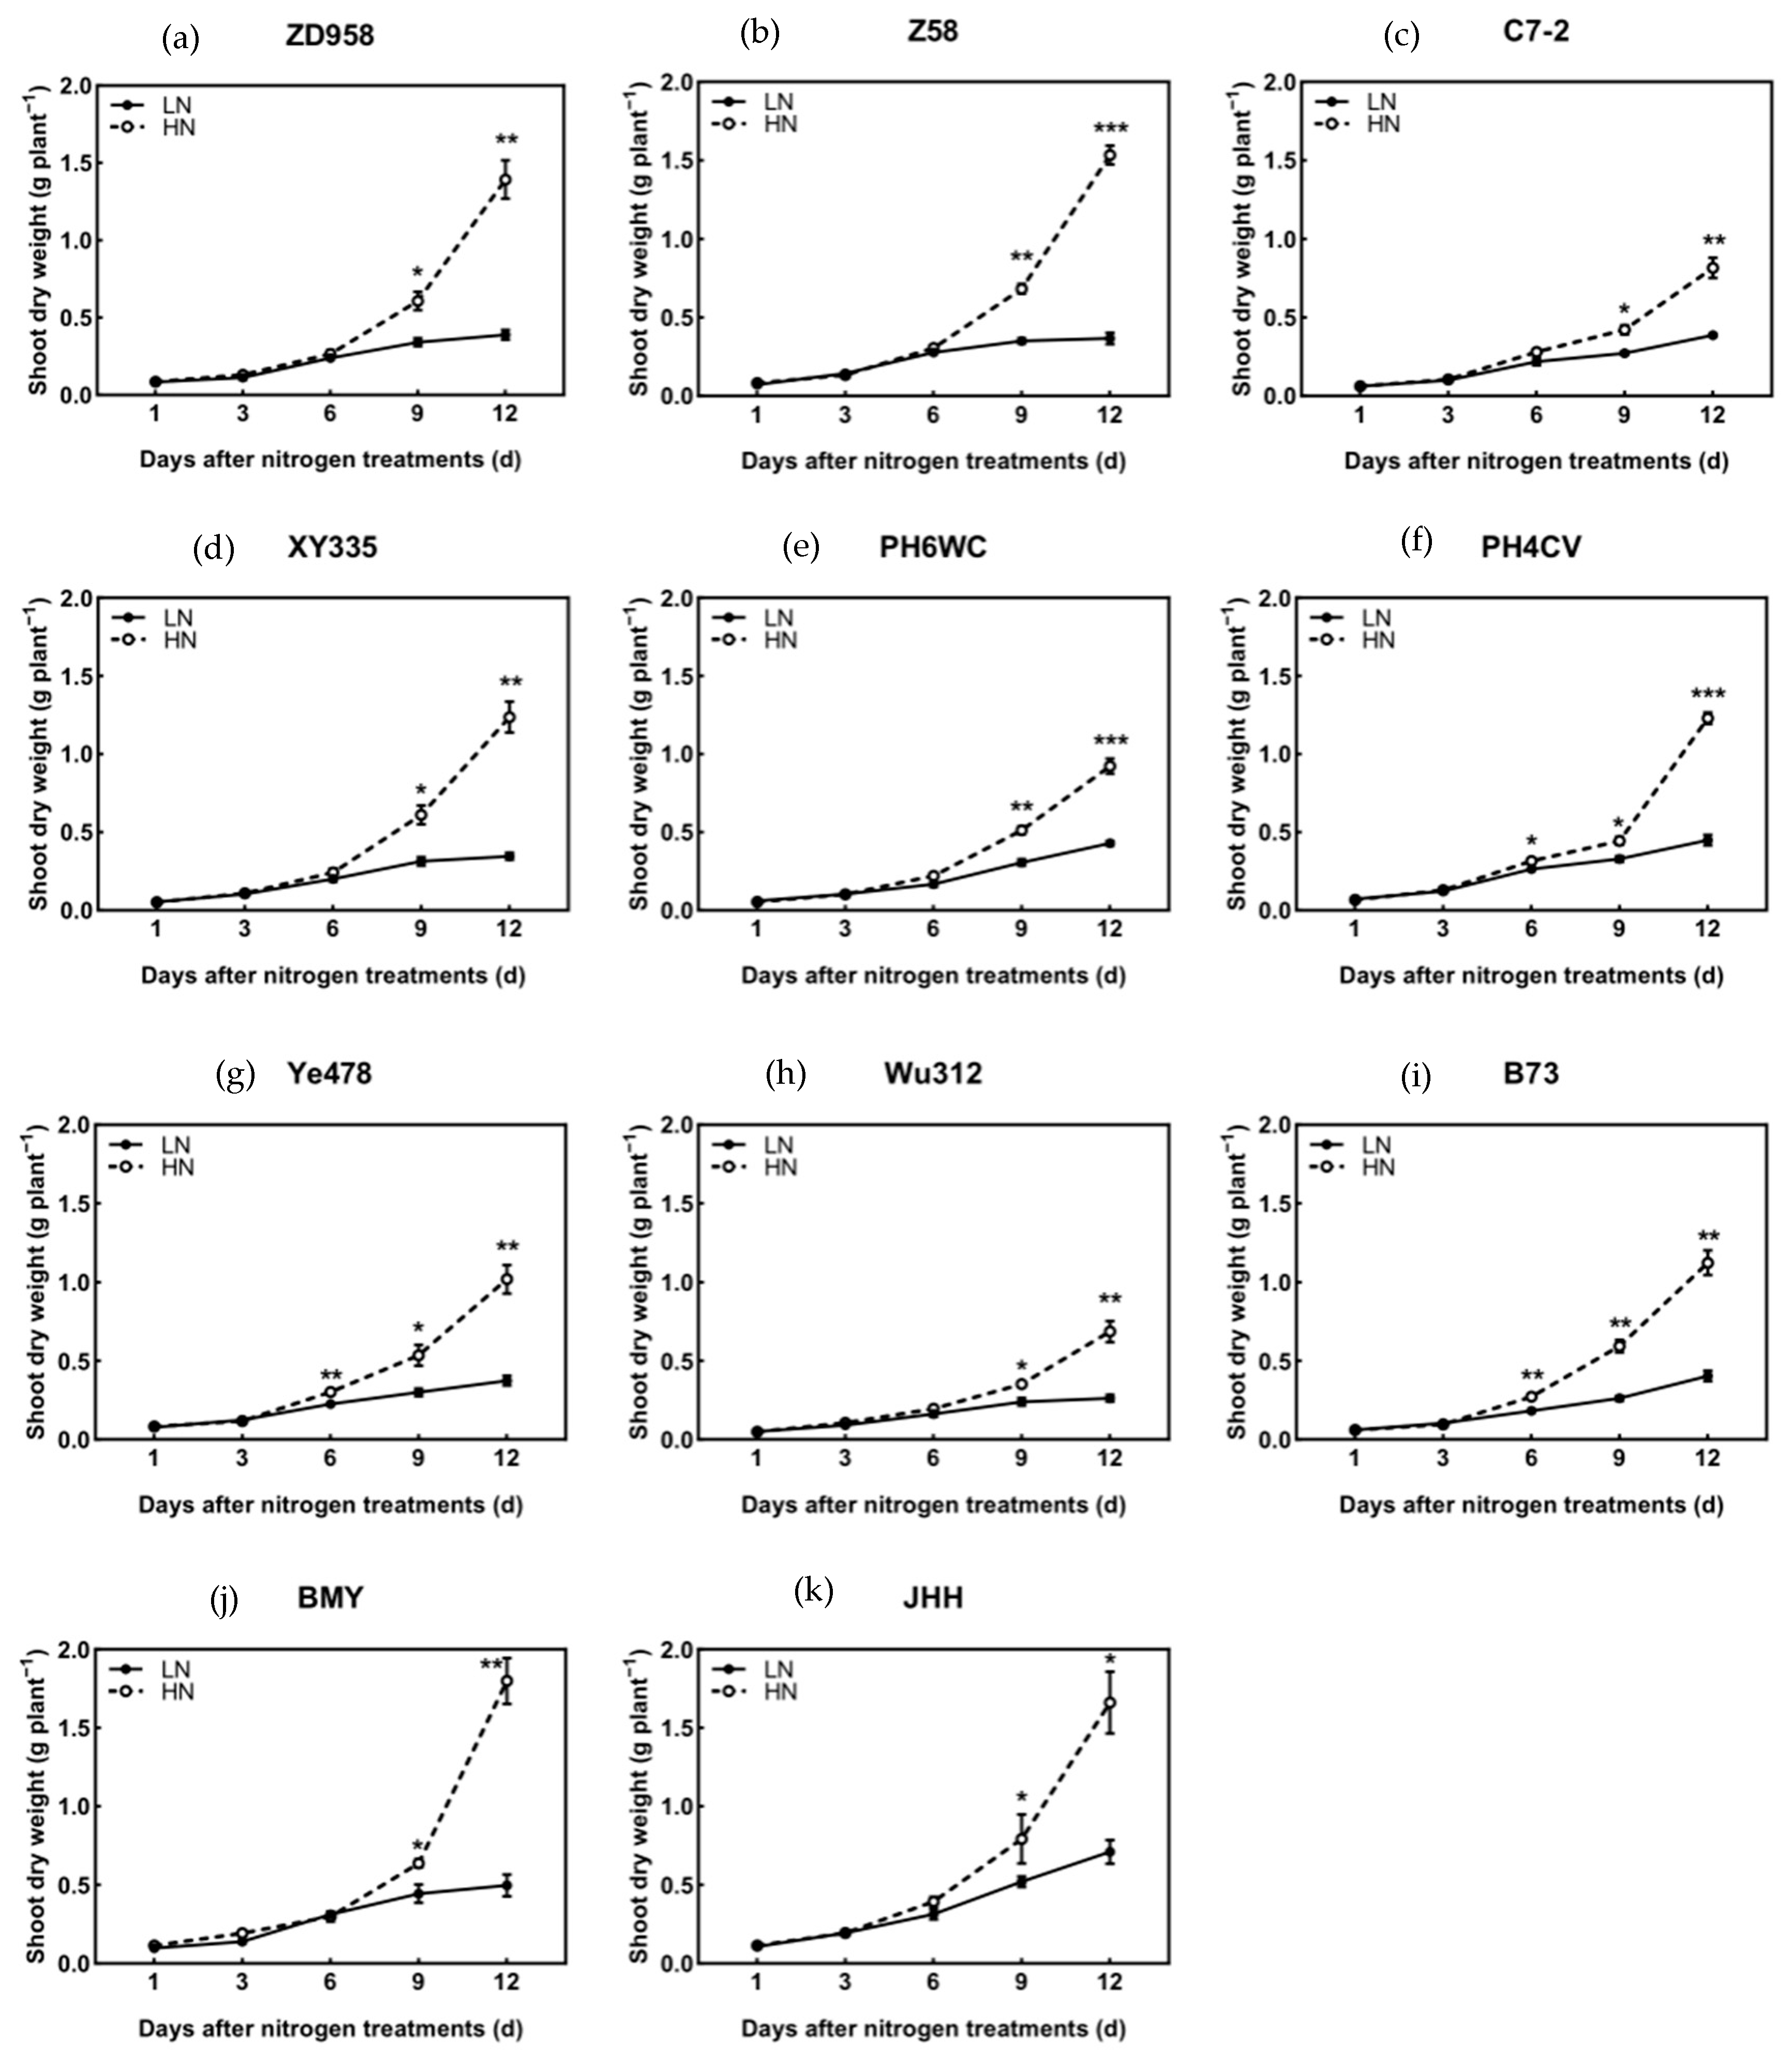
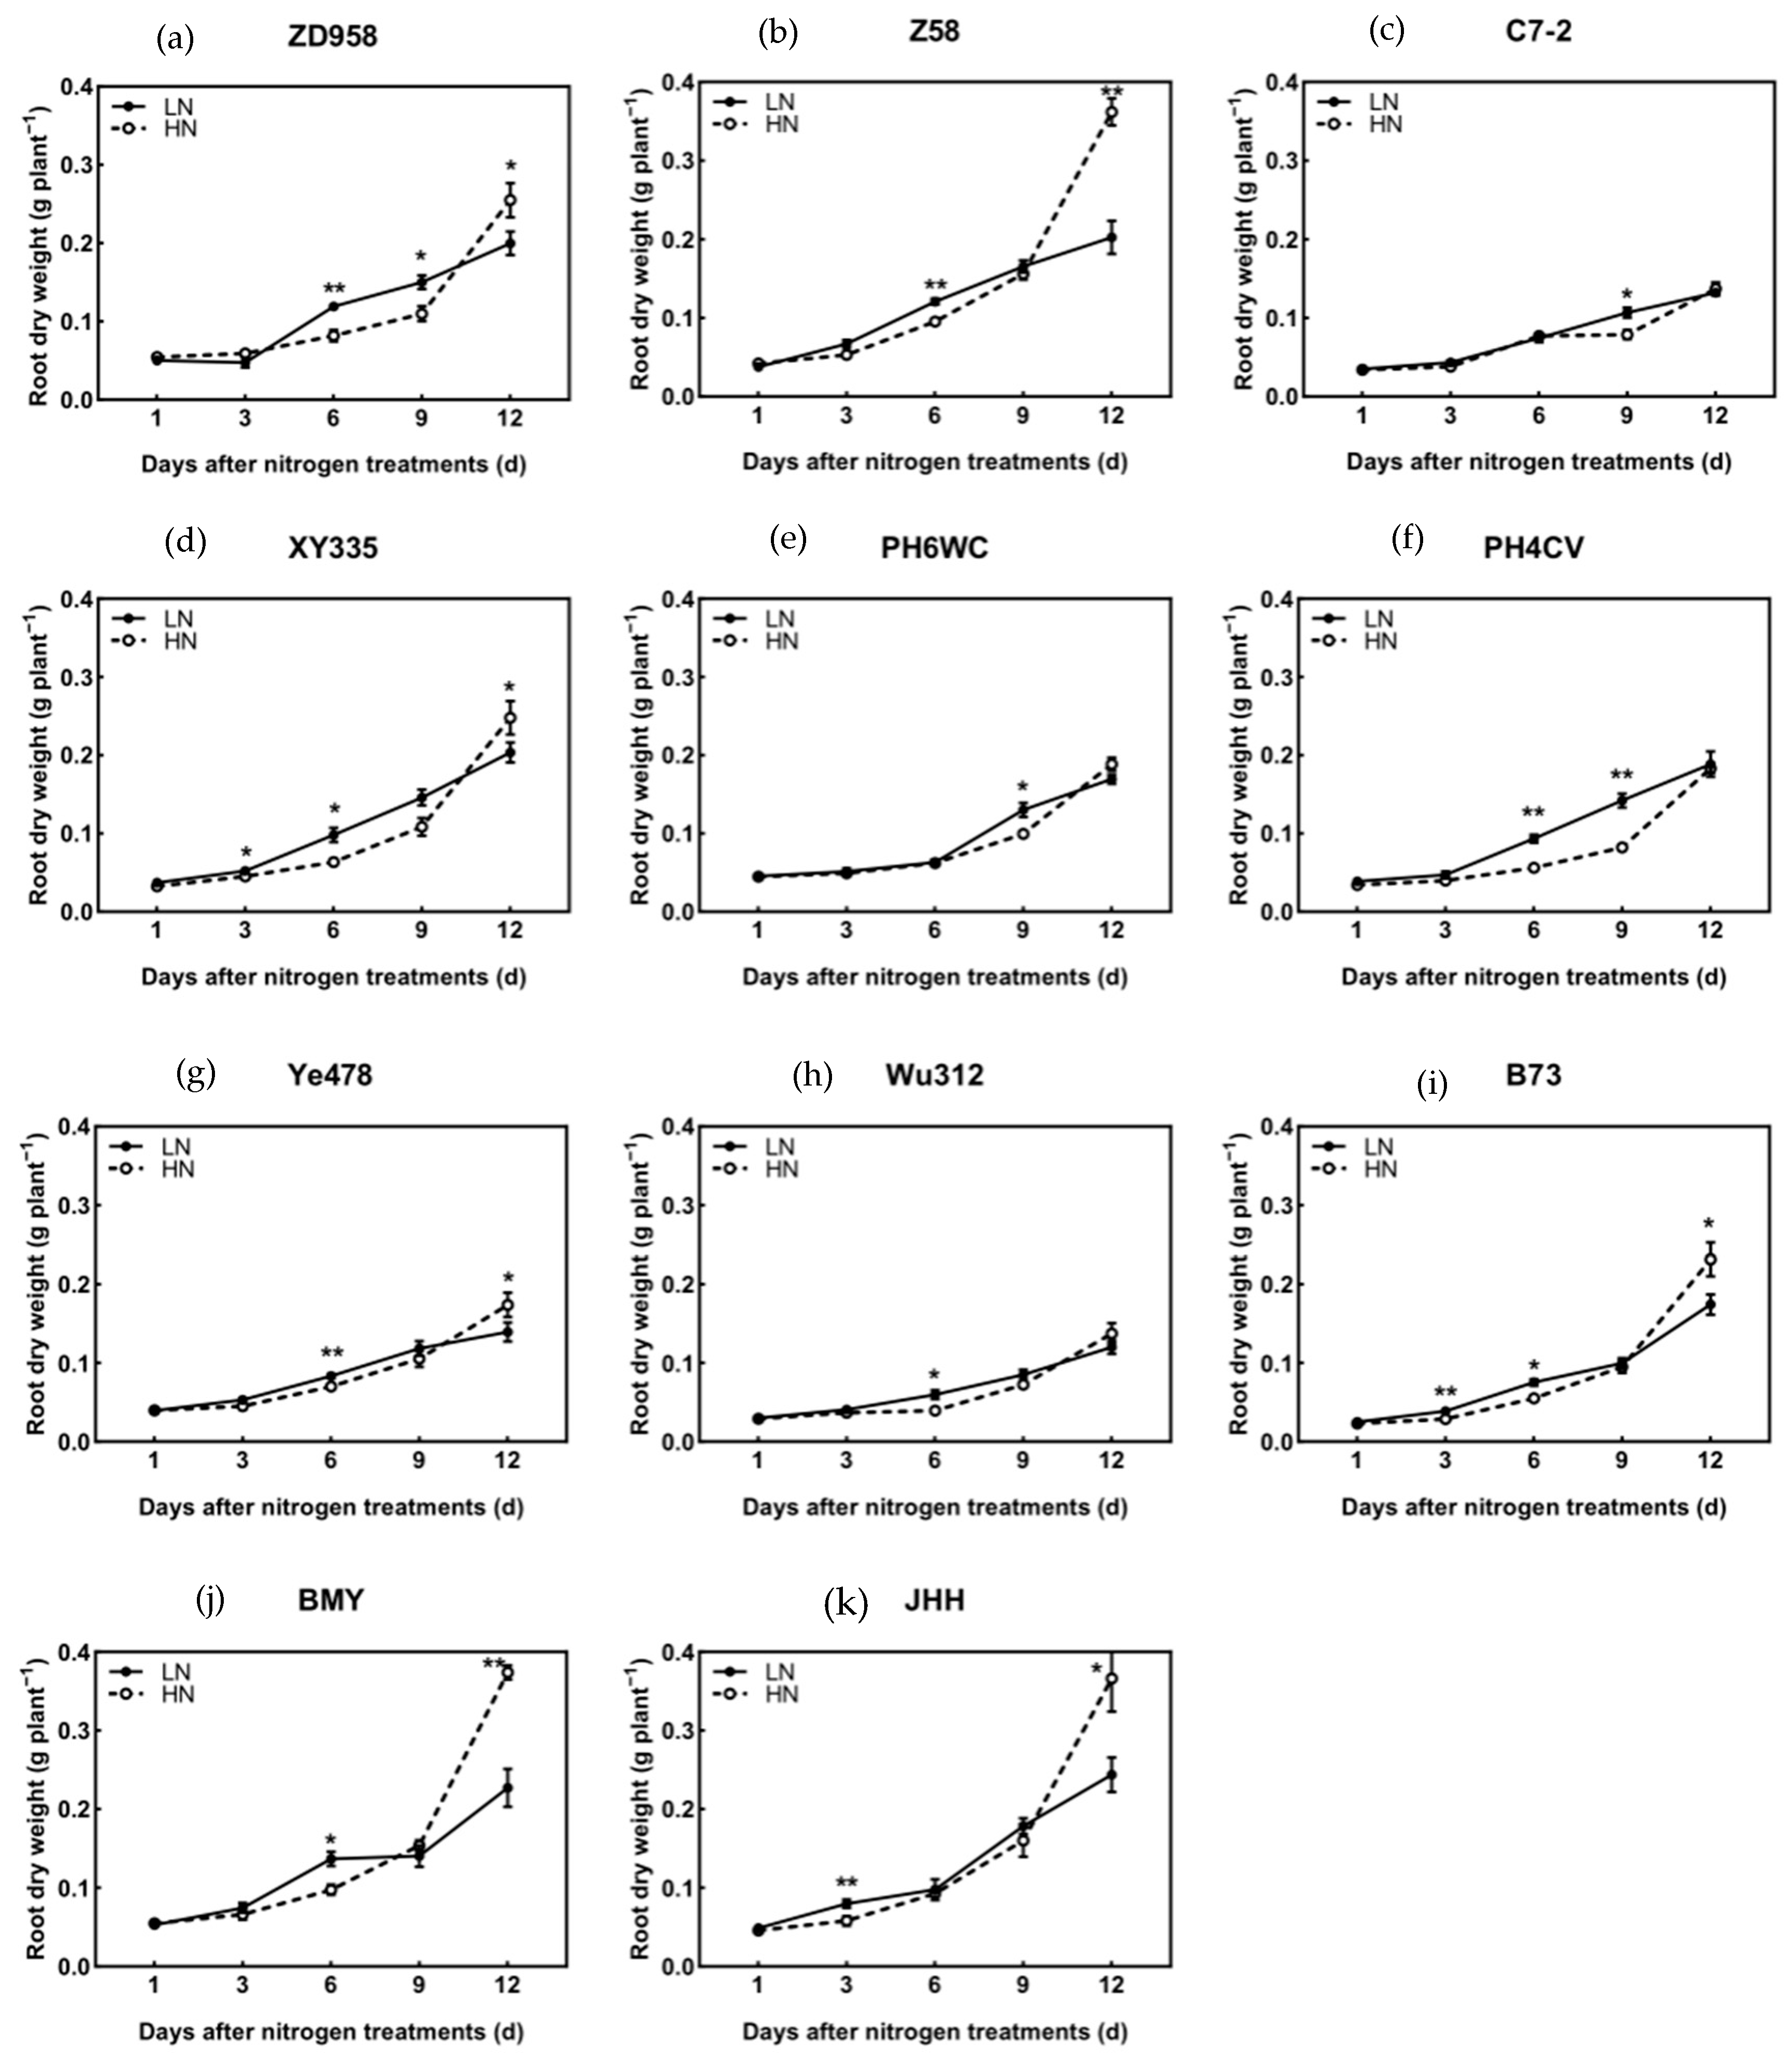
By measuring the plant height, leaf area and SPAD value on the 12th day after N treatment, it was found that the traits under low-N treatment was significantly lower than that under high-N treatment (Figure 1). For plant height, ZD958 was the most seriously affected genotype by low-N stress, decreased by 41%, and PH6WC was the lightest, decreased by 30%. Consistent with the results of shoot dry weight, the plant heights of the landraces BMY and JHH were the largest, and the plant height of Wu312 was the smallest, regardless of high-N or low-N treatment. As for leaf area, Z58 was the most seriously affected by low-N stress, decreased by 81%, and Ye478 was the lightest, decreased by 38%. Similarly, under high- and low-N treatments, Wu312 had the smallest leaf area, while BMY and ZD958 had the largest leaf area, respectively. For the SPAD value, we measured the SPAD value of the first to fifth leaves. Among them, the first leaf had turned yellow and withered in all genotypes under low-N treatment, which cannot be measured. Under high-N treatment, the SPAD value of the first leaf of ZD958 was the highest, and that of BMY was the lowest. Except for ZD958, C7-2 and Wu312, the other genotypes of the second leaf had turned yellow and withered under low N, which cannot be measured, indicating that the N transfer ability of these three genotypes might be weaker than other genotypes. Under high N, the SPAD value of the second leaf of ZD958 was still the highest, while BMY was still the lowest. Under low N, the third leaf of Z58 and JHH was still yellow and scorched, which could not be measured, indicating that the N transfer ability of these two genotypes was probably strong. Like the second leaf, the SPAD values of ZD958, C7-2 and Wu312 showed the smallest decrease under low-N conditions, while the SPAD values of the third leaf of BMY remained the lowest under high-N conditions. Because the fourth leaf of C7-2 and Wu312 did not grow under low N, the SPAD value could not be measured, indicating that these two genotypes grew slowly, and the SPAD value of the fourth leaf of Wu312 was the lowest under high N. Under low N, the landraces BMY and JHH had grown the fifth leaf, thus the SPAD value could be measured, indicating that the landraces grew faster than other genotypes at the seedling stage. Similarly, under high N, ZD958, Z58, XY335, PH6WC and B73 also grew the fifth leaf.

3.2. Biomass

With the extension of low-N treatment, the shoot dry weight of 11 genotypes was inhibited from the 6th to the 9th day after being subjected to low-N stress (Figure 2). The shoot dry weight of PH4CV, Ye478 and B73 began to be significantly lower than that of high N from the 6th day after low-N treatment, and other genotypes began to appear from the 9th day. After 12 days of low-N treatment, the shoot dry weight of Z58 decreased by 76%, while that of C7-2 decreased by 53%. Compared with inbred lines, the shoot dry weight of landraces and modern hybrids was more severely inhibited by low N. ZD958 was closer to its female parent Z58, while XY335 was closer to its male parent PH4CV. Whether under high- or low-N treatment, the shoot dry weight of landraces BMY and JHH was the largest among all genotypes, and that of Wu312 was the smallest.
In terms of root biomass, our research discovered that as the low-N stress persisted, the root biomass of each genotype generally increased significantly from the 3rd to the 6th day after the N treatment and then was gradually reversed by high N on the 12th day (Figure 3). At the harvest time of 12th day, no matter whether under low- or high-N treatment, the root dry weight of landraces BMY and JHH, the modern hybrids ZD958, XY335 and the inbred line Z58 were higher than that of other inbred lines, while the root dry weight of Wu312 and C7-2 was the smallest.
From the third to the sixth day following the low-N treatment, the root to shoot ratio of 11 genotypes increased by different extents. However, the response of PH6WC was relatively sluggish, and its root to shoot ratio exhibited a significant increase after 9 days of N stress (Figure 4). Among them, the increase in modern hybrid ZD958 and XY335 was the most significant, increasing by 196% and 181%, respectively, while the increase in landrace JHH was only 55%. Moreover, under low N, the root to shoot ratio of ZD958, XY335 and Z58 was significantly higher than that of other genotypes, indicating that the modern hybrid could more actively respond to low-N stress and showed a relative promotion in root growth. The root to shoot ratios of different genotypes under high N were basically maintained at about 0.2, which may be an adaptive mechanism for maize to coordinate the shoot and root growth.

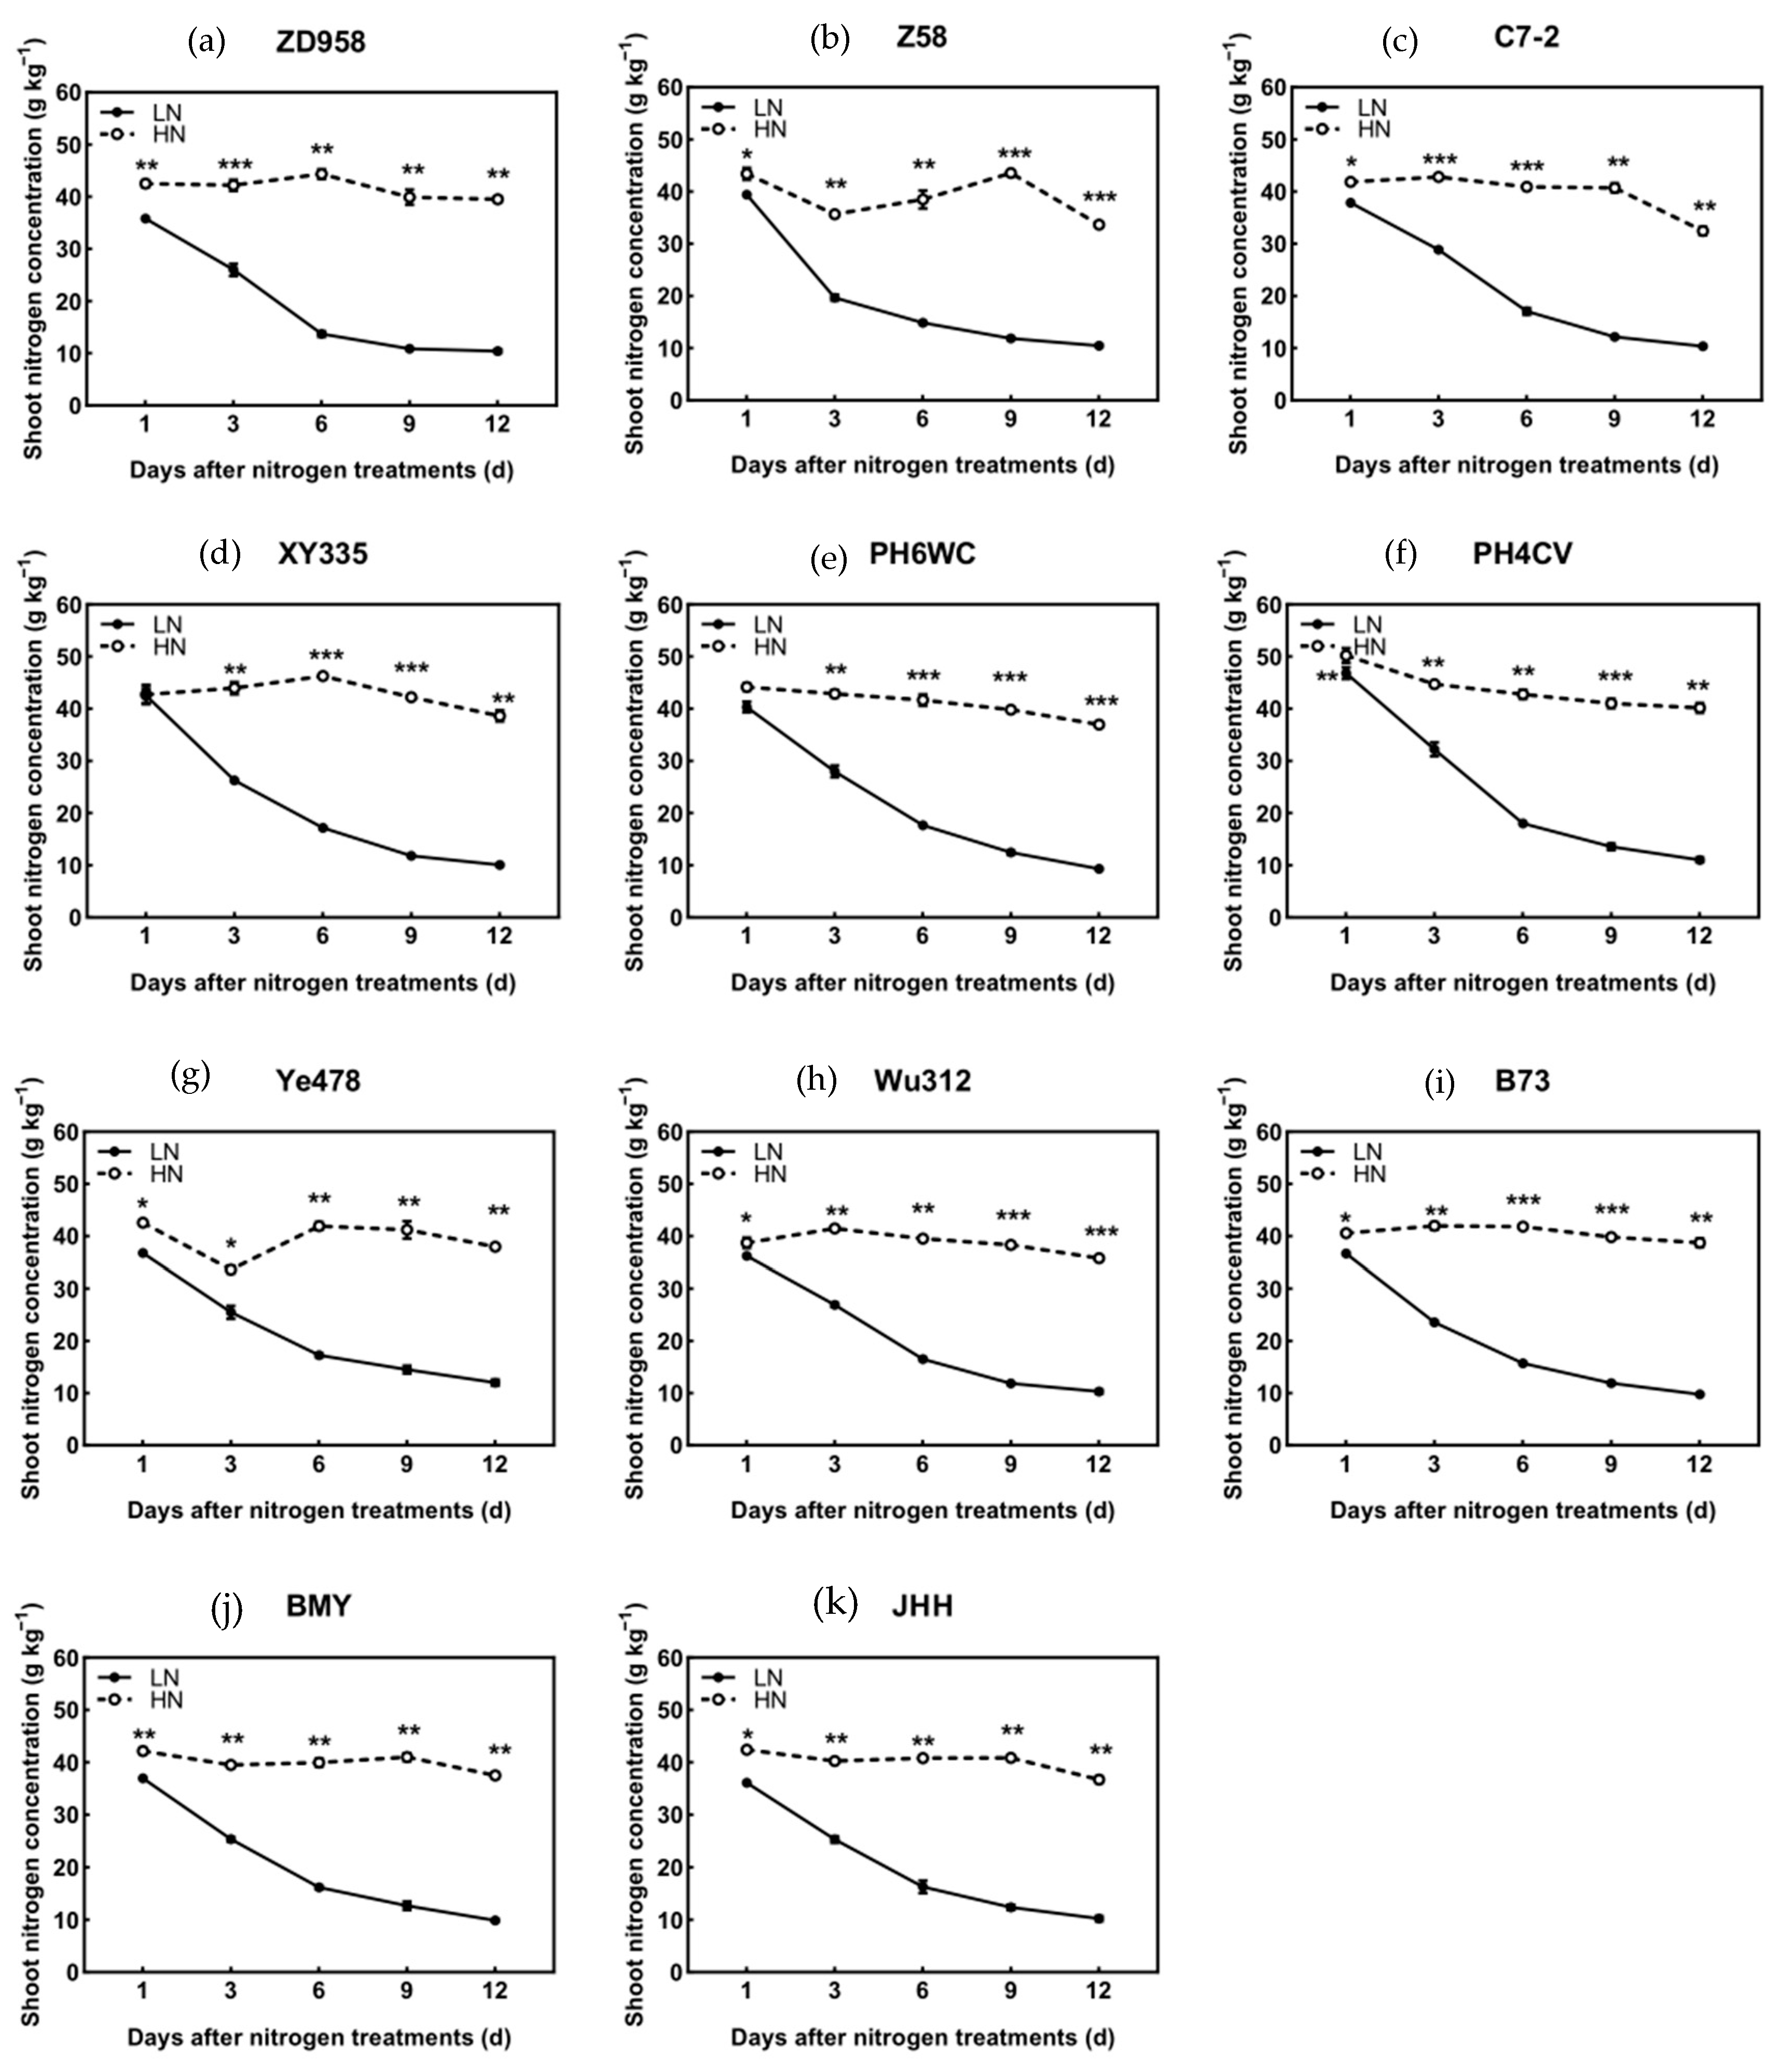
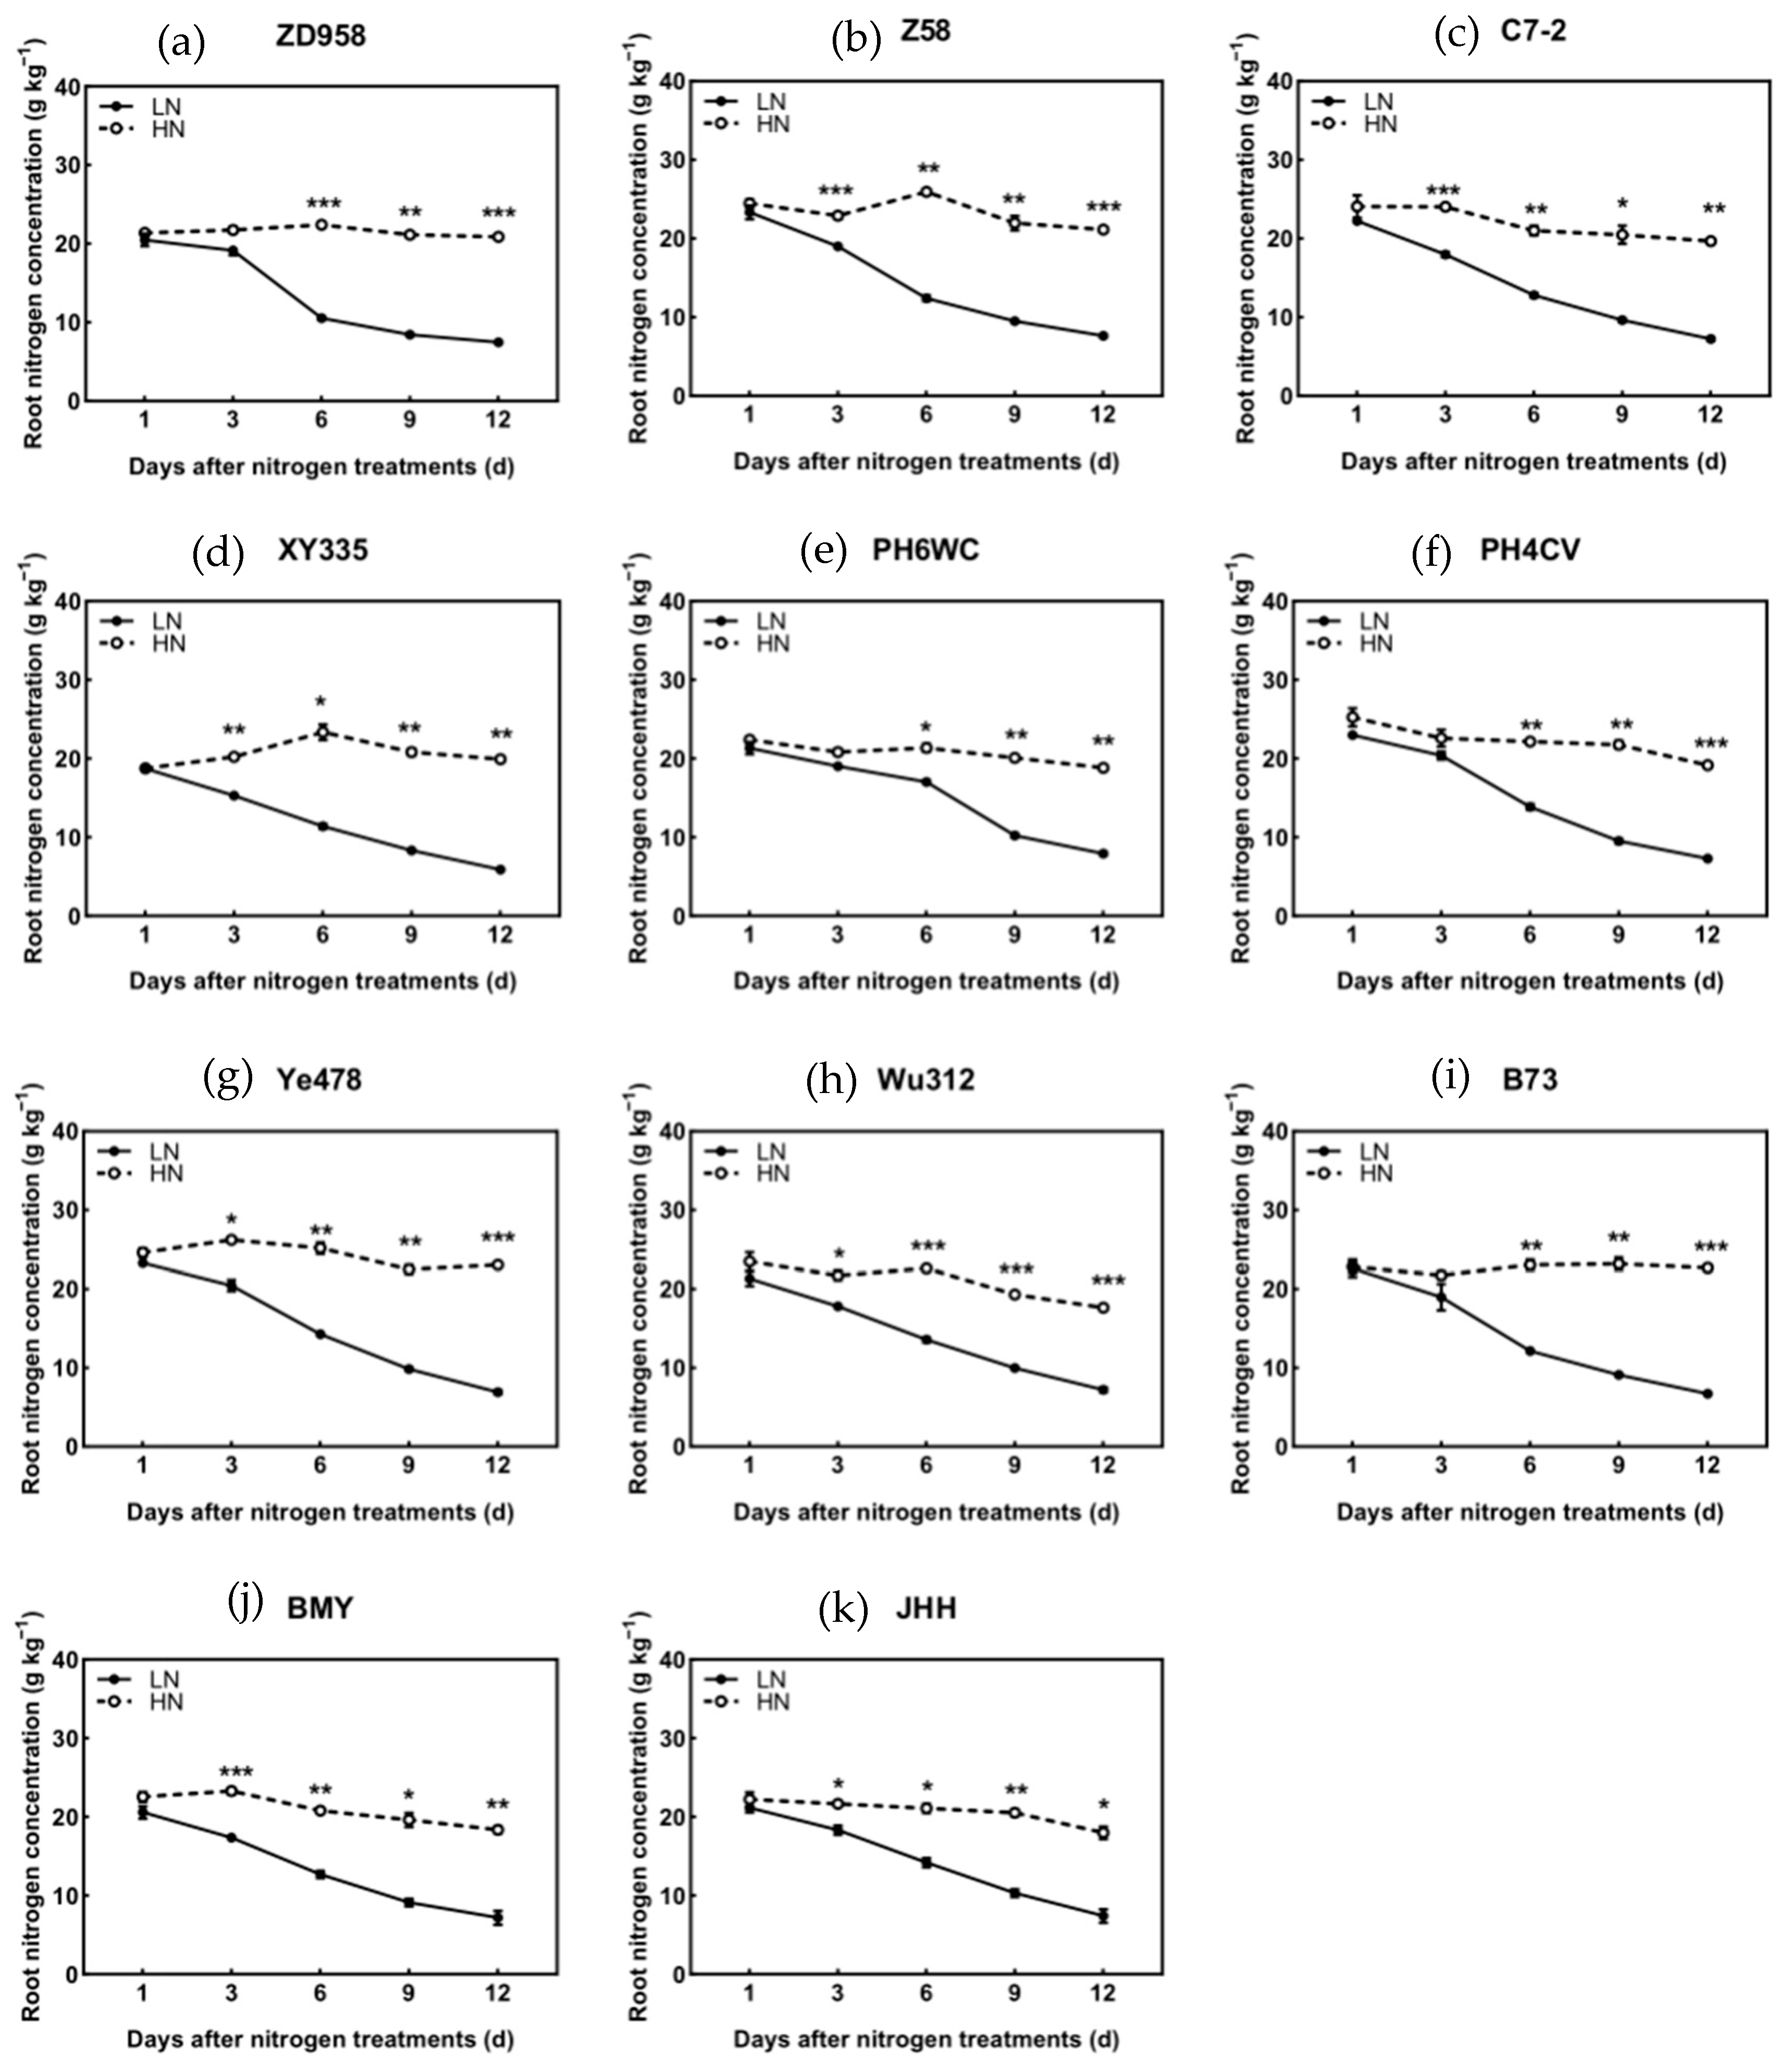
3.3. N Concentration
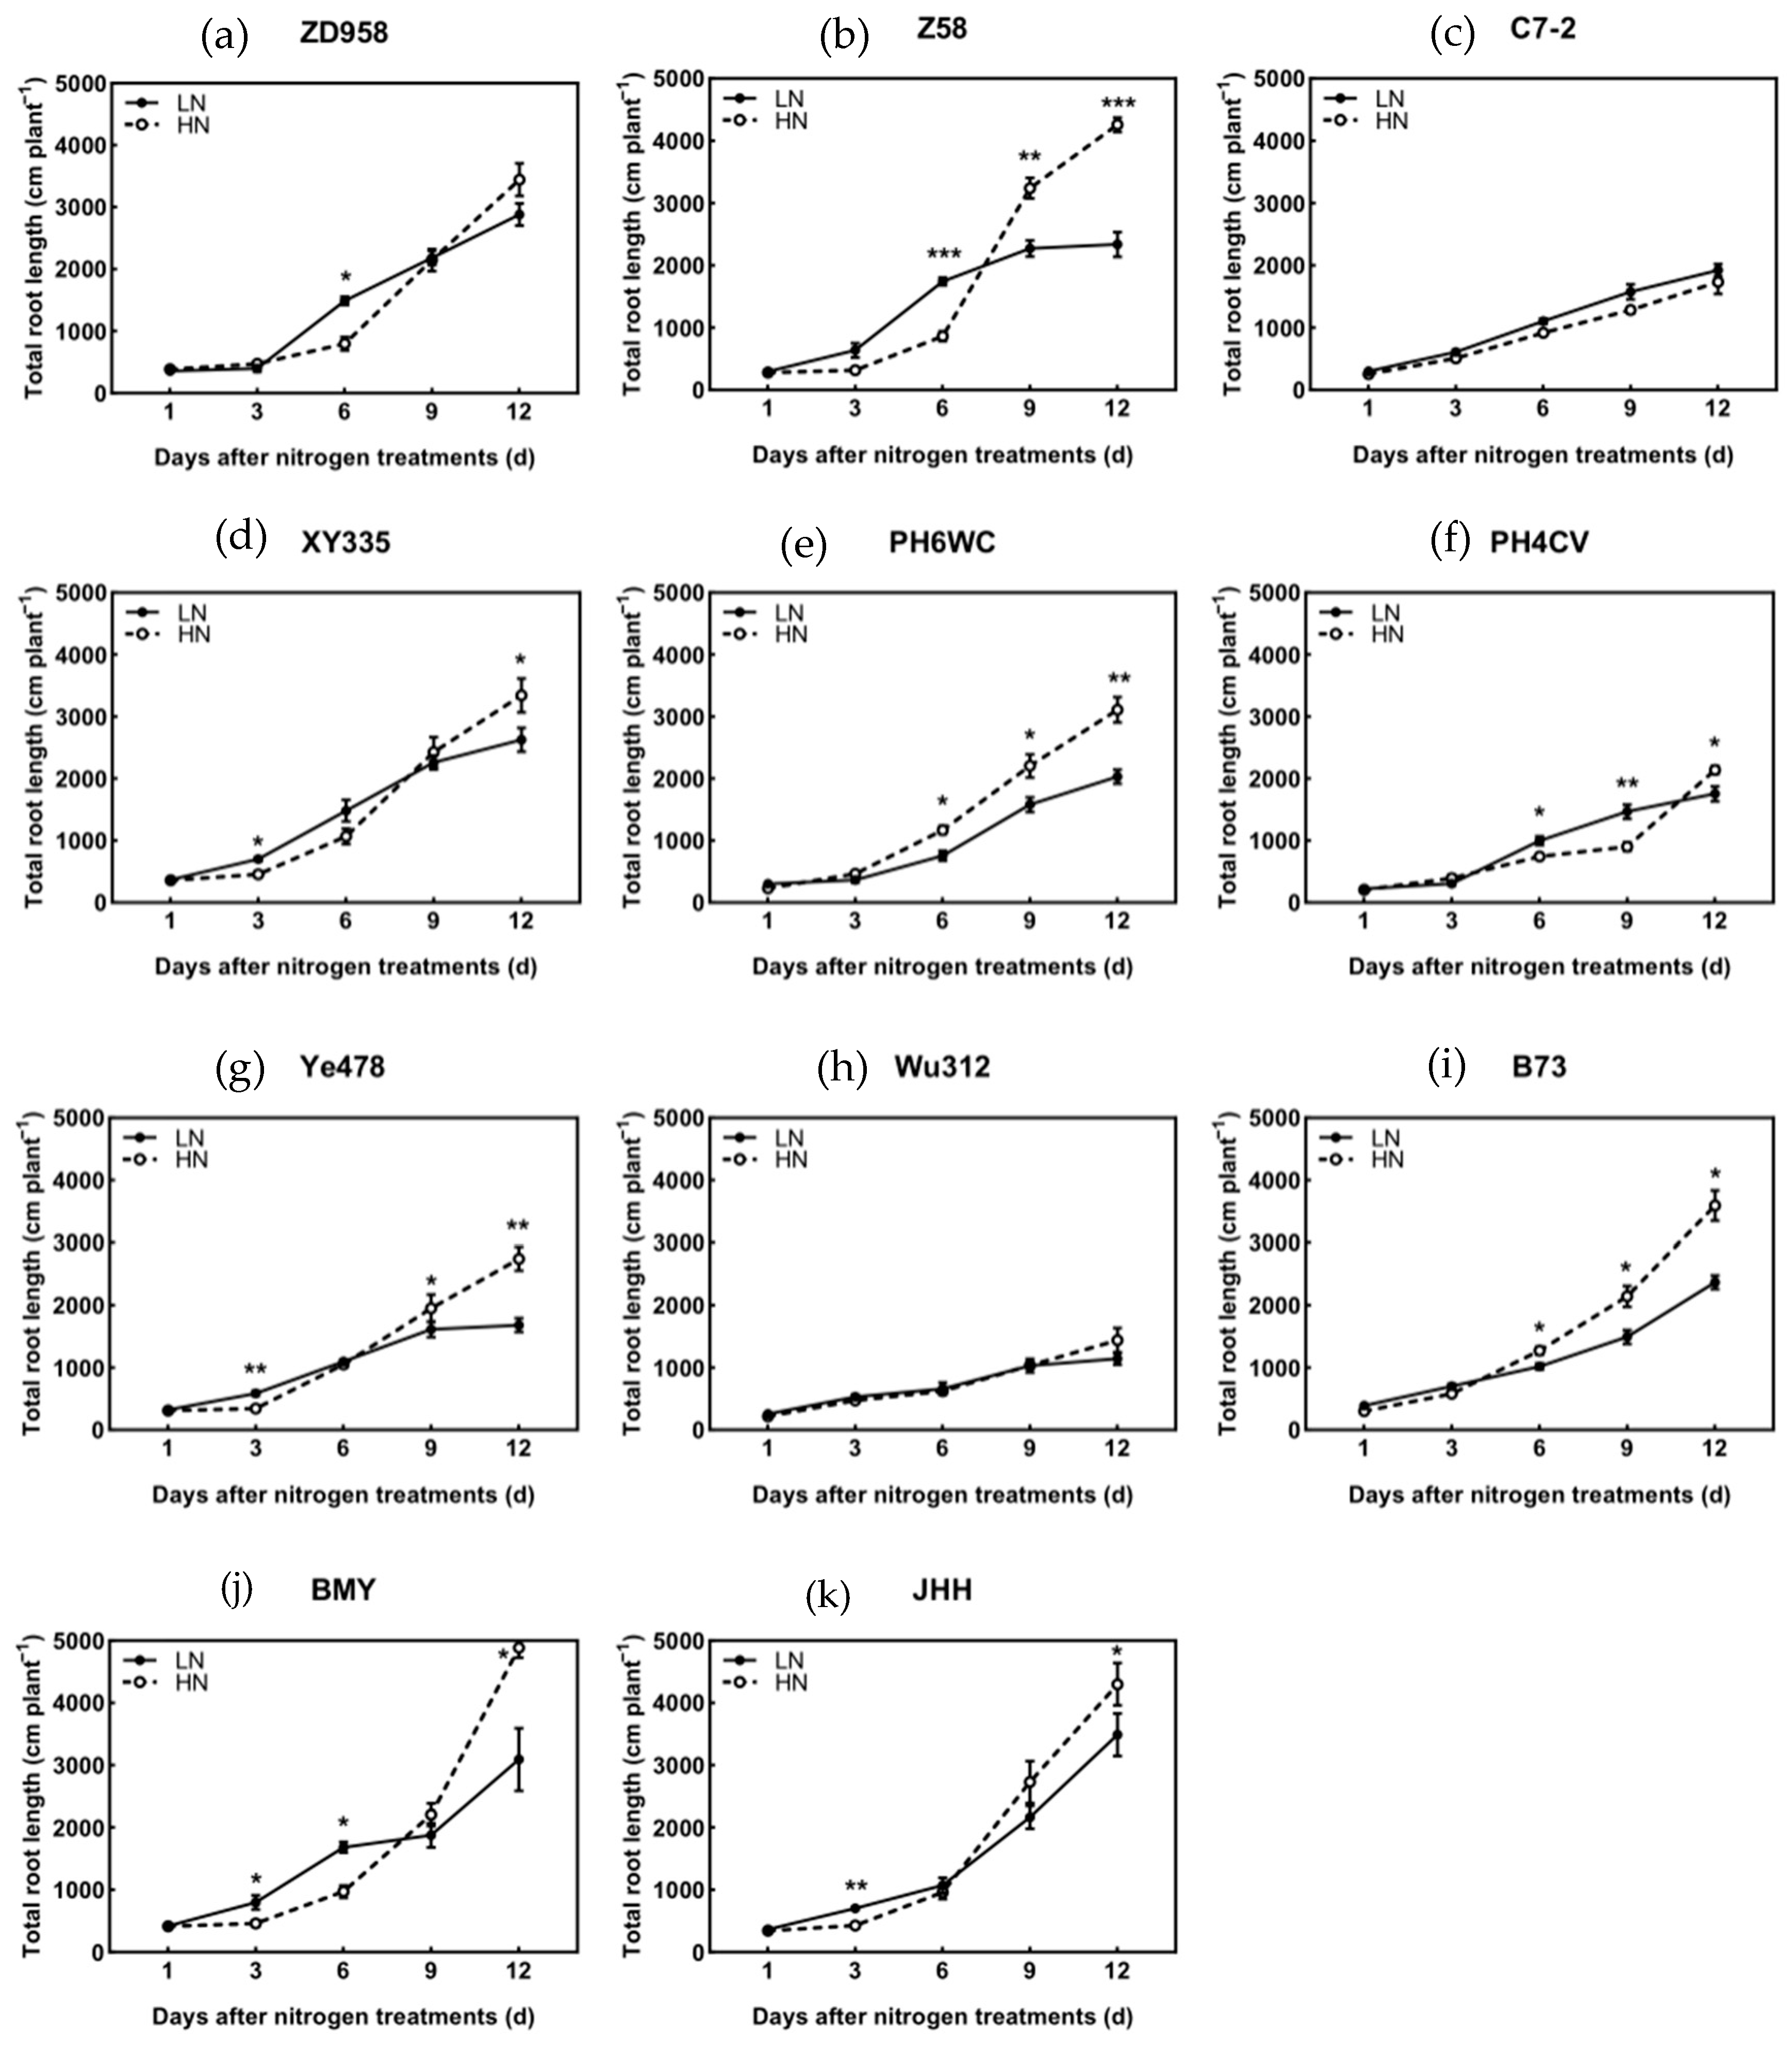
Except for XY335 and PH6WC, the shoot N concentration of other genotypes began to decline significantly after 1 day of low-N stress, and continued, while the shoot N concentration remained basically stable under high N (Figure 5). Low-N stress reduced the shoot N concentration, and the degree of reduction continued to increase with the duration of N stress. At the harvest time of 12th day, there was no significant difference in the reduction in shoot N concentration of each genotype under low N, which was about 70%, and the absolute amount was about 10 g kg−1. Under high N, the shoot N concentration of PH4CV was the highest, and that of C7-2 was the lowest.
Under high-N treatment, the shoot and root N concentrations of 11 genotypes remained stable throughout the experiment, and the shoot N concentration was higher than that in the root, close to twice. Compared with the shoot N concentration, the root N concentration decreased later under low N. Except for ZD958, PH6WC, PH4CV and B73, which began to decrease significantly on the 6th day of N stress, other genotypes began to decrease significantly on the 3rd day after N treatment (Figure 6). Low-N stress reduced the root N concentration, and the degree of reduction continued to increase with the duration of N stress, and the extent of reduction in the root N concentration was smaller than that in the shoot, with the highest reduction of 71% for XY335 and the lowest reduction of 58% for PH6WC. The absolute amount of root N concentration was about 7g kg−1 under low N. Under high N, the root N concentration of Ye478 was the highest and Wu312 was the lowest.

3.4. Root Length

In our research, as the degree of low-N stress increased, the total root lengths of different genotypes exhibited various trends, which could be categorized into three types. The total root lengths of ZD958, Z58, XY335, PH4CV, Ye478, BMY and JHH were considerably longer under the low-N treatment than under high-N treatment from 3 to 6 days after treatment, and then were gradually reversed by high N. However, there was no difference in the total root length of C7-2 and Wu312 under both high- and low-N conditions throughout the entire process. The third category included PH6WC and B73. For these two genotypes, the total root length under high nitrogen was significantly longer than that under low N starting from the 6th day after treatment and continued to be so (Figure 7). At the last harvest, the total root length of the landraces and modern hybrids under low-N treatment was significantly longer than that of other inbred lines, while that of the landraces under high-N treatment was still the longest. The total root length of Wu312 was the shortest under both high- and low-N treatments.
The total axial root length of the different genotypes also responded differently to N supply. Among them, the total axial root length of ZD958, Z58, C7-2, XY335, Ye478, BMY and JHH significantly lengthened under the low-N treatment, while that of PH6WC, PH4CV, Wu312 and B73 did not differ under high- and low-N treatment (Figure 8). At the 12th day after treatment, BMY and Wu312 had the longest and shortest total root length under high- and low-N treatment, respectively. Because the total axial root length might be affected by the number of axial roots, we analyzed the average axial root length of different root types to eliminate the effect of the number of axial roots, and more intuitively observe the response of the axial root length of different genotypes to N supply.
The proportion of total lateral root length to total root length of different genotypes was different. At the 12th day after N treatment, the total lateral root length of different genotypes under high N accounted for 80% to 91% of the total root length, and the proportion of the total lateral root length decreased to different degrees in different genotypes under low N, ranging from 74% to 86%, indicating that the importance of total axial root length under low N increased. Because the total lateral root length accounted for a large proportion of the total root length, the change trend in the total lateral root length was basically consistent with the total root length (Figure 9).

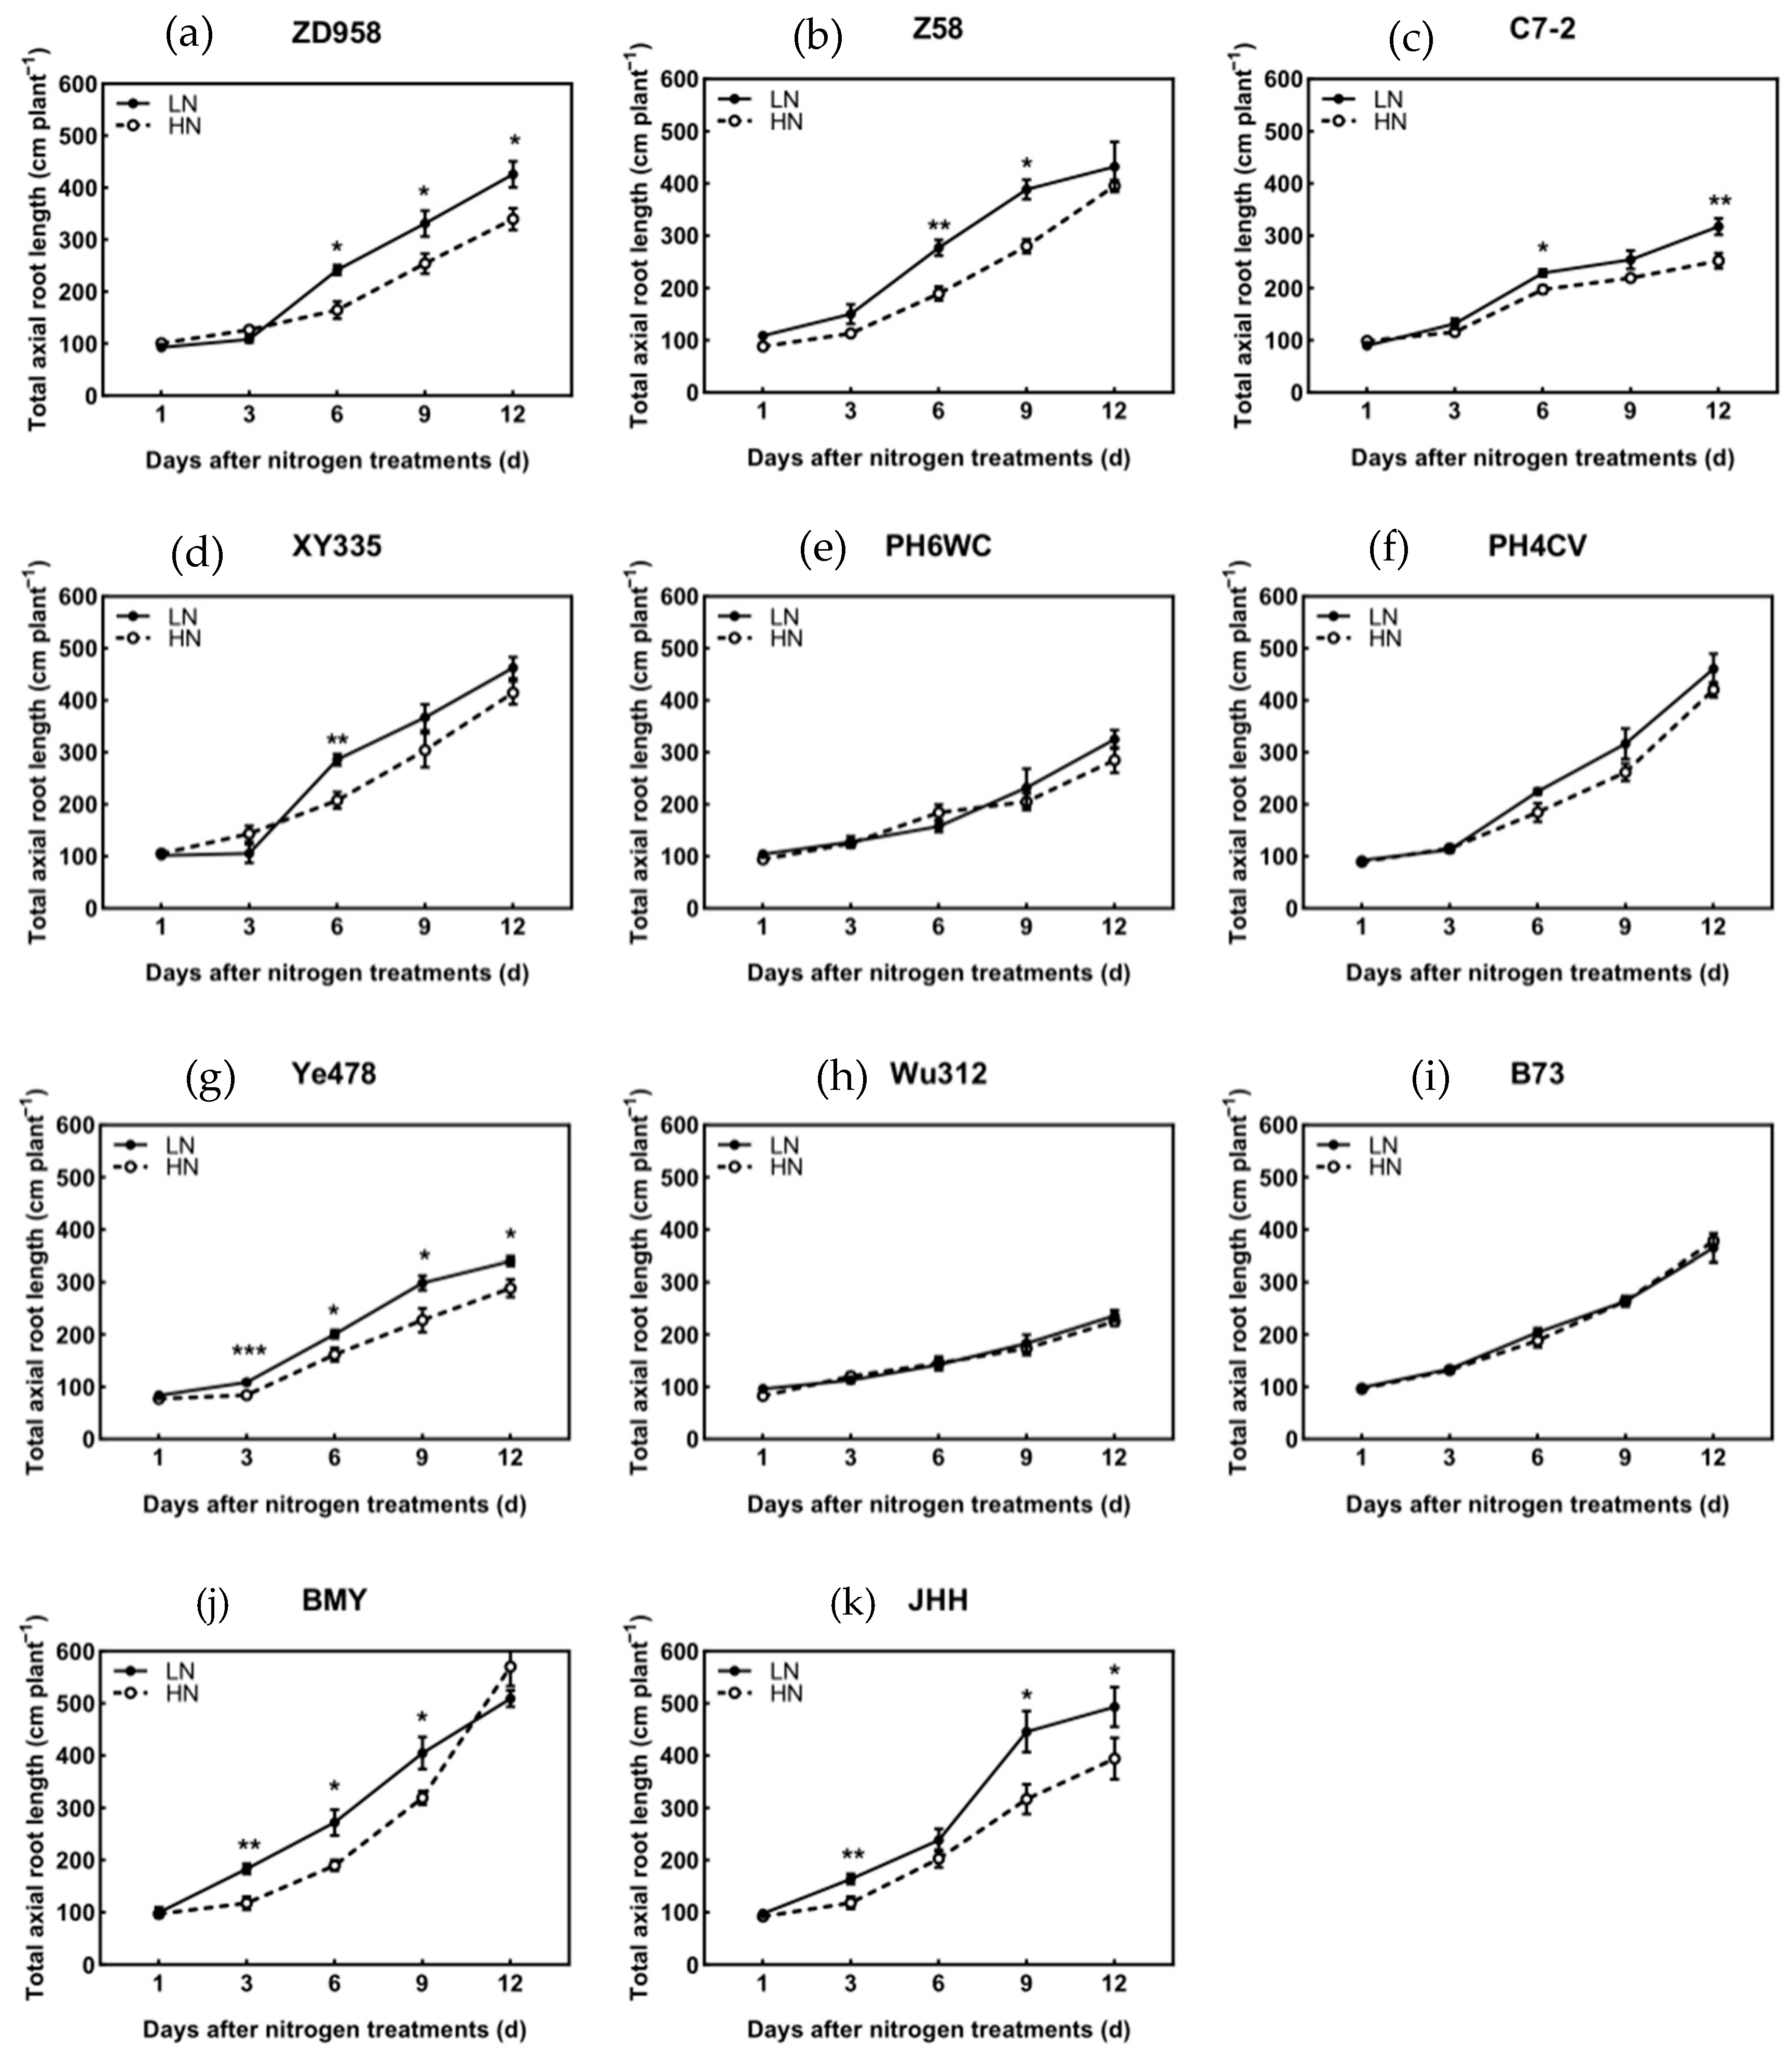
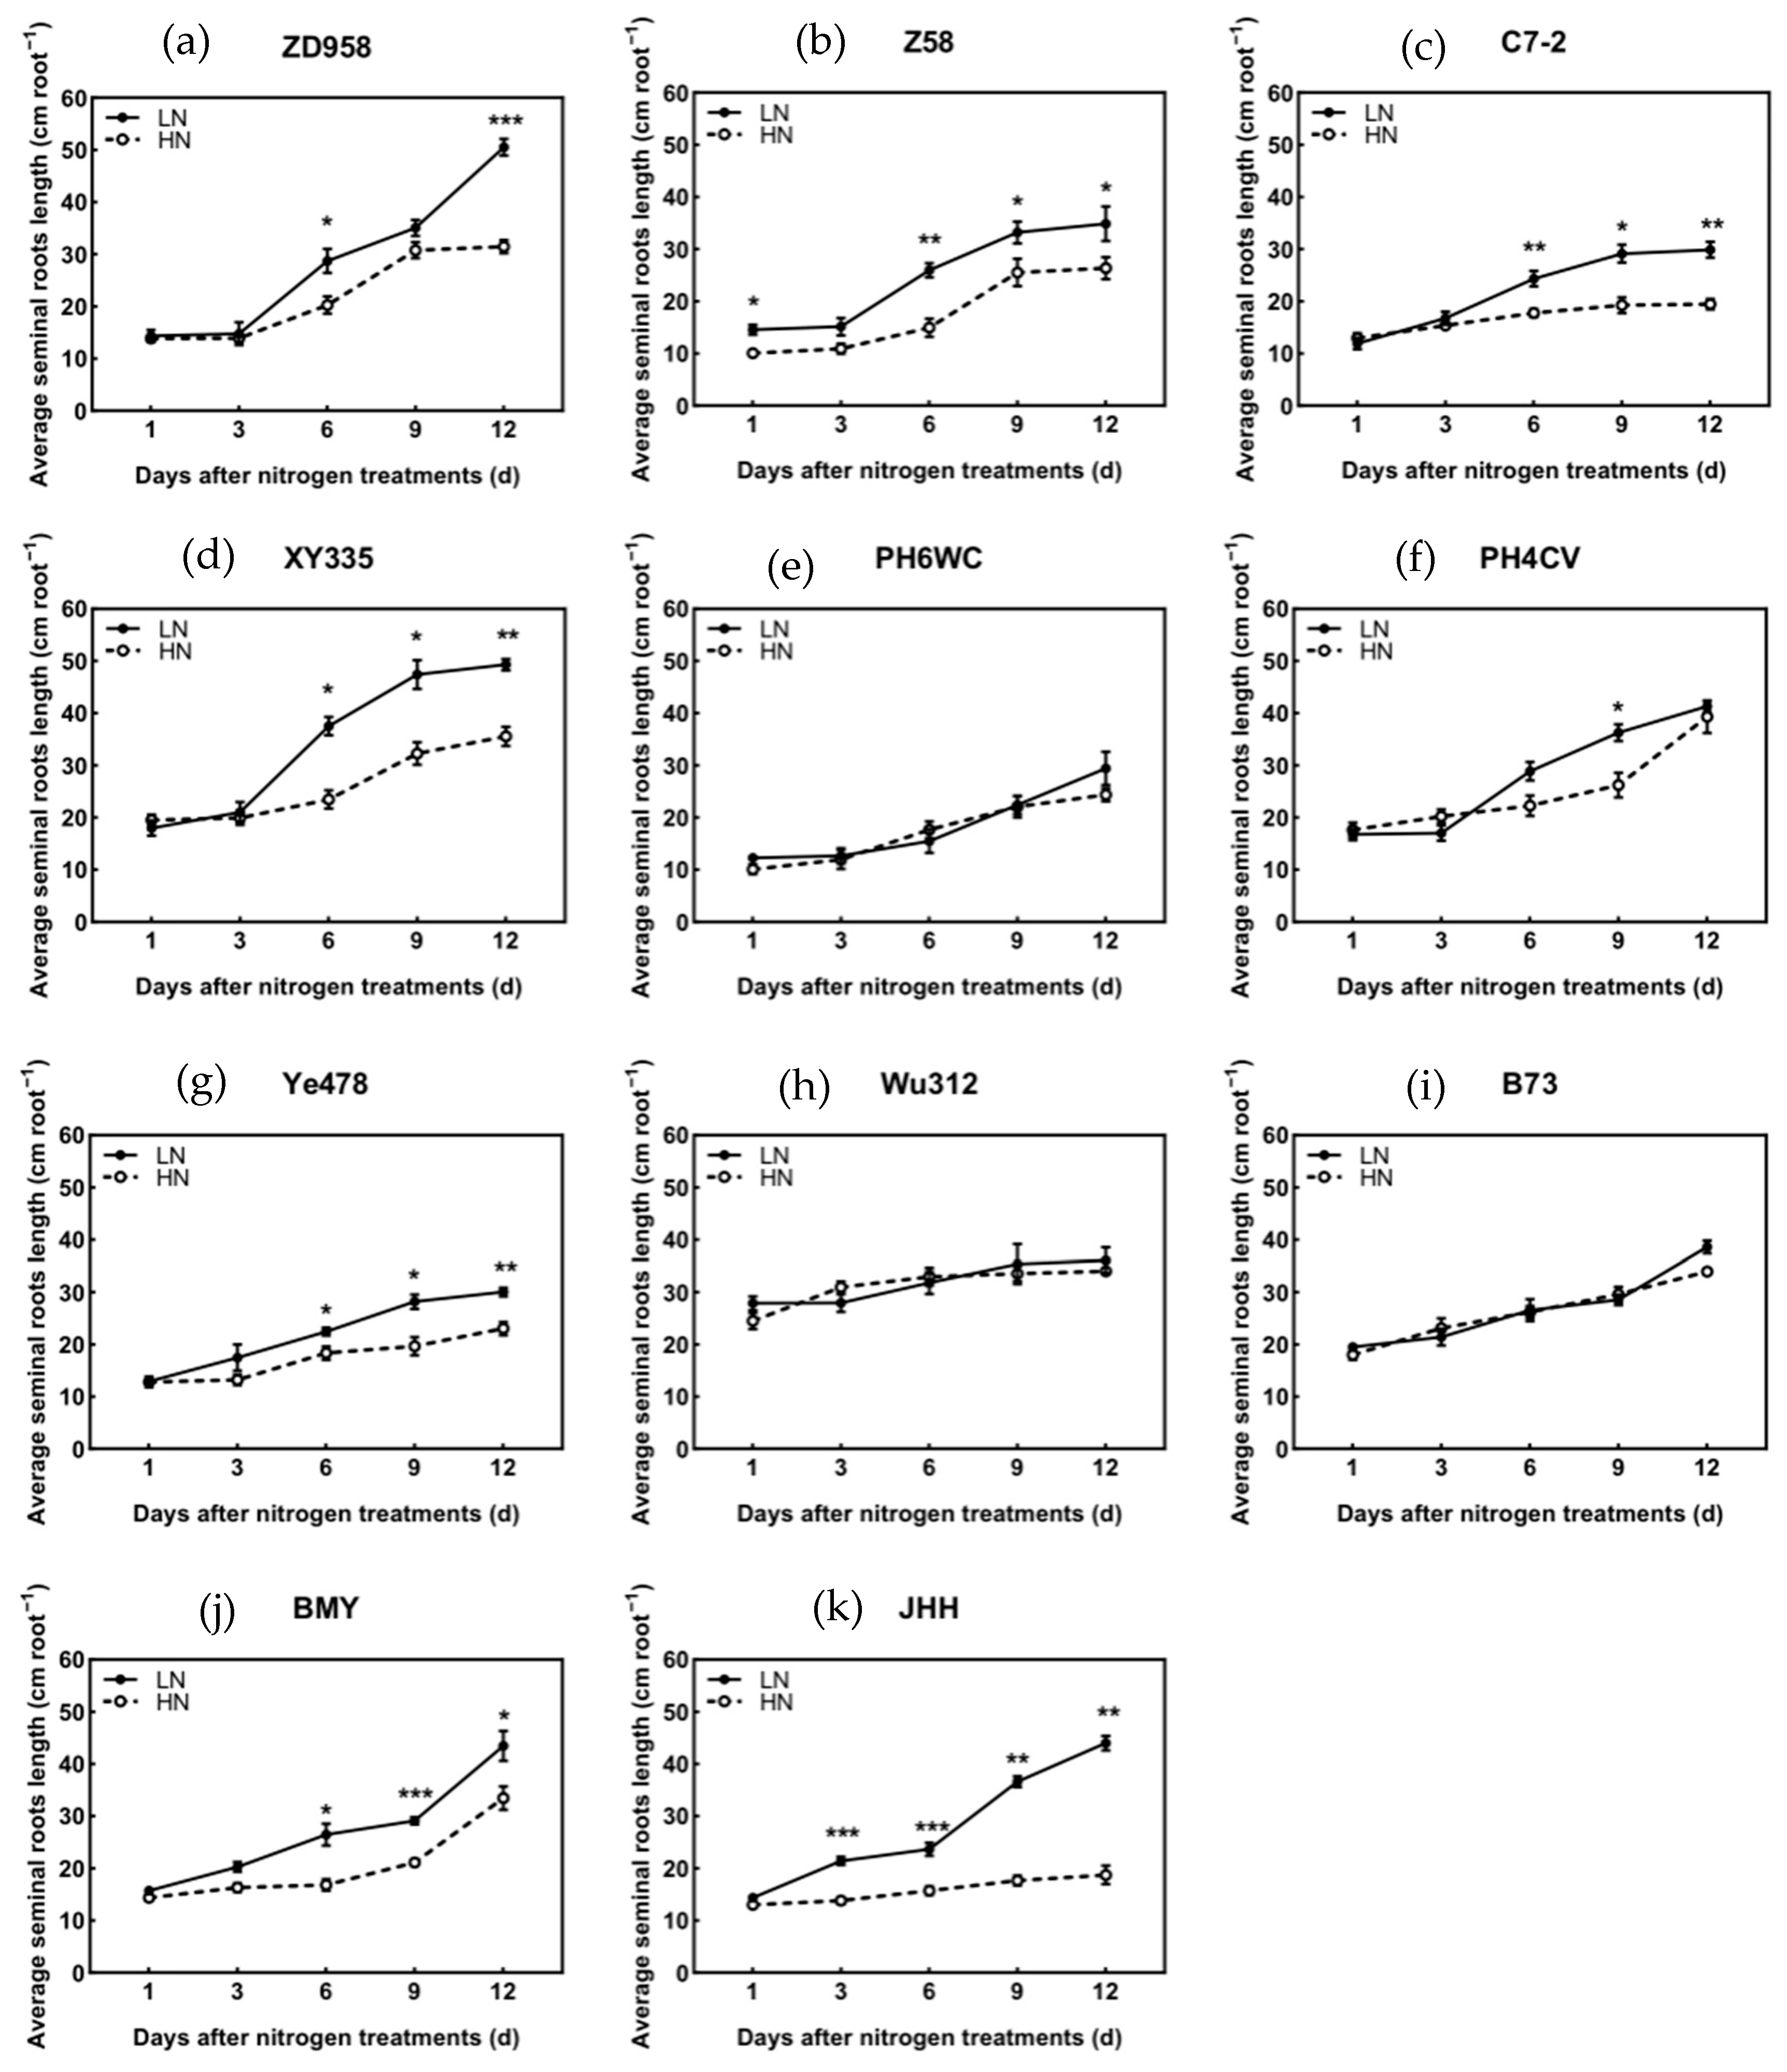
3.5. Axial Root Length of Different Root Types

The low-N treatment significantly promoted the elongation of the primary roots of other genotypes except for Wu312 and B73 (Figure 10), with the highest elongation amplitude observed in the landrace JHH, reaching 139% at 9 days and 147% at 12 days after low-N treatment. This phenomenon began to occur 3 to 6 days after N treatment and continued. When treated for 12 days, the two modern hybrids ZD958 and XY335 had the longest primary root length, regardless of high- or low-N treatment.
The low-N treatment significantly promoted the seminal root elongation of other genotypes except for PH6WC, Wu312 and B73 (Figure 11), with the highest elongation amplitude observed in the landrace JHH, reaching 107% at 9 days and 135% at 12 days after low-N treatment. This phenomenon began to occur 3 to 6 days after N treatment and continued. After 12 days of treatment, under low-N treatment, the two hybrids ZD958 and XY335 had the longest average seminal roots length as the primary root.
Different from primary root and seminal roots, the average first whorl crown root length of Ye478 was not promoted by low-N stress, which might be due to the different growth patterns of the postembryonic root and embryonic root. PH6WC and Wu312 were the same as Ye478, and the other genotypes significantly increased average first whorl crown root lengths under low N (Figure 12). On the 12th day of harvest, ZD958 and JHH had the highest elongation amplitude of first whorl crown roots, both exceeding 100%. Under high- and low-N treatments, the first whorl crown root length of Wu312 was the shortest.

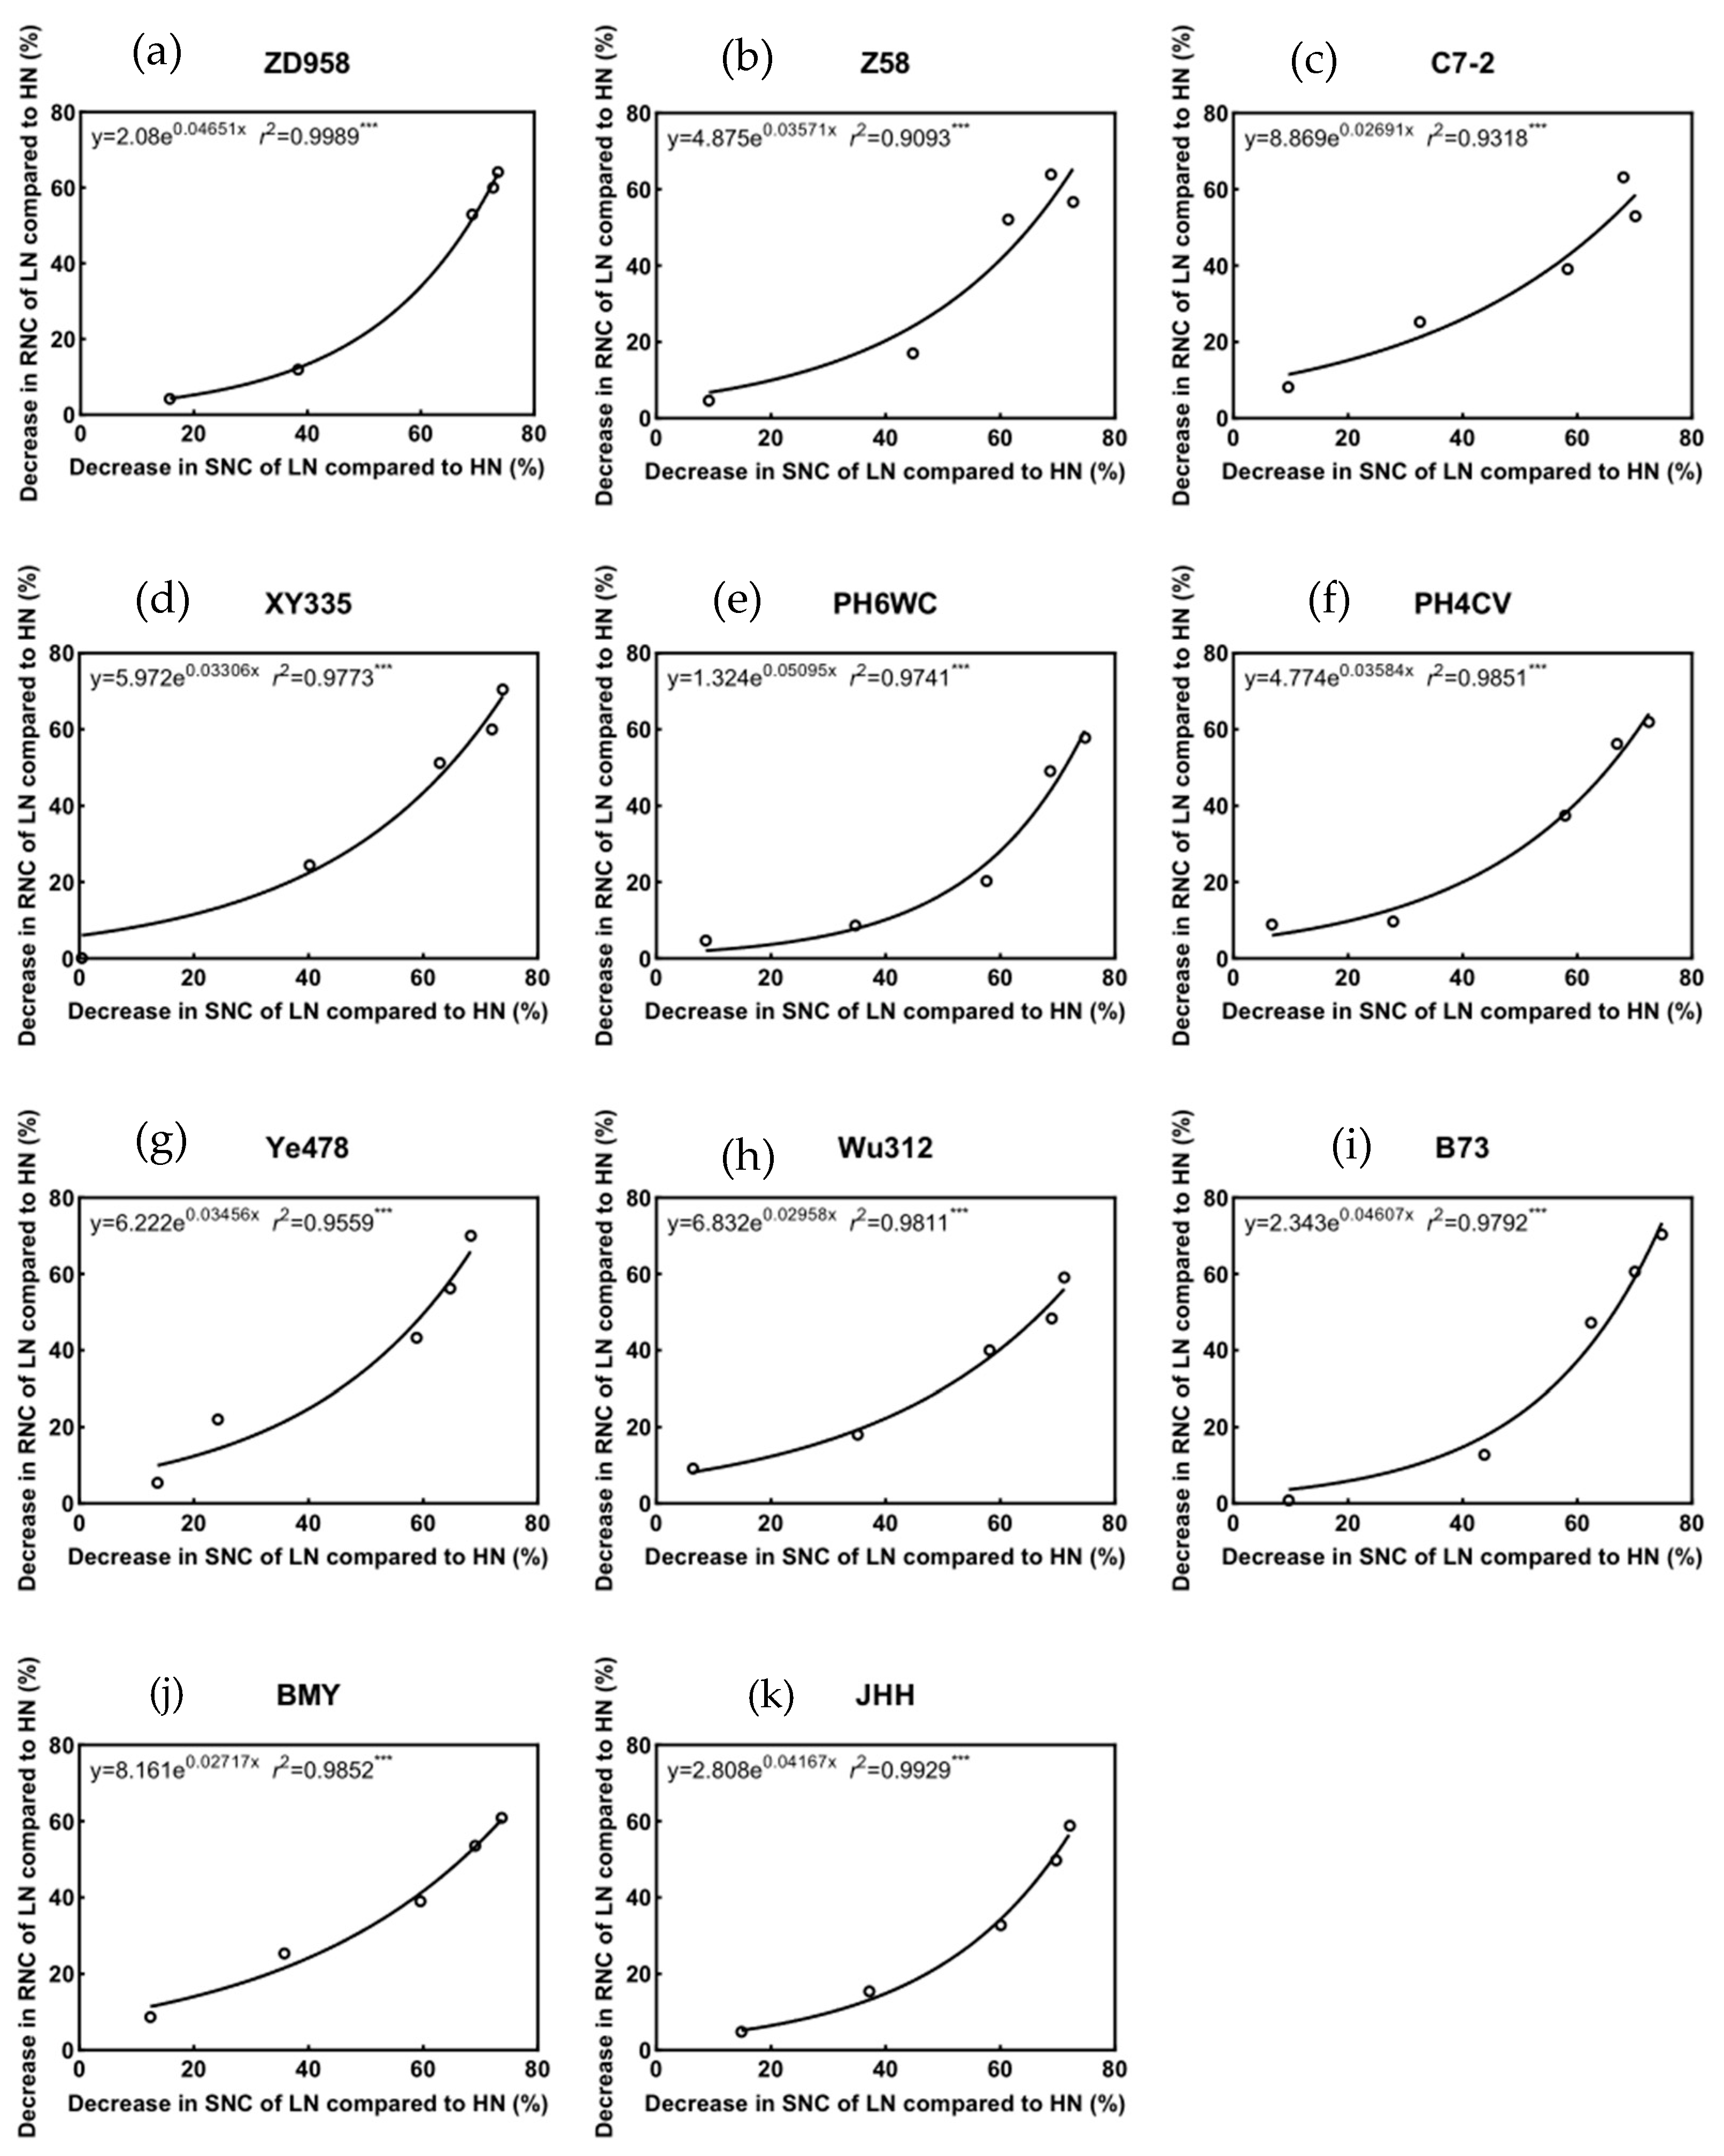
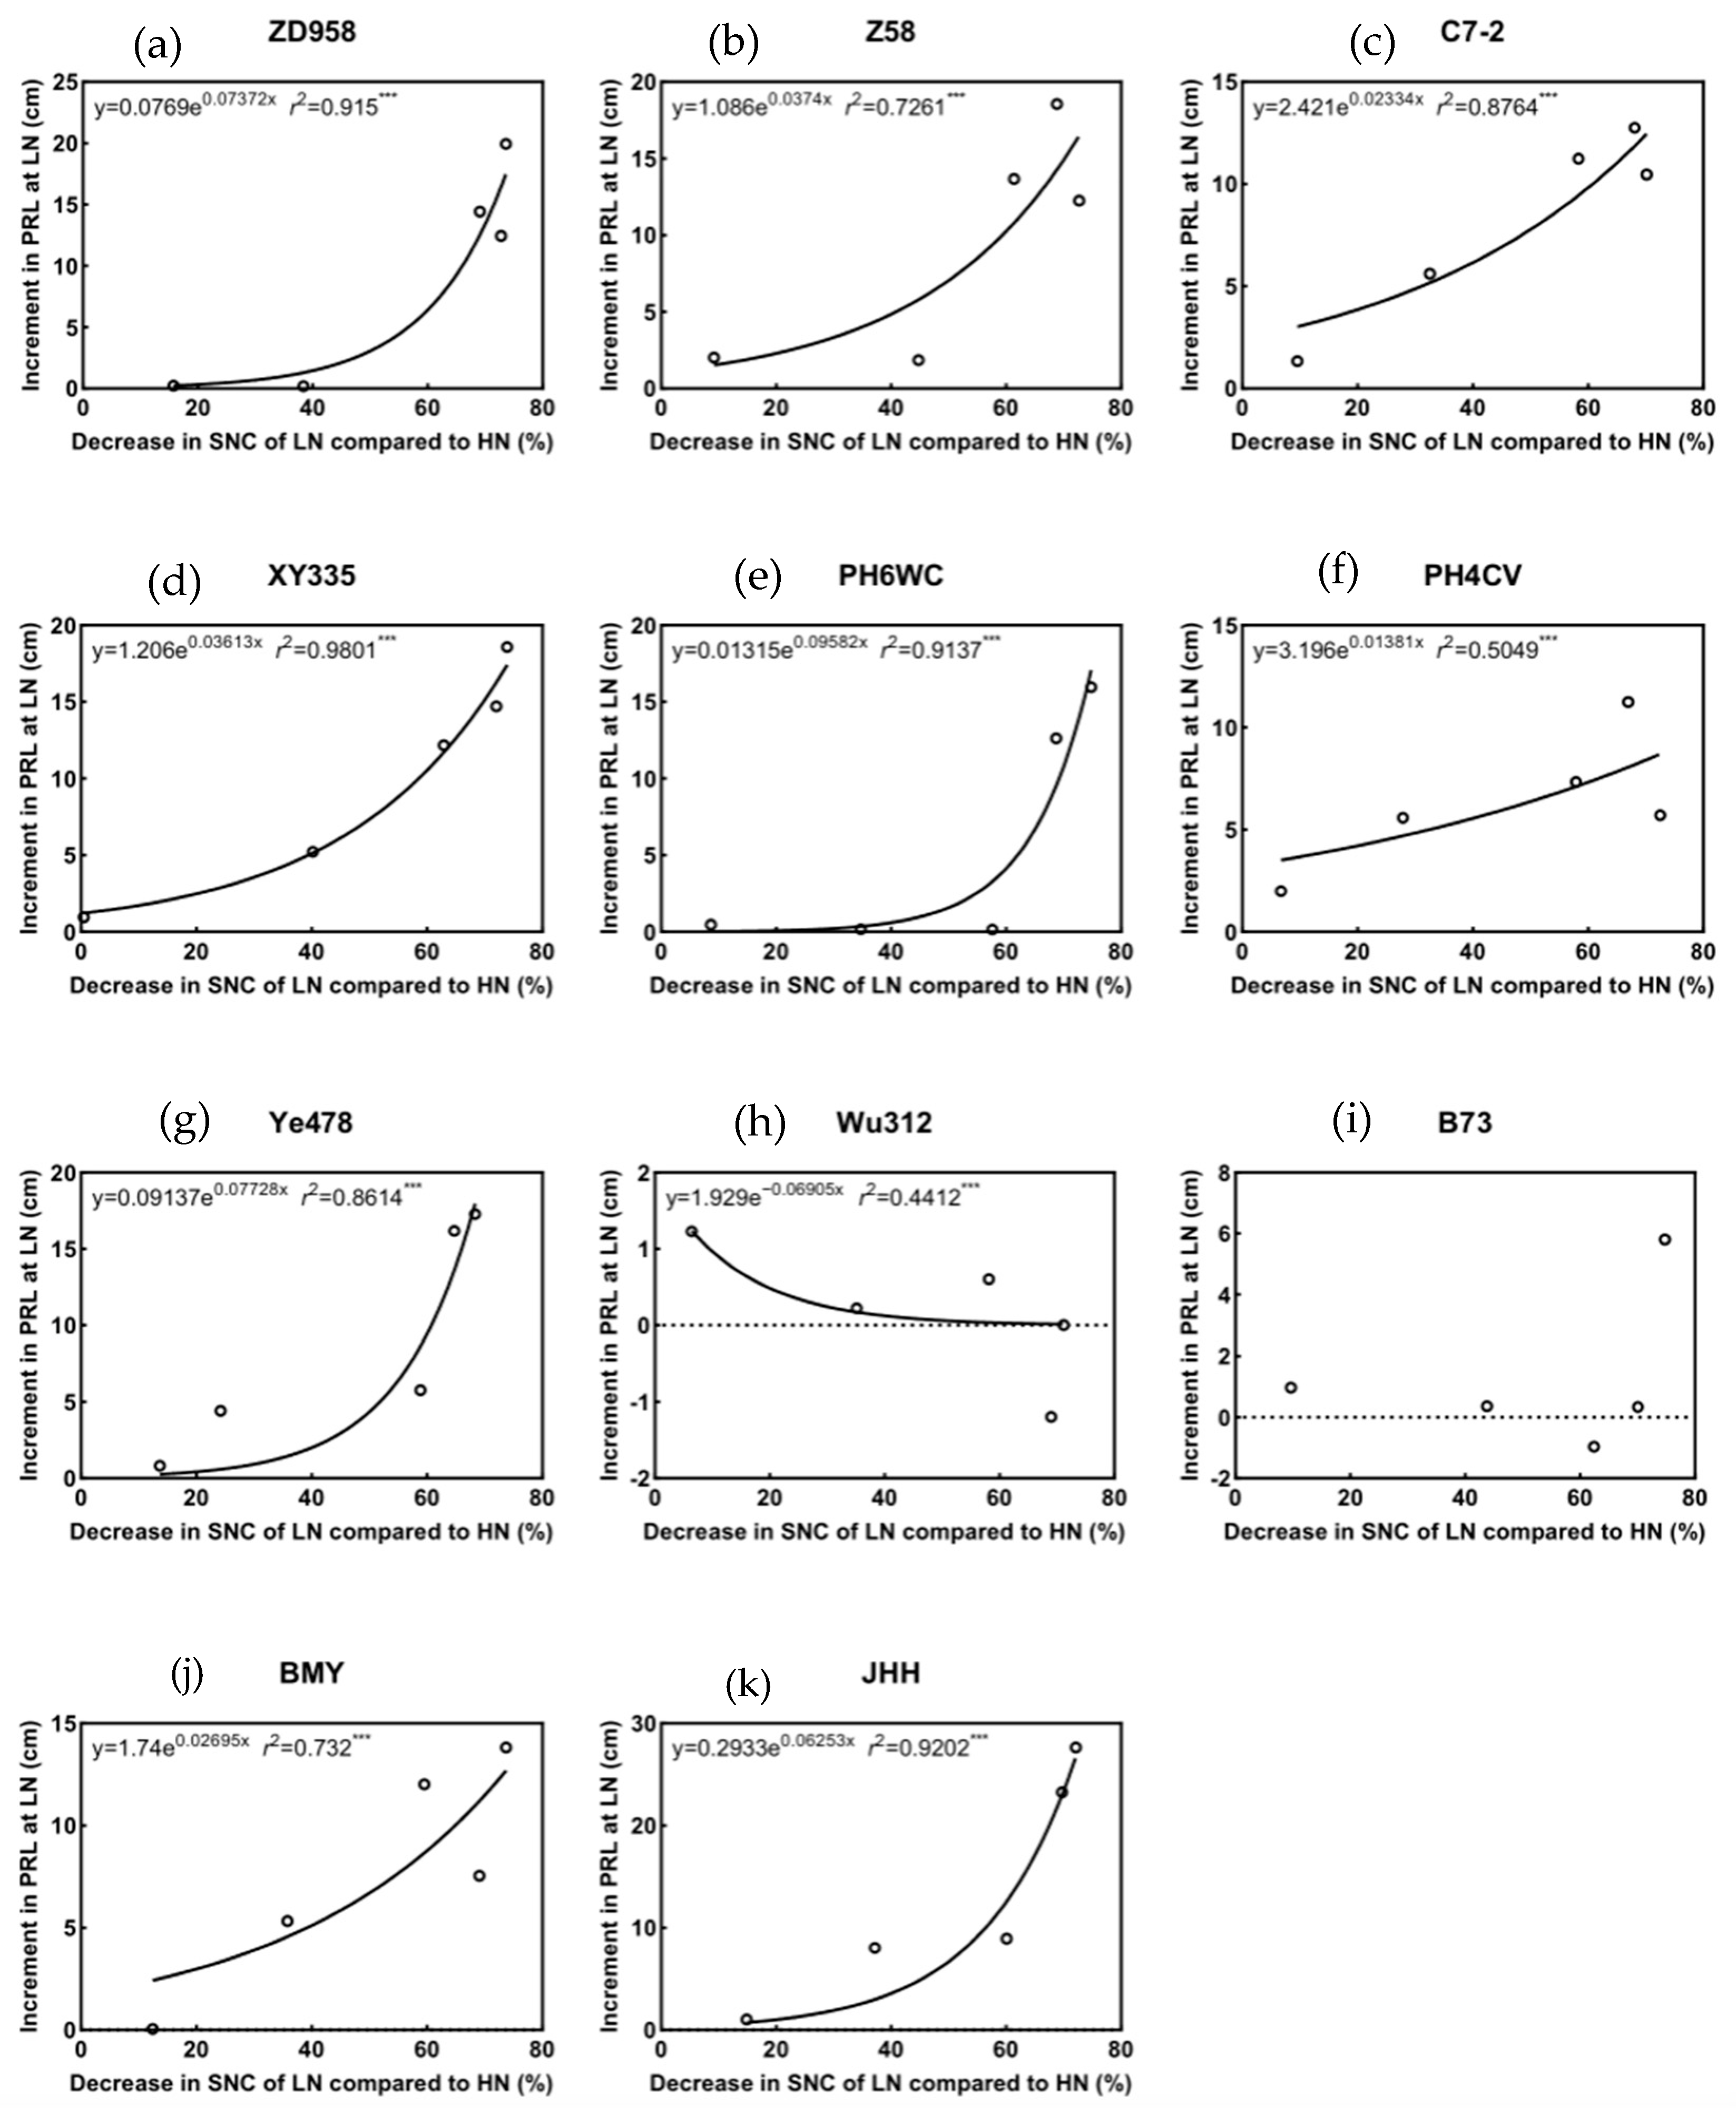
3.6. The Relationship Between Shoot N Status and Partial Phenotypes

To clarify the relationship between shoot N concentration and different phenotypes, a correlation analysis was conducted between root N concentration, root to shoot ratio, primary root length and shoot N concentration (Figure 13, Figure 14 and Figure 15). It was shown that the decrease in root N concentration at low-N stress was exponentially correlated to the decrease in shoot N concentration, with a correlation coefficient r2 between 0.9093 and 0.9989 in different genotypes (Figure 13). Overall, the decrease in root N concentration was smaller than that in the shoots. When the shoot N concentration decreased by about 40% and 60%, respectively, the root N concentration decreased by about 20% and 40%, respectively. This was related to the later occurrence of the decrease in root N concentration compared to shoots under LN conditions. Under the LN treatment, the N concentration decreased much more significantly in the shoots, suggesting that the limited N in the plants was preferentially allocated to the roots to sustain their growth. When the shoot N concentration decreased by more than 40%, the rate of decrease in root N concentration significantly accelerated, with PH6WC, ZD958, B73 and JHH decreasing at a relatively faster rate, while C7-2, BMY and Wu312 decreased at a relatively slower rate.
It was shown that the increase in the root to shoot ratio at low-N stress was exponentially correlated to the decrease in shoot N concentration in different genotypes, with a correlation coefficient r2 higher than 0.8 (0.818–0.9953) except for BMY and JHH (Figure 14), which may be related to the smaller variations in the root to shoot ratio of landraces under low-N conditions. Overall, when the shoot N concentration decreased by more than 40%, the rate of increase in root to shoot ratio significantly accelerated, with ZD958 and C7-2 increasing at a relatively faster rate, while JHH, B73, Wu312 and BMY increased at a relatively slower rate.
It was shown that the increment in primary root length at low-N stress was exponentially correlated to the decrease in shoot N concentration in different genotypes except for Wu312 and B73, with a correlation coefficient r2 higher than 0.7 (0.7261–0.9801) except for PH4CV (Figure 15), which was due to the fact that the primary root lengths of Wu312, B73 and PH4CV were less affected by low-N stress (Figure 10). Also the same, when the shoot N concentration decreased by more than 40%, the increment in primary root length significantly accelerated, with PH6WC, Ye478 and ZD958 increasing at a relatively faster rate, while C7-2 and BMY increased at a relatively slower rate. These data suggest that the change in shoot N concentration may act as the internal N-status signal in regulating the response of shoot to root ratio and primary root length to low-N stress.

4. Discussion

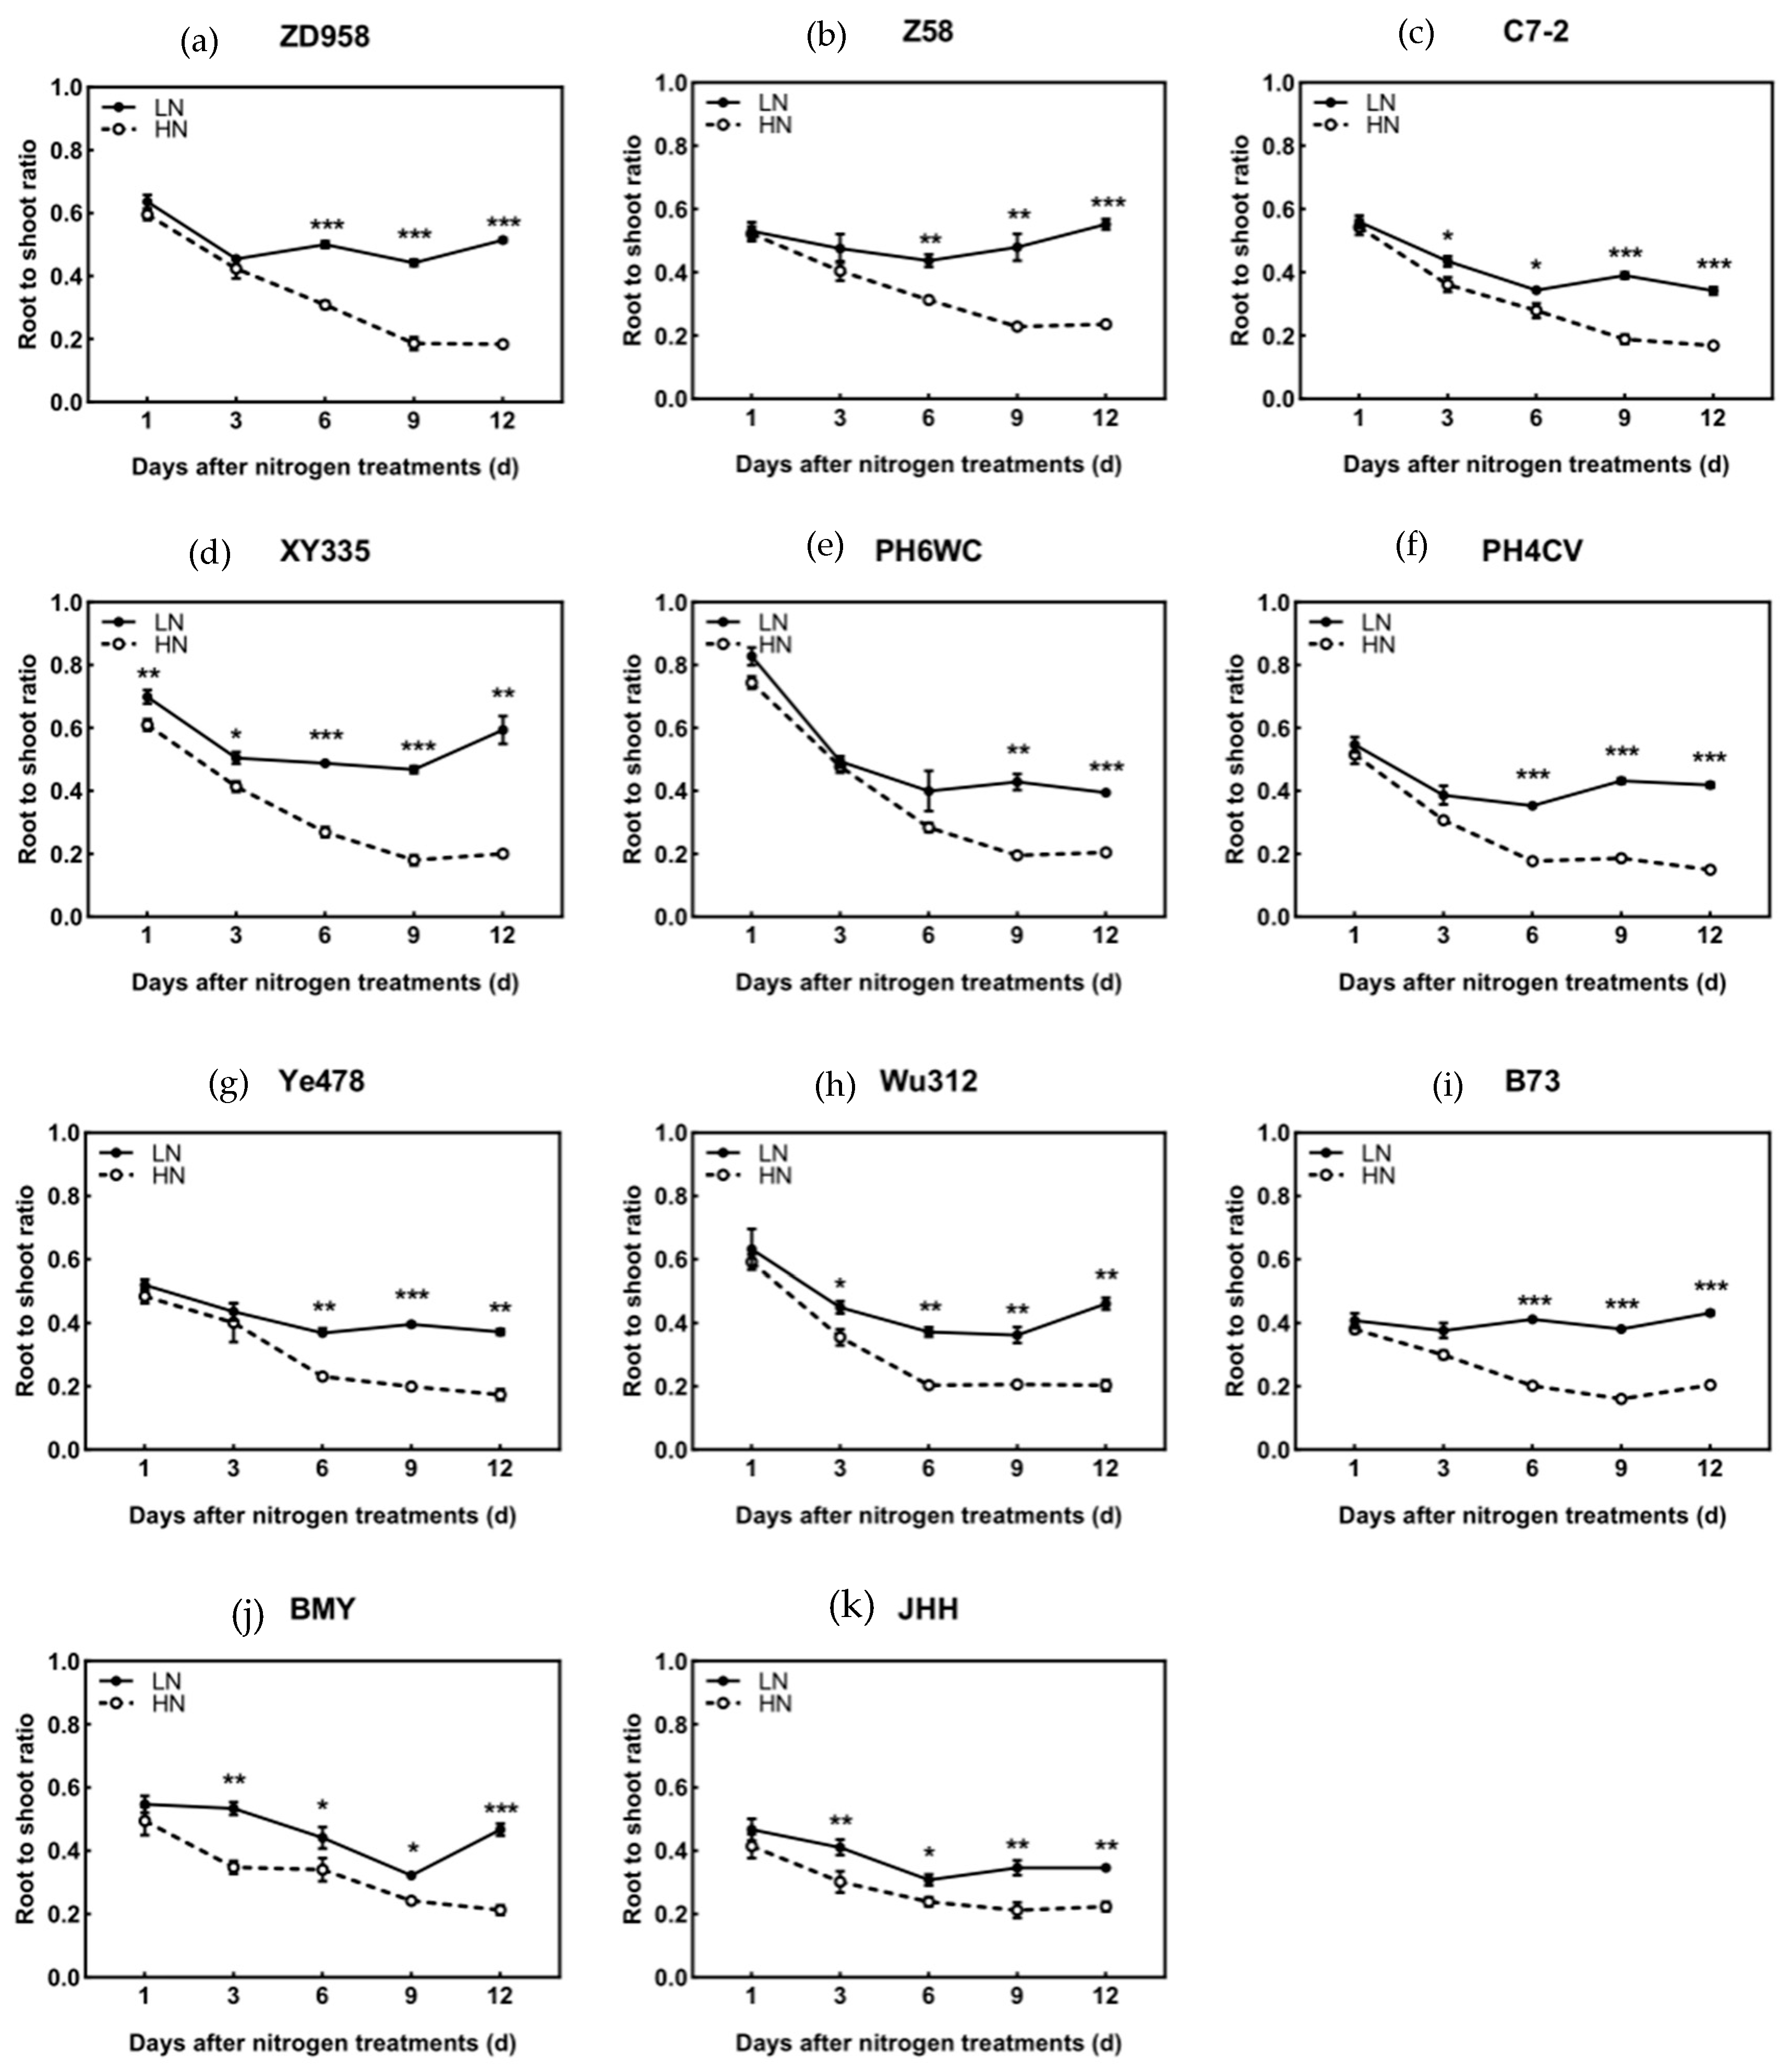
4.1. Low N Enhances Root Growth Earlier than Increases in Shoot-to-Root Dry Matter Allocation

A typical response of maize to low-N stress is to increase the root to shoot ratio, which is due to relatively more assimilation products being transferred from the shoots to the roots [10]. The same results were obtained in our study. The increase in the root to shoot ratio under low-N results from the decrease in the shoot biomass and the increase in the root biomass. The time of the decrease in the shoot biomass was slightly later than that of the increase in the root to shoot ratio, indicating that the roots as an organ in direct contact with nutrients responded earlier than the shoots under low N.
Low-N stress induced the transfer of N from old leaves to new leaves and from vegetative organs to reproductive organs. The redistribution of N led to the degradation of chlorophyll in old leaves and the typical symptoms of N deficiency of yellow leaves [17]. We also found this phenomenon by measuring the SPAD value of the leaves, among which Z58 and JHH had the fastest N transfer rate, and ZD958, C7-2 and Wu 312 had the slowest N transfer rate. Compared with the shoot N concentration, the root N concentration decreased later under low N, indicating that in order to maintain their own growth, the plants transported limited N to the root to try to maintain or promote root growth to obtain more N from external space. Compared with the root to shoot ratio, the decrease in shoot N concentration under low-N conditions occurred earlier than the increase in root to shoot ratio, while the decrease in root N concentration was close to the increase in root to shoot ratio. It shows that the increase in the root to shoot ratio mainly comes from the increase in the root biomass caused by the improvement of N photosynthetic utilization efficiency in the early stage of N deficiency and comes from the decrease in the shoot biomass caused by the decrease in photosynthesis in the late stage of N stress.

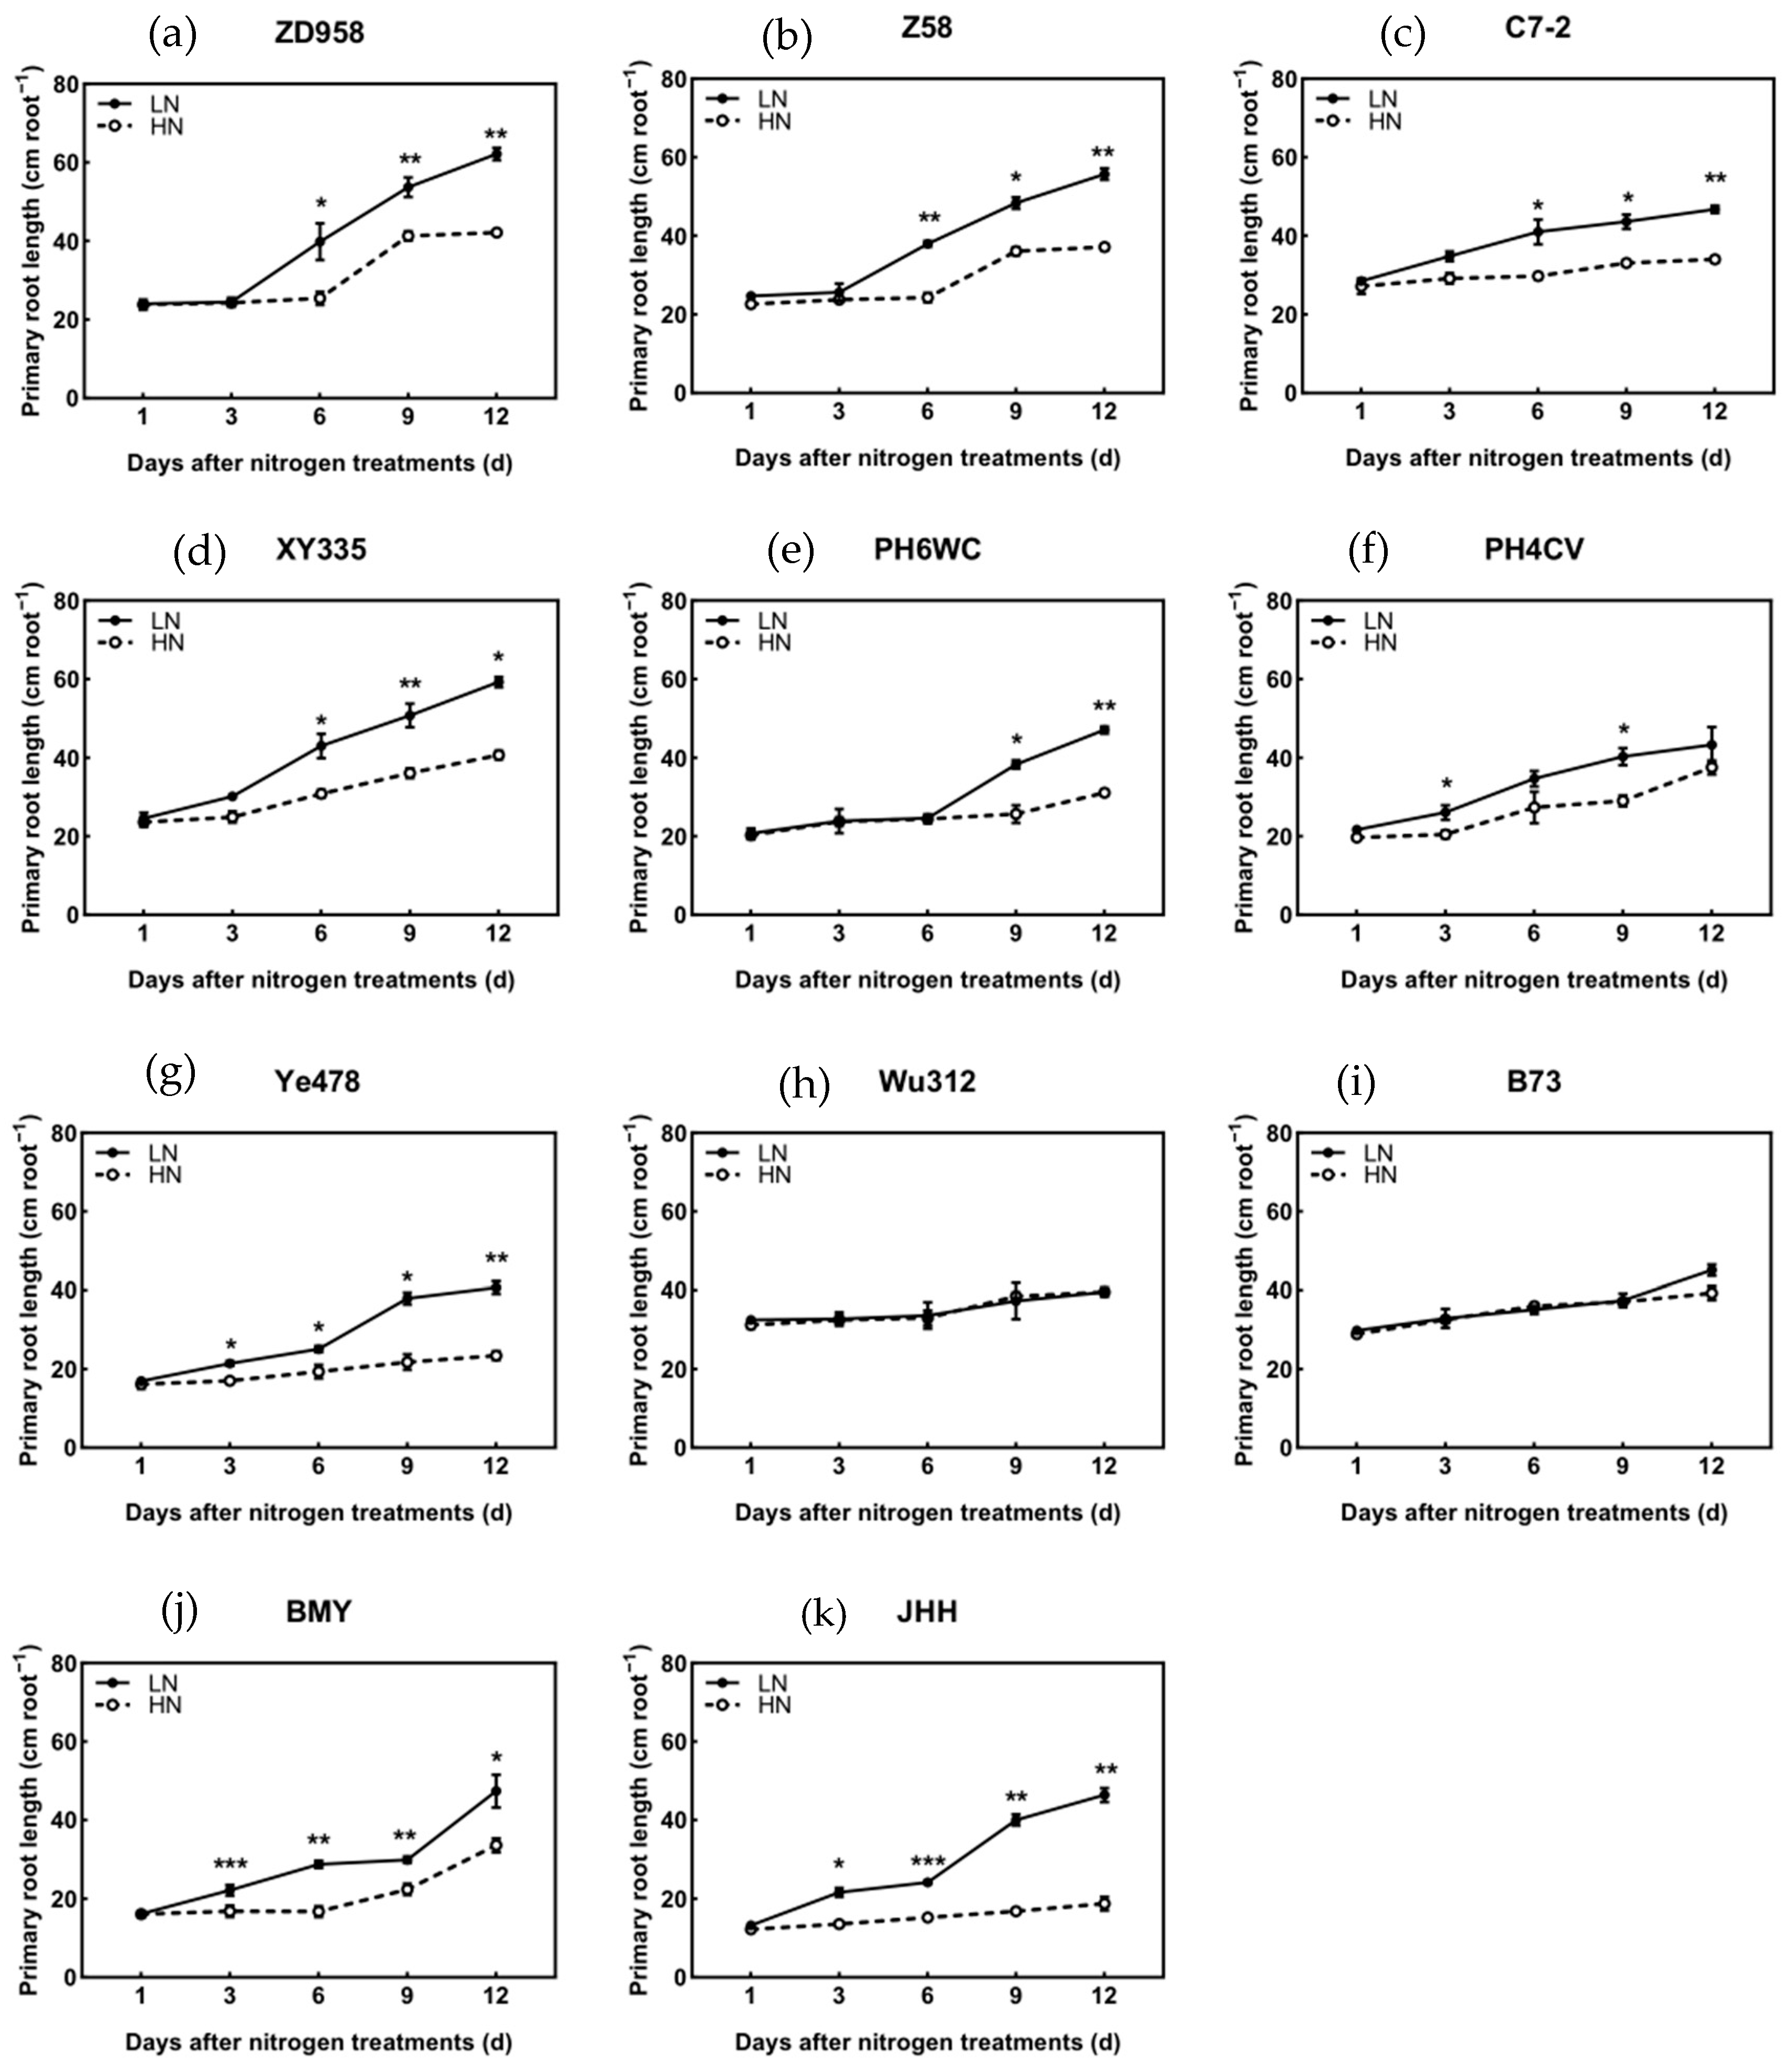
4.2. Regulation of Root Elongation Is Earlier than That of Crown Root Initiation

Nitrate is the main N form in the agricultural system. It has high mobility and often infiltrates into deep soil [18]. Deeper roots are considered to be the ideal choice for capturing this downward moving nitrate [19]. Wiesler and Horst found a significant positive correlation between root length density and nitrate consumption in deep soil [20]. Saengwilai et al. found that under low N, the depth of crown roots was closely related to maize yield [21]. Under low N, the longitudinal elongation of maize roots can expand the deep space to absorb more N, and the longitudinal root system architecture enables plants to reasonably distribute their roots in the soil and improve N absorption capacity [19]. In our study, we found that low-N treatment significantly promoted the primary and seminal root growth of most genotypes. Studies have found that the length of the axial roots is extended but the number is decreased under low-N stress [10,13]. Root elongation requires the efficient use of limited resources in plants and reduction in root numbers [21]. We found that the number of seminal roots and the first and second whorl crown roots of different genotypes was unaffected by the N supply level, as these three types of roots had grown in the early stage of N deficiency (Figures S1–S3). With the extension of N stress, the number of third and fourth whorl crown roots decreased significantly, among which ZD958 and C7-2 were the most severely inhibited (Figures S4 and S5), which might be that the N in the root was not enough to support the growth and development of all type of roots [13]. In addition, some studies have shown that genotypes with fewer crown roots were more tolerant to low N [21]. For the third and fourth whorl crown roots, the length of crown roots of each genotype under high N was much greater than that under low-N treatment (Figures S6 and S7) as low N delayed the appearance of crown roots. The promotion effect of low-N stress on crown root elongation could not make up for the lag of occurrence.

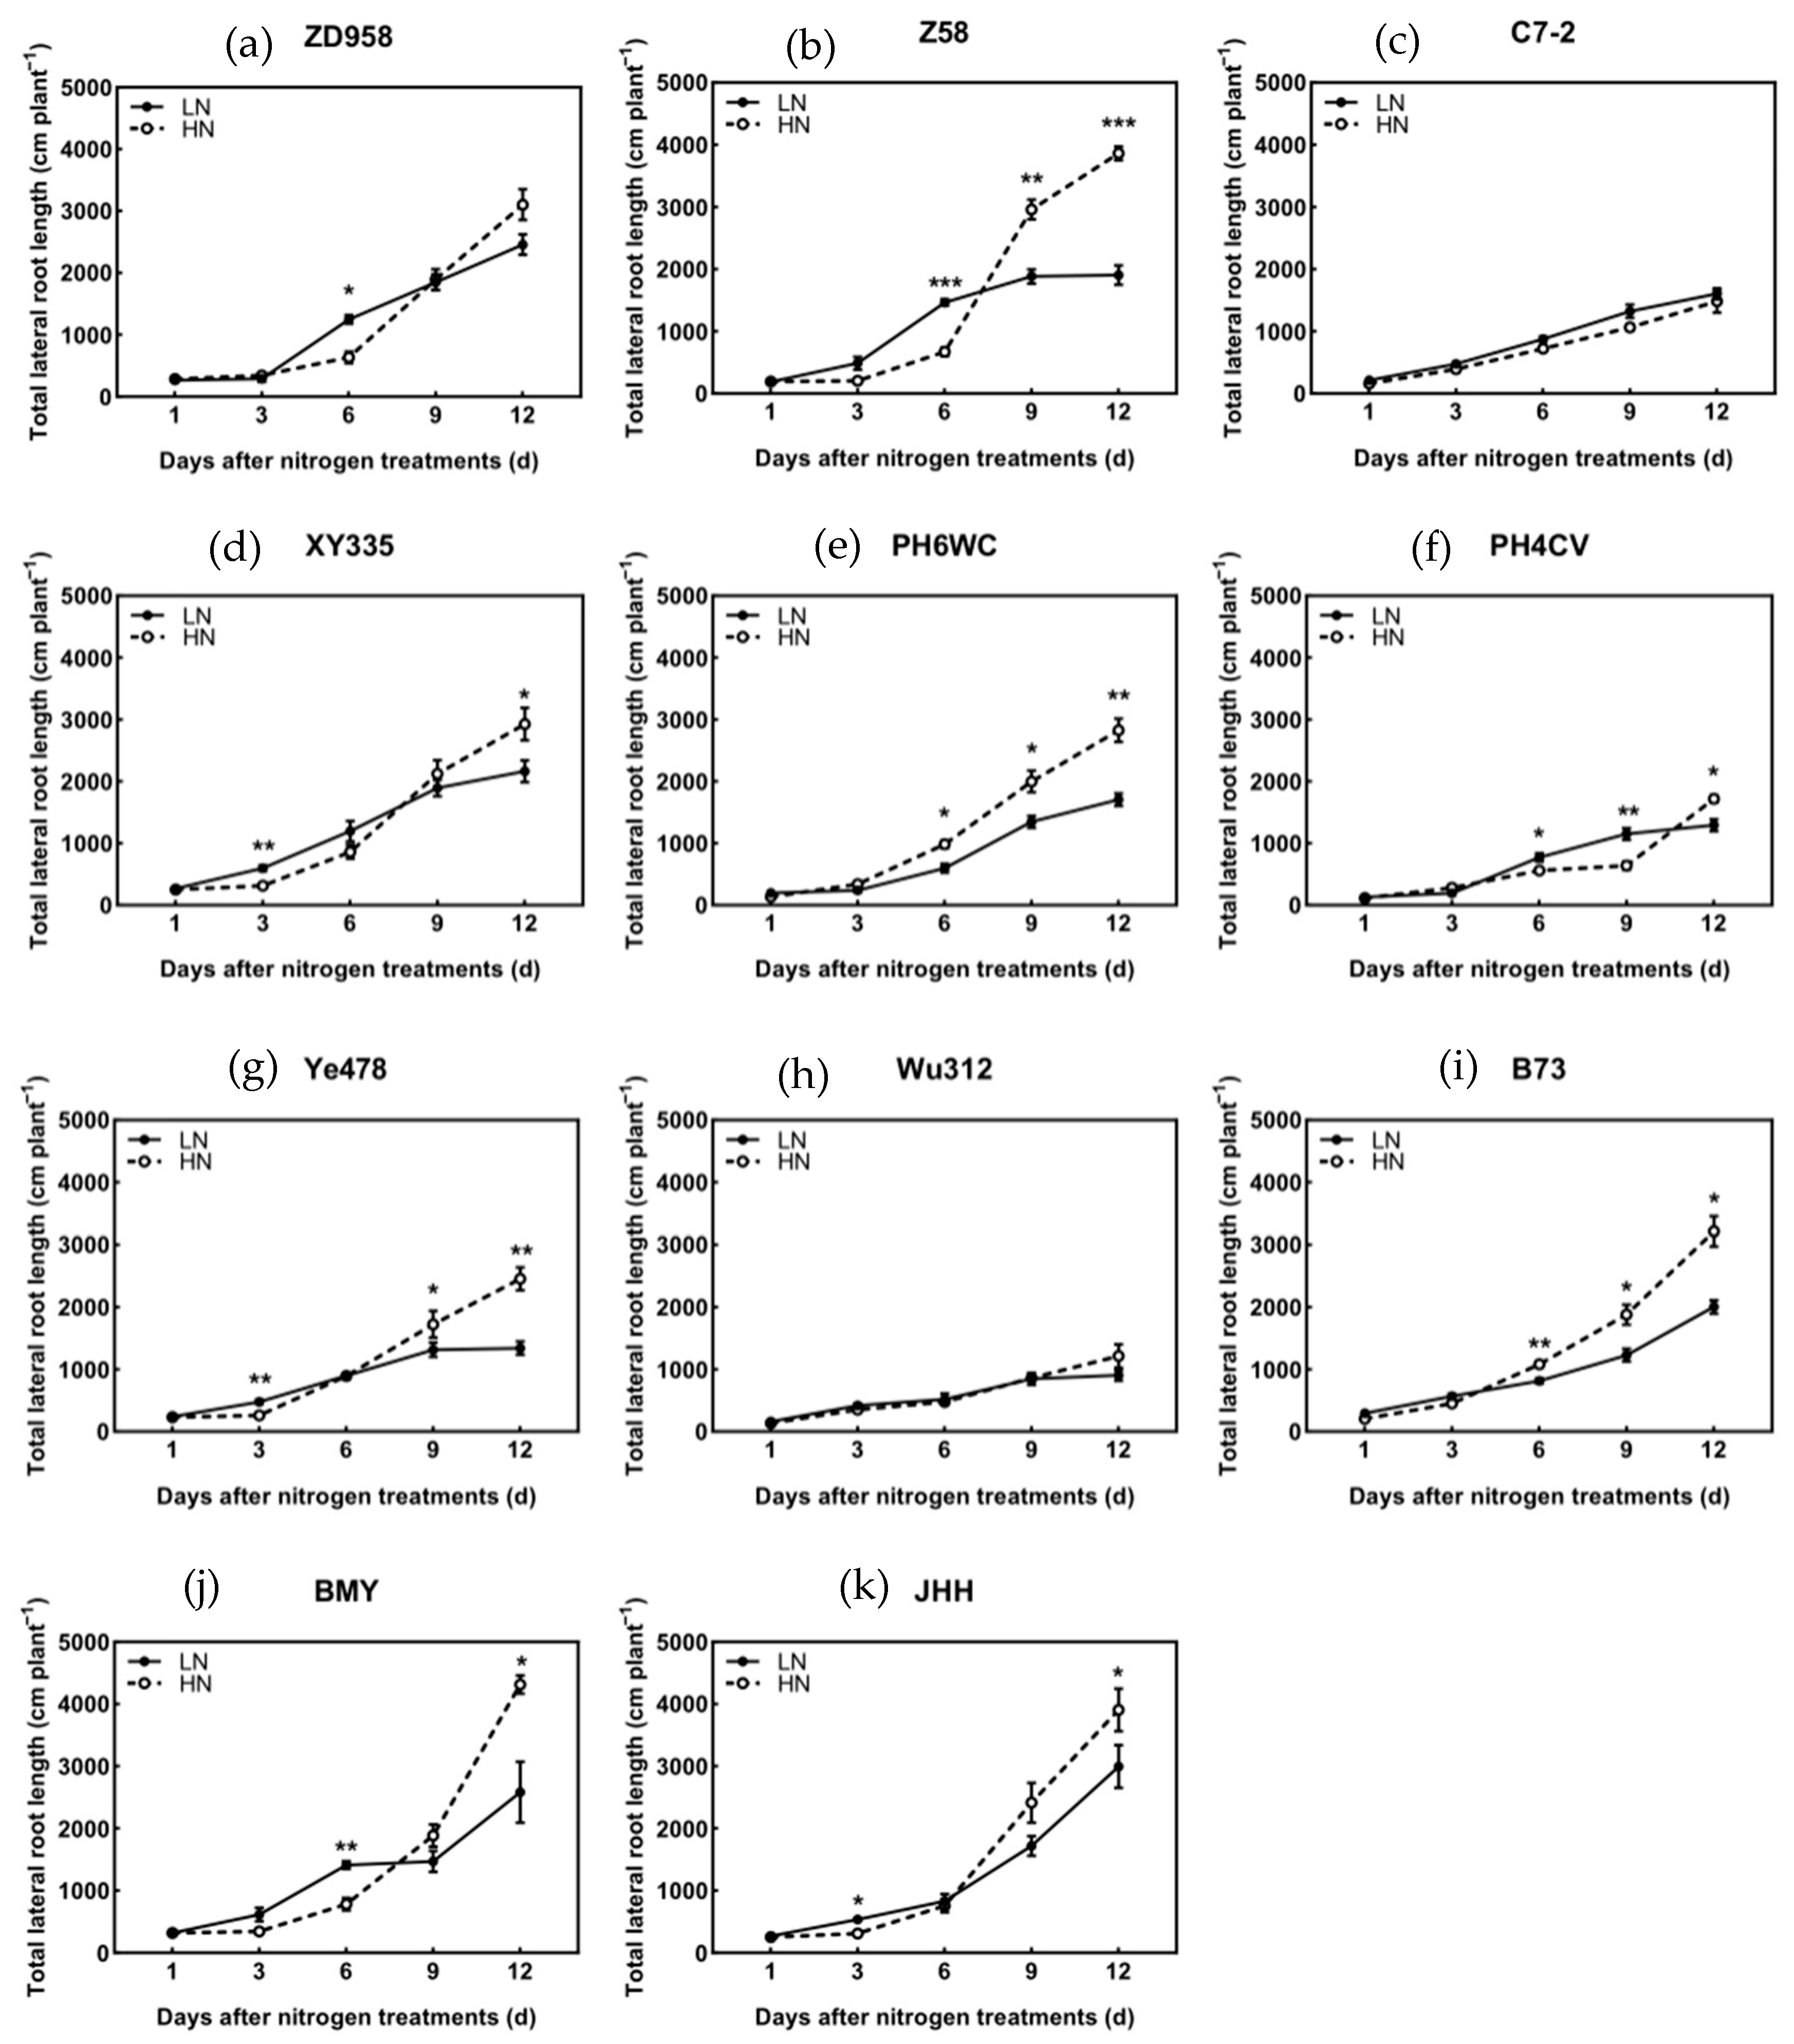
4.3. The Response of Lateral Root Growth to Low-N Stress Is Genotype-Dependent

The size of root system was significantly positively correlated with N uptake [22]. The N efficient maize genotype has a strong N recycling ability, with a large proportion of distribution to the root system [23]. N in the soil is highly mobile. When the water and N supply is sufficient, the importance of the root system decreases [24]. However, in the case of N stress or insufficient water, the N transported by mass flow cannot meet the crop demand. The crop must use the newly mineralized inorganic N in the soil to maintain its growth. At this time, root morphology, such as lateral root length and root surface area, plays an extremely important role in N absorption [10]. Wang et al. showed that under low N, there was a significant linear correlation between N uptake and maize total root length and total axial root length at seedling stage [25]. We found that the proportion of the total lateral root length to the total root length increased under low-N conditions, indicating that the importance of total axial root length increased under low N. Similarly, the change trend of total root surface area is basically consistent with the total root length (Figure S8).
As mentioned earlier, the responses of the total lateral root length of different genotypes to low N can be divided into three types. Perhaps the response ability of lateral roots to nitrate N signals varies among different maize genotypes, and the first type genotypes can take more active measures to cope with low-N stress. Gao et al. found that with the extension of N stress, the total root length under low N was shorter than that under high N, and this effect continued [13], which was inconsistent with our research results on ZD958, but was similar to PH6WC and B73 in our experiment. At the 12th day after low-N treatment, the total lateral root length of landraces and modern hybrids was significantly longer than that of other inbred lines, which might benefit from heterosis. Under both N treatments, the total lateral root length of the two landraces was longer than that of the two modern hybrids, which may be related to biomass size. Wu et al. showed that under a normal N supply, the total root length of maize gradually increased with the progress of breeding [26]. This difference might be the result of different culture times. Wu et al. harvested after 6 days of high- and low-N treatment in their experiment [26]. In our experiment, a similar phenomenon occurred in the early stage of N deficiency. Consistent with root biomass, the total lateral root length of N efficient inbred line Ye478 was longer than that of the N inefficient inbred line Wu312 under both N treatments.
As for total axial root length, the axial root elongation can form a huge root skeleton and expand the nutrient access space [10]. In contrast, the axial root is similar to the human arm, and the lateral root is similar to the finger. Only when the arm extends far enough to explore more space, can the finger obtain more objects. In genotypes whose total root length, total lateral root length and total root surface area were promoted at the early stage under low-N stress, the total axial root length also increased significantly, indicating that these genotypes could indeed respond more actively to low-N stress. We speculate that the maize genotypes with a high response to N supply will promote the growth of axial roots and lateral roots to jointly explore more N in the early stage when faced with low-N stress. When N deficiency is found by maize, the strategy should be adjusted in a timely manner and the growth of lateral roots should be inhibited to save more carbon and N resources for axial root elongation, so that a larger root skeleton would be formed to seek for N sources, although more carbohydrates would be consumed to promote axial root elongation compared with lateral roots. Compared with the N inefficient inbred line Wu312, the total root length of the N efficient inbred line Ye478 was significantly longer under both N treatments.

4.4. The Roots of Modern Hybrids Become Smaller but More Responsive to Low-N Stress

We found that under both N treatments, the shoot and root biomass of the modern hybrids were smaller than that of the landraces, which may help the hybrids reduce individual competition for light resources, improve their adaptability to high-density planting and then improve the productivity of the population. Under the conditions of intensive production, the sufficient supply of fertilizer and water may also objectively reduce the requirements of maize root size. Wu et al. selected 11 representative maize varieties bred in China from 1973 to 2009 and studied the growth of roots under high- and low-N in the hydroponic culture system [26]. The results showed that the breeding process increased the root to shoot ratio of modern varieties at seedling stage, indicating that modern high-yield varieties relatively improved the root growth at seedling stage, which is conducive to the adaptation of maize at seedling stage to the changing soil environment, forming strong seedlings. Under low N, it was found that the root biomass of modern maize varieties showed a downward trend with the breeding process. Under normal N supply conditions, the relative growth rate of the root system is linearly and positively correlated with the breeding age. Accordingly, the total root length, lateral root length, axial root length, seminal root number and axial root number of maize are significantly increased with the breeding age. Chen et al. analyzed the effect of breeding on root growth during silking, and the results showed that the root length density of hybrids bred before the 1990s was significantly higher than that of hybrids bred after the 1990s [27]. This change might be directly related to the breeding of density tolerance. Smaller roots not only reduce the carbon supply to the roots, thus increasing the carbon supply to the shoot, but also may reduce the competition between different plant roots for nutrients and water. Compared with landraces, the root to shoot ratio and responsiveness of modern hybrids under low N were higher, while the root to shoot ratio of landraces under high N were higher, which indicated that modern breeding pays more attention to the breeding of varieties with better root growth under stress conditions, which is consistent with the results of Wu et al. [26]. Although the root biomass of the landraces is greater than that of the modern hybrids, the primary and seminal axial root lengths of the two hybrids were greater than that of the landraces after 12 days of low-N treatment, indicating that the modern hybrids can adapt to low-N stress by accelerating the root elongation. In addition, the decrease in the total lateral root length of hybrid varieties under low-N conditions was smaller than that of the landraces. Chen et al. also found that the difference in root length density between new and old genotypes was mainly in the surface layer of 0–20cm soil, while in the deep layer of 21–60 cm soil, the difference in root length density between different genotypes was not significant [27]. Deep roots are very important for absorbing water and intercepting nutrients (such as nitrate). Therefore, the modern genotypes maintain the characteristics of the older genotypes in the deep root system growth, which makes them maintain the ability to use deep water and nutrients and can accelerate root growth to obtain N resources under low-N stress.

4.5. The Root Phenotypes of ZD958 and XY335 Come from Different Genetic Models

We found that ZD958 was closer to the female parent Z58 and XY335 was closer to the male parent PH4CV for the shoot and root biomass. At the final harvest, the root to shoot ratio of XY335 and its male parent PH4CV and ZD958 and its female parent Z58 increased significantly under low N, indicating that these four genotypes can respond to low-N stress more actively and promote root growth to obtain N resources in the environment. As for the total root length, with the increase in low-N stress, the total root length, total lateral root length and total root surface area of different genotypes have different change trends, which can be divided into three categories, among which ZD958, Z58, XY335 and PH4CV were significantly larger under low N than high N for 3 to 6 days after N treatment, and then were gradually reversed by high N. However, the total root length of C7-2 showed no difference under high and low N during the whole culture process. From 6 days after N treatment, the total root length of PH6WC under high N was significantly longer than that under low N and continued. In contrast, it is possible that the first type of genotype can take more active measures to cope with low-N stress. Shi et al. also clustered Z58 and PH4CV into one category by cluster analysis of 35 maize inbred lines based on different characters under two N levels, while PH6WC and C7-2 were in different categories [28]. Among the traits described above, ZD958 was similar to Z58, but significantly different from C7-2, indicating that these traits mainly come from the female parent Z58, rather than the male parent C7-2, which is called maternal inheritance [29]. On the other hand, ZD958 and C7-2 were highly similar in the number of different whorl crown roots, and the degree of inhibition by low N was more serious than that of Z58, which indicates that this trait may come from C7-2. The selective inheritance of the above traits from Z58 and C7-2 makes the hybrid ZD958 more adaptable to low-N environment. Han et al. also reported similar results [30]. In contrast, the other hybrid XY335 had similar traits to its male parent PH4CV, indicating that XY335 may have paternal inheritance. Under both high- and low-phosphorus treatment, the phosphorus utilization efficiency of PH4CV was higher, which indicates that PH4CV has a higher phosphorus utilization capacity and stronger phosphorus absorption capacity under a low phosphorus environment.

4.6. Comparison of Root Phenotypes of Different Inbred Lines Under N Stress

The total root length, total lateral root length and total root surface area of Wu312 did not differ under both N treatments during the whole process, while those traits of Ye478 were promoted at the early stage of N deficiency and then inhibited. The total axial root length, primary and seminal root length of Wu312 also did not respond to low-N stimulation during the whole process, while Ye478 was promoted at the early stage under N deficiency and continued. Interestingly, the total axial root length, primary and seminal root length of B73 were not sensitive to low-N stimulation as Wu312. Han et al. also found that the root of B73 was not sensitive to low N [30]. However, the first and second whorl crown roots of B73 significantly elongated under low-N stress, especially the second whorl crown root length was highly responsive to low-N stress, which indicates that the crown roots of B73 have a more active role in adapting to low-N stress. When using B73 for root research under different N treatments, attention should be paid to the different reactions of embryonic roots and post-embryonic roots.

4.7. Shoot N Concentration May Play a Regulatory Role in Root Morphogenesis

It is hypothesized that the root response to external N availability was regulated by a systemic long-distance shoot to root signal reflecting shoot N status [31]. Shoot nitrate concentration had been suggested as a signal controlling root to shoot ratio in Arabidopsis [32]. In the current study, we found a positive relationship between root N concentration, root to shoot ratio, primary root length and the change in N concentration in the shoot. Gao et al. found that when shoot N concentration was reduced by about 30%, the growth of axial roots (primary root, seminal roots and crown roots) was significantly enhanced [13]. These data suggest that shoot N concentration may reflect the plant’s internal N status, which plays a regulatory role in root morphogenesis.

5. Conclusions

Taken together, it is concluded that low-N conditions stimulate root growth earlier than they influence the allocation of dry matter between shoots and roots. In the initial stage of low-N stress, as time progresses, the root biomass of each genotype generally experiences a significant increase from the 3rd to the 6th day. However, by the 12th day, high-N levels gradually reverse this growth trend. Regarding shoot biomass, starting from the 6th to the 9th day after the onset of low-N stress, 11 genotypes show a significant decrease. Under low-N conditions, the total axial root length, primary root length, seminal root length and the lengths of the first and second whorl crown roots of seven genotypes all increase to varying degrees. As the N stress period lengthens, the number of the third and fourth whorl crown roots significantly declines. This suggests that the regulation of root elongation occurs earlier than the initiation of crown roots. With an increase in the severity of low-N stress, the trends in the total lateral root length changes among different genotypes can be categorized into three types. This indicates that the response of lateral root growth to low-N stress is genotype-specific. During the breeding process, the roots of modern hybrids have become smaller, yet they have become more sensitive to low-N stress. The shoot N concentration can reflect the internal N status of plants, and this concentration plays a regulatory role in root morphogenesis.

Supplementary Materials

The following supporting information can be downloaded at: https://www.mdpi.com/article/10.3390/agronomy15020332/s1. Figure S1: Dynamic changes in number of seminal roots under high-N and low-N treatments; Figure S2: Dynamic changes in number of first whorl crown roots under high-N and low-N treatments; Figure S3: Dynamic changes in number of second whorl crown roots under high-N and low-N treatments; Figure S4: Dynamic changes in number of third whorl crown roots under high-N and low-N treatments; Figure S5: Dynamic changes in number of fourth whorl crown roots under high-N and low-N treatments; Figure S6: Dynamic changes in average third whorl crown roots length under high-N and low-N treatments; Figure S7: Dynamic changes in average fourth whorl crown roots length under high-N and low-N treatments; Figure S8: Dynamic changes in total root surface area under high-N and low-N treatments.

Author Contributions

X.S.: investigation, methodology, data curation, formal analysis, and writing—original draft; P.W.: writing—review and editing; G.M.: conceptualization, writing—review and editing, supervision, project administration, and funding acquisition. All authors have read and agreed to the published version of the manuscript.

Funding

This work was supported by the National Natural Science Foundation of China (32272797).

Data Availability Statement

All data generated or analyzed during this study are included in this published article.

Conflicts of Interest

The authors declare that they have no conflicts of interests.

References

  1. Govindasamy, P.; Muthusamy, S.K.; Bagavathiannan, M.; Mowrer, J.; Jagannadham, P.T.K.; Maity, A.; Halli, H.M.; GK, S.; Vadivel, R.; TK, D.; et al. Nitrogen use efficiency—A key to enhance crop productivity under a changing climate. Front. Plant Sci. 2023, 14, 1121073. [Google Scholar] [CrossRef] [PubMed]
  2. Feyisa, D.S.; Jiao, X.; Mojo, D. Wheat Yield Response to Chemical Nitrogen Fertilizer Application in Africa and China: A Meta-analysis. Soil Sci. Plant Nut. 2024, 24, 102–114. [Google Scholar] [CrossRef]
  3. Penuelas, J.; Coello, F.; Sardans, J. A better use of fertilizers is needed for global food security and environmental sustainability. Agric. Food Secur. 2023, 12, 5. [Google Scholar] [CrossRef]
  4. Argento, S.; Garcia, G.; Treccarichi, S. Sustainable and low-input techniques in Mediterranean greenhouse vegetable production. Horticulturae 2024, 10, 997. [Google Scholar] [CrossRef]
  5. Sapkota, T.B.; Takele, R. Improving nitrogen use efficiency and reducing nitrogen surplus through best fertilizer nitrogen management in cereal production: The case of India and China. Adv. Agron. 2023, 178, 233–294. [Google Scholar]
  6. Farzadfar, S.; Knight, J.D.; Congreves, K.A. Soil organic nitrogen: An overlooked but potentially significant contribution to crop nutrition. Plant Soil 2021, 462, 7–23. [Google Scholar] [CrossRef] [PubMed]
  7. Barnett, S.E.; Youngblut, N.D.; Buckley, D.H. Bacterial community dynamics explain carbon mineralization and assimilation in soils of different land-use history. Environ. Microbiol. 2022, 24, 5230–5247. [Google Scholar] [CrossRef] [PubMed]
  8. Elrys, A.S.; Ali, A.; Zhang, H.; Cheng, Y.; Zhang, J.; Cai, Z.C.; Müller, C.; Chang, S.X. Patterns and drivers of global gross nitrogen mineralization in soils. Global Change Biol. 2021, 27, 5950–5962. [Google Scholar] [CrossRef]
  9. Lopez, G.; Ahmadi, S.H.; Amelung, W.; Athmann, M.; Ewert, F.; Gaiser, T.; Gocke, M.I.; Kautz, T.; Postma, J.; Rachmilevitch, S.; et al. Nutrient deficiency effects on root architecture and root-to-shoot ratio in arable crops. Front. Plant Sci. 2023, 13, 1067498. [Google Scholar] [CrossRef]
  10. Sun, X.; Chen, F.; Yuan, L.; Mi, G. The physiological mechanism underlying root elongation in response to nitrogen deficiency in crop plants. Planta 2020, 251, 84. [Google Scholar] [CrossRef] [PubMed]
  11. De Pessemier, J.; Moturu, T.R.; Nacry, P.; Ebert, R.; De Gernier, H.; Tillard, P.; Swarup, K.; Wells, D.M.; Haseloff, J.; Murray, S.C.; et al. Root system size and root hair length are key phenes for nitrate acquisition and biomass production across natural variation in Arabidopsis. J. Exp. Bot. 2022, 73, 3569–3583. [Google Scholar] [CrossRef] [PubMed]
  12. Sun, X.; Chen, H.; Wang, P.; Chen, F.; Yuan, L.; Mi, G. Low nitrogen induces root elongation via auxin-induced acid growth and auxin-regulated target of rapamycin (TOR) pathway in maize. J. Plant Physiol. 2020, 254, 153281. [Google Scholar] [CrossRef] [PubMed]
  13. Gao, K.; Chen, F.; Yuan, L.; Zhang, F.; Mi, G. A comprehensive analysis of root morphological changes and nitrogen allocation in maize in response to low nitrogen stress. Plant Cell Environ. 2015, 38, 740–750. [Google Scholar] [CrossRef] [PubMed]
  14. Wang, H.; Wu, Y.; An, T.; Chen, Y. Lateral root elongation enhances nitrogen-use efficiency in maize genotypes at the seedling stage. J. Sci. Food Agric. 2022, 102, 5389–5398. [Google Scholar] [CrossRef] [PubMed]
  15. Gaudin, A.C.; Mcclymont, S.A.; Holmes, B.M.; Lyons, E.; Raizada, M.N. Novel temporal, fine-scale and growth variation phenotypes in roots of adult-stage maize (Zea mays L.) in response to low nitrogen stress. Plant Cell Environ. 2011, 34, 2122–2137. [Google Scholar] [CrossRef] [PubMed]
  16. Varga, I.; Lončarić, Z.; Kristek, S.; Kulundžić, A.M.; Rebekić, A.; Antunović, M. Sugar beet root yield and quality with leaf seasonal dynamics in relation to planting densities and nitrogen fertilization. Agriculture 2021, 11, 407. [Google Scholar] [CrossRef]
  17. Muhammad, I.; Yang, L.; Ahmad, S.; Farooq, S.; Al-Ghamdi, A.A.; Khan, A.; Zeeshan, M.; Elshikh, M.S.; Abbasi, A.M.; Zhou, X.B. Nitrogen fertilizer modulates plant growth, chlorophyll pigments and enzymatic activities under different irrigation regimes. Agronomy 2022, 12, 845. [Google Scholar] [CrossRef]
  18. Pensky, J.; Fisher, A.T.; Gorski, G.; Schrad, N.; Bautista, V.; Saltikov, C. Linking nitrate removal, carbon cycling, and mobilization of geogenic trace metals during infiltration for managed recharge. Water Res. 2023, 239, 120045. [Google Scholar] [CrossRef]
  19. Lynch, J.P.; Galindo-Castañeda, T.; Schneider, H.M.; Sidhu, J.S.; Rangarajan, H.; York, L.M. Root phenotypes for improved nitrogen capture. Plant Soil 2024, 502, 31–85. [Google Scholar] [CrossRef]
  20. Wiesler, F.; Horst, W.J. Root growth and nitrate utilization of maize cultivars under field conditions. Plant Soil 1994, 163, 267–277. [Google Scholar] [CrossRef]
  21. Saengwilai, P.; Tian, X.; Lynch, J.P. Low crown root number enhances nitrogen acquisition from low-nitrogen soils in maize. Plant Physiol. 2014, 166, 581–589. [Google Scholar] [CrossRef] [PubMed]
  22. Ashfaq, W.; Brodie, G.; Fuentes, S.; Pang, A.; Gupta, D. Silicon improves root system and canopy physiology in wheat under drought stress. Plant Soil 2024, 502, 279–296. [Google Scholar] [CrossRef]
  23. Sandhu, N.; Sethi, M.; Kumar, A.; Dang, D.; Singh, J.; Chhuneja, P. Biochemical and genetic approaches improving nitrogen use efficiency in cereal crops: A review. Front. Plant Sci. 2021, 12, 657629. [Google Scholar] [CrossRef] [PubMed]
  24. Ordóñez, R.A.; Castellano, M.J.; Danalatos, G.N.; Wright, E.E.; Hatfield, J.L.; Burras, L.; Archontoulis, S.V. Insufficient and excessive N fertilizer input reduces maize root mass across soil types. Field Crop Res. 2021, 267, 108142. [Google Scholar] [CrossRef]
  25. Wang, Y.; Mi, G.; Chen, F.; Zhang, F. Genotypic differences in nitrogen uptake by maize inbred lines its relation to root morphology. Acta Ecol. Sin. 2003, 23, 79–84. [Google Scholar]
  26. Wu, Q.; Chen, F.; Chen, Y.; Yuan, L.; Zhang, F.; Mi, G. Root growth in response to nitrogen supply in Chinese maize hybrids released between 1973 and 2009. Sci. China Life Sci. 2011, 54, 642–650. [Google Scholar] [CrossRef] [PubMed]
  27. Chen, X.; Chen, F.; Chen, Y.; Gao, Q.; Yang, X.; Yuan, L.; Zhang, F.; Mi, G. Modern maize hybrids in Northeast China exhibit increased yield potential and resource use efficiency despite adverse climate change. Global Change Biol. 2013, 19, 923–936. [Google Scholar] [CrossRef] [PubMed]
  28. Shi, Z.; Zhao, Z.; Zhang, Y.; Xu, S.; Wang, N.; Wang, W.; Cheng, H.; Xing, G.; Feng, W. The Response and Cluster Analysis of Biomass Accumulation and Root Morphology of Maize Inbred Lines Seedlings to Two Nitrogen Application Levels. Crops 2019, 35, 28–36. [Google Scholar]
  29. Trentin, H.U.; Krause, M.D.; Zunjare, R.U.; Almeida, V.C.; Peterlini, E.; Rotarenco, V.; Frei, U.K.; Beavis, W.D.; Lübberstedt, T. Genetic basis of maize maternal haploid induction beyond MATRILINEAL and ZmDMP. Front. Plant Sci. 2023, 14, 1218042. [Google Scholar] [CrossRef]
  30. Han, J.; Wang, L.; Zheng, H.; Pan, X.; Li, H.; Chen, F.; Li, X. ZD958 is a low-nitrogen-efficient maize hybrid at the seedling stage among five maize and two teosinte lines. Planta 2015, 242, 935–949. [Google Scholar] [CrossRef] [PubMed]
  31. Ahmad, N.; Jiang, Z.; Zhang, L.; Hussain, L.; Yang, X. Insights on Phytohormonal Crosstalk in Plant Response to Nitrogen Stress: A Focus on Plant Root Growth and Development. Int. J. Mol. Sci. 2023, 24, 3631. [Google Scholar] [CrossRef] [PubMed]
  32. Delgado, L.D.; Nunez-Pascual, V.; Riveras, E.; Ruffel, S.; Gutiérrez, R.A. Recent advances in local and systemic nitrate signaling in Arabidopsis thaliana. Curr. Opin. Plant Biol. 2024, 81, 102605. [Google Scholar] [CrossRef] [PubMed]
Figure 1. Changes in (a) plant height, (b) leaf area, (c) SPAD of the first leaf, (d) SPAD of the second leaf, (e) SPAD of the third leaf, (f) SPAD of the fourth leaf and (g) SPAD of the fifth leaf under high-N and low-N treatments. Bars denote the standard error (SE) of the mean. The traits of each genotype in the figure are significantly different between high- and low-N treatments, so they are not marked *.
Agronomy 15 00332 g001
Figure 2. Dynamic changes in shoot dry weight under high-N and low-N treatments. (a) ZD958, (b) Z58, (c) C7-2, (d) XY335, (e) PH6WC, (f) PH4CV, (g) Ye478, (h) Wu312, (i) B73, (j) BMY and (k) JHH. Bars denote the standard error (SE) of the mean. *, ** and *** indicate significant difference between high N and low N at p < 0.05, p < 0.01 and p < 0.001, respectively.
Agronomy 15 00332 g002
Figure 3. Dynamic changes in root dry weight under high-N and low-N treatments. (a) ZD958, (b) Z58, (c) C7-2, (d) XY335, (e) PH6WC, (f) PH4CV, (g) Ye478, (h) Wu312, (i) B73, (j) BMY and (k) JHH. Bars denote the standard error (SE) of the mean. * and ** indicate significant difference between high N and low N at p < 0.05 and p < 0.01, respectively.
Agronomy 15 00332 g003
Figure 4. Dynamic changes in root to shoot ratio under high-N and low-N treatments. (a) ZD958, (b) Z58, (c) C7-2, (d) XY335, (e) PH6WC, (f) PH4CV, (g) Ye478, (h) Wu312, (i) B73, (j) BMY and (k) JHH. Bars denote the standard error (SE) of the mean. *, ** and *** indicate significant difference between high N and low N at p < 0.05, p < 0.01 and p < 0.001, respectively.
Agronomy 15 00332 g004
Figure 5. Dynamic changes in shoot N concentration under high-N and low-N treatments. (a) ZD958, (b) Z58, (c) C7-2, (d) XY335, (e) PH6WC, (f) PH4CV, (g) Ye478, (h) Wu312, (i) B73, (j) BMY and (k) JHH. Bars denote the standard error (SE) of the mean. *, ** and *** indicate significant difference between high N and low N at p < 0.05, p < 0.01 and p < 0.001, respectively.
Agronomy 15 00332 g005
Figure 6. Dynamic changes in root N concentration under high-N and low-N treatments. (a) ZD958, (b) Z58, (c) C7-2, (d) XY335, (e) PH6WC, (f) PH4CV, (g) Ye478, (h) Wu312, (i) B73, (j) BMY and (k) JHH. Bars denote the standard error (SE) of the mean. *, ** and *** indicate significant difference between high N and low N at p < 0.05, p < 0.01 and p < 0.001, respectively.
Agronomy 15 00332 g006
Figure 7. Dynamic changes in total root length under high-N and low-N treatments. (a) ZD958, (b) Z58, (c) C7-2, (d) XY335, (e) PH6WC, (f) PH4CV, (g) Ye478, (h) Wu312, (i) B73, (j) BMY and (k) JHH. Bars denote the standard error (SE) of the mean. *, ** and *** indicate significant difference between high N and low N at p < 0.05, p < 0.01 and p < 0.001, respectively.
Agronomy 15 00332 g007
Figure 8. Dynamic changes in total axial root length under high-N and low-N treatments. (a) ZD958, (b) Z58, (c) C7-2, (d) XY335, (e) PH6WC, (f) PH4CV, (g) Ye478, (h) Wu312, (i) B73, (j) BMY and (k) JHH. Bars denote the standard error (SE) of the mean. *, ** and *** indicate significant difference between high N and low N at p < 0.05, p < 0.01 and p < 0.001, respectively.
Agronomy 15 00332 g008
Figure 9. Dynamic changes in total lateral root length under high-N and low-N treatments. (a) ZD958, (b) Z58, (c) C7-2, (d) XY335, (e) PH6WC, (f) PH4CV, (g) Ye478, (h) Wu312, (i) B73, (j) BMY and (k) JHH. Bars denote the standard error (SE) of the mean. *, ** and *** indicate significant difference between high N and low N at p < 0.05, p < 0.01 and p < 0.001, respectively.
Agronomy 15 00332 g009
Figure 10. Dynamic changes in primary root length under high-N and low-N treatments. (a) ZD958, (b) Z58, (c) C7-2, (d) XY335, (e) PH6WC, (f) PH4CV, (g) Ye478, (h) Wu312, (i) B73, (j) BMY and (k) JHH. Bars denote the standard error (SE) of the mean. *, ** and *** indicate significant difference between high N and low N at p < 0.05, p < 0.01 and p < 0.001, respectively.
Agronomy 15 00332 g010
Figure 11. Dynamic changes in average seminal roots length under high-N and low-N treatments. (a) ZD958, (b) Z58, (c) C7-2, (d) XY335, (e) PH6WC, (f) PH4CV, (g) Ye478, (h) Wu312, (i) B73, (j) BMY and (k) JHH. Bars denote the standard error (SE) of the mean. *, ** and *** indicate significant difference between high N and low N at p < 0.05, p < 0.01 and p < 0.001, respectively.
Agronomy 15 00332 g011
Figure 12. Dynamic changes in average first whorl crown roots length under high-N and low-N treatments. (a) ZD958, (b) Z58, (c) C7-2, (d) XY335, (e) PH6WC, (f) PH4CV, (g) Ye478, (h) Wu312, (i) B73, (j) BMY and (k) JHH. Bars denote the standard error (SE) of the mean. *, ** and *** indicate significant difference between high N and low N at p < 0.05, p < 0.01 and p < 0.001, respectively.
Agronomy 15 00332 g012
Figure 13. The relationship between the changes in shoot N concentration and root N concentration in response to low-N treatment. (a) ZD958, (b) Z58, (c) C7-2, (d) XY335, (e) PH6WC, (f) PH4CV, (g) Ye478, (h) Wu312, (i) B73, (j) BMY and (k) JHH. *** p < 0.001.
Agronomy 15 00332 g013
Figure 14. The relationship between the changes in shoot N concentration and root to shoot ratio in response to low-N treatment. (a) ZD958, (b) Z58, (c) C7-2, (d) XY335, (e) PH6WC, (f) PH4CV, (g) Ye478, (h) Wu312, (i) B73, (j) BMY and (k) JHH. *** p < 0.001.
Agronomy 15 00332 g014
Figure 15. The relationship between the changes in shoot N concentration and primary root length in response to low-N treatment. (a) ZD958, (b) Z58, (c) C7-2, (d) XY335, (e) PH6WC, (f) PH4CV, (g) Ye478, (h) Wu312, (i) B73, (j) BMY and (k) JHH. *** p < 0.001.
Agronomy 15 00332 g015
Disclaimer/Publisher’s Note: The statements, opinions and data contained in all publications are solely those of the individual author(s) and contributor(s) and not of MDPI and/or the editor(s). MDPI and/or the editor(s) disclaim responsibility for any injury to people or property resulting from any ideas, methods, instructions or products referred to in the content.

