Article

Effect of Light Intensity on the Functional Traits of Two Ormosia Species

1
Guangxi Key Laboratory of Functional Phytochemicals Research and Utilization, Guangxi Institute of Botany, Guilin 541006, China
2
College of Tourism and Landscape Architecture, Guilin University of Technology, Guilin 541006, China
3
Library, Guangxi University of Chinese Medicine, Nanning 530200, China
4
College of Life Sciences, Guangxi Normal University, Guilin 541006, China
*
Authors to whom correspondence should be addressed.
These authors contributed equally to this work.
Agronomy 2025, 15(12), 2729; https://doi.org/10.3390/agronomy15122729
Submission received: 17 October 2025 / Revised: 20 November 2025 / Accepted: 26 November 2025 / Published: 27 November 2025
(This article belongs to the Section Plant-Crop Biology and Biochemistry)

Abstract

This study investigated two Ormosia species, Ormosia henryi and Ormosia hosiei, to examine their adaptive mechanisms to varying light conditions. Four light intensity treatments were applied to measure their growth parameters, photosynthetic characteristics, leaf microstructure, and chlorophyll content. The results showed that (1) both Ormosia species exhibited significant variations in functional traits under different light conditions. Growth parameters displayed high plasticity, and photosynthetic traits and leaf structural characteristics were optimal under 50% light intensity. (2) The overall phenotypic plasticity of O. henryi and O. hosiei was similar, though differences were observed in the plasticity of PT, SD, and Chl b, indicating distinct strategies in response to environmental changes. (3) Most functional traits were significantly correlated, and their coordinated changes contributed to the formation of adaptive capacity to light variation in both species. (4) During the seedling propagation of Ormosia species, approximately 50% shading should be applied. In conclusion, this study reveals the variation and adaptive mechanisms of functional traits in Ormosia seedlings under different light intensities, providing a theoretical basis for understory light environment management and shade cultivation, as well as a reference for further studies on the light ecological strategies and shade tolerance mechanisms of Ormosia species.

1. Introduction

The genus Ormosia (Fabaceae: Papilionoideae) comprises approximately 130 species, mainly distributed in southeastern Asia, northwestern Australia, and tropical America. In China, 37 species are recorded, with Guangdong, Guangxi, and Yunnan being the major distribution regions, making China the country with the highest diversity of Ormosia species in Asia [1]. Most Ormosia species possess a combination of medicinal [2,3], ornamental [4], and economic values [5]. Ormosia henryi and Ormosia hosiei are not only valued for their high ornamental potential, but their roots, stems, leaves, and seeds are also used in traditional medicine. Furthermore, both species provide high-quality timber suitable for fine furniture production. Among the 37 Ormosia species in China, O. henryi and O. hosiei are the most widely distributed. O. henryi occurs throughout regions south of the Yangtze River, while O. hosiei is found not only in southern China but also in southeastern Gansu and southern Shaanxi, covering about 50% of China’s provinces and representing broadly distributed species [6]. However, long-term overexploitation has led to a sharp decline in wild populations of both species and weakened their natural regeneration capacity. In 2021, the Chinese government listed O. henryi and O. hosiei as national second-class protected wild plants in the List of National Key Protected Wild Plants (2021).
Previous studies on O. henryi and O. hosiei have primarily focused on plant physiology [7,8], genetic differentiation [9,10], chemical composition [11,12], and seedling propagation [13,14]. Although these studies have contributed to the conservation of both species, systematic research on their photosynthetic characteristics and leaf anatomical structures under different light conditions remains limited. Studies have shown that individuals of the same species may exhibit distinct responses under varying light conditions [15], with changes in leaf traits, photosynthetic parameters, and chlorophyll content depending on light intensity [16]. Light plays a crucial role in plant growth and development throughout the entire life cycle [17], serving as the primary energy source for photosynthesis [18]. Under different light intensities and spectral qualities, plants adjust their morphology, physiology, and metabolism to optimize light energy utilization; however, unsuitable light conditions may lead to reduced photosynthetic efficiency, growth inhibition, or pigment synthesis abnormalities [19]. For instance, under high light intensity, plants may experience “photoinhibition” or even photodamage [20], while under low light, photosynthetic capacity declines due to reduced enzyme activity, resulting in lower carbohydrate accumulation in leaves and ultimately suppressing plant growth and reproduction [21,22]. The seedling stage is the most vulnerable period in a plant’s life cycle and is highly sensitive to the light environment. Only under suitable light conditions can seedlings grow normally and successfully transition to the next developmental stage [23]. In natural forests, the understory light environment varies spatially and temporally with forest succession and development [24,25], significantly influencing seedling survival rates [26]. Such variability requires seedlings to exhibit a high degree of light adaptability to efficiently utilize limited light resources for photosynthesis and sustain growth [27]. During our field survey, we found that wild seedlings of Ormosia species exhibit relatively high germination rates and possess good natural regeneration potential. However, under dense understory shade, light is severely limited, which significantly inhibits the growth and development of seedlings, making it difficult for them to reach the juvenile tree stage. This observation provides important insights for the propagation of Ormosia species. Seedling propagation is a crucial approach for ex situ conservation of endangered plants and plays a key role in their long-term sustainability. Nevertheless, numerous challenges often arise during propagation, as unsuitable light, water, and nutrient conditions can affect not only seedling survival and growth rates but also the long-term effectiveness of ex situ conservation and restoration programs.
During artificial propagation, seedlings are typically grown under stable and moderate greenhouse conditions. Due to the absence of natural fluctuations in light availability, the functional traits developed in the greenhouse tend to be characteristic of low-light adaptation. Once transplanted back to their natural habitats, these seedlings must rapidly cope with higher light intensity, greater temporal variability in light, and increased transpiration demands, which directly affects their survival. Therefore, systematically studying the morphological and photosynthetic responses of seedlings under different light conditions is of great significance for the sustainable conservation of these endangered species. This study used three-year-old seedlings of O. henryi and O. hosiei as research subjects, aiming to explore the differences in functional traits (including photosynthetic characteristics, leaf structure, and biomass) of the two species under different light conditions. The goal was to understand their plasticity along a light gradient and to provide a scientific basis for large-scale seedling propagation and plantation establishment of Ormosia species. Specifically, this study aimed to address the following questions: (1) Do the functional traits of Ormosia seedlings vary with light conditions? (2) Is there a difference in plasticity between O. henryi and O. hosiei? (3) Are there correlations among the functional trait indices of Ormosia species?

2. Materials and Methods

2.1. Overview of the Study Site

The experiment was conducted at the Guangxi Institute of Botany in Guilin, Guangxi Zhuang Autonomous Region (110°18.13′ E, 25°04′ N), at an altitude of approximately 163 m, within a mid-subtropical monsoon climate zone. This region experiences abundant rainfall and mild temperatures, with an annual sunshine duration of 1553.09 h, annual precipitation of 1894 mm, an average annual temperature of 19.43 °C, and an extreme minimum temperature of −3.0 °C. During the experimental period, the proportion of rainy, sunny, cloudy, and overcast days was 39.2%, 23.6%, 24.8%, and 12.4%, respectively. In the two weeks prior to measurements, the site was predominantly sunny with occasional intermittent cloud cover, no sustained rainfall, and relatively stable daily photosynthetically active radiation (PAR). (Climate data were obtained from the China Meteorological Data Service Center: https://data.cma.cn/site/index.html (accessed on 19 November 2025).
An open area without shading was selected for the experiment. Different light intensities were controlled using shade nets of varying densities, resulting in four treatments: 100% full light, 50% full light, 25% full light, and 10% full light. The relative light intensity of each treatment was calculated as the percentage of measured illuminance compared with full light conditions using a lux meter.

2.2. Materials

The experimental materials were three-year-old potted seedlings with uniform morphology and good growth performance. On 13 August 2024, the seedlings were placed under different shading treatments. In this experiment, both O. hosiei and O. henryi were subjected to four treatments (100%, 50%, 25%, and 10%). Each treatment included three replicates, with three seedlings per replicate, resulting in 36 seedlings per species. All seedlings were managed under the same water and nutrient conditions. Prior to the treatments, strict selection was performed to minimize initial differences in belowground parts. The average height and stem diameter of O. henryi seedlings were 39.14 ± 5.23 cm and 6.62 ± 0.82 mm, respectively, while those of O. hosiei seedlings were 40.79 ± 5.23 cm and 8.76 ± 0.86 mm, respectively.

2.3. Experimental Methods

2.3.1. Determination of Growth Index

During the experimental period (13 August 2024–13 July 2025), the height and stem diameter of O. henryi and O. hosiei seedlings were regularly measured every 10 days using a steel tape and a vernier caliper under different light treatments. At the end of the experiment, seedling height, stem diameter, aboveground fresh weight (AGFW), and belowground fresh weight (BGFW) were measured for each treatment. The samples were then oven-dried at 60 °C using an electric blast drying oven to determine the aboveground dry weight (AGDW) and belowground dry weight (BGDW). The root-to-shoot ratio (RT/ST) was calculated as the ratio of belowground dry weight to aboveground dry weight.

2.3.2. Determination of Light Response Curve

In July 2025, measurements of photosynthetic response parameters were conducted on clear and cloudless mornings using an LI-6800 portable photosynthesis system (LI-COR, Lincoln, NE, USA) equipped with a red/blue light source leaf chamber (6800-02). Intact and pest-free leaves were selected for measurement, with three leaves chosen per plant and each measurement repeated three times. Before measurement, leaves were pre-illuminated under a photosynthetic photon flux density (PFD) of 1000 µmol·m−2·s−1 for 15 min to ensure full stomatal opening. During the measurement, the CO2 concentration (CO2_s) was controlled at 400 µmol·mol−1 using a CO2 cylinder, with a flow rate of 500 µmol·s−1, pressure difference (ΔP) of 0.1 kPa, and relative humidity (RH_air) maintained at 60%. The H2O control was turned on, and the mixing fan speed was set to 10,000 rpm.
The “Light_Response” automatic program was used to measure photosynthetic light response curves. Light intensity (Qin) was sequentially set from high to low as follows: 1800, 1400, 1000, 900, 800, 400, 200, 100, 50, and 0 µmol·m−2·s−1, with each step lasting 120–180 s. The measured data were fitted to the PnPFD curve using Leaf Photosynthesis Modeling Software 4.1.1 and a modified rectangular hyperbola model, with PFD as the horizontal axis and Pn as the vertical axis to plot the light response curve [28].
P n = A Q Y 1 β P F D 1 + γ P F D P F D R d
In the equation, Pn represents the net photosynthetic rate; AQY is the initial slope of the light response curve; β and γ are fitting coefficients; PFD denotes the photosynthetic photon flux density; and Rd is the dark respiration rate. The fitting results showed good agreement after model validation. The light saturation point (LSP), maximum net photosynthetic rate (Pmax), and light compensation point (LCP) were then calculated using the following equations:
L S P = β   +   γ β   1 γ
P m a x = A Q Y β + γ β γ R d
L C P = A Q Y γ R d γ R d A Q Y 2 4 β     A Q Y   R d 2 α β

2.3.3. Determination of CO2 Response Curve

In July 2025, measurements of the CO2 response parameters of leaves were conducted on clear and cloudless mornings using an LI-6800 portable photosynthesis system (LI-COR, Lincoln, NE, USA) equipped with a red/blue light source leaf chamber (6800-02). Intact and pest-free leaves were selected for measurement, with three leaves chosen per plant, and each measurement was repeated three times. Before measurement, leaves were pre-illuminated under a photosynthetic photon flux density (PFD) of 1200 µmol·m−2·s−1 for 15 min to ensure full stomatal opening. During measurement, different CO2 concentrations were supplied to the sample chamber using a small CO2 cylinder. The flow rate was set to 500 µmol·s−1, pressure difference (ΔP) to 0.1 kPa, and the H2O control was activated with relative humidity (RH_air) maintained at 60%. The mixing fan speed was set to 12,000 rpm. The light intensity (Setpoint) was maintained at 1200 µmol·m−2·s−1, with the light composition set to 90% red light (Color Spec: r90).
The “CO2_Response” automatic measurement program was used, starting from the ambient CO2 concentration, decreasing first, then returning to ambient, and finally increasing to the maximum level. The sequence of CO2 concentrations (µmol·mol−1) was 400, 200, 100, 0, 400, 800, 1000, 1600, and 2000, with each step lasting 120–180 s. Finally, the measured data were used to fit the PnCi curves using the Leaf Photosynthesis Calculation Software 4.1.1 and a modified rectangular hyperbola model, with intercellular CO2 concentration (Ci) as the x-axis and net photosynthetic rate (Pn) as the y-axis to generate the CO2 response curves [28].
P n = α 1 β C i 1 + γ C i C i R p
In the equation, Pn represents the net photosynthetic rate; Ci is the intercellular CO2 concentration; α denotes the initial carboxylation efficiency of the CO2 response curve; γ and β are fitting coefficients; and Rp is the photorespiration rate. When Pn equals zero, the CO2 compensation point (CDCP) can be obtained as follows:
C D C P   =   α α     γ R p   α     γ R p 2   4 α β R p 2 α β C i R p
The CO2 saturation point (CDSP) of the plant can be obtained using the following equation:
C D S P   = β   +   γ β   1 γ
The potential maximum net photosynthetic rate (Amax) of the plant is calculated as follows:
A m a x =   α β   +   γ   β γ 2 R p

2.3.4. Determination of Leaf Microstructure

The observation of leaf epidermal characteristics was conducted following the method described by Pan et al. [29] Mature and healthy leaves with similar positions and growth conditions were selected from the plants used for photosynthetic measurements. The middle portion between the leaf margin and the main vein was cut into small squares of approximately 5 mm × 5 mm and immediately fixed in 2.5% glutaraldehyde solution. The samples were then brought to the laboratory and dehydrated through a graded ethanol series (30%, 50%, 70%, 80%, 90%, 100%, 100%, 100%) for 15 min at each step.
After dehydration, the leaf tissues were subjected to critical point drying and sputter-coated with gold. The upper and lower epidermis, as well as stomata, were examined using a scanning electron microscope (Carl Zeiss AG, Oberkochen, Germany). For each treatment, three healthy and mature leaves were selected for SEM observation. From each leaf, three randomly chosen visual fields at the same leaf position were photographed to minimize variability caused by sample heterogeneity. Observations were conducted using the Axio Vision SE64 Rel. 4.8 software, and the following stomatal parameters were measured: stomatal length (SL), stomatal width (SW), stomatal area (SA), and stomatal density (SD). SD was calculated as the number of stomata per unit area of the field of view, and SA was calculated using the formula (π = 3.14):
SA   = π × S L × S W 4
Paraffin sections of leaf tissues were prepared following the method described by Li [30]. For each plant, three healthy leaves of similar orientation and growth status were collected. Leaf segments of approximately 10 mm × 10 mm were cut transversely across the midrib and fixed in FAA solution (70% ethanol/formalin/acetic acid = 90:5:5). The samples were placed in dehydration boxes and subjected to a graded ethanol and xylene series for dehydration and wax infiltration. After infiltration, the tissues were embedded in paraffin, sectioned, deparaffinized, and rehydrated. Sections were stained with toluidine blue and mounted with neutral balsam. The slides were observed and photographed under a light microscope, and microscopic parameters were measured using the image analysis software CaseViewer 2.4.
The measured parameters included upper epidermal thickness (UET), lower epidermal thickness (LET), leaf thickness (LT), palisade parenchyma thickness (PPT), spongy parenchyma thickness (SPT), and the ratio of palisade to spongy parenchyma thickness (PPT/SPT). For each treatment, nine random fields of view were selected to measure these anatomical traits.

2.3.5. Determination of Photosynthetic Pigments

Three leaves with similar maturity, position, and size were collected from each plant used for photosynthetic measurements. For each sample, 0.2 g of intact leaf tissue was accurately weighed and placed in a 25 mL volumetric flask. The leaves were extracted with 95% ethanol and incubated in the dark for 24 h. Absorbance was measured at wavelengths of 470, 649, and 665 nm using a UV–visible spectrophotometer (Alpha 1502, Shanghai Spectrum Instrument Co., Ltd., Shanghai, China).
Chlorophyll a (Chl a), chlorophyll b (Chl b), total chlorophyll (Chl a + b), and carotenoid (Car) contents were calculated following the method of Li [31]. Additionally, the ratios of chlorophyll a to chlorophyll b (Chl a/Chl b) and carotenoids to total chlorophyll (Car/Chl a + b) were determined.
Chl a concentration (mg·g−1 FW):
C a = 13.95 A 665 6.88 A 649
Chl b concentration (mg·g−1 FW):
C b = 24.96 A 649 7.32 A 655
Car concentration (mg·g−1 FW):
C a r   = 1000 A 470 2.05 C a 114.8 C b 245

2.3.6. Plasticity Index and Correlation Analysis

Phenotypic plasticity indices were calculated following Valladares et al. [32]. The phenotypic plasticity index (PPI) for each trait was calculated using the following formula: PPI = (VmaxVmin)/Vmax, where Vmax and Vmin represent the maximum and minimum values of a given trait under the three different light intensity treatments, respectively.
Experimental data were organized and summarized using Excel 365 (Microsoft, Redmond, WA, USA). Statistical analyses were performed in SPSS 27.0 (SPSS Inc., Chicago, IL, USA). Pearson’s correlation analysis was used to evaluate the relationships among growth parameters, photosynthetic traits, and pigment contents. The resulting correlation matrix was visualized as a heatmap in Origin 2024 (Origin Lab Corporation, Northampton, MA, USA) to intuitively display the correlations among traits.

2.4. Data Processing

The experimental data were organized and processed using Excel 2016 (Microsoft, Redmond, WA, USA). One-way analysis of variance (ANOVA) was performed in SPSS 27.0 (SPSS Inc., Chicago, NA, USA), with standard deviations calculated for plotting error bars. Multiple comparisons were conducted using Duncan’s test. Photosynthetic parameters were fitted and calculated using photosynthesis modeling software. Correlation analyses among light conditions, functional traits, pigment contents, leaf anatomical characteristics, and leaf epidermal features were performed in Origin 2024 (Origin Lab Corporation, Northampton, MA, USA), and the results were visualized accordingly.

3. Results

3.1. Changes in Growth Indicators

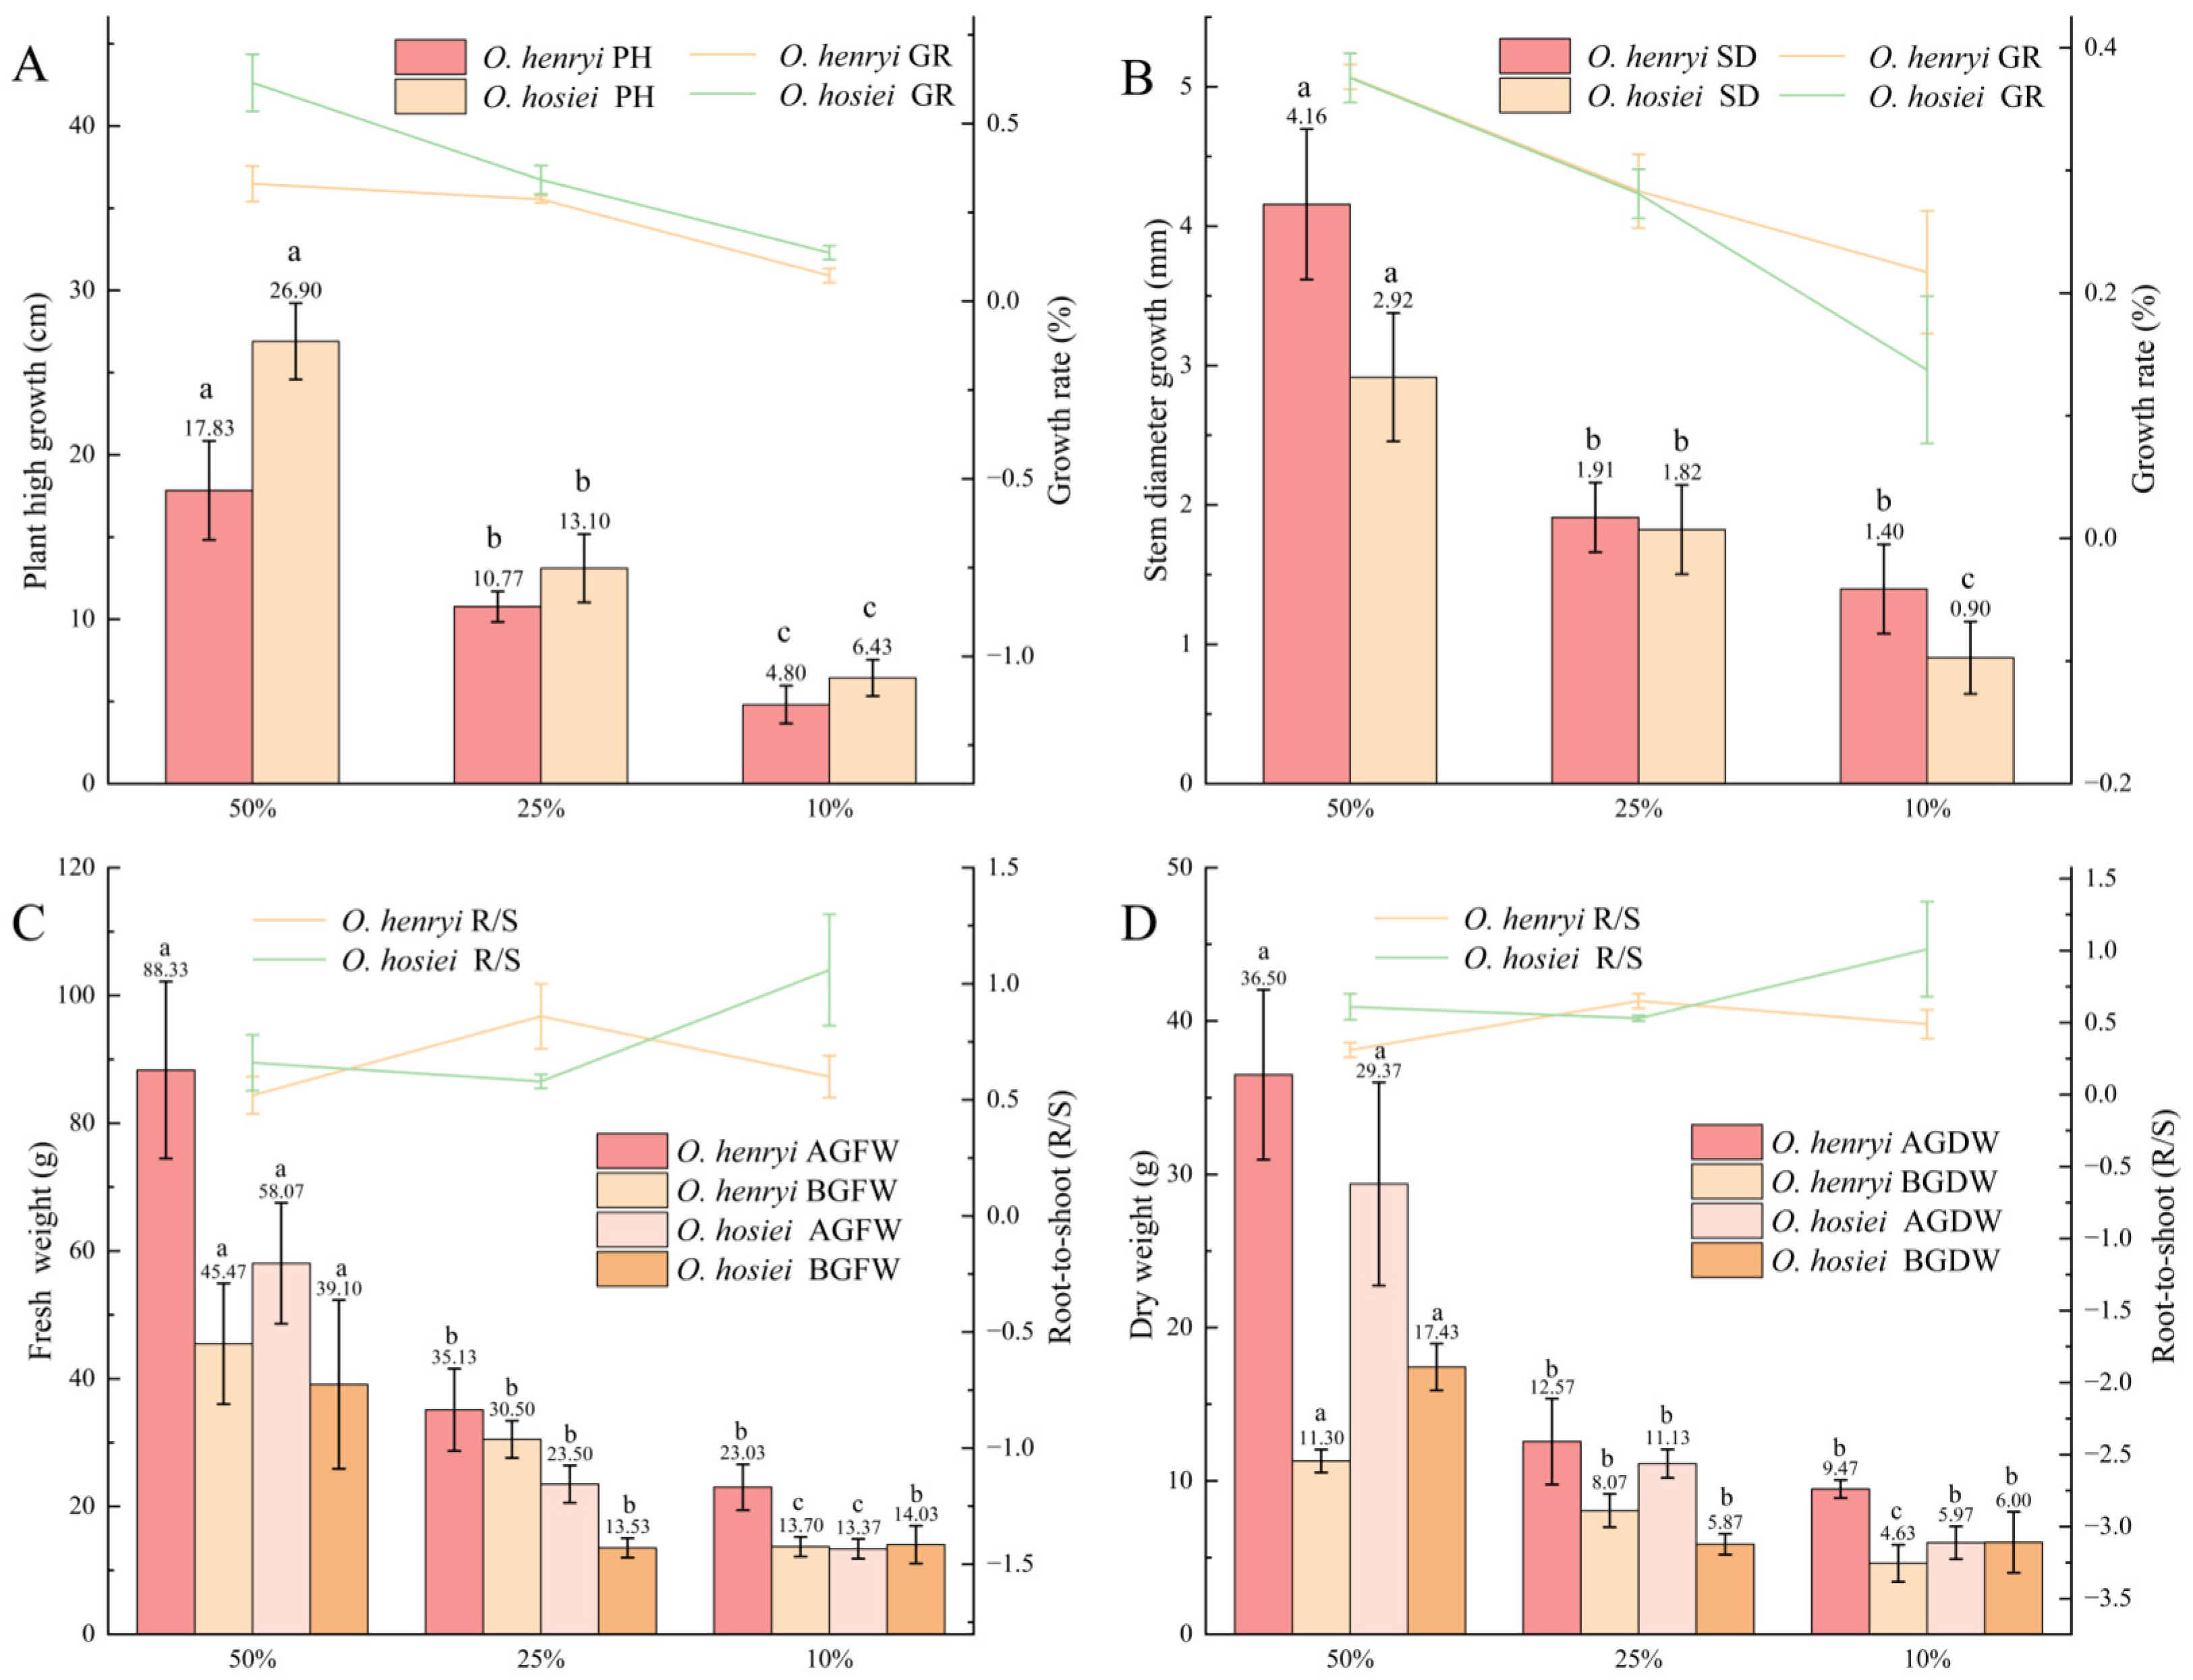
As shown in Figure 1, seedlings of O. hosiei and O. henryi exhibited leaf wilting under 100% full sunlight conditions, with visible desiccation appearing by the third day and complete leaf necrosis by the fifth day. Therefore, the 100% full sunlight treatment was excluded from subsequent analyses, and only data from the 50%, 25%, and 10% light intensity treatments were retained in this study. As shown in Figure 2, both O. hosiei and O. henryi displayed significant differences in growth increments, biomass accumulation, and root-to-shoot ratio under different light intensities. Under 50% light intensity, the seedlings of both species exhibited the greatest height growth (Figure 2A), reaching 17.83 ± 3.01 cm in O. henryi and 26.90 ± 2.32 cm in O. hosiei. As light intensity decreased to 25% and 10%, height growth declined significantly, with both species showing less than 7 cm of height increment under 10% light intensity. Overall, O. hosiei exhibited greater height growth than O. henryi.
The trend of stem diameter increment was similar to that of height growth (Figure 2B). Under 50% light intensity, both species showed the highest diameter growth, 4.16 ± 0.54 mm for O. henryi and 2.92 ± 0.46 mm for O. hosiei. When light intensity decreased to 25% and 10%, the diameter increment decreased significantly, with both species showing less than 1.5 mm growth under 10% light intensity. In general, O. henryi had a greater stem diameter increment than O. hosiei. Both aboveground and belowground fresh weights of O. henryi and O. hosiei were significantly higher under 50% light intensity compared with other treatments (Figure 2C), and both fresh weights were greater in O. henryi than in O. hosiei. As light intensity decreased, both above- and belowground fresh weights declined markedly. The pattern of dry weight was consistent with that of fresh weight (Figure 2D): under 50% light intensity, O. henryi had the highest aboveground dry weight (36.50 ± 5.54 g), followed by O. hosiei (29.37 ± 6.63 g). Both aboveground and belowground dry weights decreased significantly under 25% and 10% light intensities. In addition, the root-to-shoot ratio (R/S) showed contrasting trends between the two species. O. henryi exhibited a convex pattern, with the highest R/S ratio at 25% light intensity and lower values at 50% and 10%, whereas O. hosiei showed a concave trend, with the highest R/S ratio at 10%, followed by 50%, and the lowest at 25%.

3.2. Photosynthetic Characteristics

3.2.1. Light Response Curves

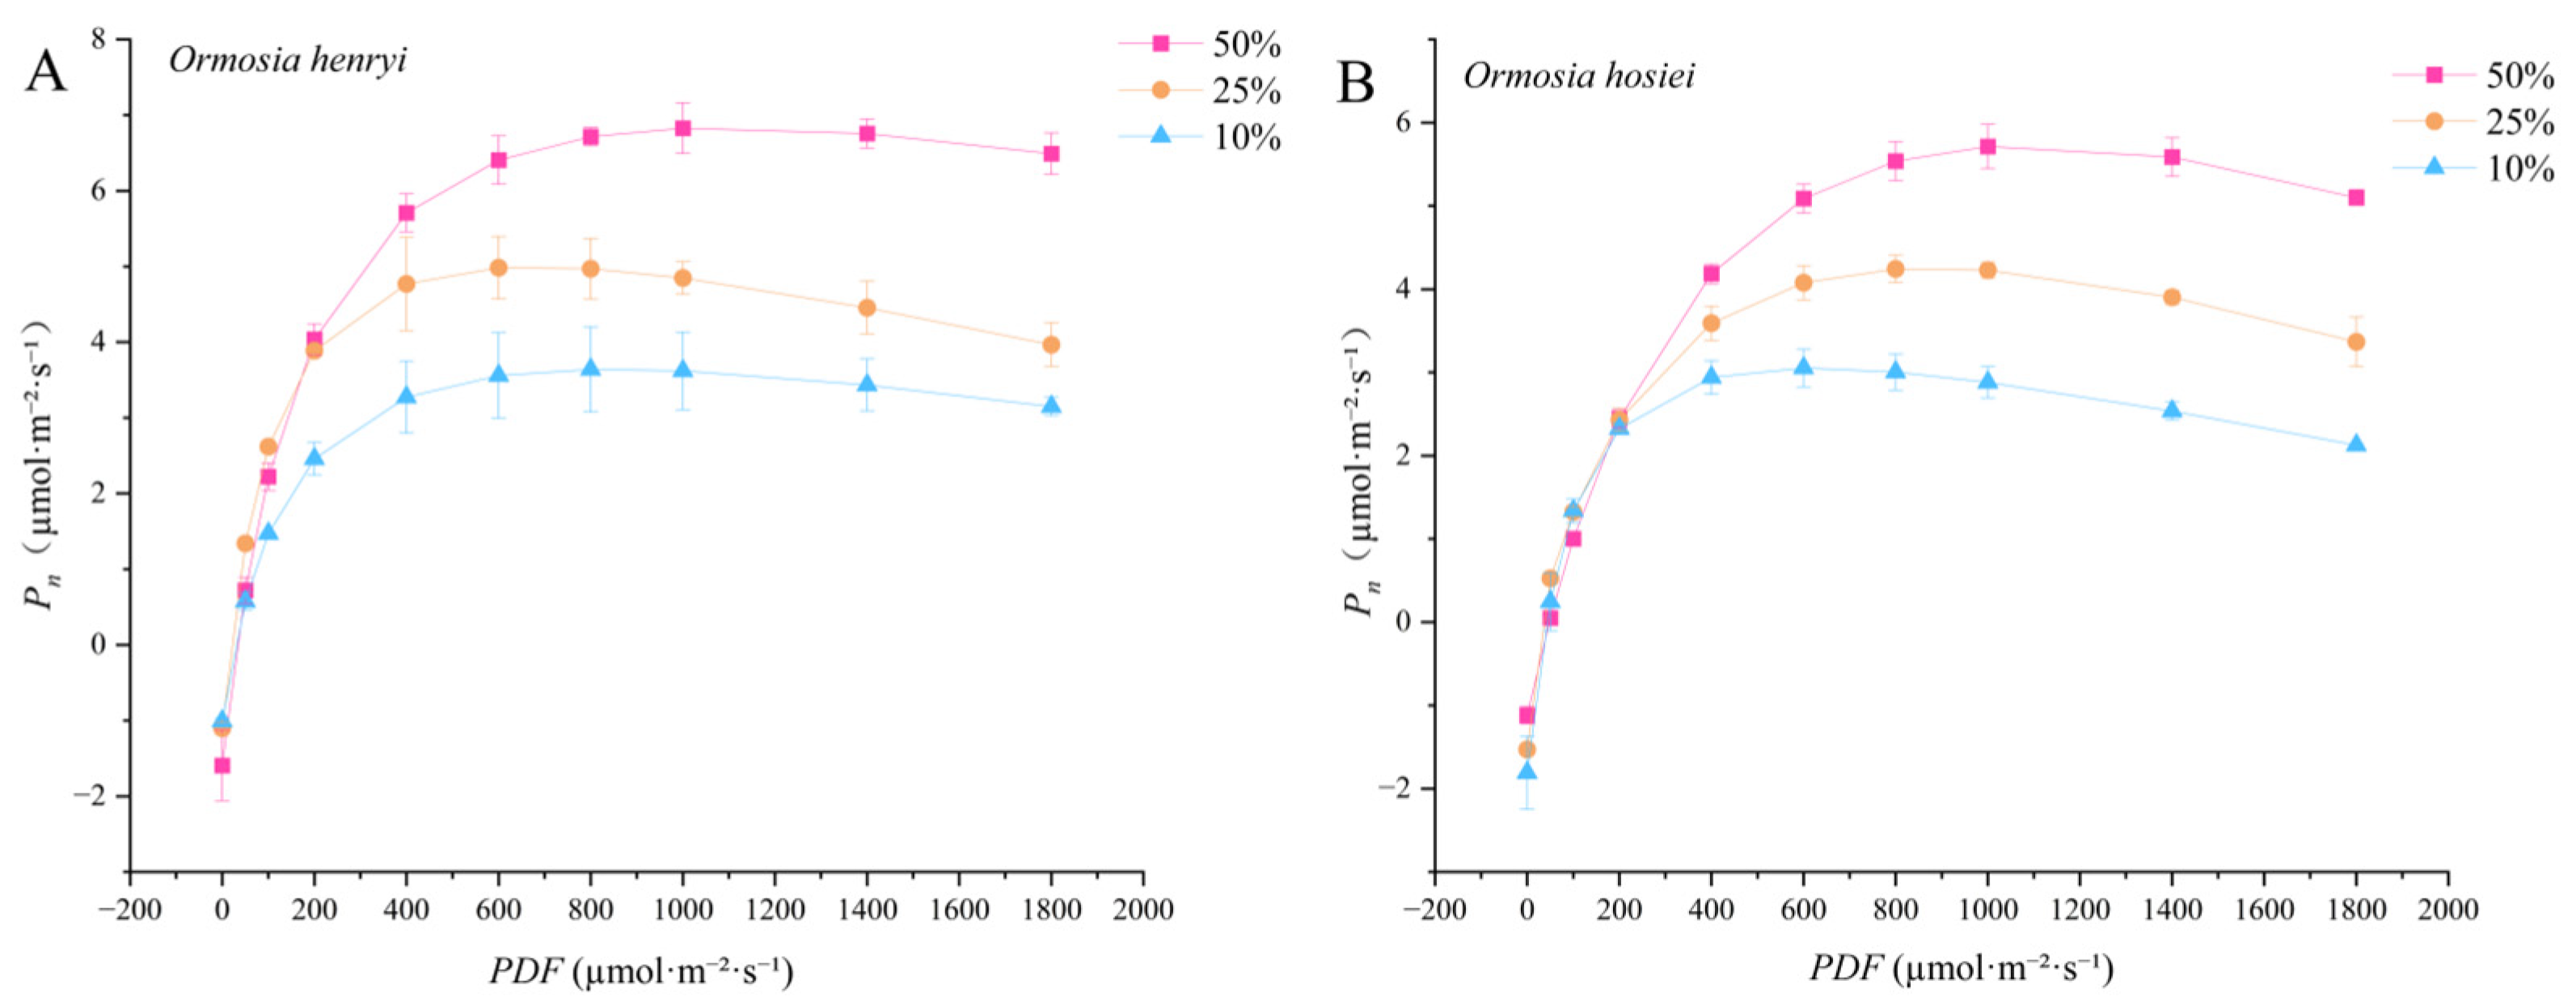
As shown in Figure 3, with the increase in photosynthetically active radiation (PAR), the net photosynthetic rate (Pn) of O. henryi and O. hosiei both increased rapidly and gradually reached saturation at higher light intensities, followed by a slight decline. Under different shading treatments, both species exhibited a consistent trend of 50% > 25% > 10%, indicating that moderate shading significantly enhanced photosynthetic capacity, whereas low light intensity severely limited photosynthetic potential.
As shown in Table 1, the maximum net photosynthetic rate (Pmax) of O. henryi reached 6.86 μmol·m−2·s−1 under 50% light, which was significantly higher than that under 25% and 10% light conditions. Similarly, O. hosiei exhibited the highest Pmax (5.93 ± 0.197 μmol·m−2·s−1) under 50% shading, which was also significantly greater than under 25% and 10% light conditions. Regarding the light saturation point (LSP), O. henryi showed no significant difference between the 50% and 25% treatments, but both were significantly higher than under 10% light. In contrast, O. hosiei exhibited a clear trend of 50% > 25% > 10%. For the light compensation point (LCP), both Ormosia species had the highest LCP values under 50% light. O. henryi showed no significant difference between 50% and 25% light treatments, but both were significantly higher than under 10% light; O. hosiei displayed a pattern of 50% > 10% > 25%, with significant differences among all three light treatments. In terms of dark respiration rate (Rd), O. henryi showed no significant differences across light treatments, while O. hosiei exhibited the trend 10% > 50% > 25%.

3.2.2. CO2 Response Curves

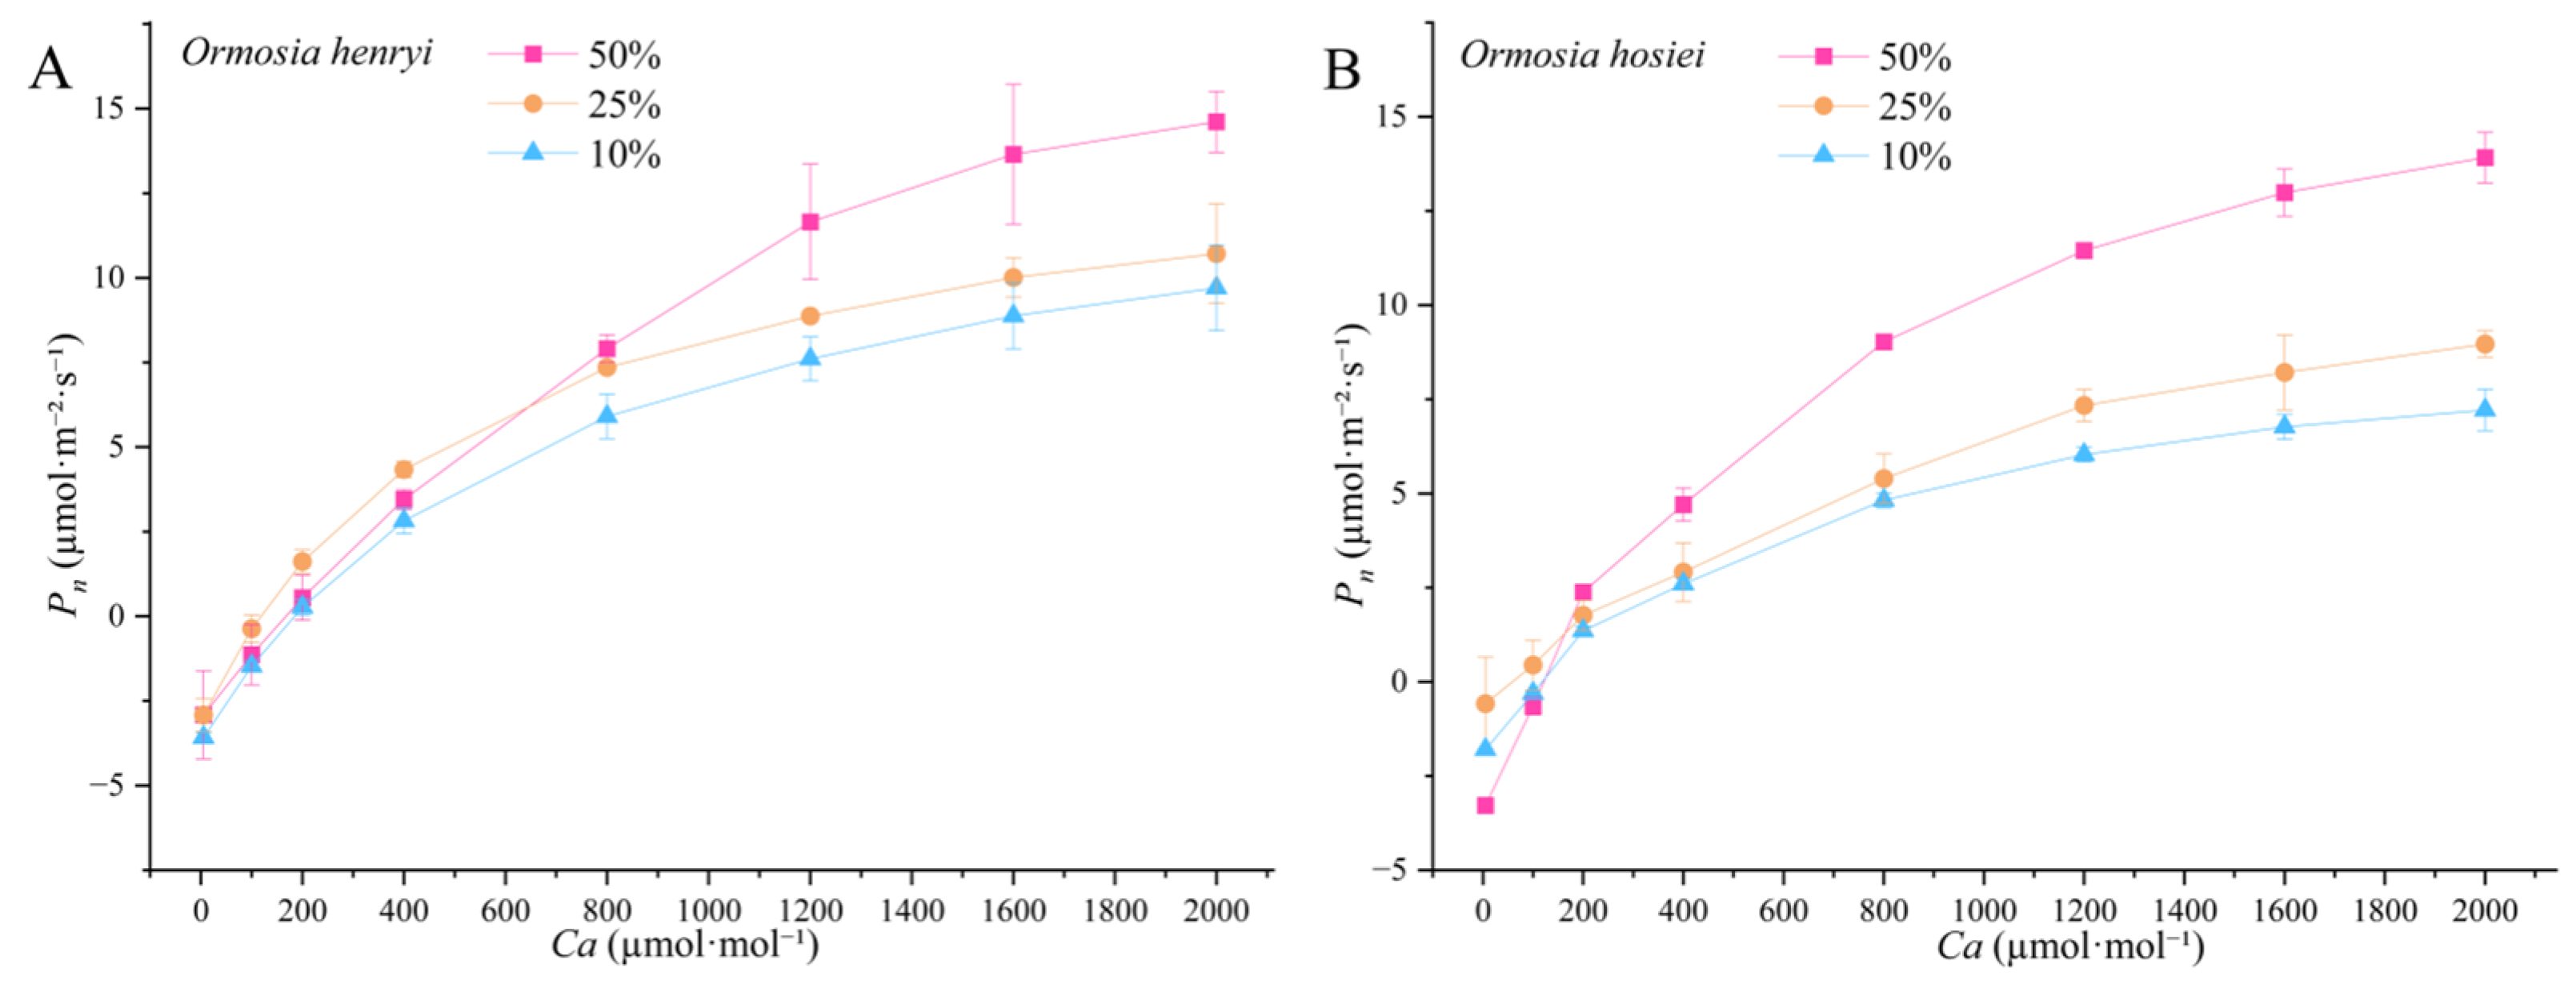
As shown in Figure 4, with the increase in intercellular CO2 concentration (Ca), the net photosynthetic rate (Pn) of O. hosiei and O. henryi gradually increased and tended to stabilize under high CO2 concentrations. Under different shading treatments, both Ormosia species exhibited the pattern 50% > 25% > 10% under high CO2 conditions, whereas under low CO2 conditions, the 25% shading treatment showed relatively higher Pn values.
As shown in Table 2, long-term exposure to different light intensities significantly affected the photosynthetic parameters of both species. The maximum net photosynthetic rate (Amax) of O. henryi under 50% light intensity reached 15.66 ± 1.124 μmol·m−2·s−1, which was significantly higher than that under 25% and 10% light intensities (approximately 11 μmol·m−2·s−1). Similarly, O. hosiei exhibited the highest Amax under 50% light intensity (13.37 ± 0.535 μmol·m−2·s−1), which was significantly higher than that under 25% and 10% light conditions, with the lowest value observed at 10% light (6.77 ± 0.685 μmol·m−2·s−1). The CO2 saturation point (CDSP) of O. henryi showed no significant difference between 50% and 25% light conditions but was significantly higher than under 10% light intensity. In O. hosiei, the CDSP under 50% light was significantly higher than under 25% and 10% light conditions. For the photorespiration rate (Rp), O. henryi showed a significantly lower value under 50% light than under 25% and 10% light, whereas O. hosiei showed the opposite trend (25% > 10% > 50%).

3.3. Leaf Microscopic Structure

3.3.1. Leaf Anatomical Structure

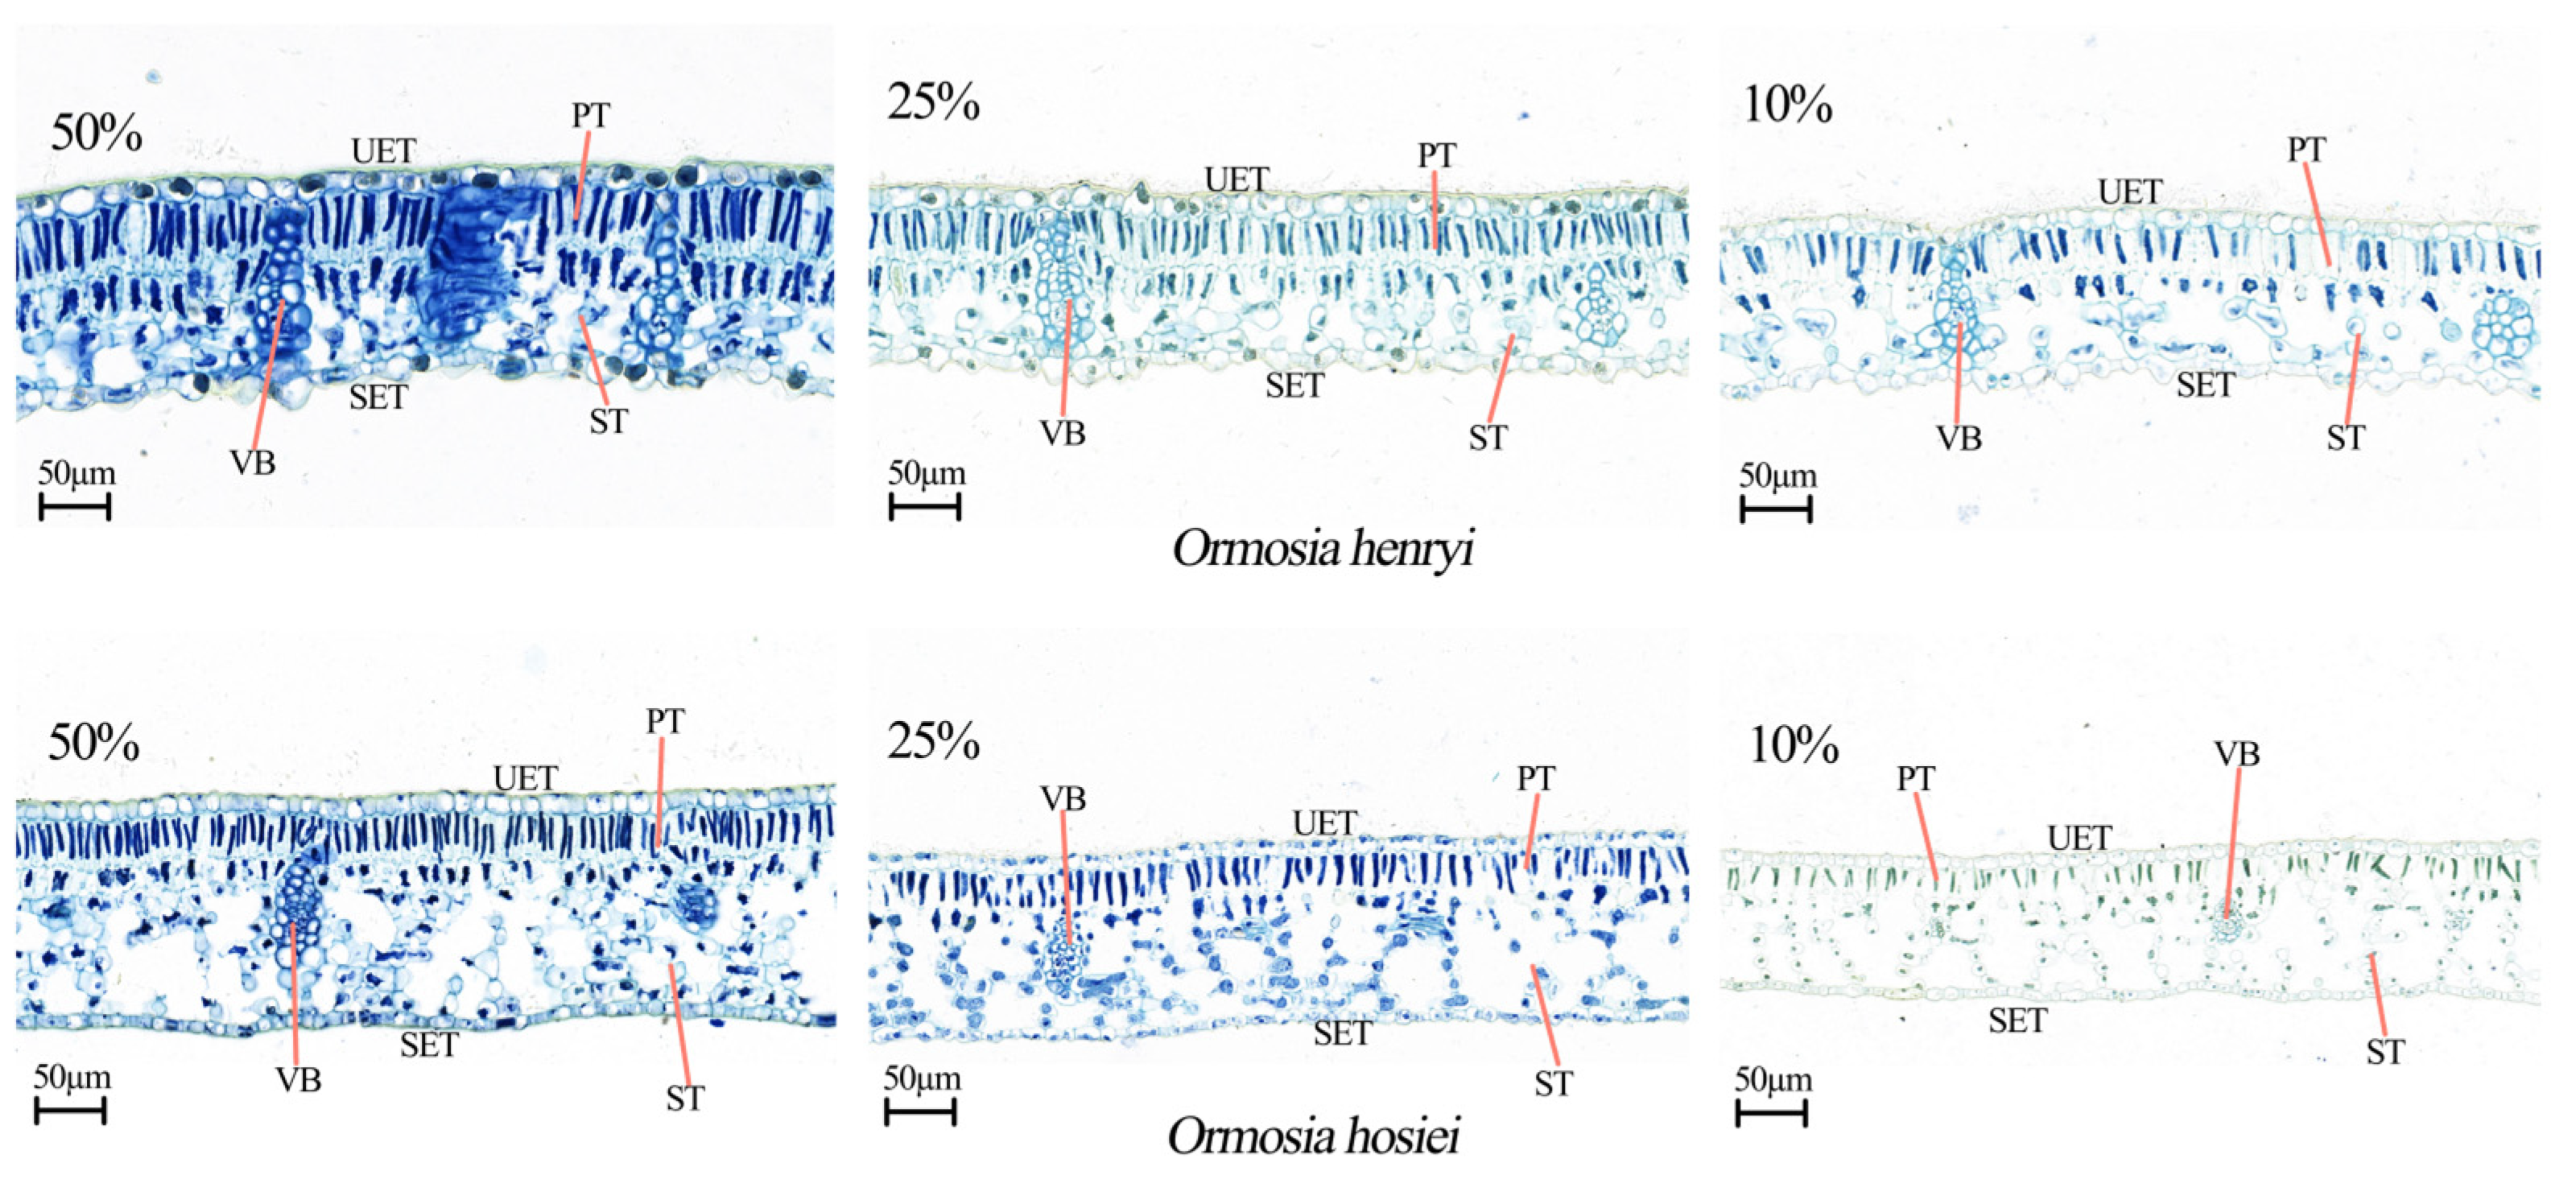
As shown in Figure 5, the leaf anatomical structures of O. henryi and O. hosiei exhibited significant differences under varying shading conditions. With decreasing light intensity, the overall leaf thickness and palisade tissue thickness of both species gradually decreased, while the spongy tissue became relatively loose. Notably, both species possess a double-layered palisade tissue, but under 10% light conditions, the second layer of palisade tissue became more dispersed.
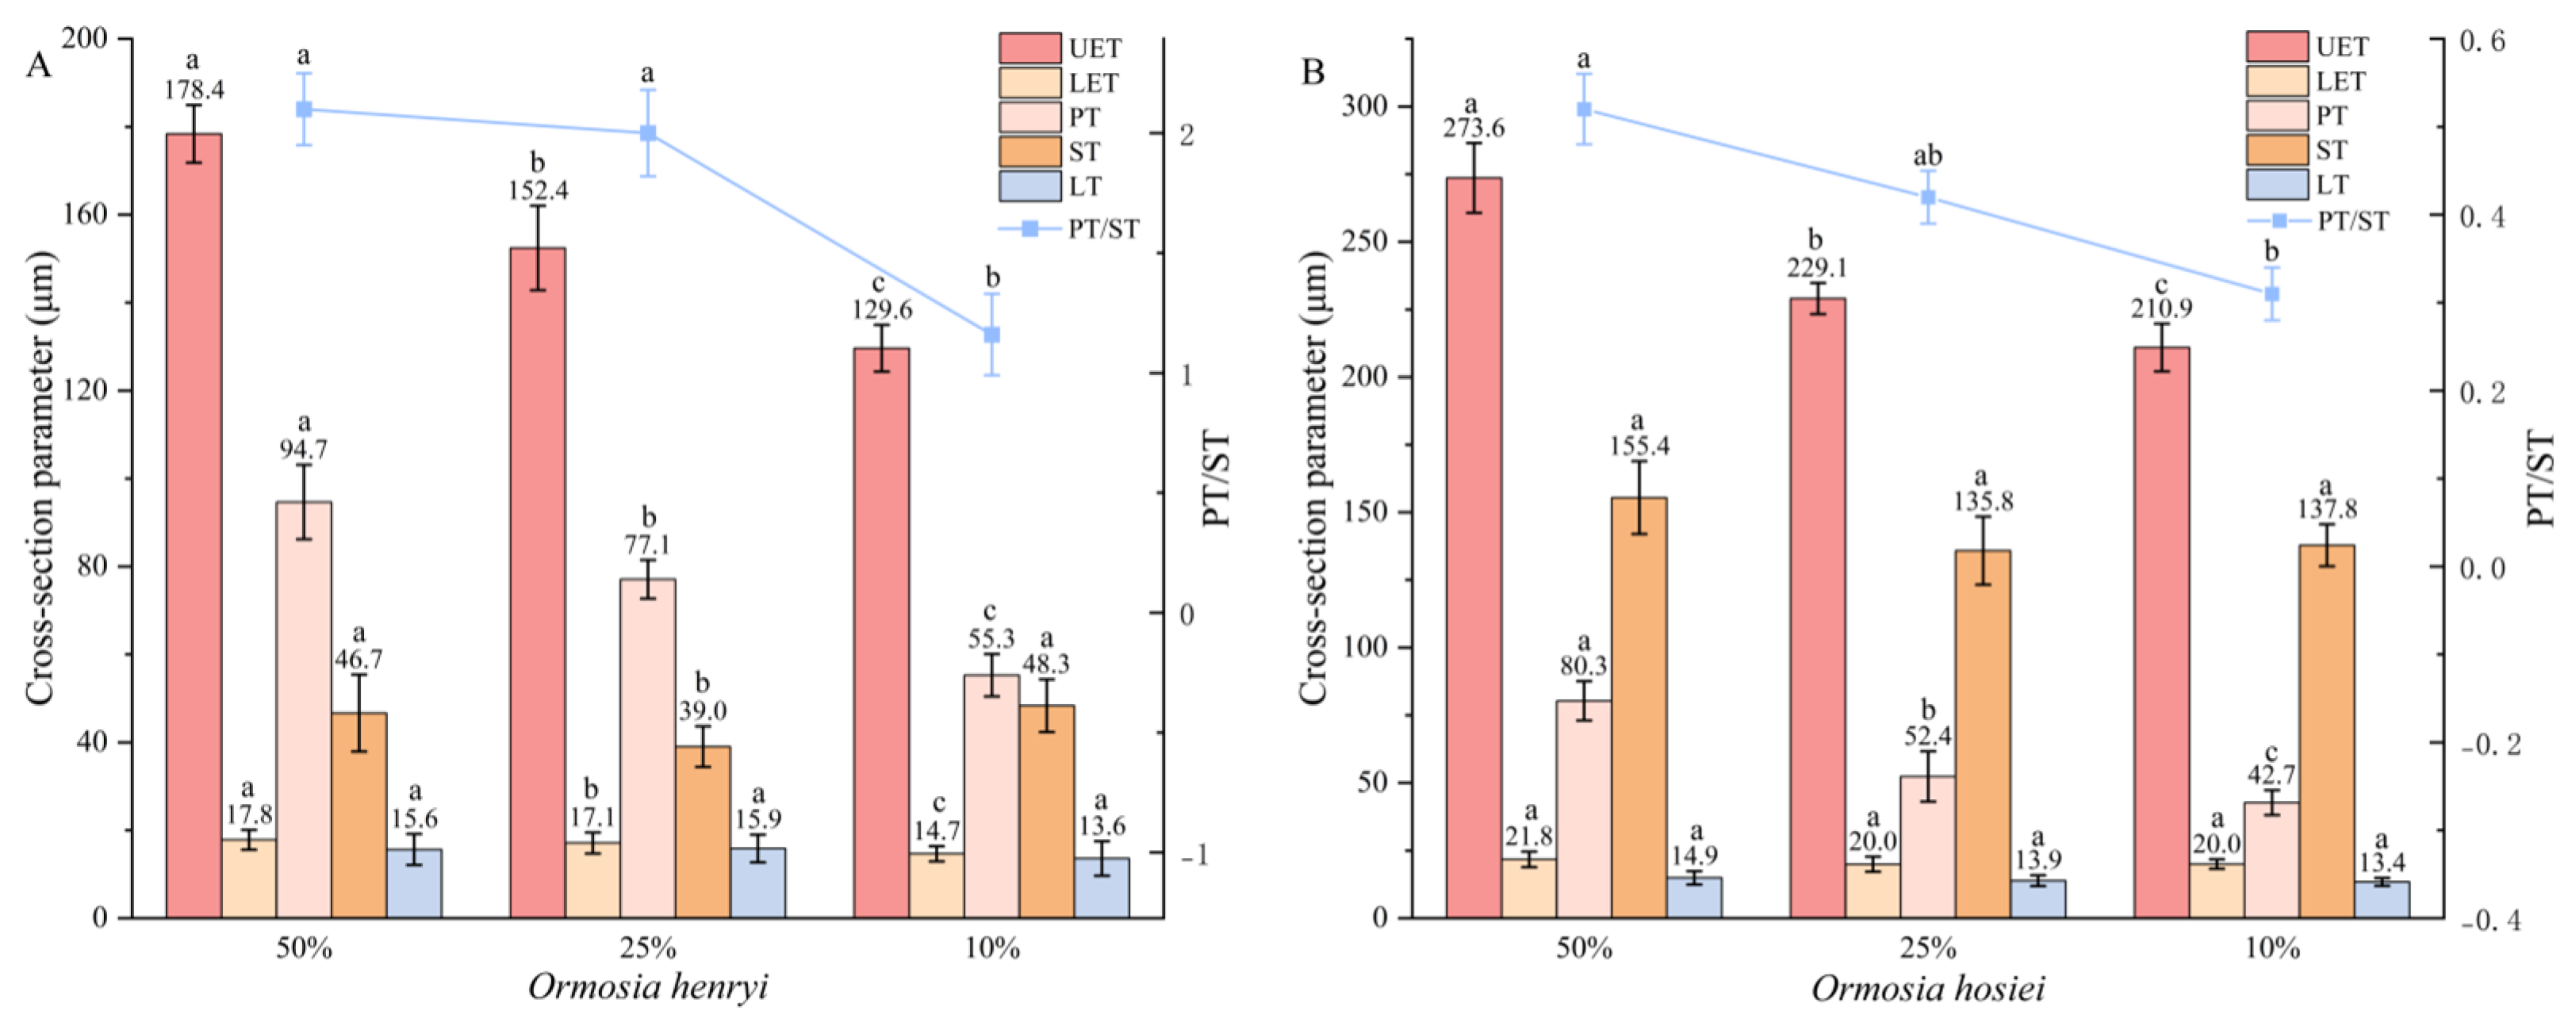
According to Figure 6, leaf thickness of both species differed significantly under different light conditions, following the trend: 50% > 25% > 10%. Under 50% light conditions, the palisade tissue of O. henryi and O. hosiei was the most developed and gradually thinned with reduced light intensity. Differences in spongy tissue thickness within a single species were not obvious across light treatments, resulting in a higher palisade-to-spongy tissue ratio (PT/ST) under 50% light. Under the same light conditions, the palisade tissue of O. henryi was thicker than that of O. hosiei, whereas O. hosiei exhibited much thicker spongy tissue overall. Consequently, O. henryi had a substantially higher PT/ST ratio than O. hosiei.

3.3.2. Leaf Epidermal Traits

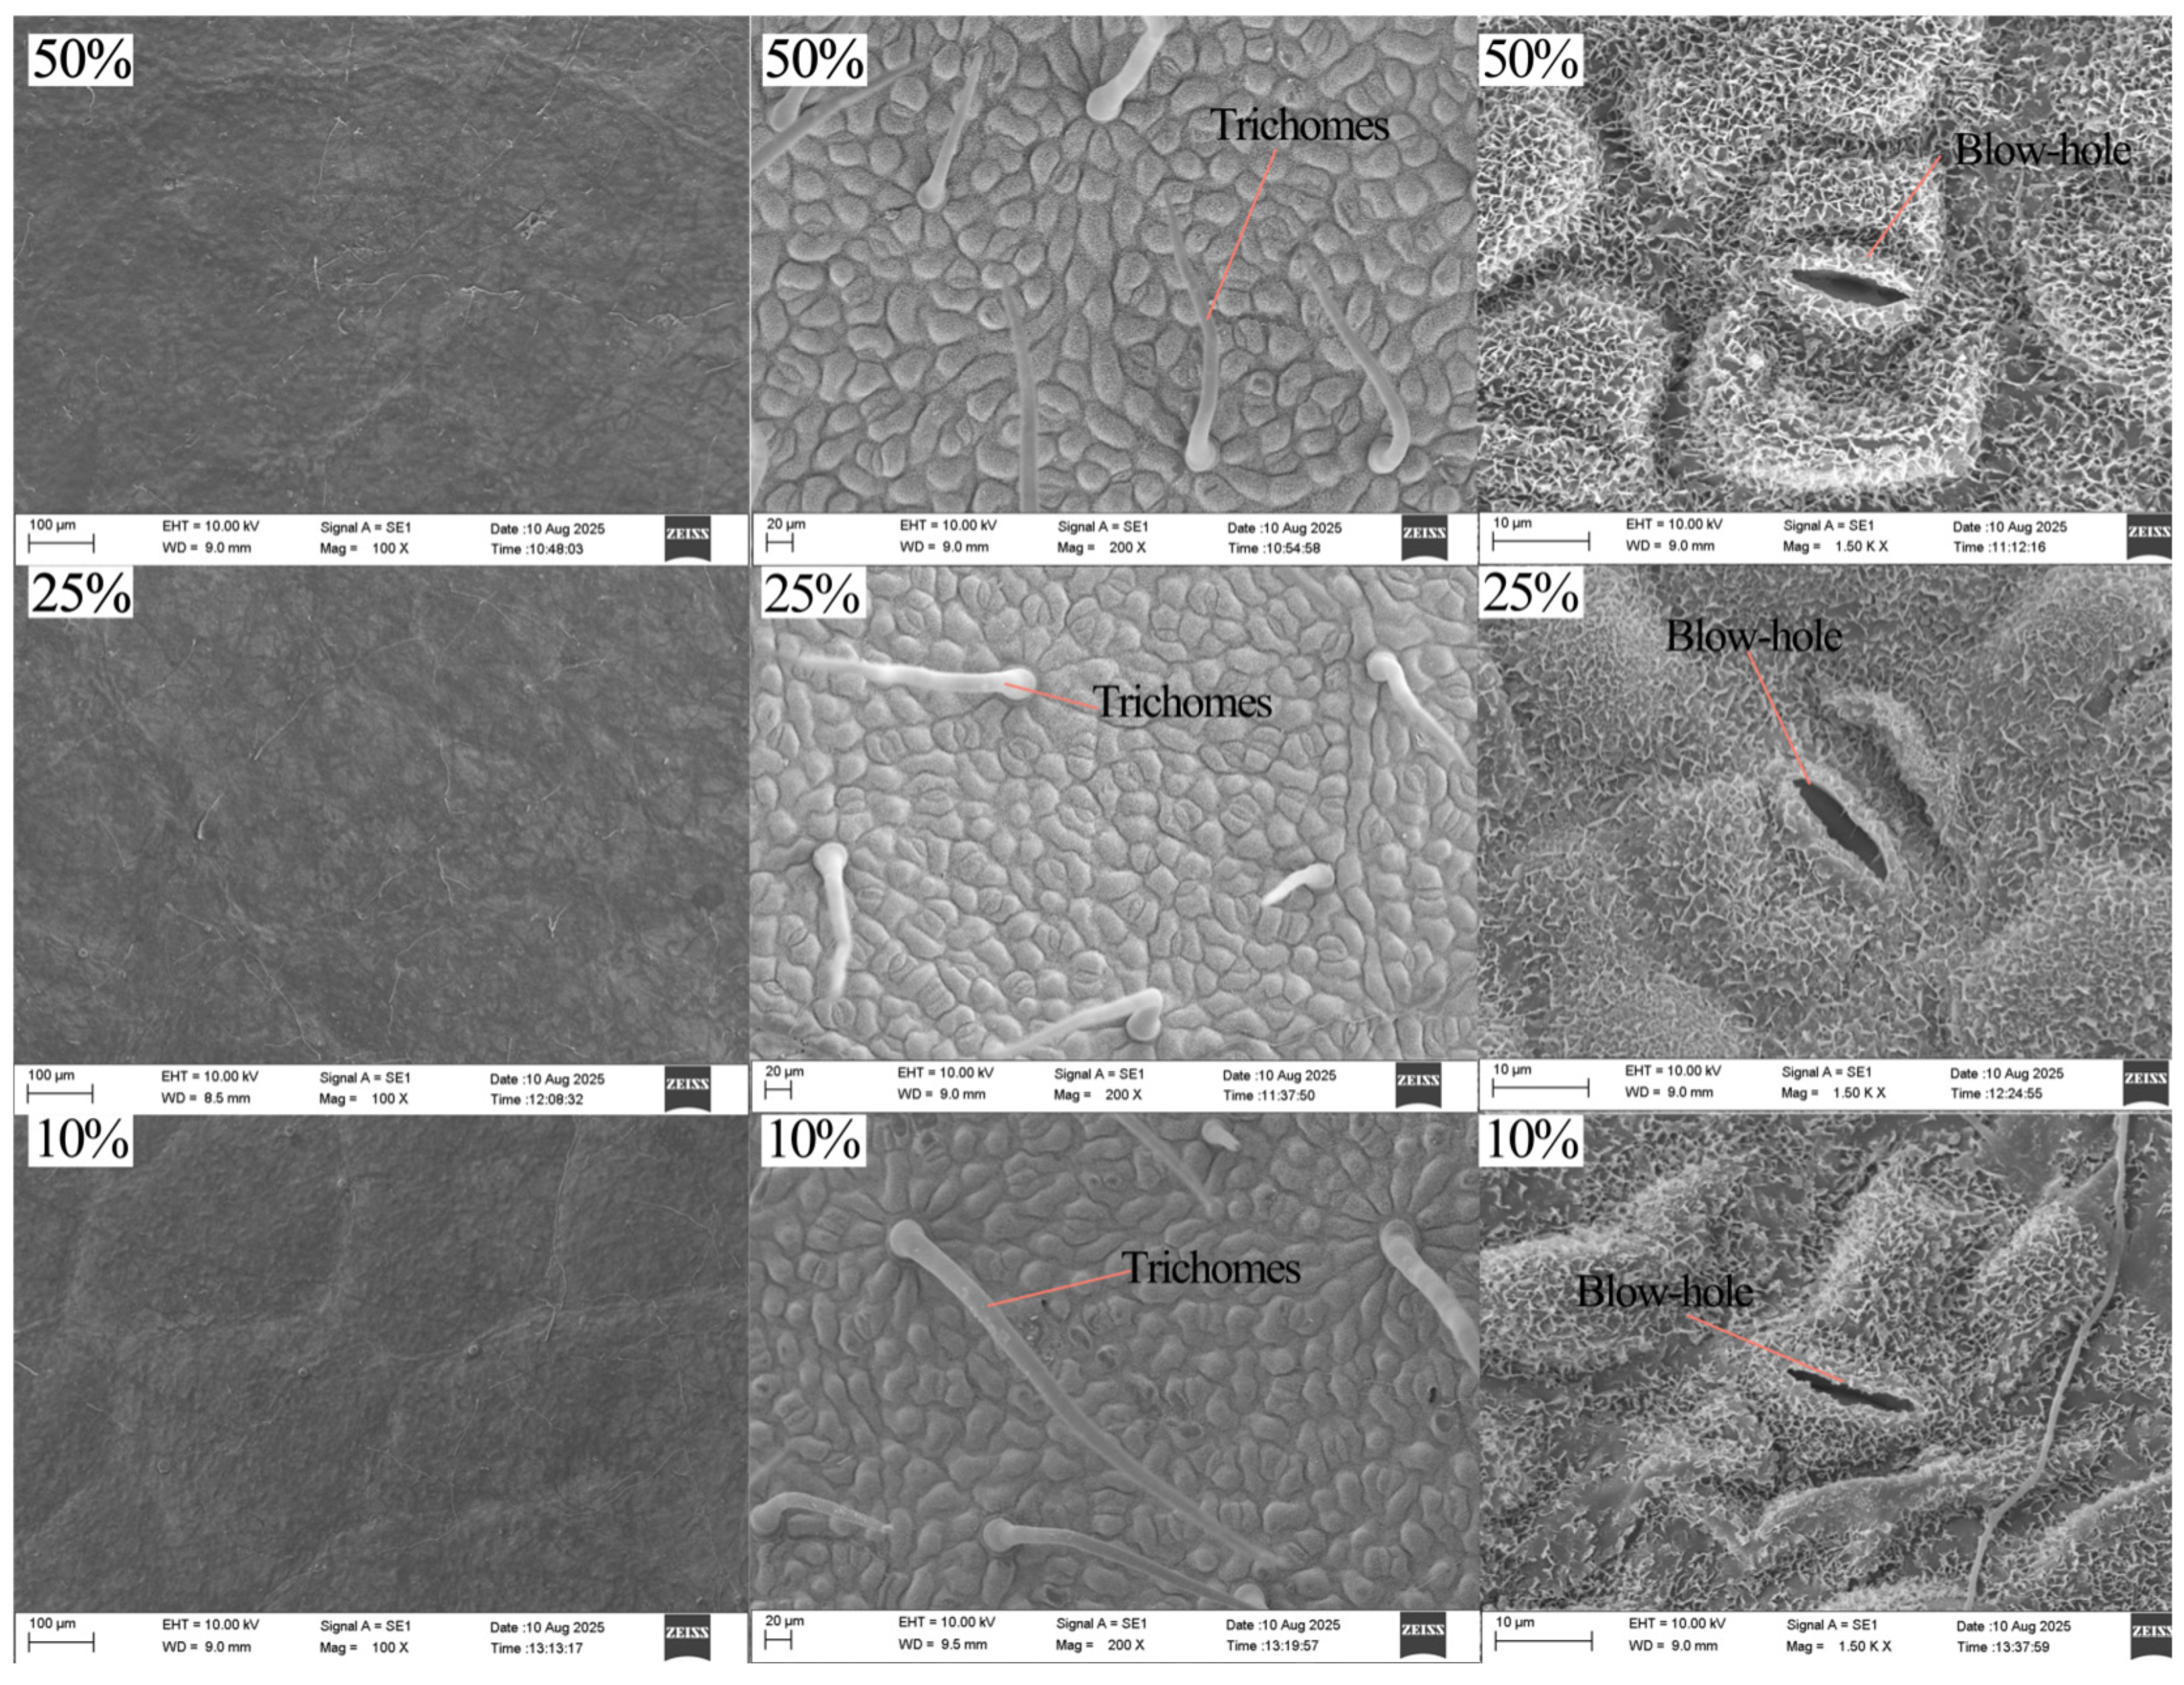
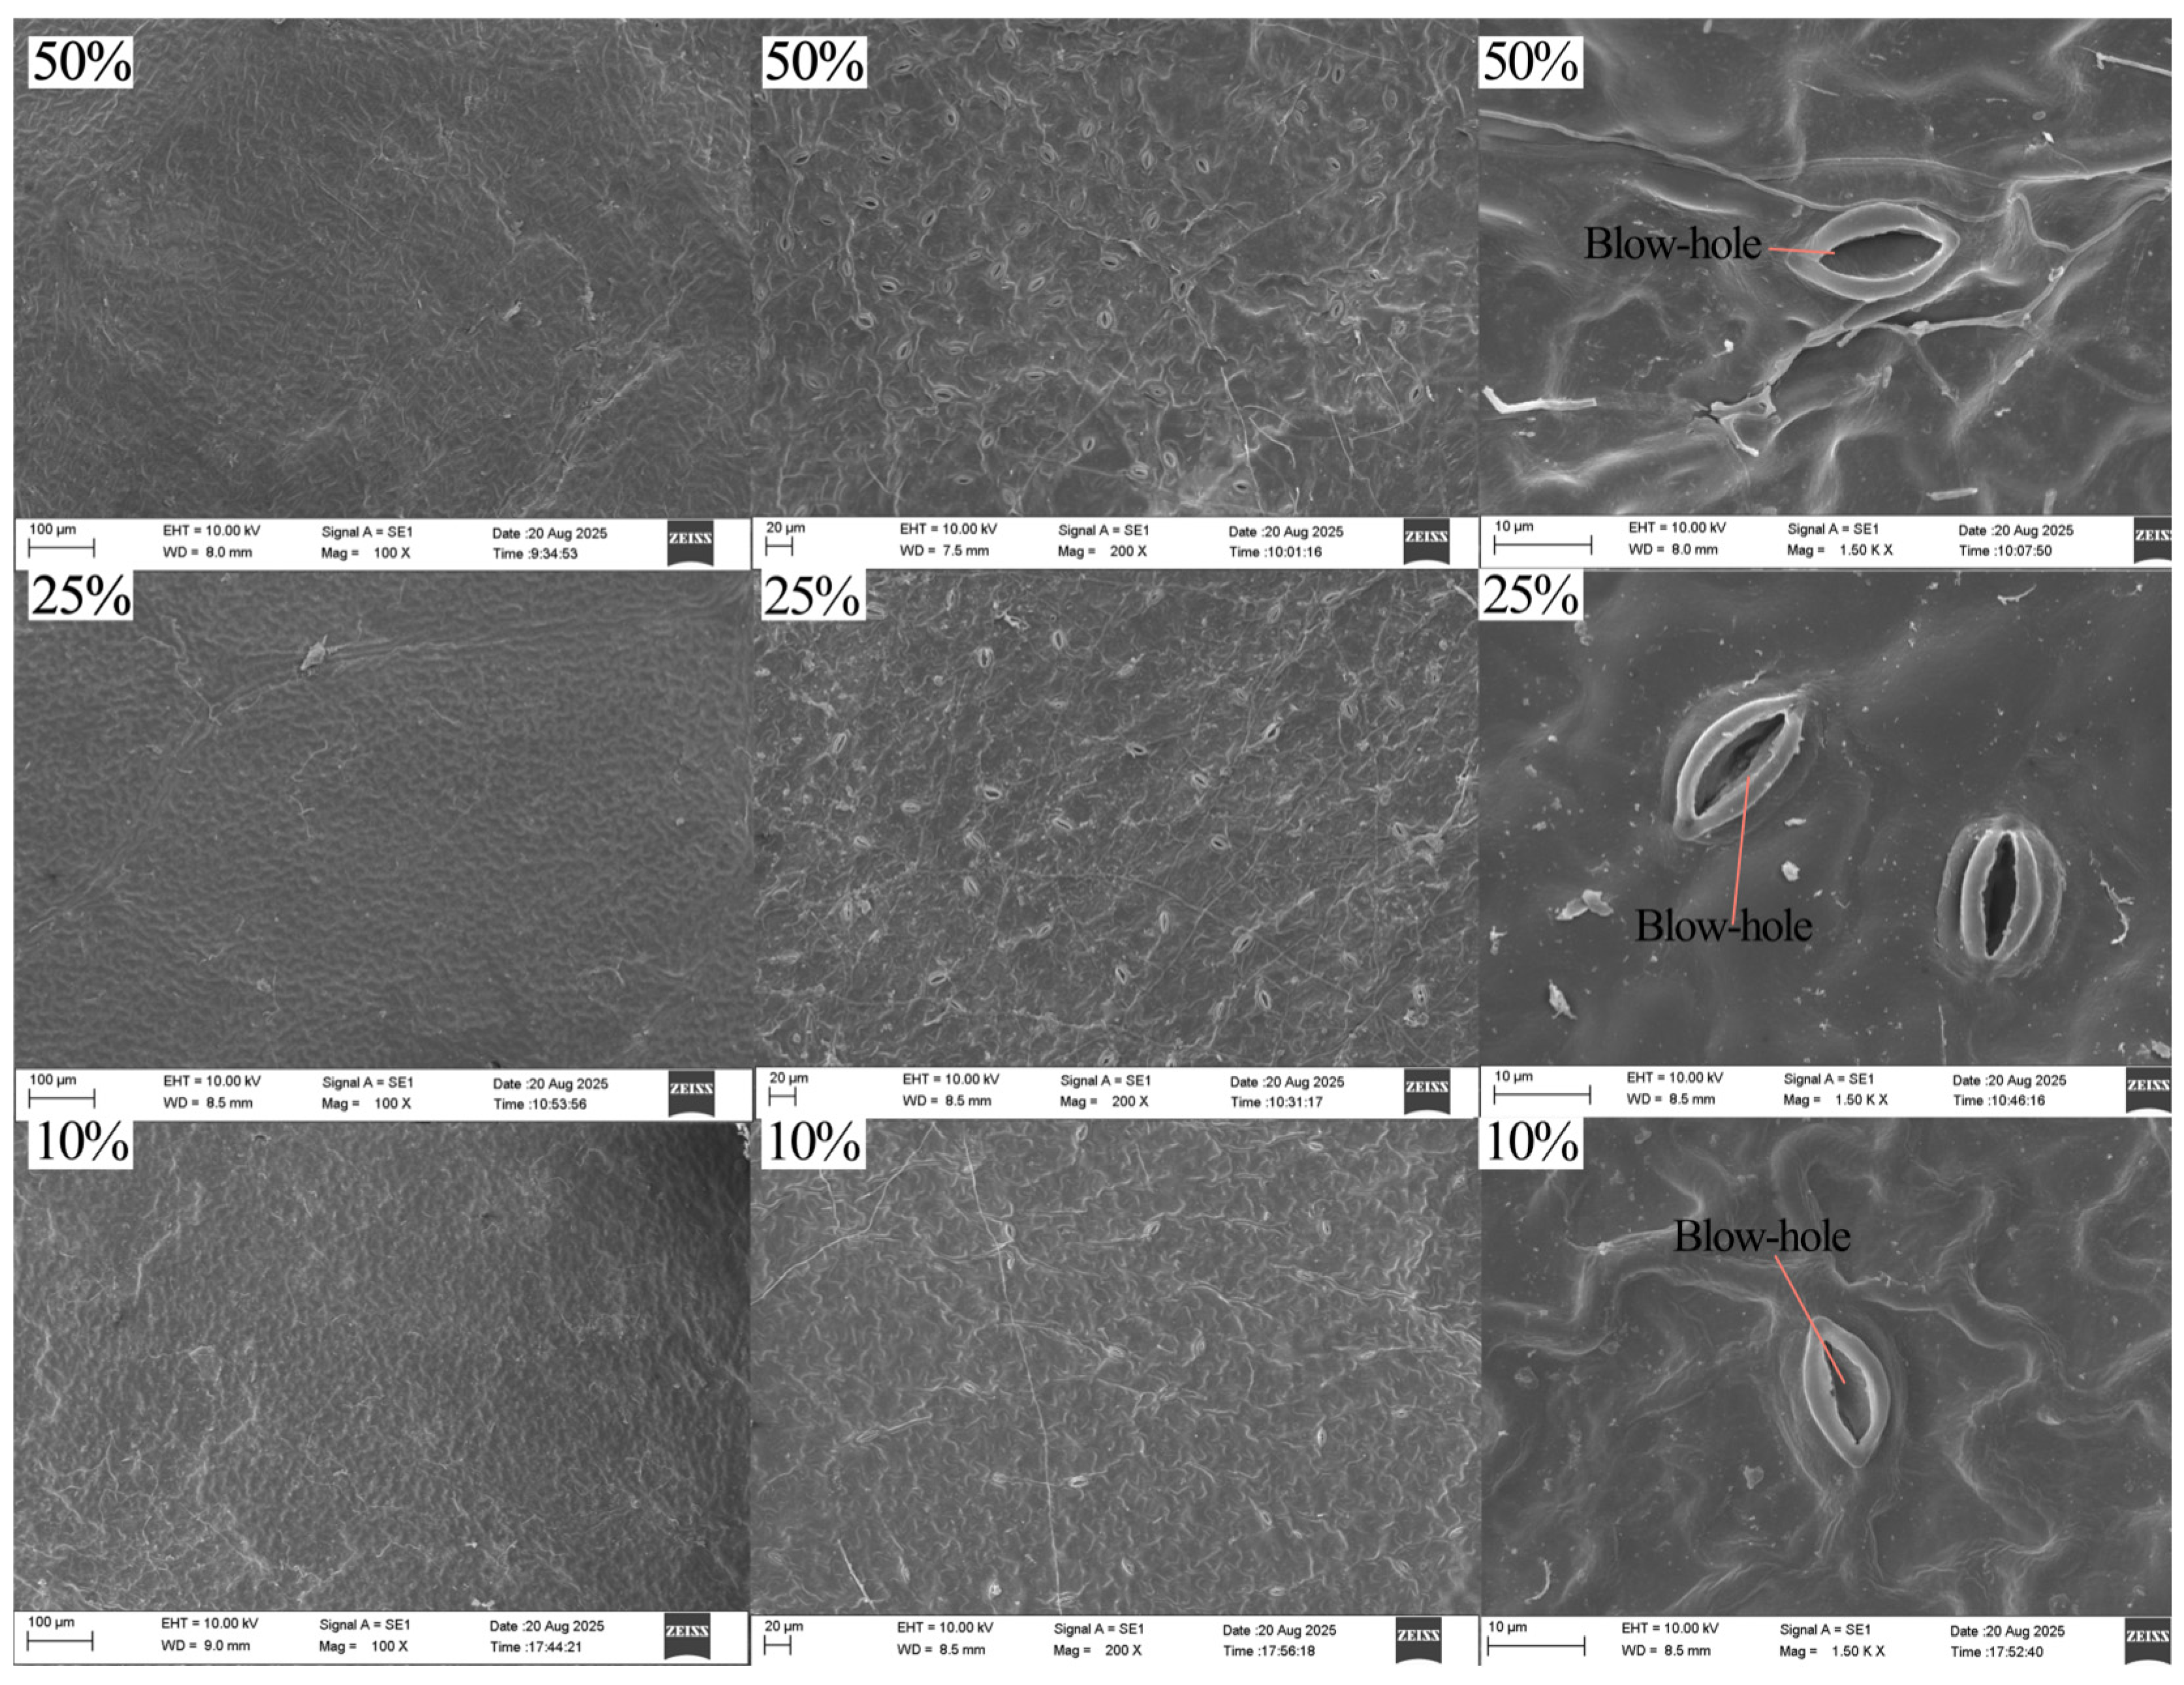
As shown in Figure 7 and Figure 8, the epidermal traits of the two Ormosia species did not exhibit obvious differences under varying light conditions, indicating that these traits have low plasticity in response to light. In both O. hosiei and O. henryi, stomata were distributed only on the abaxial (lower) leaf surface, while the adaxial (upper) surface was smooth and lacked stomata. The lower epidermis differed markedly between the two species: O. hosiei exhibited warty protuberances with trichomes, whereas O. henryi had a smooth lower epidermis without any ornamentation.
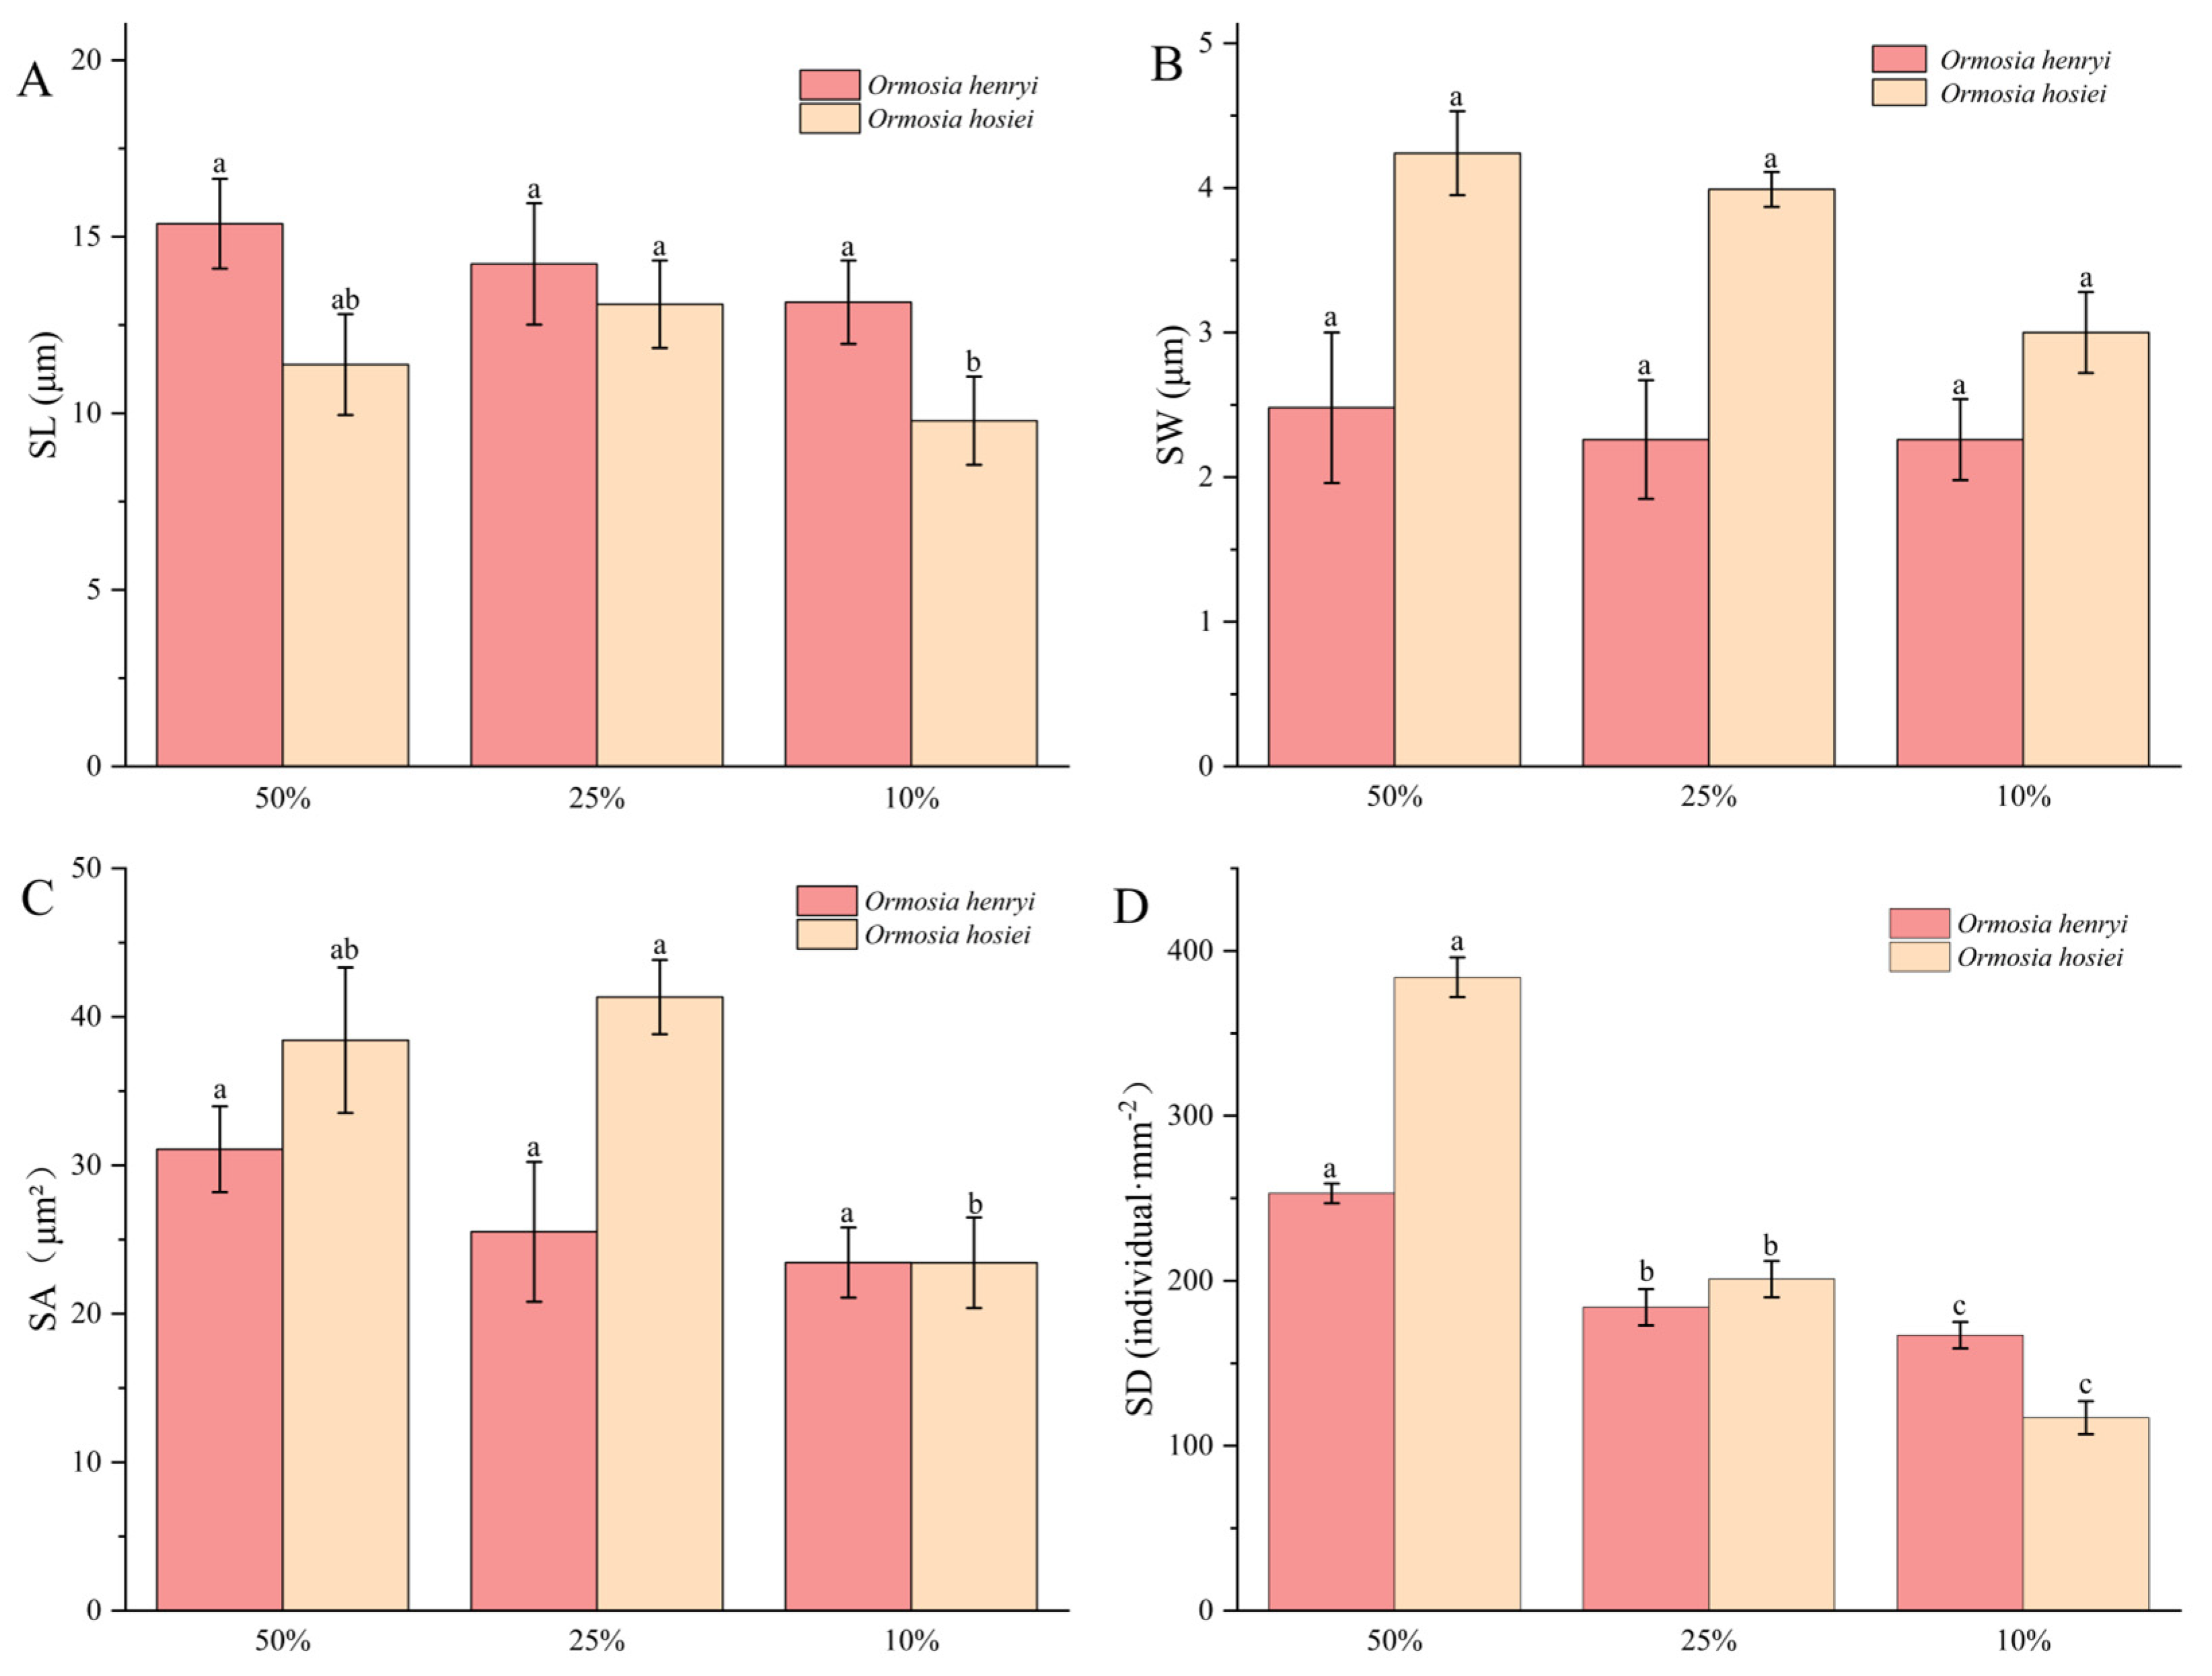
According to Figure 9, under different light conditions, stomatal length (SL), stomatal width (SW), and stomatal area (SA) of O. hosiei showed no significant differences; however, stomatal density (SD) was significantly higher under 25% light than under 50% and 10%. In contrast, for O. henryi, stomatal area differed significantly between 25% and 10% light conditions, while stomatal density decreased with declining light intensity, showing significant differences among the treatments.

3.4. Chlorophyll Content

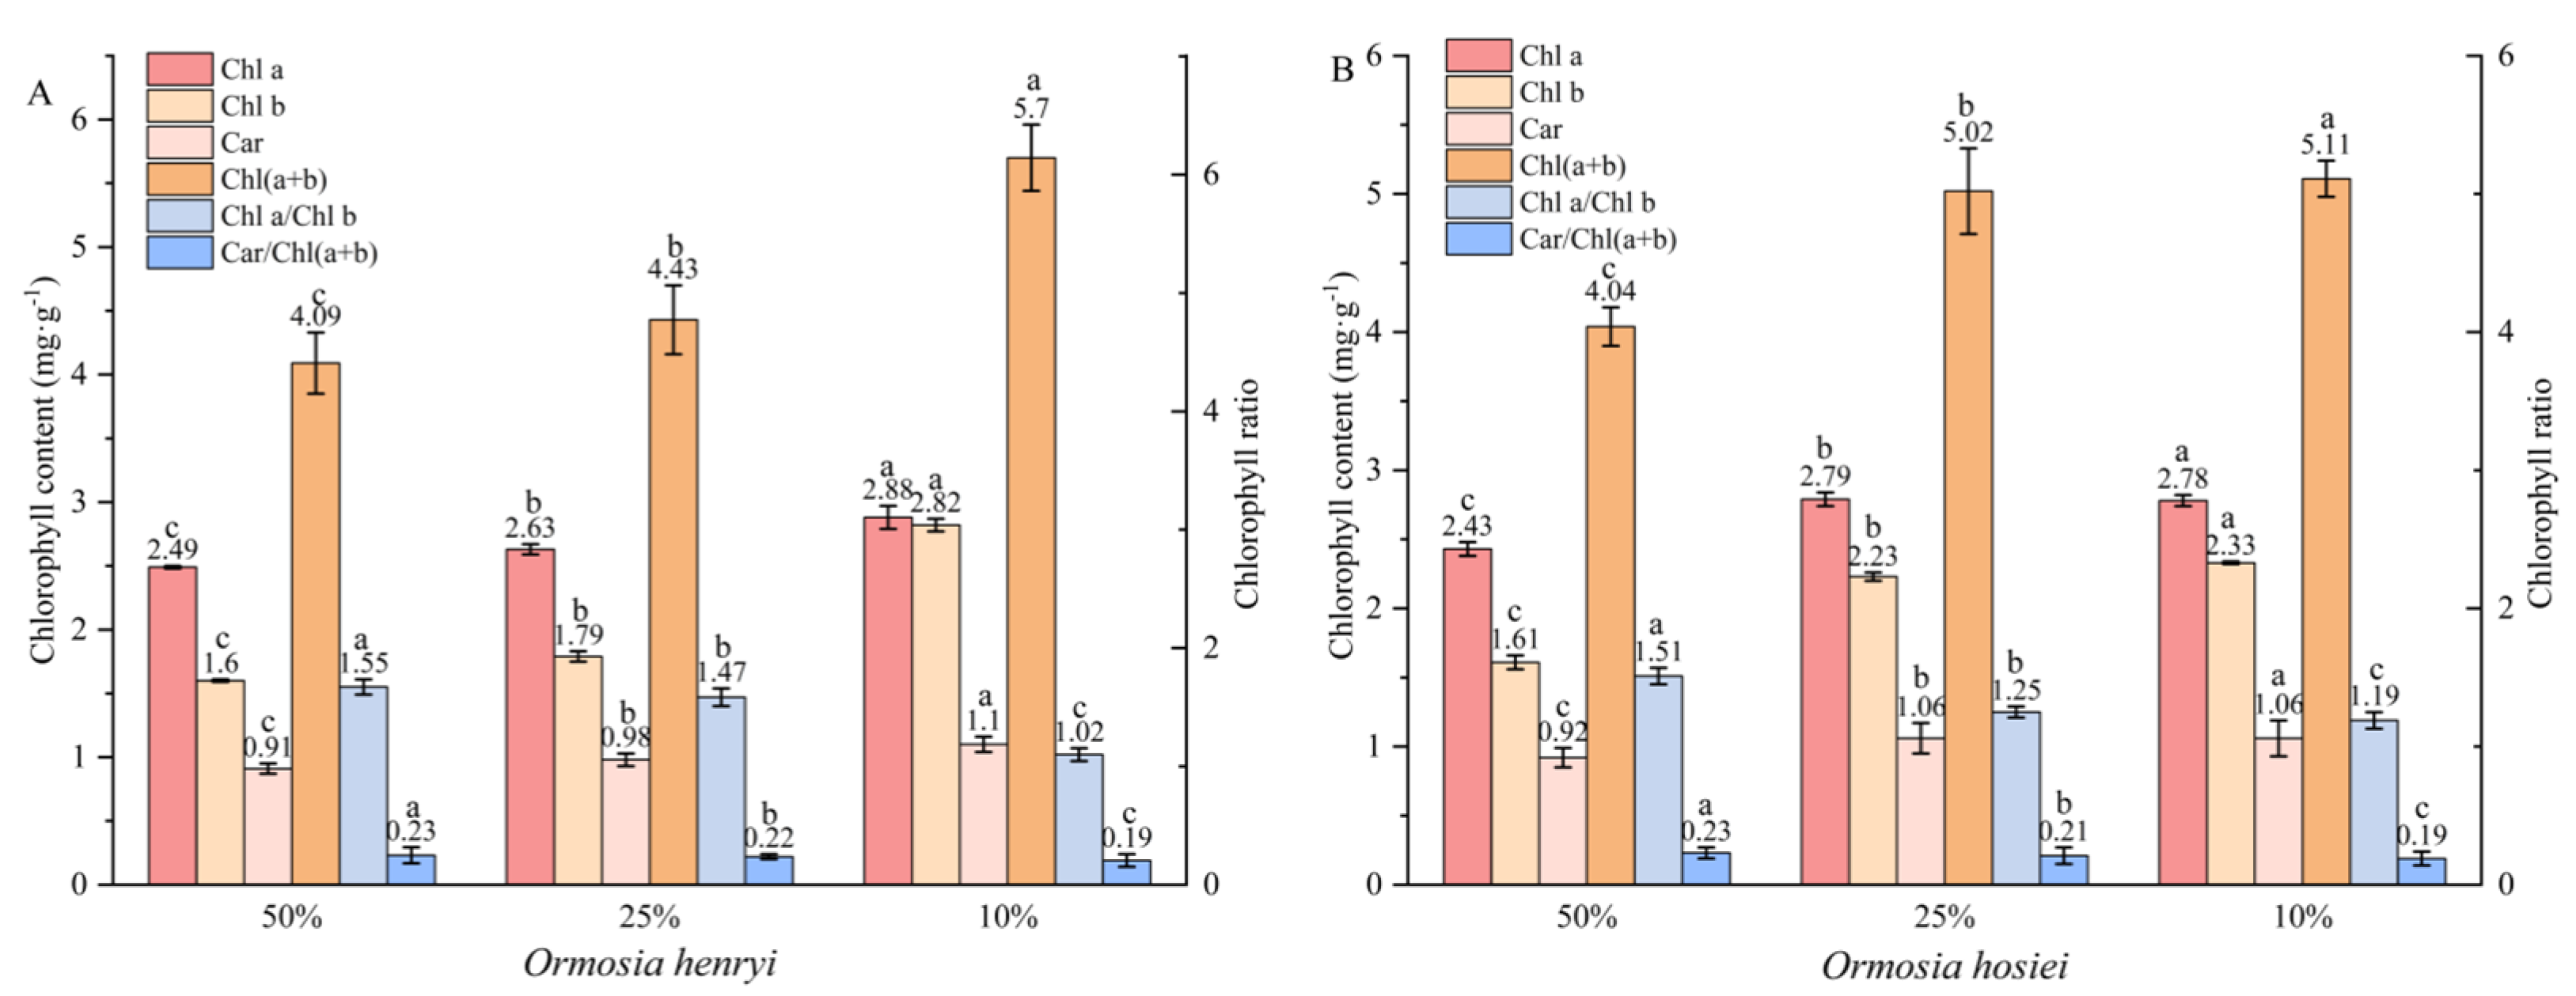
As shown in Figure 10, different light intensities had a significant effect on the photosynthetic pigment content of the two Ormosia species. With decreasing light intensity, chlorophyll a (Chl a), chlorophyll b (Chl b), and total chlorophyll content [Chl (a + b)] of both species showed a significant increasing trend. In O. hosiei, total chlorophyll increased from 4.04 ± 0.24 mg·g−1 FW under 50% light to 5.11 ± 0.13 mg·g−1 FW under 10% light, while in O. henryi, it rose from 4.09 mg·g−1 FW to 5.70 mg·g−1 FW over the same light gradient. Compared with Chl a, the increase in Chl b was more pronounced, resulting in a significant decrease in the Chl a/Chl b ratio under lower light conditions for both species.
Carotenoid (Car) content increased slightly under low light, but the Car/Chl (a + b) ratio decreased as light intensity declined, indicating that under weak light, the plants relatively reduced photoprotective pigments and prioritized enhancing light capture and utilization rather than defending against excess light. Overall, both Ormosia species showed a strong response to changes in light intensity, reflecting substantial adaptive capacity.

3.5. Plasticity Indices Under Different Light Conditions

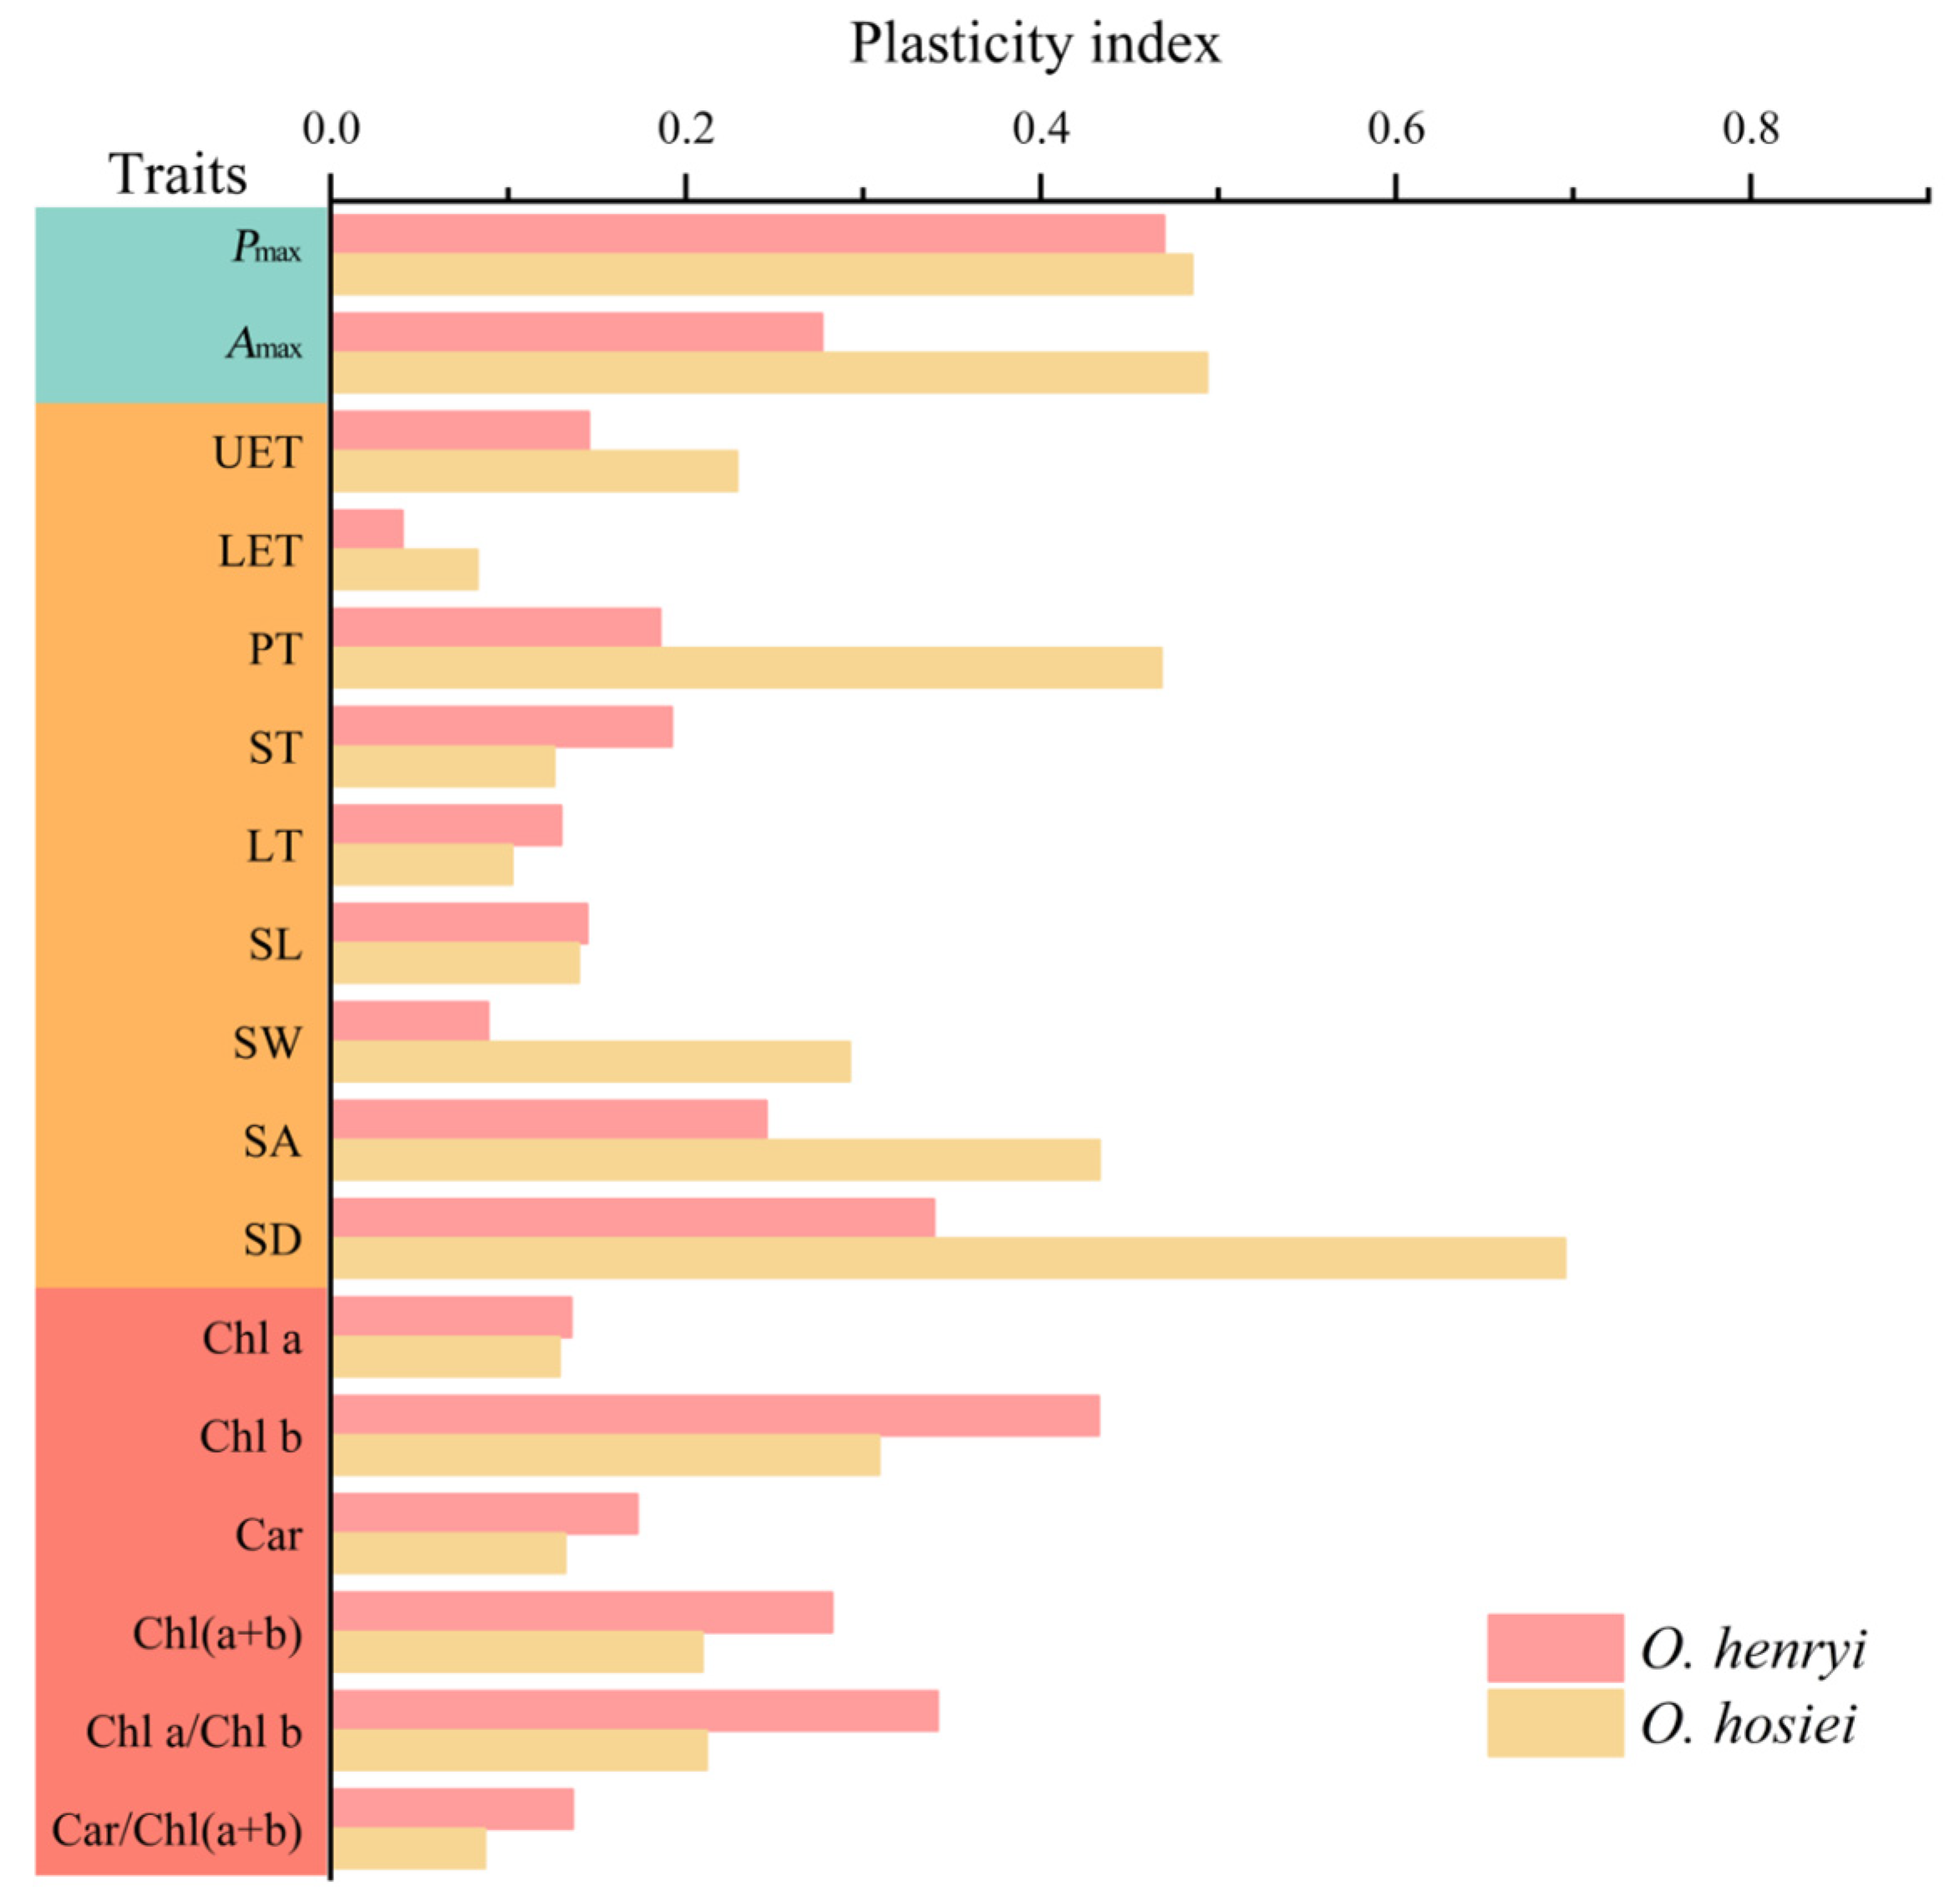
As shown in Figure 11, among the photosynthetic parameters of the two Ormosia species, their Pmax plasticity was similar, but the Amax plasticity of O. hosiei was higher than that of O. henryi, indicating that O. hosiei had greater photosynthetic adaptability. Among the microscopic leaf structural traits, most plasticity indices of both species were below 0.3, except for PT, SA, and SD of O. hosiei, which were above 0.4. This suggests that O. henryi exhibited relatively smaller variations in leaf structure, showing a more stable anatomical structure, while O. hosiei adapted to light changes mainly by adjusting structural traits such as stomatal density and tissue thickness. Notably, the SD index of O. hosiei exceeded 0.6, indicating that its stomatal density showed particularly high plasticity.
Regarding chlorophyll content, both O. henryi and O. hosiei exhibited moderate plasticity, with only the Chl b plasticity index of O. henryi exceeding 0.4. Overall, the two species showed similar levels of integrated plasticity, with comprehensive plasticity indices of 0.35 for O. henryi and 0.39 for O. hosiei.

3.6. Correlation Analysis of Functional Traits in Ormosia Species

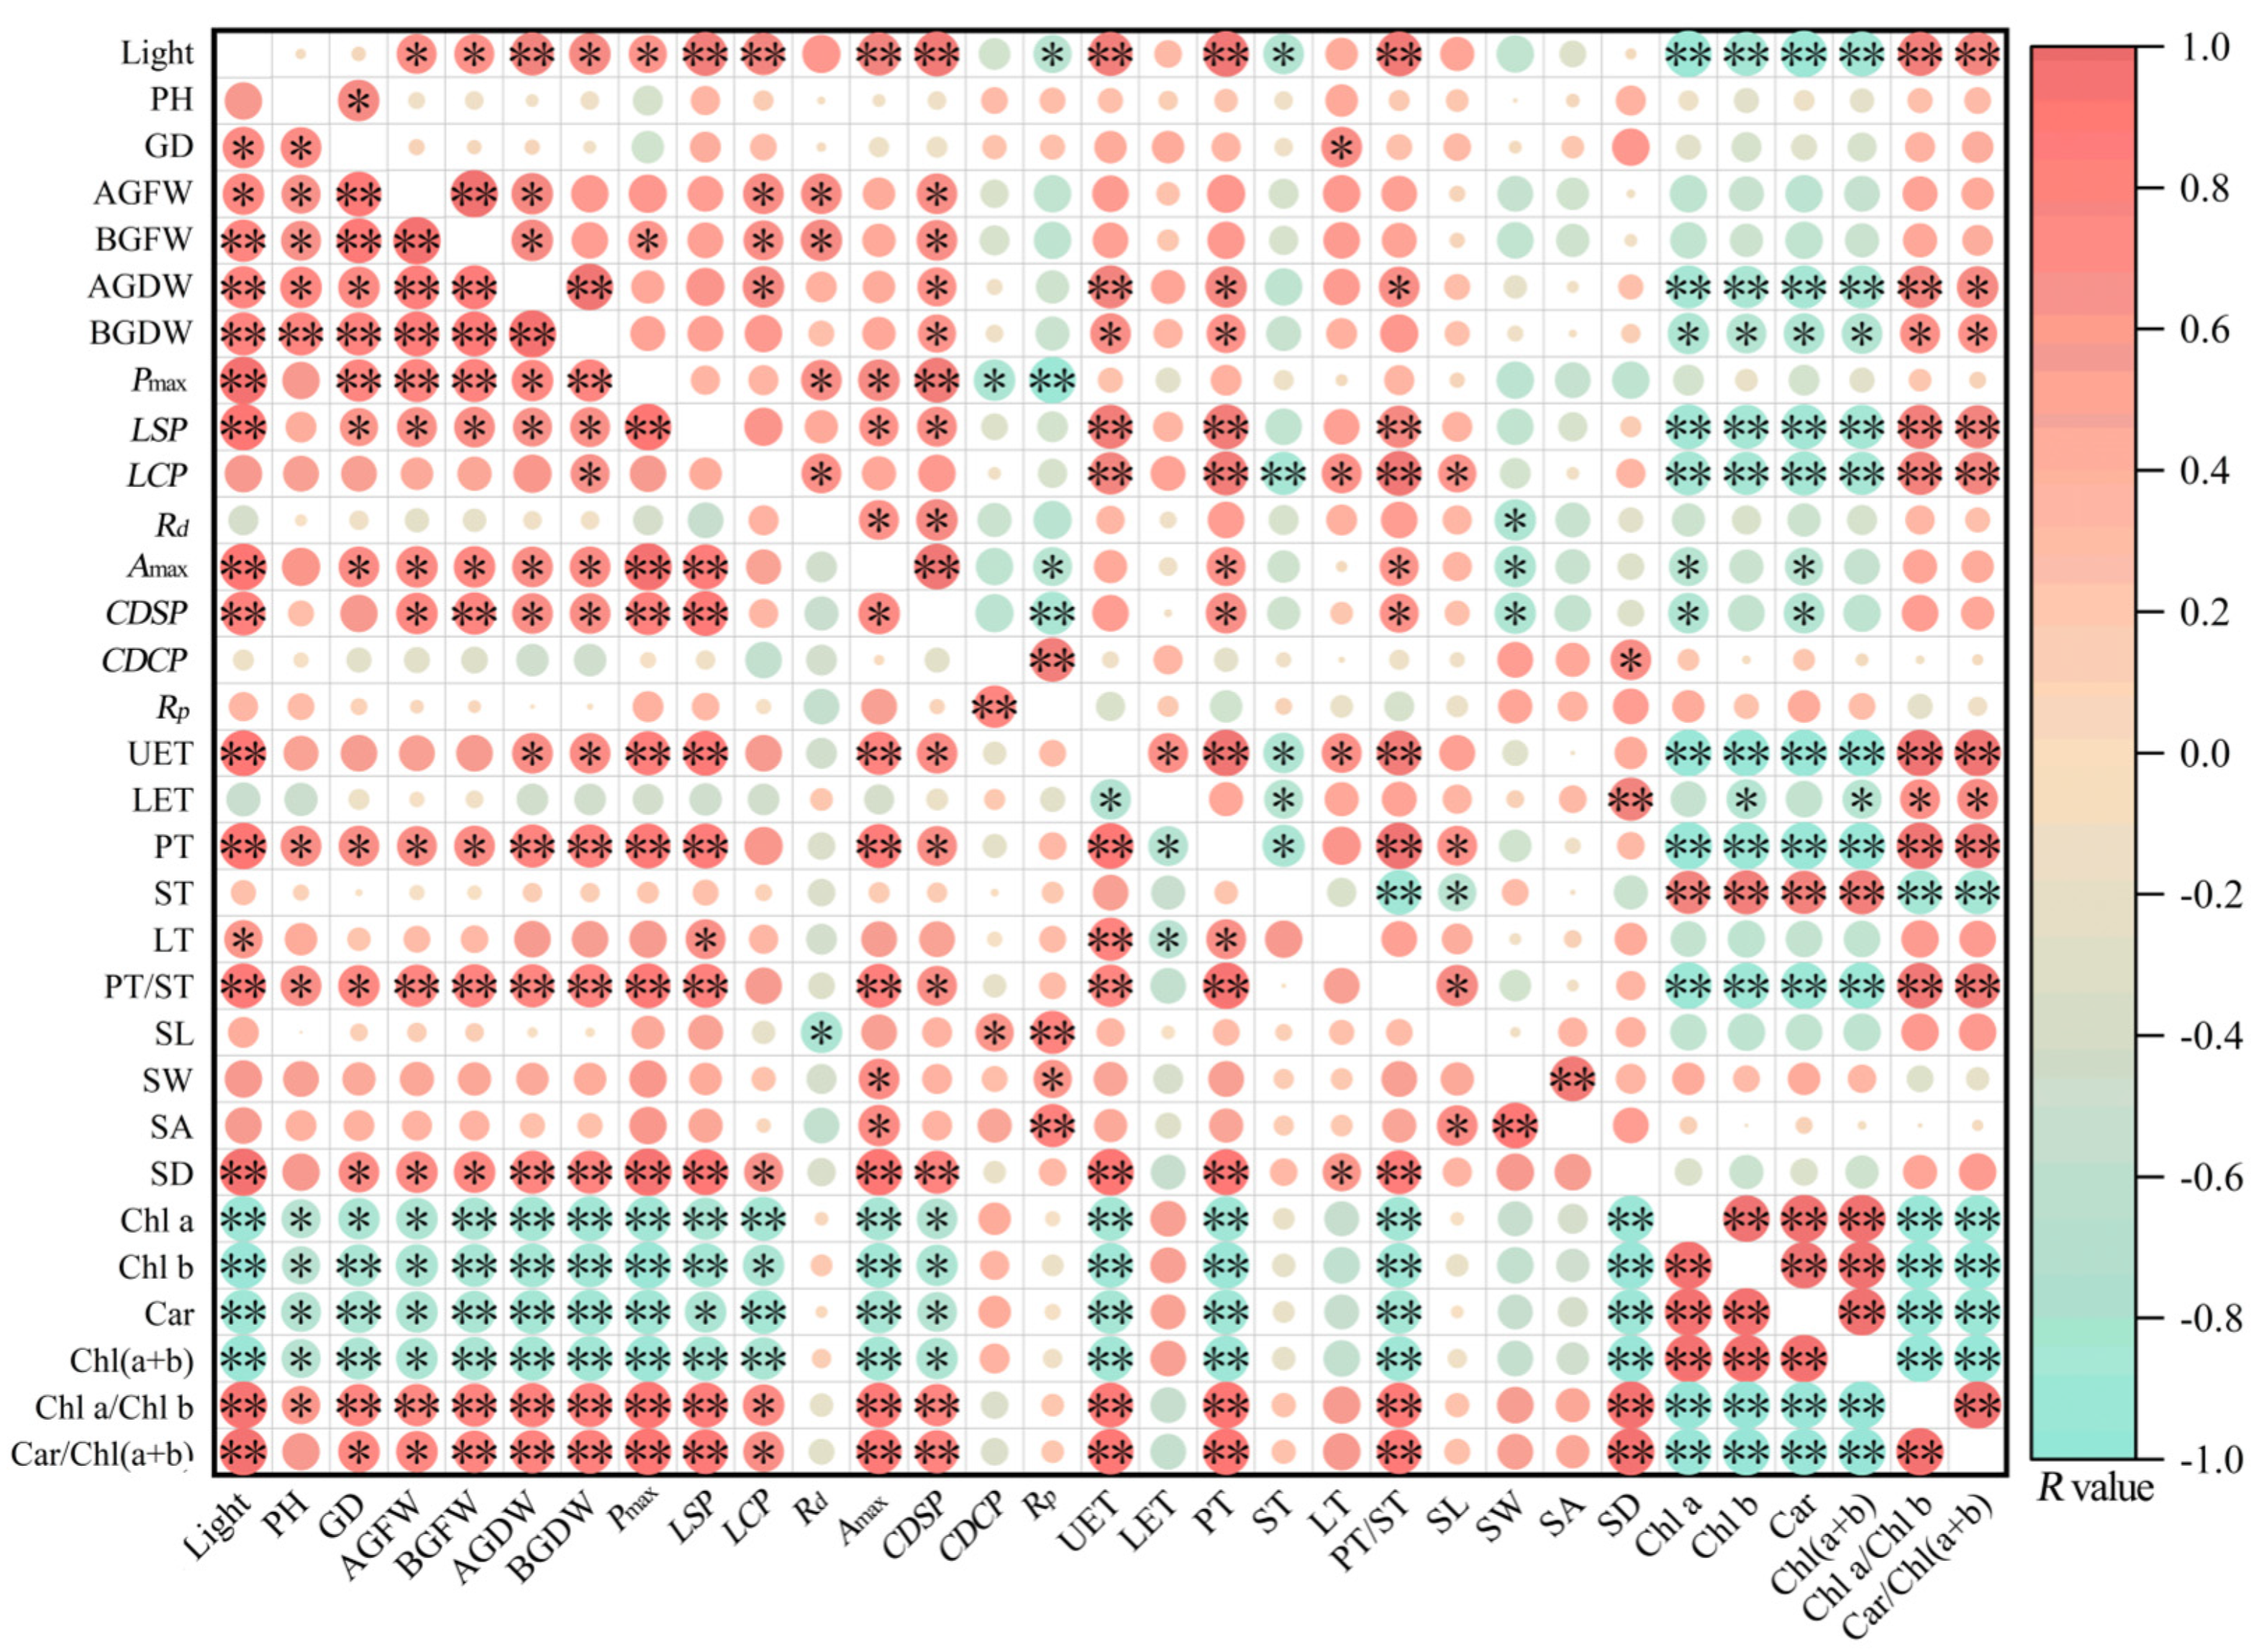
Correlation analyses of various physiological parameters were performed separately for the two Ormosia species using SPSS 27, and the relationships among the parameters were evaluated using Pearson’s correlation. As shown in Figure 12, under different light conditions, light intensity (Light) showed a significant positive correlation (p < 0.05) with both aboveground and belowground fresh and dry weights (AGFW, BGFW, AGDW, BGDW), indicating that biomass accumulation in Ormosia species increased significantly with enhanced light intensity.
Light intensity was also significantly positively correlated (p < 0.05) with photosynthetic parameters such as Pmax, Amax, LSP, and CDSP, suggesting that stronger light promoted higher maximum photosynthetic rates and photosynthetic capacity. Meanwhile, light intensity exhibited a significant positive correlation (p < 0.01) with leaf microscopic structural parameters, including upper epidermal thickness (UET) and palisade tissue thickness (PT), indicating that light had a marked effect on leaf anatomical structure.
Regarding photosynthetic pigments, light intensity showed a significant negative correlation (p < 0.01) with chlorophyll contents (Chl a, Chl b, Car, and Chl (a + b)), but a significant positive correlation (p < 0.01) with the ratios Chl a/Chl b and Car/Chl (a + b). This result indicates that light conditions can regulate the chlorophyll pigment composition of plants.

4. Discussion

4.1. Responses of Chlorophyll to Different Light Conditions

In this study, the contents of Chl a, Chl b, Car, and Chl (a + b) in both Ormosia species increased with decreasing light intensity, indicating that they enhance their ability to absorb and utilize light energy in low-light environments through pigment accumulation. This pattern was consistent with the correlation analysis results and has also been observed in many other plant species [33,34]. Previous studies have shown that plants can expand their light absorption spectrum, improve light quantum capture capacity, and maintain stable photosynthesis under low-light conditions by increasing chlorophyll and carotenoid contents [35]. In addition, the Chl a/Chl b ratio is closely related to the composition of light-harvesting complexes (LHC) in the photosynthetic system and can influence the chloroplast’s ability to reduce 2,6-dichlorophenolindophenol (DCPIP), thereby affecting photosystem II (PSII) electron transport efficiency and net photosynthetic rate [36]. Generally, a lower Chl a/Chl b ratio indicates a higher proportion of LHCs in chloroplasts and greater light-harvesting capacity per unit leaf area, which is considered an important physiological trait associated with shade tolerance [37].
Our results showed that the Chl a/Chl b ratios of both O. henryi and O. hosiei under low light were significantly lower than those under 50% light, consistent with the findings of Dziwulska-Hunek et al. [38] on four leguminous species grown under different light intensities. Plasticity indices further revealed that Chl b exhibited much higher plasticity than Chl a, suggesting that both Ormosia species can increase the relative proportion of Chl b under long-term low light to reduce the Chl a/Chl b ratio, thereby broadening the light absorption range and improving energy transfer efficiency to enhance shade adaptation. Moreover, O. henryi showed higher Chl b plasticity than O. hosiei.

4.2. Responses of Photosynthetic Traits to Different Light Conditions

Light is an essential environmental factor for photosynthesis, and light intensity greatly influences plant photosynthetic activity [22]. Excessively strong or weak light often adversely affects plant growth [39]. Studies have shown that under full sunlight or low light, the net photosynthetic rate of Michelia macclurei and four species of Ocimum decreased [40,41]. In this study, the photosynthetic rate of both O. henryi and O. hosiei decreased with declining light intensity (except under 100% light). Under 50% light, both species exhibited the highest Pmax and Amax, indicating that Ormosia seedlings require moderate light conditions for optimal photosynthesis. Specifically, under 50% light, O. henryi showed higher Pmax and Amax than O. hosiei, suggesting that O. henryi has a stronger photosynthetic capacity. Additionally, under all three light conditions, Pmax was lower than Amax in both species, indicating that even under low light, CO2 concentration remains a limiting factor for photosynthetic rate in Ormosia species.
In addition to changes in photosynthetic rate, light saturation point (LSP) and CO2 saturation point (CDSP) reflect a plant’s capacity to utilize high light and CO2 [42,43]. In this study, we found that both LSP and CDSP of O. henryi and O. hosiei decreased to varying degrees with declining light intensity. Under 50% light, LSP and CDSP reached their maximum values for both species, whereas under 10% light, these two photosynthetic parameters decreased by 34.74–45.39%. This pattern is similar to that observed in Acer catalpifolium [44], where plants grown under long-term low-light conditions show reduced LSP and CDSP, limiting their ability to utilize light and CO2.
Under low light, the energy available to leaves is insufficient to sustain high rates of photochemical reactions, resulting in impaired electron transport and decreased Rubisco activity, which in turn reduces LSP and CDSP [45]. These findings are also supported by plasticity indices and correlation analyses, indicating that photosynthetic traits in O. henryi and O. hosiei are highly adaptable. Moreover, Pmax, Amax, LSP, and CDSP were all significantly positively correlated with light intensity (p < 0.01).

4.3. Responses of Leaf Microscopic Structure to Different Light Conditions

The differentiation of palisade (PT) and spongy (ST) tissues in leaves directly reflects a plant’s adaptation to the light environment. Generally, higher palisade tissue thickness (PT) and palisade-to-spongy tissue ratio (PT/ST) are associated with greater photosynthetic efficiency [46]. In this study, leaf thickness (UET) and palisade tissue thickness (PT) of both O. henryi and O. hosiei decreased with declining light intensity, indicating that leaf structure is significantly influenced by light conditions. This trend of decreasing leaf and palisade tissue thickness under lower light is consistent with the findings of Wu et al. [47] in three soybean varieties. Furthermore, the palisade-to-spongy tissue ratio (PT/ST) differed significantly between O. henryi and O. hosiei. In O. henryi, the ratio ranged from 1.16 to 2.1, whereas in O. hosiei it ranged from 0.31 to 0.52, indicating that O. henryi has a much higher proportion of palisade tissue. A higher proportion of palisade tissue promotes photosynthetic rate, and correlation analysis confirmed that PT was significantly positively correlated with Pmax and Amax (p < 0.01), consistent with the above results. The two species exhibited different strategies in responding to varying light conditions, as reflected in their plasticity indices. The plasticity index of palisade tissue in O. hosiei was much higher than in O. henryi, whereas O. henryi had slightly higher plasticity in spongy tissue. For leaf thickness, O. hosiei showed greater plasticity than O. henryi, which may be related to their inherent differences in leaf thickness.
Stomata serve as channels for water and gas exchange between plants and the external environment, functioning as key regulators of water-use efficiency [48]. Numerous studies have shown that stomatal development is often regulated by light [49], and stomatal density is significantly affected by light intensity. In this study, except for stomatal density (SD), other stomatal traits of the two Ormosia species did not show significant changes under different light conditions. However, stomatal density decreased as light intensity declined, consistent with previous findings [50,51], indicating that Ormosia species adjust stomatal density in response to light availability to adapt to varying light environments. Moreover, O. hosiei exhibited much higher stomatal density plasticity than O. henryi, suggesting a greater capacity for regulating gas exchange under different light conditions. Nevertheless, its photosynthetic rate was lower than that of O. henryi, implying that higher stomatal plasticity does not necessarily translate into higher photosynthetic efficiency, possibly due to differences in light utilization strategies or leaf structural characteristics.

4.4. Response of Growth Index to Different Light Conditions

Plant height (PH) and stem diameter (GD) are important indicators that directly reflect plant growth, and varying light conditions have significant effects on these traits [52]. Studies have shown that changes in light intensity lead to significant differences in plant height and stem diameter in soybean (Glycine max) [53], Acer mono, and Acer pseudosieboldianum [15]. In addition, light intensity significantly affects the root-to-shoot ratio (RT/ST) and dry matter accumulation [54]; moderate light promotes dry matter accumulation, whereas excessive light can inhibit growth [55]. In this study, seedlings of both Ormosia species showed severe leaf burn and gradual death under 100% light. Under 50% light, the growth and dry matter accumulation of both species reached the highest levels, and these traits decreased progressively as light intensity declined. This indicates that Ormosia seedlings require moderate light at the early growth stage, as both excessively high and low light inhibit growth. These findings are consistent with Zhang et al. [56], who reported that biomass accumulation of Quercus mongolica peaks under moderate shading.
Our results also showed that under the same light conditions, O. hosiei exhibited a higher growth rate in plant height than O. henryi, while the stem diameter growth rate was similar between the two species. In other words, O. hosiei has a stronger advantage in vertical growth, allowing it to surpass neighboring plants. Through rapid stem elongation, O. hosiei can effectively occupy the upper canopy and gain a competitive advantage for light acquisition [57,58].
The ratio of aboveground to belowground biomass is an important indicator for studying plant biomass allocation [54], serving as a key mechanism for plants to optimize limited resources in the environment and succeed in competition [59]. It also reflects how plants respond to resource limitations [60]. In this study, both aboveground and belowground fresh and dry biomass of the two Ormosia species decreased with declining light intensity, indicating that insufficient light limited photosynthesis and consequently reduced carbon accumulation in both shoot and root systems. Under 50% and 10% light conditions, O. hosiei exhibited higher root-to-shoot ratios (RT/ST) than O. henryi, whereas at 25% light, O. henryi had a higher RT/ST. Specifically, the root-to-shoot ratio of O. henryi peaked at 25% light, while that of O. hosiei was highest at 10% light, suggesting that as light intensity decreases, Ormosia species allocate relatively more biomass to shoots. This concept is also referred to in the literature as the “balanced growth hypothesis” [61]. Based on correlation analysis, the biomass accumulation indices of O. hosie and O. henryi were significantly positively correlated with light intensity (p < 0.05), indicating that light is one of the main factors affecting biomass accumulation in these species.

5. Conclusions

The results showed that: (1) Both species exhibited significant variations in functional traits across light treatments. Growth traits demonstrated high plasticity, while photosynthetic characteristics and leaf structural parameters reached optimal values under 50% light intensity. As light intensity decreased, photosynthetic capacity, leaf thickness, palisade tissue thickness, and the Chl a/Chl b ratio declined, whereas the contents of Chl a, Chl b, Car, and Chl (a + b) increased. (2) Overall, the phenotypic plasticity of O. hosiei and O. henryi was similar, but differences were observed in palisade tissue thickness (PT), stomatal density (SD), and Chl b plasticity, indicating species-specific adaptive strategies in response to environmental changes. (3) Significant correlations were found among most functional traits, suggesting that coordinated adjustments among these traits contribute to the adaptive responses of Ormosia seedlings to changing light conditions. (4) During the seedling propagation of Ormosia species, it is advisable to maintain approximately 50% shading, avoiding both direct sunlight and excessive shading. Prior to transplanting, light intensity should be gradually increased to help the seedlings acclimate to natural outdoor conditions. For wild populations, moderately “opening windows” in the upper canopy to increase understory light availability can promote the growth and development of Ormosia seedlings.
Overall, this study reveals the functional trait variation and adaptive mechanisms of Ormosia seedlings under different light conditions, providing a theoretical basis for understory light management and large-scale seedling propagation, and offering a reference for further investigation of the light ecology strategies and shade tolerance mechanisms of Ormosia species.

Author Contributions

Conceptualization, G.H.: writing—review and editing, conceptualization, investigation, project administration. H.J.: writing—original draft, investigation, formal analysis. J.T.: data collection and processing. X.W.: investigation, methodology. X.L.: data curation, formal analysis. L.L.: investigation, formal analysis. S.F.: investigation. R.Z.: validation, visualization. All authors have read and agreed to the published version of the manuscript.

Funding

This work was supported by the National Natural Science Foundation of China (No. 32560330); the Natural Science Foundation of Guangxi (Nos. 2024GXNSFAA010452 and 2023GXNSFAA026253); the Independent Project of the Guangxi Key Laboratory of Functional Phytochemicals Research and Sustainable Utilization (Nos. ZRJJ2024-3 and ZRJJ2024-11); the Hechi Science and Technology Base and Talent Project (HeKe AC231113); the Scientific Research Fund of Guangxi Institute of Botany (No. GXYE25009); and the Guilin Science and Technology Application and Promotion Program (Nos. 20220134-3 and 20230102-3).

Data Availability Statement

Data will be made available on request.

Conflicts of Interest

The authors declare no conflicts of interest.

References

  1. Wu, Z.Y.; Raven, P.H.; Hong, D.Y. Flora of China: Vol.10; Science Press: Beijing, China, 2010; pp. 73–85. [Google Scholar]
  2. Liu, D.; Liu, D.D.; Ma, L.; Yun, X.L.; Xiang, Y.; Nie, P.; Zeng, G.R.; Guo, J.S. Ormosia henryi prain leaf extract alleviates cognitive impairment in chronic unpredictable mild stress mice. Prog. Biochem. Biophys. 2020, 47, 768–779. [Google Scholar]
  3. Zhang, L.J.; Zhou, W.J.; Ni, L.; Huang, M.Q.; Zhang, X.Q.; Xu, H.Y. A review on chemical constituents and pharmacological activities of Ormosia. Chin. Herb. Med. 2021, 52, 4433–4442. [Google Scholar] [CrossRef]
  4. Yao, J.; Yang, B. Excellent landscape tree species—Livistona chinensis. China Urban For. 2007, 1, 65. [Google Scholar]
  5. Wei, X.; He, G.H.; Tang, J.M.; Feng, S.; Li, X.; Lu, L.; Cai, X.R. Advances in Conservation Biology of Endangered Ormosia Specie. Guangxi Sci. 2025, 32, 226–235. [Google Scholar] [CrossRef]
  6. Tang, J.M.; Wei, X.; Chai, S.F.; Zou, R.; Ding, T.; Wu, L.F.; Deng, L.L. Key National Protected Wild Plants in Guangxi; China Forestry Press: Beijing, China, 2023; pp. 340–375. [Google Scholar]
  7. Duan, R.Y.; Wei, X.L.; An, C.R.; Zhang, L. Physiological response of Ormosia henryi seedlings with inoculating different rhizobium strains to moderate drought stress. For. Sci. Res. 2018, 31, 61–69. [Google Scholar] [CrossRef]
  8. Jia, Q.Q.; Deng, H.Y.; Mo, X.Y.; Liu, L.T. Growth rhythms of three Ormosia species seedlings of different provenances. Rev. Árvore 2019, 43, e430606. [Google Scholar] [CrossRef]
  9. Zhou, C.C.; Xia, S.Q.; Wen, Q.; Song, Y.; Jia, Q.; Wang, T.; Liu, L.; Ouyang, T. Genetic structure of an endangered species Ormosia henryi in southern China and implications for conservation. BMC Plant Biol. 2023, 23, 220. [Google Scholar] [CrossRef]
  10. Liu, H.S.; Su, Z.H.; Yu, S.Q.; Liu, J.; Yin, X.; Zhang, G.; Liu, W.; Li, B. Genome comparison reveals mutation hotspots in the chloroplast genome and phylogenetic relationships of Ormosia species. BioMed Res. Int. 2019, 2019, 7265030. [Google Scholar] [CrossRef]
  11. Lu, Y.; Zhu, S.; He, Y.; Peng, C.; Wang, Z.; Tang, Q. Phytochemical profile and antidepressant effect of Ormosia henryi Prain leaf ethanol extract. Int. J. Mol. Sci. 2019, 20, 3396. [Google Scholar] [CrossRef]
  12. Zhai, D.C.; Fang, Z.; Wang, Y.; Zhang, M.L.; Hu, Z.H.; Li, Q.; Bai, X.H. Chemical constituents of the seed of Ormosia hosiei and its antioxidant and antimicrobial activity. Nat. Prod. Res. Dev. 2019, 31, 946–951. [Google Scholar] [CrossRef]
  13. Li, X.S. Seed sowing, nursery, and density experiments of Livistona chinensis under different storage methods. For. Surv. Des. 2018, 38, 36–38. [Google Scholar]
  14. Gui, P.; Wei, X.L.; Qiao, D.; Wu, G.Y. Establishment of plantlet regeneration system of tissue Culture of Ormosia henryi. Seed 2018, 37, 135–139. [Google Scholar] [CrossRef]
  15. Zhang, J.F.; Ge, J.R.; Dayananda, B.; Li, J.Q. Effect of light intensities on the photosynthesis, growth and physiological performances of two maple species. Front. Plant Sci. 2022, 13, 999026. [Google Scholar] [CrossRef] [PubMed]
  16. He, D.; Li, H.; Zhou, P.; Guo, J.; Yuan, J.; Wang, J.; Liu, Y.; Zhang, Z.; Lei, Y. Leaf plasticity responses of four urban garden plants to low-light environments under viaducts. Forests 2025, 16, 651. [Google Scholar] [CrossRef]
  17. Yadav, A.; Singh, D.; Lingwan, M.; Yadukrishnan, P.; Masakapalli, S.K.; Datta, S. Light signaling and UV-B-mediated plant growth regulation. J. Integr. Plant Biol. 2020, 62, 1270–1292. [Google Scholar] [CrossRef]
  18. Wei, Y.; Wang, S.; Yu, D. The role of light quality in regulating early seedling development. Plants 2023, 12, 2746. [Google Scholar] [CrossRef]
  19. Wu, W.; Chen, L.; Liang, R.; Huang, S.; Li, X.; Huang, B.; Luo, H.; Zhang, M.; Wang, X.; Zhu, H. The role of light in regulating plant growth, development and sugar metabolism: A review. Front. Plant Sci. 2025, 15, 1507628. [Google Scholar] [CrossRef]
  20. Chen, C.-I.; Lin, K.-H.; Lin, T.-C.; Huang, M.-Y.; Chen, Y.-C.; Huang, C.-C.; Wang, C.-W. Responses of photosynthesis and chlorophyll fluorescence during light induction in different seedling ages of Mahonia oiwakensis. Bot. Stud. 2023, 64, 5. [Google Scholar] [CrossRef]
  21. Lu, D.; Xu, B.; Yu, Q.; Liu, Z.; Ren, M.; Wang, Y.; Zhang, S.; Wu, C.; Shen, Y. Identification of potential light deficiency response regulators in endangered species Magnolia sinostellata. Sci. Rep. 2022, 12, 22536. [Google Scholar] [CrossRef]
  22. Hu, Y.; Javed, H.H.; Liu, L.; Liu, Y.; Yang, X.; Xu, F.; Liu, Y.; Peng, X.; Wu, Y. Impact of low light on photosynthetic characteristics, antioxidant activity, and yield of Brassica napus L. Agronomy 2025, 15, 214. [Google Scholar] [CrossRef]
  23. Arsovski, A.A.; Galstyan, A.; Guseman, J.M.; Nemhauser, J.L. Photomorphogenesis. Arab. Book 2012, 10, e0147. [Google Scholar] [CrossRef] [PubMed]
  24. Li, J.; Zhou, Z.Y.; Chen, Y.; Yang, Q.S.; Busso, C.A. The spatial-temporal heterogeneity of understory light availability in a temperate forest of North China. Phyton-Int. J. Exp. Bot. 2021, 90, 1633–1644. [Google Scholar] [CrossRef]
  25. Rosam, J.R.; Warman, L.; Ostertag, R.; Perroy, R.; Cordell, S. Light quality and spatial variability influences on seedling regeneration in Hawaiian lowland wet forests. J. Appl. Ecol. 2024, 61, 2638–2652. [Google Scholar] [CrossRef]
  26. Méndez-Dewar, G.; González-Espinosa, M.; Equihua, M. From seedling to sapling: Tree species responses to spatial and temporal understory light heterogeneity in disturbed tropical montane forests. Bot. Sci. 2015, 93, 719–729. [Google Scholar] [CrossRef]
  27. Modolo, G.S.; dos Santos, V.A.H.F.; Ferreira, M.J. Testing for functional significance of traits: Effect of the light environment in tropical tree saplings. Ecol. Evol. 2021, 11, 6480–6492. [Google Scholar] [CrossRef]
  28. Ye, Z.P. A review on modeling of responses of photosynthesis to light and CO2. Acta Ecol. Sin. 2010, 34, 727–740. [Google Scholar]
  29. Pan, L.P.; Tang, J.M.; Jiang, H.D.; Zou, R.; Chai, S.F.; Wei, X. Comparison of photosynthesis and structure of Leaves between Manglietia aromatica seedlings and adult plants. Mol. Plant Breed. 2023, 1–11. [Google Scholar]
  30. Li, Z.L. Plant Sectioning Techniques, 2nd ed.; Science Press: Beijing, China, 1987. [Google Scholar]
  31. Li, H.S. Principles and Techniques of Plant Physiology and Biochemistry Experiments; Higher Education Press: Beijing, China, 2000; pp. 134–137. [Google Scholar]
  32. Valladares, F.; Wright, S.J.; Lasso, E.; Kitajima, K.; Pearcy, R.W. Plastic phenotypic response to light of 16 congeneric shrubs from a Panamanian rainforest. Ecology 2000, 81, 1925–1936. [Google Scholar] [CrossRef]
  33. Ma, Z.; Li, S.; Zhang, M.; Jiang, S.; Xiao, Y. Light intensity affects growth, photosynthetic capability, and total flavonoid accumulation of Anoectochilus plants. HortScience 2010, 45, 863–867. [Google Scholar] [CrossRef]
  34. Kong, D.X.; Li, Y.Q.; Wang, M.L.; Bai, M.; Zou, R.; Tang, H.; Wu, H. Effects of light intensity on leaf photosynthetic characteristics, chloroplast structure, and alkaloid content of Mahonia bodinieri (Gagnep.) Laferr. Acta Physiol. Plant 2016, 38, 120. [Google Scholar] [CrossRef]
  35. Nishimura, M.; Sakurai, H.; Takamiya, A. Wavelength dependency of the inhibition of Hill reaction and the analysis of the process by flashing light. Biochim. Biophys. Acta 1964, 79, 241–248. [Google Scholar] [CrossRef]
  36. Qiu, N.W.; Jiang, D.C.; Wang, X.S.; Wang, B.S.; Zhou, F. Advances in the members and biosynthesis of chlorophyll family. Photosynthetica 2019, 57, 974–984. [Google Scholar] [CrossRef]
  37. Hazrati, S.; Tahmasebi-Sarvestani, Z.; Modarres-Sanavy, S.A.M.; Mokhtassi-Bidgoli, A.; Nicola, S. Effects of water stress and light intensity on chlorophyll fluorescence parameters and pigments of Aloe vera L. Plant Physiol. Biochem. 2016, 106, 141–148. [Google Scholar] [CrossRef]
  38. Dziwulska-Hunek, A.; Myśliwa-Kurdziel, B.; Matwijczuk, A.; Szymanek, M. A case study in photosynthetic parameters of perennial plants growing in natural conditions. BMC Plant Biol. 2025, 25, 1044. [Google Scholar] [CrossRef] [PubMed]
  39. Wu, L.M.; Zhang, W.J.; Ding, Y.F.; Zhang, J.W.; Cambula, E.D.; Weng, F.; Liu, Z.H.; Ding, C.Q.; Tang, S.; Chen, L.; et al. Shading contributes to the reduction of stem mechanical strength by decreasing cell wall synthesis in Japonica rice (Oryza sativa L.). Front. Plant Sci. 2017, 8, 881. [Google Scholar] [CrossRef]
  40. Wei, Z.M.; Qin, D.W.; Wu, M.; Qin, W.M. Effects of different light intensities on growth and physiological traits of Neolitsea aurata seedlings. West China For. Sci. 2018, 47, 48–53. [Google Scholar] [CrossRef]
  41. Yang, W.; Zhang, J.; He, W.K.; Zhou, X. Effects of different light intensities on chlorophyll fluorescence and photosynthetic physiology of four Ocimum species. Henan Agric. Sci. 2025, 54, 113–123. [Google Scholar] [CrossRef]
  42. Zhou, J.; Li, P.; Wang, J. Effects of light intensity and temperature on photosynthesis characteristics and yield of lettuce. Horticulturae 2022, 8, 178. [Google Scholar] [CrossRef]
  43. Li, Y.H.; Zhang, K.M.; Yu, H.F. Photosynthetic characteristics of ten cultivars of autumn chrysanthemum (Dendranthema morifolium) and correlation analysis between net photosynthetic rate and some physio-ecological factors. J. Plant Resour. Environ. 2012, 21, 70–76. [Google Scholar]
  44. Lyu, C.Y.; Liu, Y.H. Provenance difference in growth traits and photosynthetic characteristics of Acer catalpifolium seedlings under different shading conditions. Ying Yong Sheng Tai Xue Bao 2018, 29, 2307–2314. [Google Scholar] [CrossRef]
  45. Taylor, S.H.; Gonzalez-Escobar, E.; Page, R.; Parry, M.A.J.; Long, S.P.; Carmo-Silva, E. Faster than expected Rubisco deactivation in shade reduces cowpea photosynthetic potential in variable light conditions. Nat. Plants 2022, 8, 118–124. [Google Scholar] [CrossRef] [PubMed]
  46. Dong, M.Y.; Wang, J.X.; Wu, M.; Zou, Z.Y.; Cheng, S.; Li, Y.H. Leaf structure and photosynthetic characteristics of two species of Hesperis. Grassl. Sci. 2022, 31, 172–184. [Google Scholar] [CrossRef]
  47. Wu, Y.; Gong, W.; Wang, Y.; Yong, T.; Yang, F.; Liu, W.; Wu, X.; Du, J.; Shu, K.; Liu, J.; et al. Leaf area and photosynthesis of newly emerged trifoliolate leaves are regulated by mature leaves in soybean. J. Plant Res. 2018, 131, 671–680. [Google Scholar] [CrossRef] [PubMed]
  48. Li, J.L.; Luan, X.Y.; Tang, Z.H.; Han, A.Z.; Guo, L. Evaluation of drought resistance of apricot germplasm resources based on leaf microstructure. Acta Hortic. Sin. 2025, 52, 2300–2316. [Google Scholar] [CrossRef]
  49. Wei, H.; Kong, D.; Yang, J.; Wang, H. Drought resistance evaluation of apricot germplasm resources based on leaf microstructure. Plant Commun. 2020, 1, 100030. [Google Scholar] [CrossRef]
  50. Gay, A.P.; Hurd, R.G. The influence of light on stomatal density in tomato. New Phytol. 1975, 75, 37–46. [Google Scholar] [CrossRef]
  51. Lake, J.A.; Quick, W.P.; Beerling, D.J.; Woodward, F.I. Signals from mature to new leaves. Nature 2001, 411, 154. [Google Scholar] [CrossRef]
  52. Tang, W.; Guo, H.P.; Baskin, C.C.; Xiong, W.D.; Yang, C.; Li, Z.Y.; Song, H.; Wang, T.R.; Yin, J.N.; Wu, X.L.; et al. Effect of light intensity on morphology, photosynthesis and carbon metabolism of Medicago sativa seedlings. Plants 2022, 11, 1688. [Google Scholar] [CrossRef]
  53. Feng, L.; Raza, M.A.; Li, Z.; Chen, Y.; Khalid, M.H.B.; Du, J.; Liu, W.; Wu, X.; Song, C.; Yu, L.; et al. Influence of light intensity and leaf movement on photosynthesis characteristics and carbon balance of soybean. Front. Plant Sci. 2019, 9, 1952. [Google Scholar] [CrossRef]
  54. Naveed, M.; Bansal, U.; Kaiser, B.N. Impact of low light intensity on biomass partitioning and genetic diversity in a chickpea mapping population. Front. Plant Sci. 2024, 15, 1292753. [Google Scholar] [CrossRef]
  55. Chen, H.; Wang, L.; Guo, S.; Li, M.Q.; Tian, Z.F.; Han, B.; Tang, X.H.; Liu, B. Effects of light intensity on seedling emergence and early growth of Liquidambar formosana Hance. Forests 2023, 14, 867. [Google Scholar] [CrossRef]
  56. Zhang, L.; Wang, J.; Zhang, J.F.; Deng, X.J.; Luo, Y.H.; Yan, X.F. Responses of growth and physiological characteristics of Quercus wutaishanica seedlings to the light intensity. J. Cent. South For. Univ. 2021, 41, 73–81. [Google Scholar] [CrossRef]
  57. Ballaré, C.L.; Scopel, A.L.; Sánchez, R.A. Far-red radiation reflected from adjacent leaves: An early signal of competition in plant canopies. Science 1990, 247, 329–332. [Google Scholar] [CrossRef] [PubMed]
  58. Pierik, R.; de Wit, M. Shade avoidance: Phytochrome signalling and other aboveground neighbour detection cues. J. Exp. Bot. 2014, 65, 2815–2824. [Google Scholar] [CrossRef] [PubMed]
  59. Mašková, T.; Herben, T. Root:Shoot ratio in developing seedlings: How seedlings change their allocation in response to seed mass and ambient nutrient supply. Ecol. Evol. 2018, 8, 7143–7150. [Google Scholar] [CrossRef]
  60. Poorter, H.; Nagel, O. The role of biomass allocation in the growth response of plants to different levels of light, CO2, nutrients and water: A quantitative review. Funct. Plant Biol. 2000, 27, 1191. [Google Scholar] [CrossRef]
  61. Shipley, B.; Meziane, D. The balanced-growth hypothesis and the allometry of leaf and root biomass allocation. Funct. Ecol. 2002, 16, 326–331. [Google Scholar] [CrossRef]
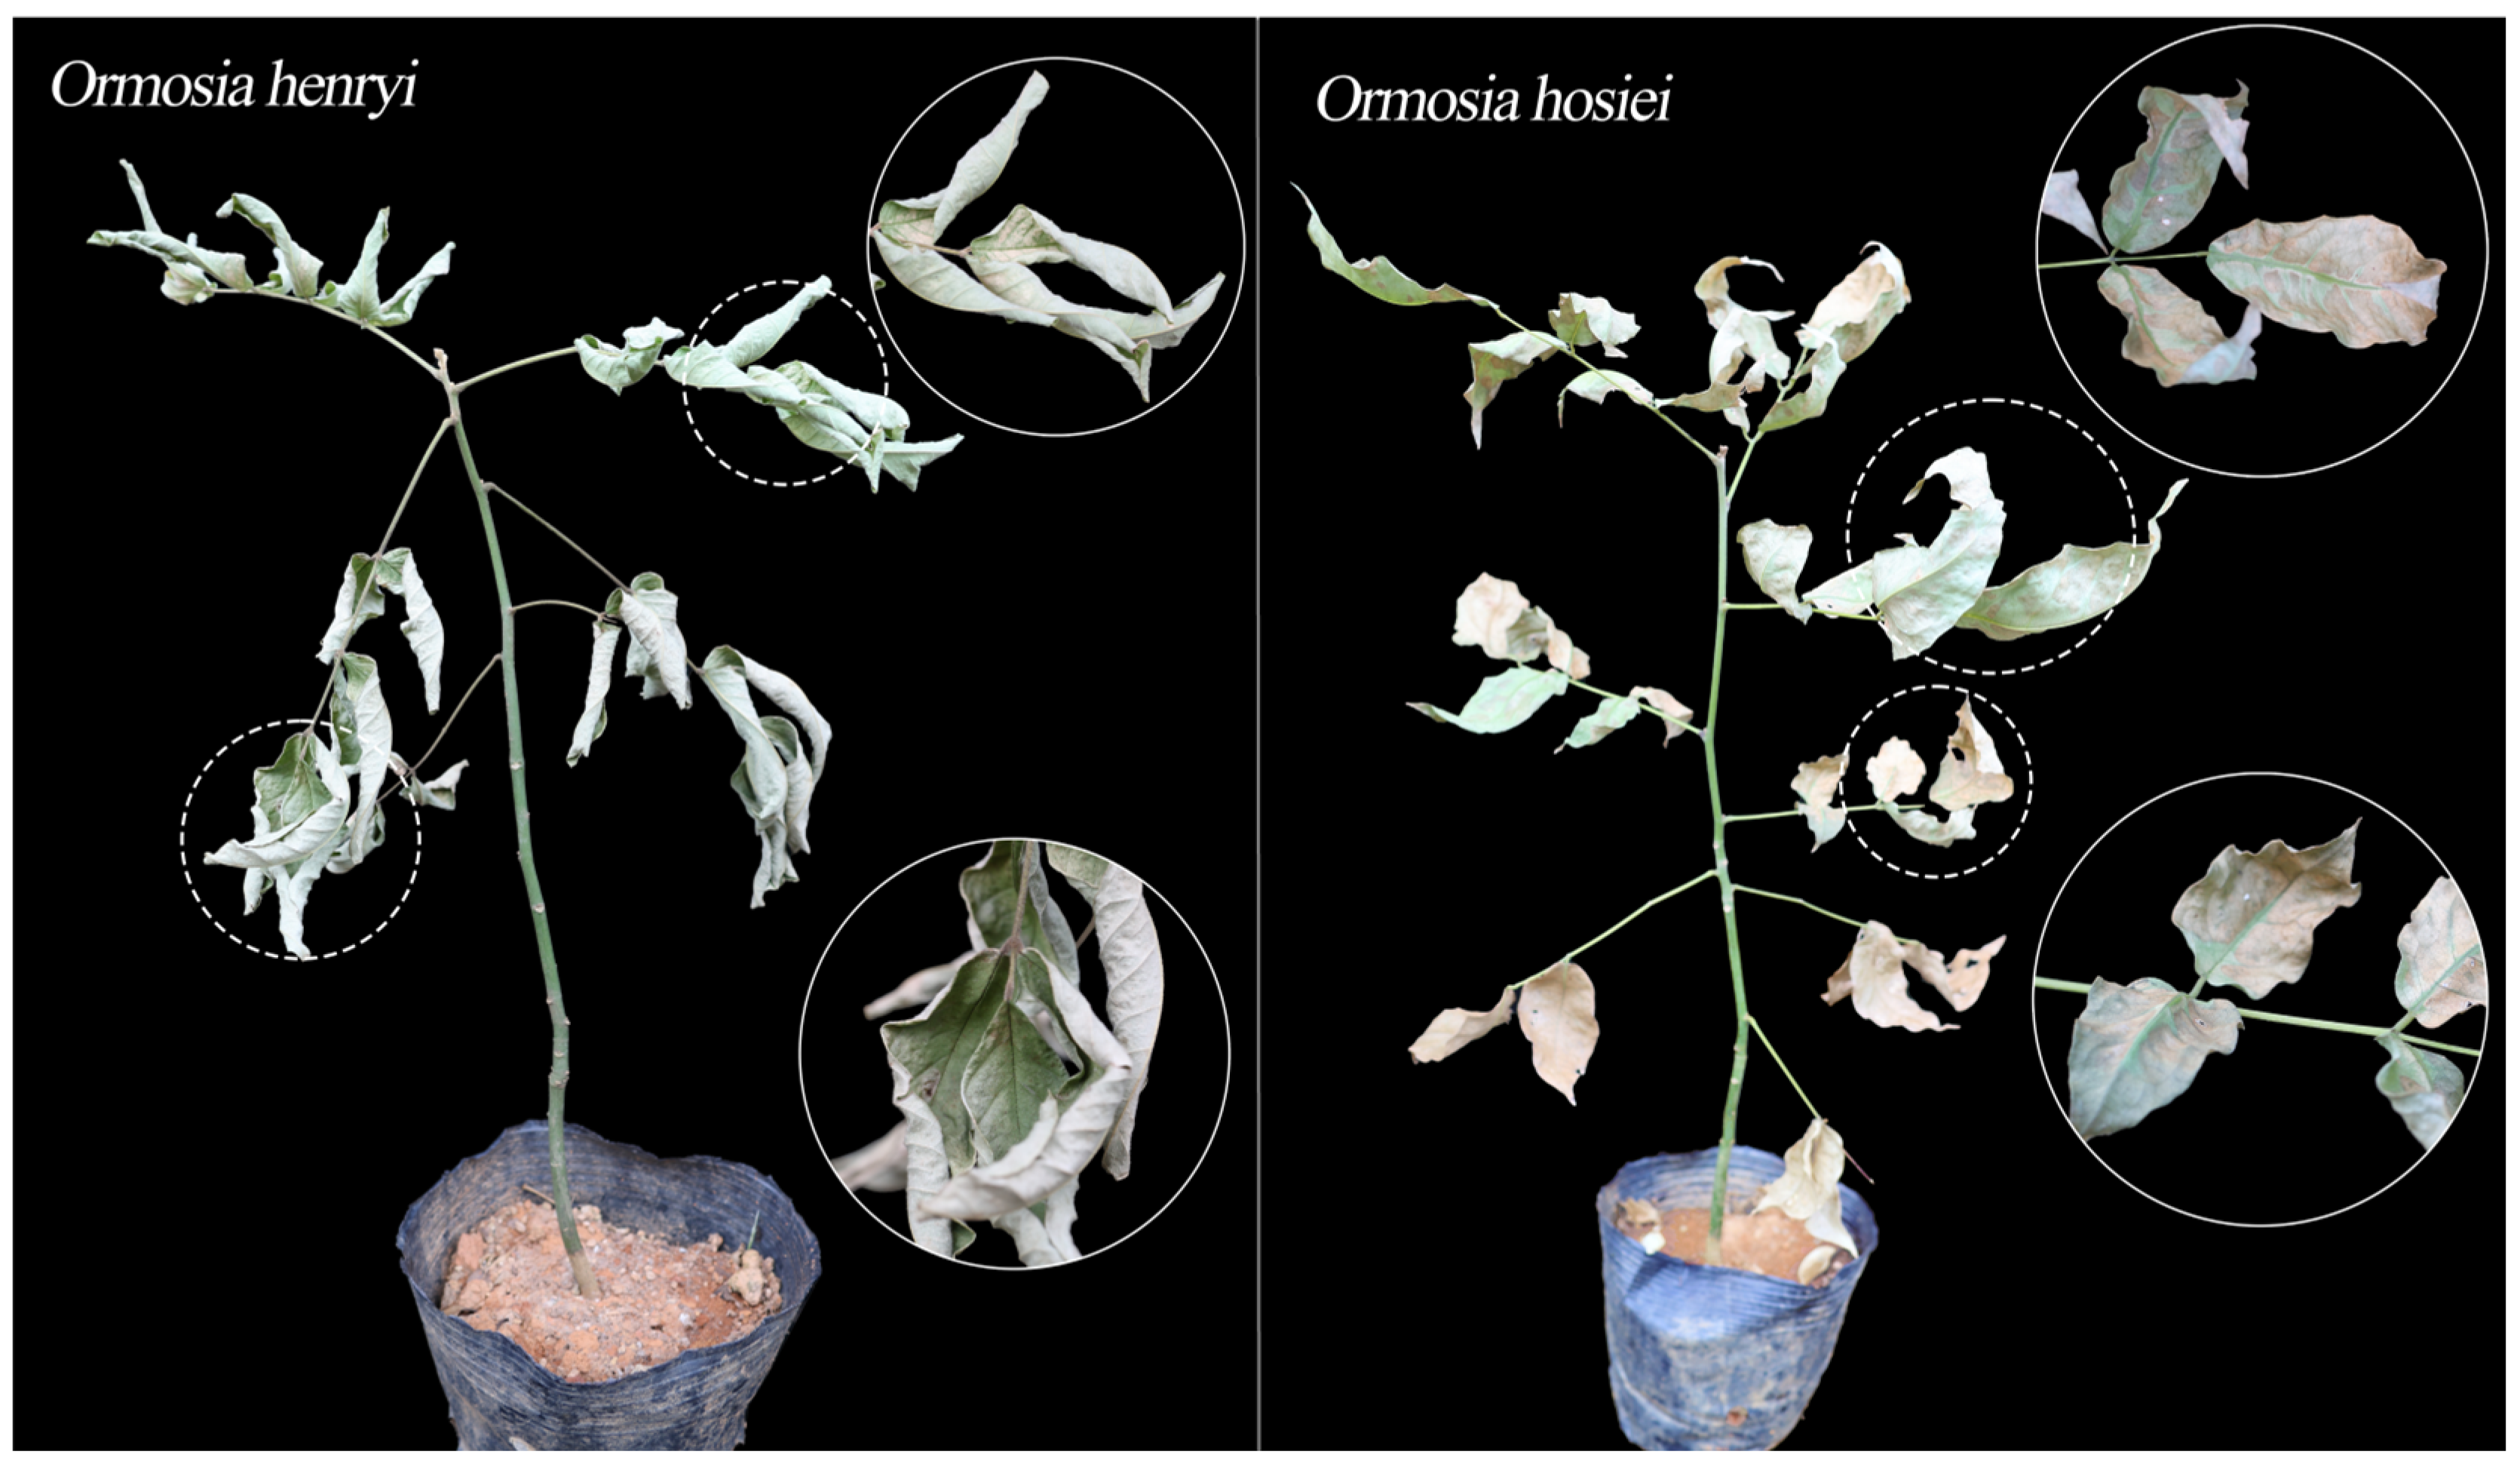
Figure 1. Morphological characteristics of two Ormosia species on the fifth day under 100% full sunlight treatment.
Agronomy 15 02729 g001
Figure 2. (A) Height growth; (B) Basal diameter growth; (C) Fresh weight; (D) Dry weight. Growth parameters of two Ormosia species under different light conditions. PH represents plant height increment, SD represents stem diameter increment, and GR represents the growth rate. AGFW represents aboveground fresh weight; BGFW represents belowground fresh weight; AGDW represents aboveground dry weight; BGDW represents belowground dry weight. The same lowercase letters in the same species indicate p < 0.05.
Agronomy 15 02729 g002
Figure 3. (A) Light-response curve of O. henryi; (B) Light-response curve of O. hosiei. Light response curves of two Ormosia species under different light conditions. Pn represents the net photosynthetic rate, and PFD represents the photosynthetic photon flux density.
Agronomy 15 02729 g003
Figure 4. (A) CO2 response curve of O. henryi; (B) CO2 response curve of O. hosiei. CO2 response curves of two Ormosia species under different light conditions. Pn is the net photosynthetic rate; Ca is the CO2 concentration in the leaf chamber.
Agronomy 15 02729 g004
Figure 5. Leaf anatomical structures of the two Ormosia species under different light conditions. UET is upper epidermal cell thickness; LET is lower epidermal cell thickness; PT is palisade tissue thickness; ST is spongy tissue thickness; VB is vascular bundle.
Agronomy 15 02729 g005
Figure 6. (A) Leaf anatomical parameters of O. henryi; (B) Leaf anatomical parameters of O. hosiei. Cross-sectional leaf parameters of the two Ormosia species under different light conditions. LT is leaf thickness; UET is upper epidermal cell thickness; LET is lower epidermal cell thickness; PT is palisade tissue thickness; ST is spongy tissue thickness; PT/ST is the ratio of palisade to spongy tissue thickness. The same lowercase letters in the same species indicate p < 0.05.
Agronomy 15 02729 g006
Figure 7. Leaf epidermal characteristics of O. henryi under varying light intensities. The first column represents upper epidermis, the second column represents lower epidermis, and the third column represents stomata.
Agronomy 15 02729 g007
Figure 8. Leaf epidermal characteristics of O. hosiei under varying light intensities. The first column represents upper epidermis, the second column represents lower epidermis, and the third column represents stomata.
Agronomy 15 02729 g008
Figure 9. (A) Stomatal major axis; (B) Stomatal minor axis; (C) Stomatal area; (D) Stomatal density. Stomatal parameters of two Ormosia plants under different light conditions. SL is the length of the stomatal apparatus; SW is the width of the stomatal apparatus; SD is stomatal density; SA is the area of a single stomatal apparatus. The same lowercase letters in the same species indicate p < 0.05.
Agronomy 15 02729 g009
Figure 10. (A) Chlorophyll content of Livistona chinensis leaves; (B) Chlorophyll content of Ormosia hosiei leaves. Chlorophyll content of the two Ormosia species under different light conditions. Chl a represents chlorophyll a content; Chl b represents chlorophyll b content; Chl(a + b) represents total chlorophyll content; Car represents carotenoid content; Chl a/Chl b is the ratio of chlorophyll a to chlorophyll b; Car/Chl(a + b) is the ratio of carotenoids to total chlorophyll. The same lowercase letters in the same species indicate p < 0.05.
Agronomy 15 02729 g010
Figure 11. Plasticity indices of the two Ormosia species.
Agronomy 15 02729 g011
Figure 12. Correlation analysis of functional traits of two species of red bean plants. The upper triangle represents O. henryi, and the lower triangle represents O. hosiei. * p < 0.05; ** p < 0.01.
Agronomy 15 02729 g012
Table 1. Light response parameters of two Ormosia species under different light intensities.
SpeciesRelative Light IntensityAQYPmaxLSPLCPRd
O. henryi50%0.055 ± 0.007 b6.863 ± 0.182 a1087.43 ± 40.19 a33.22 ± 6.8 a1.585 ± 0.454 a
25%0.043 ± 0.007 b4.998 ± 0.009 b909.81 ± 168.78 a28.26 ± 4.22 a1.004 ± 0.033 a
10%0.071 ± 0.001 a3.649 ± 0.547 c674.91 ± 14.1 b18.1 ± 1.25 b1.101 ± 0.076 a
O. hosiei50%0.019 ± 0.001 b5.933 ± 0.197 a1119.94 ± 17.84 a65.97 ± 7.08 a1.175 ± 0.059 b
25%0.024 ± 0.001 b4.264 ± 0.137 b890.83 ± 97.47 b23.17 ± 1.62 c0.529 ± 0.064 c
10%0.075 ± 0.011 a3.053 ± 0.226 c611.69 ± 1.3 c41.66 ± 11.62 b2.141 ± 0.74 a
Note: The same lowercase letters in the same species indicate p < 0.05. Rd is the dark respiration rate; Pmax is the maximum photosynthetic rate; LSP is the light saturation point; LCP is the light compensation point; AQY is the apparent quantum yield.
Table 2. CO2 response parameters of two Ormosia species under different light intensities.
SpeciesRelative Light IntensityαAmaxCDSPCDCPRp
O. henryi50%0.039 ± 0.001 b15.659 ± 1.124 a1232.27 ± 15.73 a158.02 ± 1.14 b5.636 ± 0.114 b
25%0.047 ± 0.003 a11.324 ± 1.16 b804.15 ± 10.97 b181.15 ± 5.12 a7.521 ± 0.333 a
10%0.045 ± 0.001 a11.575 ± 0.826 b820.41 ± 61.5 b167.39 ± 10.54 ab6.826 ± 0.561 a
O. hosiei50%0.037 ± 0.006 a13.37 ± 0.535 a1195.88 ± 93.34 a143.86 ± 3.6 b4.829 ± 0.711 b
25%0.034 ± 0.013 a9.978 ± 1.308 b980.99 ± 173.78 ab191.01 ± 33.45 a6.068 ± 2.909 a
10%0.019 ± 0.002 b6.77 ± 0.685 c755.47 ± 100.88 c149.52 ± 7.82 b2.558 ± 0.441 c
Note: The same lowercase letters in the same species indicate p < 0.05. α is the initial carboxylation efficiency; Amax is the maximum net photosynthetic rate; CDSP is the CO2 saturation point; CDCP is the CO2 compensation point; Rp is the photorespiration rate.
Disclaimer/Publisher’s Note: The statements, opinions and data contained in all publications are solely those of the individual author(s) and contributor(s) and not of MDPI and/or the editor(s). MDPI and/or the editor(s) disclaim responsibility for any injury to people or property resulting from any ideas, methods, instructions or products referred to in the content.