Article

Comparative Study on Photosynthetic Characteristics and Leaf Structure of Paphiopedilum parishii in Different Growth Periods

1
Guangxi Key Laboratory of Functional Phytochemicals Research and Utilization, Guangxi Institute of Botany, Chinese Academy of Sciences, Guilin 541006, China
2
College of Life Sciences, Guangxi Normal University, Guilin 541006, China
3
Library, Guangxi University of Chinese Medicine, Nanning 530200, China
*
Authors to whom correspondence should be addressed.
These authors have contributed equally to this work.
Agronomy 2025, 15(12), 2713; https://doi.org/10.3390/agronomy15122713
Submission received: 27 October 2025 / Revised: 22 November 2025 / Accepted: 24 November 2025 / Published: 25 November 2025
(This article belongs to the Section Plant-Crop Biology and Biochemistry)

Abstract

This study investigates the differences in photosynthetic characteristics of Paphiopedilum parishii (Rchb.f.) Stein during its reproductive and nutrient growth periods. Using plants from the same individual, we compared light response curves, chlorophyll content, leaf epidermal structure, and leaf anatomical structure between these two growth stages. The results show the following: (1) The overall shape of the light response curves was similar across both periods, but plants in the nutrient growth period exhibited higher net photosynthetic rates (Pn) at all light intensities compared to those in the reproductive growth period. (2) During the nutrient growth period, apparent quantum efficiency (AQY), maximum net photosynthetic rate (Pmax), and light saturation point (LSP) were all significantly higher than in the reproductive growth period, while the light compensation point (LCP) and dark respiration rate (Rd) showed no significant differences. (3) Structurally, during the nutrient growth period, stomatal density significantly increased, while stomatal area decreased. Additionally, leaf thickness and mesophyll tissue thickness both markedly increased, indicating enhanced carbon assimilation efficiency through improved CO2 uptake capacity and expanded photosynthetic area. (4) Significant differences in leaf anatomical structure between the two periods were primarily observed in leaf thickness and mesophyll tissue thickness, providing more space for energy accumulation during the post-flowering recovery phase. This study systematically reveals the dynamic changes in photosynthetic physiology and structural characteristics of P. parishii across different phenological stages, offering a theoretical foundation for its reintroduction and cultivation management.

1. Introduction

Photosynthesis is a crucial physiological process for plant growth and development. Understanding its characteristics is essential for determining the optimal environmental conditions and ecological requirements for plants. Therefore, studying photosynthesis and the factors that influence it in endangered species is a key approach to uncovering the mechanisms behind their endangerment [1]. Photosynthetic characteristics of plants vary depending on environmental conditions, growth status, and developmental stages. Pan et al. [2] found significant differences in the photosynthetic traits between juvenile and mature Magnolia aromatica (Dandy) V.S.Kumar plants, with variations in photosynthetic rates primarily attributed to differences in spongy tissue thickness, leaf thickness, and chlorophyll content. Zhao et al. [3] conducted research on the photosynthetic physiology and ecology of young Bhesa robusta (Roxb.) Ding Hou growing in three distinct light habitats—forest edges, forest gaps, and forest understories. They found that saplings in forest edge habitats, which receive more abundant light, exhibited significantly better growth and photosynthetic performance compared to those in the other habitats. As photosynthesis regulates physiological and metabolic processes throughout the plant life cycle, studying the photosynthetic characteristics of the same species at different developmental stages is crucial for guiding the conservation of endangered species.
The genus Paphiopedilum (Pfitz.) belongs to the subfamily Cypripedioideae within the Orchidaceae family. These perennial herbaceous plants are terrestrial, semi-epiphytic, or epiphytic in nature. The genus comprises approximately 109 species, with around 34 species found in China, primarily distributed across southwestern regions such as Yunnan, Guangxi, and Guizhou [4]. Paphiopedilum species are known for their vibrant colors and extended blooming periods [5], featuring uniquely shaped flowers with specialized labellums that form pouch-like or helmet-shaped structures. Resembling slippers or pouches, these orchids are commonly referred to as slipper orchids [6]. Highly valued for their ornamental beauty, they are sought after by enthusiasts worldwide and marketed as premium floral materials. Additionally, the entire plant is used in traditional medicine to clear heat, promote rash eruption, calm the mind, and soothe the spirit. It is commonly prescribed for conditions such as measles, pneumonia, restlessness with insomnia, and neurasthenia [7,8]. Paphiopedilum species possess both ornamental and medicinal value, generating significant market demand. In recent years, wild populations have rapidly declined due to overharvesting and habitat destruction, severely impacting the survival of this genus. Currently, all species within the genus are listed in Appendix I of the Convention on International Trade in Endangered Species of Wild Fauna and Flora (CITES), prohibiting their trade [9]. In the 2021 National List of Key Protected Plants, all species except Paphiopedilum micranthum Tang & F.T.Wang and P hirsutissimum (Lindl. ex Hook.) Stein — which are classified as Class II nationally protected wild plants—have been designated as Class I nationally protected wild plants [10,11]. P. parishii blooms from June to July, with an inflorescence stalk that reaches 30–60 cm in height, densely covered with white pubescence. The raceme bears 3–8 flowers that open nearly simultaneously. It grows on tree trunks or rocks within broad-leaved forests at elevations of 1000–1100 m [12]. The International Union for Conservation of Nature (IUCN) has classified it as Endangered (ER), with wild populations being extremely rare. In China, only a few wild populations are found in Yunnan and Guangxi [13]. Research on P. parishii has primarily focused on reproductive biology [14], chloroplast genome sequencing [15,16], karyotype analysis [17], symbiotic mycorrhiza [18], and ornamental value [19]. However, studies on its photosynthetic physiology and ecology remain limited, hindering the implementation of effective conservation strategies [20]. This study aims to analyze the effects of different growth periods on the photosynthetic characteristics and leaf anatomical structure of P. parishii, measuring its light response curve and related parameters such as chlorophyll content. The findings provide a scientific basis for the introduction and cultivation of P. parishii, promoting the sustainable development of orchid resources.

2. Materials and Methods

2.1. Overview of the Study Site

The experiment was conducted at the Guangxi Institute of Botany in Guilin, Guangxi Zhuang Autonomous Region, China (110°18.13′ E, 25°04′ N), at an elevation of approximately 163 m. The monthly average temperature (TEM_Avg, °C) and total monthly precipitation (PRE, mm) for Guilin City in 2024 are shown in Figure 1. The data were sourced from the Environmental Meteorological Data Service Platform (http://eia-data.com/, accessed on 23 August 2025).

2.2. Experimental Methods

2.2.1. Determination of Light Response Curve

Healthy 6-year-old P. parishii plants were selected for the experiment. The mature, pest- and disease-free mid-section leaves from these plants were used as experimental material, with three replicates taken from the same plant. Measurements were conducted on clear, cloudless mornings in June 2024 (reproductive growth period) and October 2024 (nutrient growth period). The photosynthetic measurements were performed using a Li-6400 (LI-COR, Lincoln, NE, USA) portable photosynthetic instrument, with the LED red and blue light source. The photosynthetic active radiation (PAR) was set sequentially at the following values: 1400, 1200, 1000, 800, 600, 400, 200, 150, 100, 80, 60, 50, 40, 30, 20, and 0 µmol·m−2·s−1. Environmental conditions were controlled with a relative humidity of 65%, leaf chamber temperature of 25 °C, and CO2 concentration of 400 µmol·m−2·s−1. Prior to measurements, the leaves were acclimated under 600 µmol·m−2·s−1 light intensity for 120 s, with maximum and minimum waiting times set at 120 s and 200 s, respectively, before beginning the measurements.
P n ( I ) = α 1 β I 1 + γ I I R d
In the equation, P n ( I ) is the net photosynthetic rate, α is the initial slope of the light response curve, β and γ are the coefficient, I is photosynthetically active radiation, and R d is dark respiration. Saturated light intensity with LSP is:
L S P = ( β + γ ) / β 1 γ
The maximum net photosynthetic rate ( P m a x ) is:
P m a x = α β + γ β γ R d

2.2.2. Foliar Surface Features

For photosynthetic determination, leaves were selected from the regression plants, and small squares (approximately 5 × 5 mm) were cut from the central part of the leaf margin to the main vein. These samples were immediately fixed in 2.5% glutaraldehyde fixative. Upon arrival at the laboratory, the samples underwent stepwise dehydration using ethanol. The dehydration gradient consisted of 30%, 50%, 70%, 80%, 90%, 95%, 95%, and 95% ethanol, with each step lasting 15 min. After dehydration, the samples were subjected to critical point drying and gold plating. The upper epidermis, lower epidermis, and stomatal apparatus were observed using a vacuum electronic scanning electron microscope (ZEISS EVO18, Carl Zeiss AG, Oberkochen, Germany). Stomatal characteristics, including the long axis (SL), short axis (SW), stomatal density (SD), and single stomatal area (SA), were measured using Axio Vision SE64 Rel.4.8 scanning electron microscope software. Stomatal density (SD) was calculated as the number of stomata in the visual field divided by the area of the visual field, while the single stomatal area (SA) = π × stomatal long axis (SL) × stomatal short axis (SW)/4, π = 3.14. Ten random visual fields were observed for each sample to obtain statistical values.
S A = π × S L × S W 4

2.2.3. Leaf Anatomical Structure

For photosynthetic determination, leaves from each plant were selected, cut along the midrib, and sectioned into 10 mm × 10 mm pieces [21]. These sections were fixed in FAA fixative (70% ethanol, formalin, glacial acetic acid in a 90:5:5 ratio), then dehydrated through a series of ethanol and xylene steps. The sections were embedded in paraffin, stained with toluidine blue, and sealed with neutral gum. The samples were observed and photographed under an optical microscope, and microscopic parameters were measured using the graphical analysis software CaseViewer 2.4. The following parameters were measured: upper epidermal thickness (UET), lower epidermal thickness (LET), leaf thickness (LT), and mesophyll tissue thickness (MT). Each sample was randomly observed in 10 visual fields, and statistical values were obtained for each.

2.2.4. Determination of Photosynthetic Pigment Content in Leaves

Three leaves with the same maturity, leaf position, and leaf size were collected from the plants for photosynthetic determination. A 0.2 g sample from each leaf was accurately weighed and placed in a 25 mL volumetric flask, then filled with 95% ethanol to constant volume and soaked in the dark for 24 h. The absorbance was measured at 470 nm, 649 nm, and 665 nm using an ultraviolet-visible spectrophotometer (Alpha 1502, Shanghai Spectrometer Instrument Co., Ltd., Shanghai, China) [22]. The contents of chlorophyll a (Chla), chlorophyll b (Chlb), total chlorophyll (Chl a + b), carotenoids (Car), the ratio of chlorophyll a to chlorophyll b (Chla/Chlb), and the ratio of carotenoids to total chlorophyll (Car/Chl a + b) were calculated.
Chla concentration C a , m g · L 1 : C a = ( 13.95 A 665 6.88 A 649 ) × V 1000 W
Chlb concentration C b , m g · L 1 : C b = ( 24.96 A 649 7.32 A 655 ) × V 1000 W
Carotenoid concentration C x · c , m g · L 1 : C x · c = ( 1000 A 470 2.05 C a 114.8 C b 245 ) × V 1000 W

2.3. Data Processing

The experimental data were organized and processed using Excel 2016 (Microsoft, Redmond, WA, USA). One-way analysis of variance (ANOVA) was conducted using SPSS 27.0 (SPSS Inc., Chicago, IL, USA), and multiple comparisons were performed with Duncan’s test. Photosynthetic parameters were fitted and calculated using photosynthesis modeling software. Correlation analyses among light conditions, functional traits, pigment contents, leaf anatomical characteristics, and leaf epidermal features were carried out using Origin 2024 (Origin Lab Corporation, Northampton, MA, USA), and the results were visualized accordingly.

3. Results

3.1. Comparison of Light Response Curves in P. parishii at Different Growth Periods

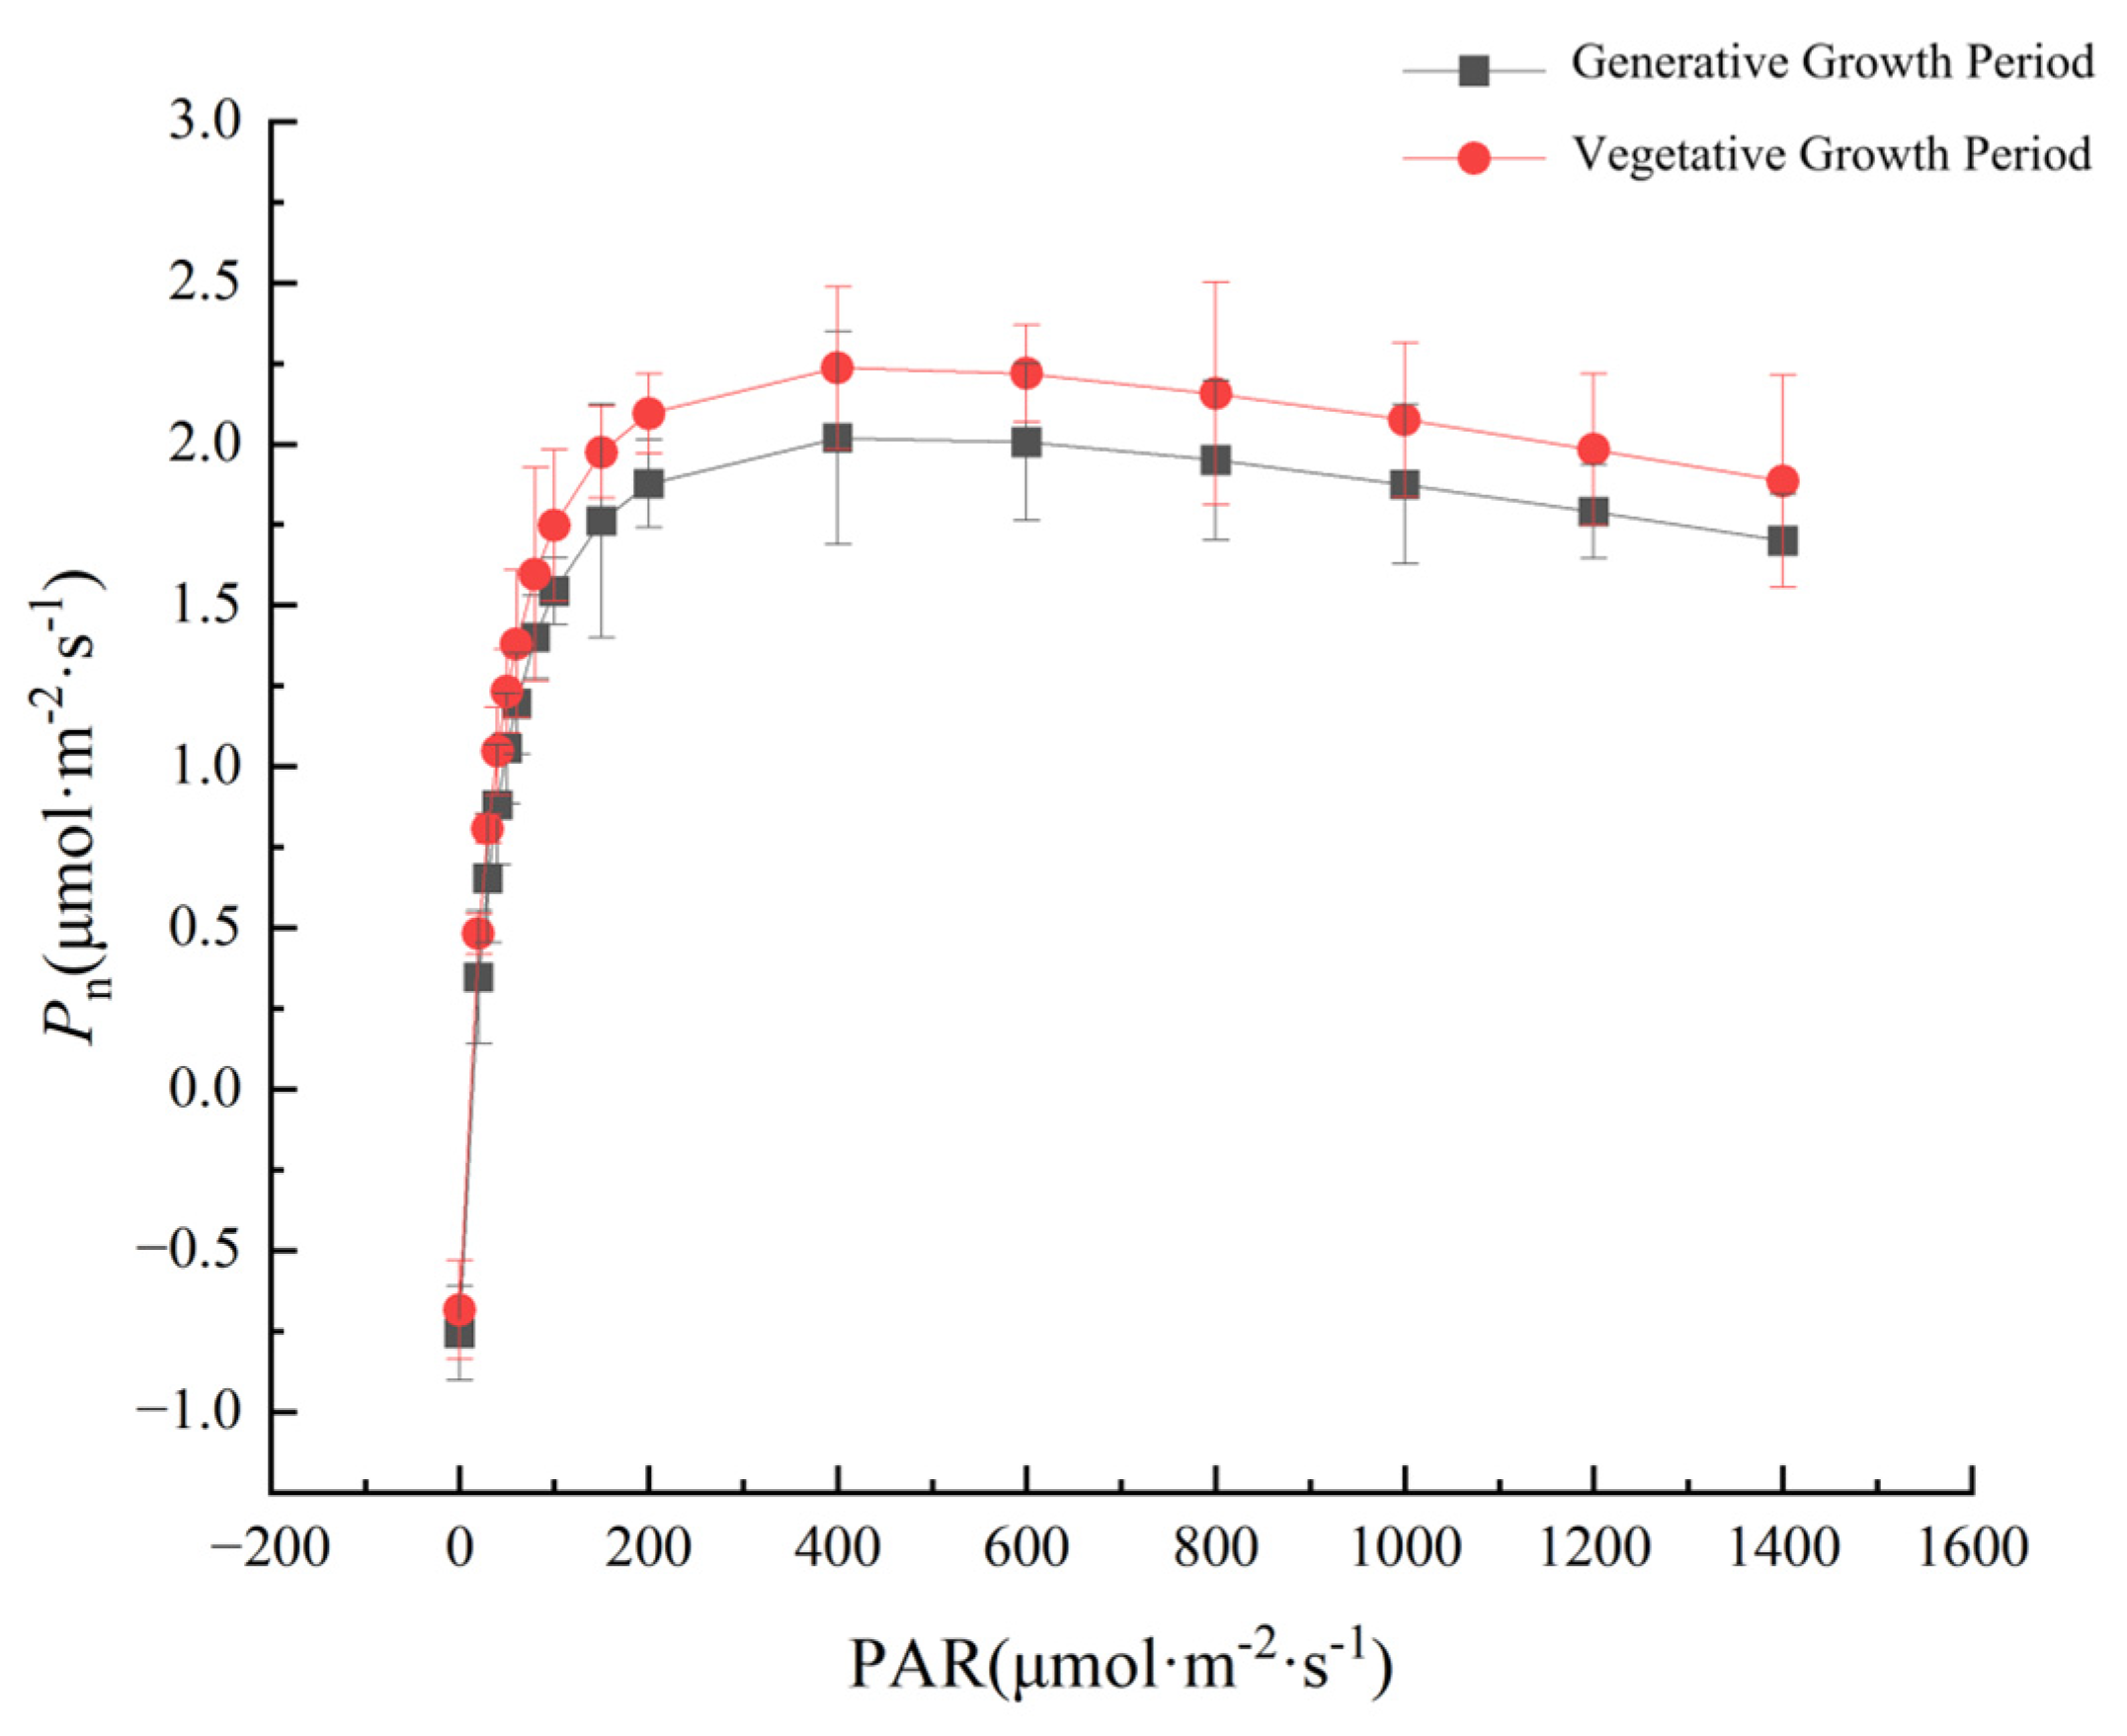
The photosynthetic response curves of P. parishii during the reproductive and nutrient growth periods, as shown in Figure 2, exhibit similar trends in both phases. At light intensities of 0 μmol·m−2·s−1 (PAR), net photosynthetic rates (Pn) remained consistently negative. As light intensity increased from 0 to 200 μmol·m−2·s−1, Pn rose sharply. Between 200 and 400 μmol·m−2·s−1 PAR, Pn continued to increase, though at a slower rate. However, when PAR exceeded 400 μmol·m−2·s−1, Pn declined as light intensity increased, indicating photoinhibition. Throughout the study, the net photosynthetic rate of P. parishii during the nutrient growth period consistently surpassed that observed during the reproductive growth period.

3.2. Comparison of Light Response Characteristic Parameters

Comparative analysis of light response parameters between the reproductive and nutrient growth periods of P. parishii revealed distinct differences in photosynthetic characteristics. During the nutrient growth period, the apparent quantum efficiency (AQY, 0.0120 ± 0.0020 mol·mol−1) was significantly higher than during the reproductive growth period (p > 0.05, AQY: 0.0103 ± 0.0012 mol·mol−1. The maximum net photosynthetic rate (Pmax, 2.2391 ± 0.0514 μmol·m−2·s−1) and light saturation point (LSP, 448.43 ± 6.65 μmol·m−2·s−1) were also significantly higher than during the reproductive growth period (p > 0.05, Pmax: 2.0274 ± 0.0103 μmol·m−2·s−1, LSP: 440.57 ± 8.13 μmol·m−2·s−1). No significant differences were observed between the two periods in terms of the light compensation point (LCP) and dark respiration rate (Rd), indicating that respiratory expenditure and minimum light requirements remained relatively consistent across the growth stages (Table 1).

3.3. Comparison of Leaf Epidermal Characteristics

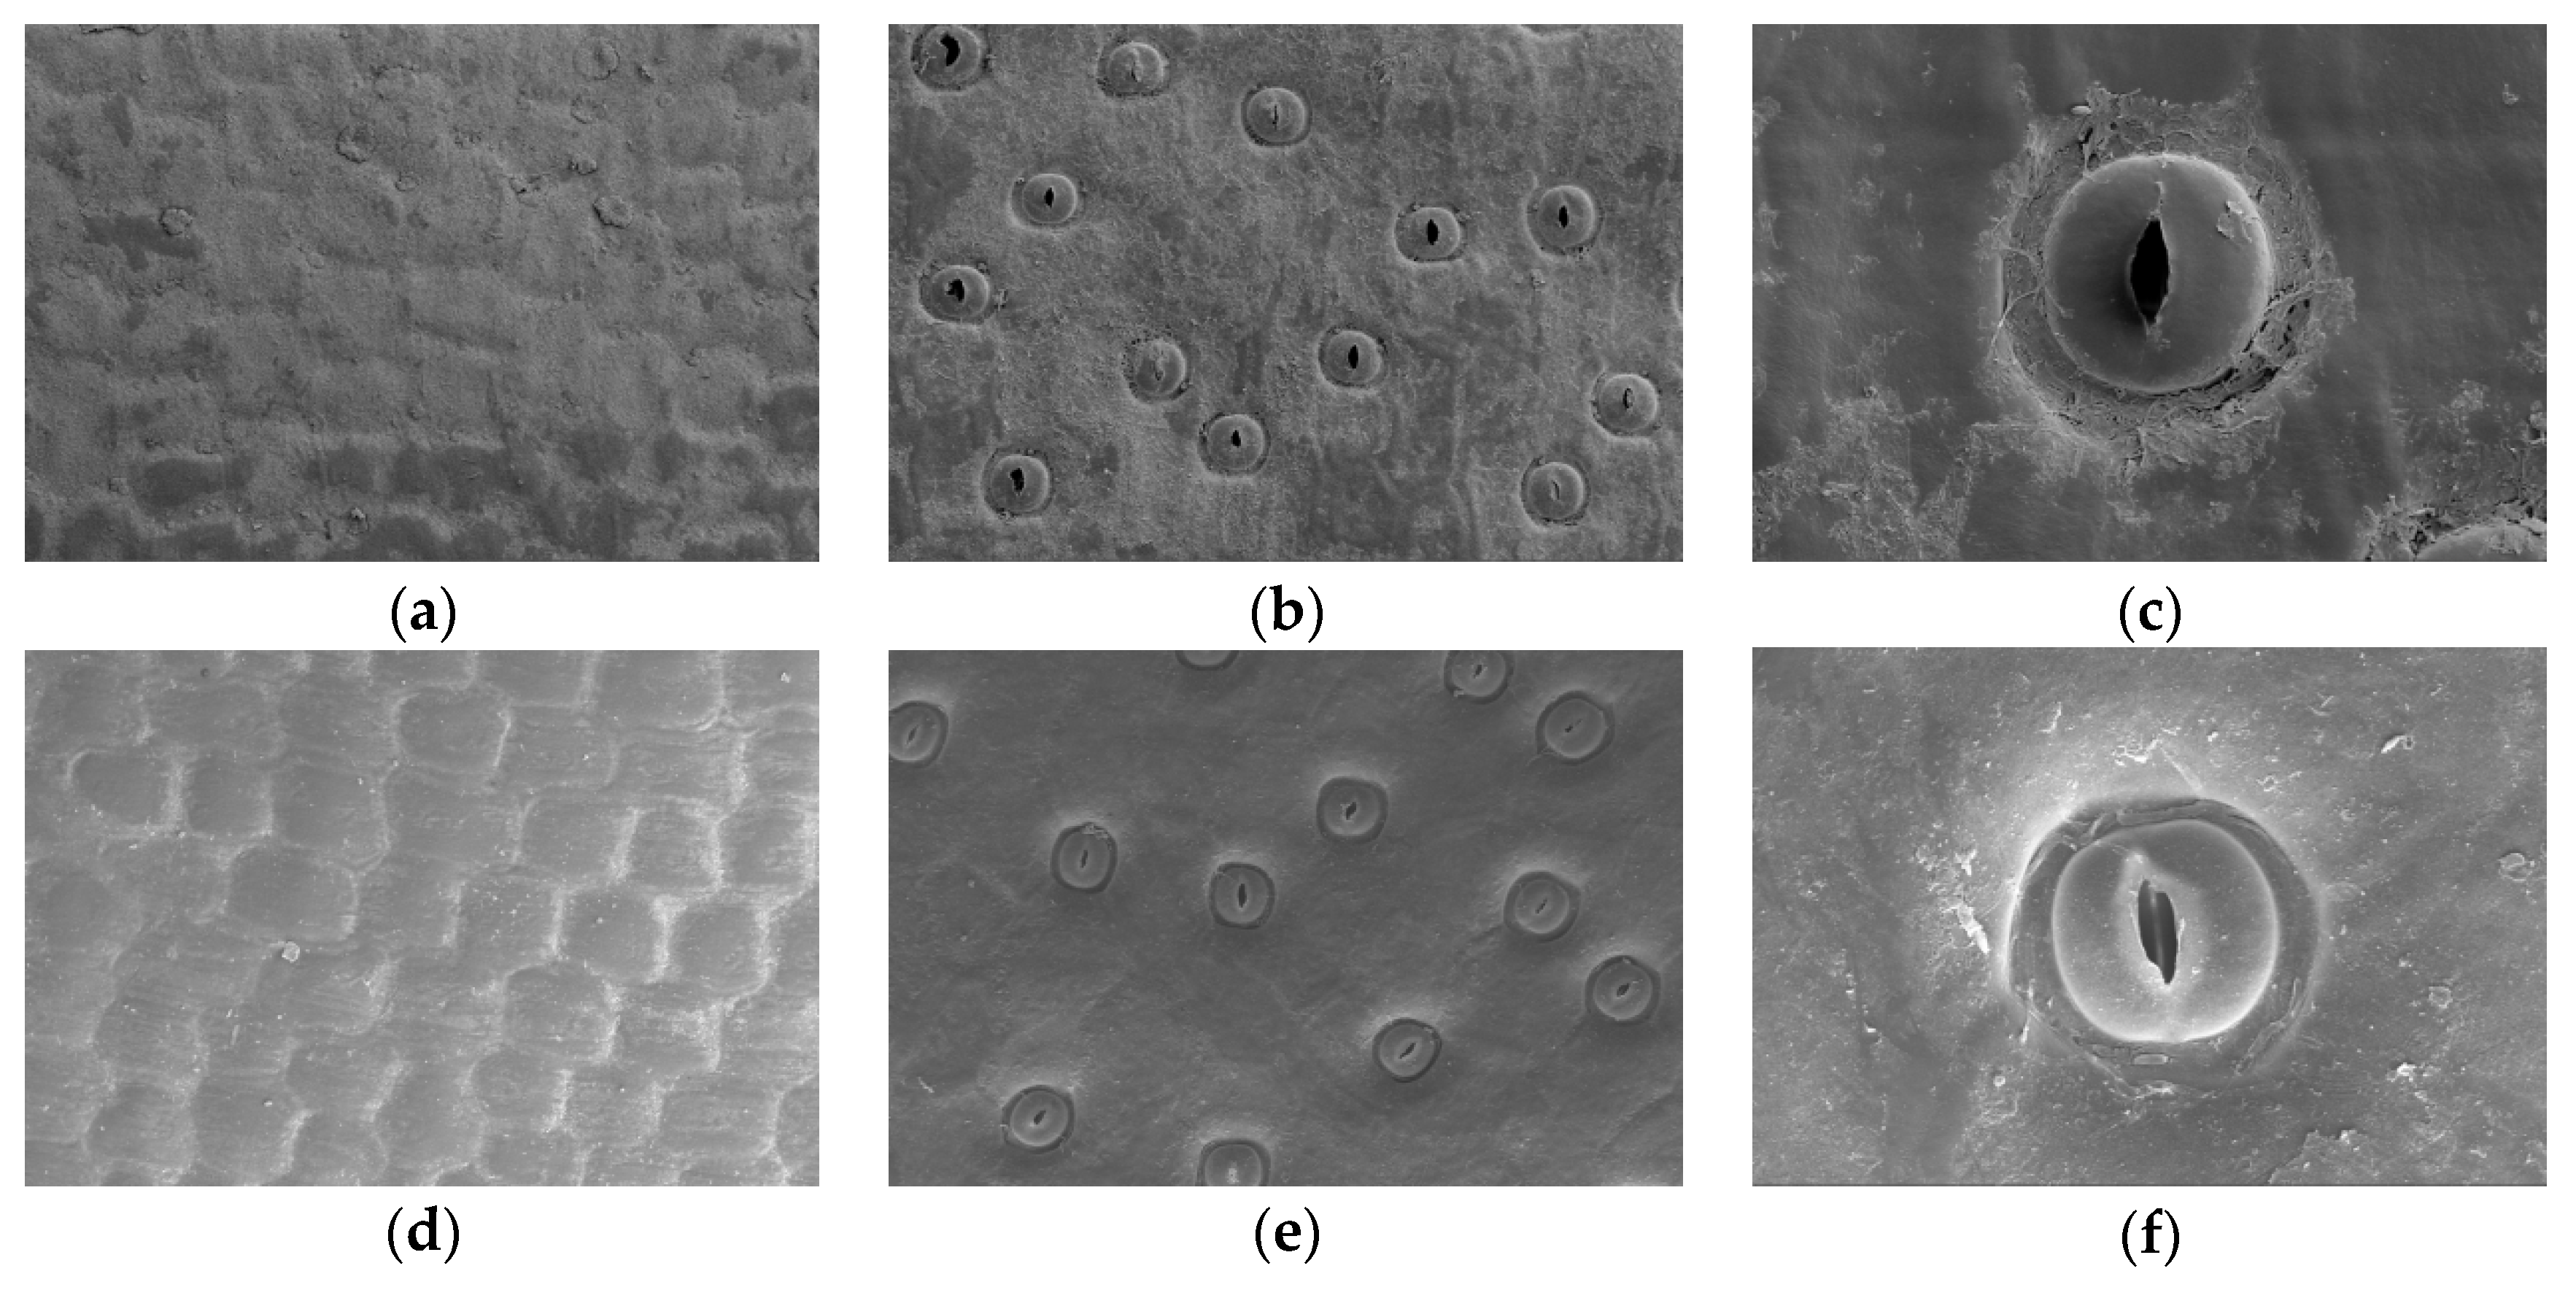
Scanning electron micrographs of the leaf epidermis of P. parishii at different growth stages are shown in Figure 3. Stomata are exclusively located on the lower epidermis. At the same magnification, stomatal distribution appears relatively sparse during the reproductive growth period, with the stomatal apparatus exhibiting a more open and plump morphology. The larger size of the stomatal guard cells and subsidiary guard cells suggests a greater range of opening and closing, as well as higher gas exchange potential. In contrast, during the nutrient growth period, stomata are more densely distributed, and the measured stomatal area (SA) is significantly smaller. Specific stomatal parameters are provided in Table 2. Significant differences in stomatal morphology and distribution between the two growth periods were observed (p < 0.05). The stomatal length (SL: 41.014 ± 2.090 μm) and width (SW: 38.719 ± 2.480 μm) during the reproductive growth period were significantly larger compared to the nutrient growth period (SL: 40.009 ± 1.516 μm; SW: 37.586 ± 2.708 μm). Additionally, stomatal density (SD) was significantly lower during the reproductive growth period (78.730 ± 6.825 mm−2) compared to the nutrient growth period (84.444 ± 13.402 mm−2). Similarly, the stomatal area (SA) in the nutrient growth period (1248.354 ± 122.900 μm2) was significantly larger than in the reproductive growth period (1182.354 ± 117.789 μm2).

3.4. Comparison of Leaf Anatomical Structure

Figure 4 illustrates the anatomical structure of P. parishii leaves during the reproductive and nutrient growth periods. The leaf structure consists of three main components: the upper and lower epidermis and the mesophyll tissue, with no distinct palisade or spongy tissue observed. As shown in Table 3, which provides anatomical data for the leaves at different growth periods, significant differences were found (p < 0.05). The total leaf thickness during the nutrient growth period (1334.89 ± 19.22 μm) was significantly greater than during the reproductive growth period (1236.40 ± 20.34 μm). This increase in thickness was primarily attributed to the significant expansion of the mesophyll tissue (nutrient growth period: 623.32 ± 30.64 μm; reproductive growth period: 538.24 ± 28.86 μm). However, the thickness of the upper and lower epidermis did not show significant changes between the two periods. The upper epidermis remained approximately 629 to 639 μm thick, while the lower epidermis ranged from 70 to 74 μm in thickness.

3.5. Comparison of Leaf Pigment Content

The chlorophyll content at different growth periods is summarized in Table 4. The results revealed significant differences in leaf pigment content between the two growth periods (p < 0.05). During the nutrient growth period, the concentrations of chlorophyll a (2.4971 mg·g−1), chlorophyll b (1.5264 mg·g−1), carotenoids (0.4095 mg·g−1), and total chlorophyll (4.0235 mg·g−1) were significantly higher than during the reproductive growth period. The chlorophyll a to chlorophyll b ratio (1.6360) was also significantly higher, suggesting that the photosynthetic apparatus may be more efficient at converting light energy. However, no significant difference was observed in the carotenoid-to-total-chlorophyll ratio between the two periods. This indicates that while the absolute pigment content increased, their relative proportions remained stable, reflecting the coordinated adaptation of the photosynthetic system.

3.6. Correlation Analysis of Leaf Structure and Photosynthetic Physiology of P. parishii in Different Growth Periods

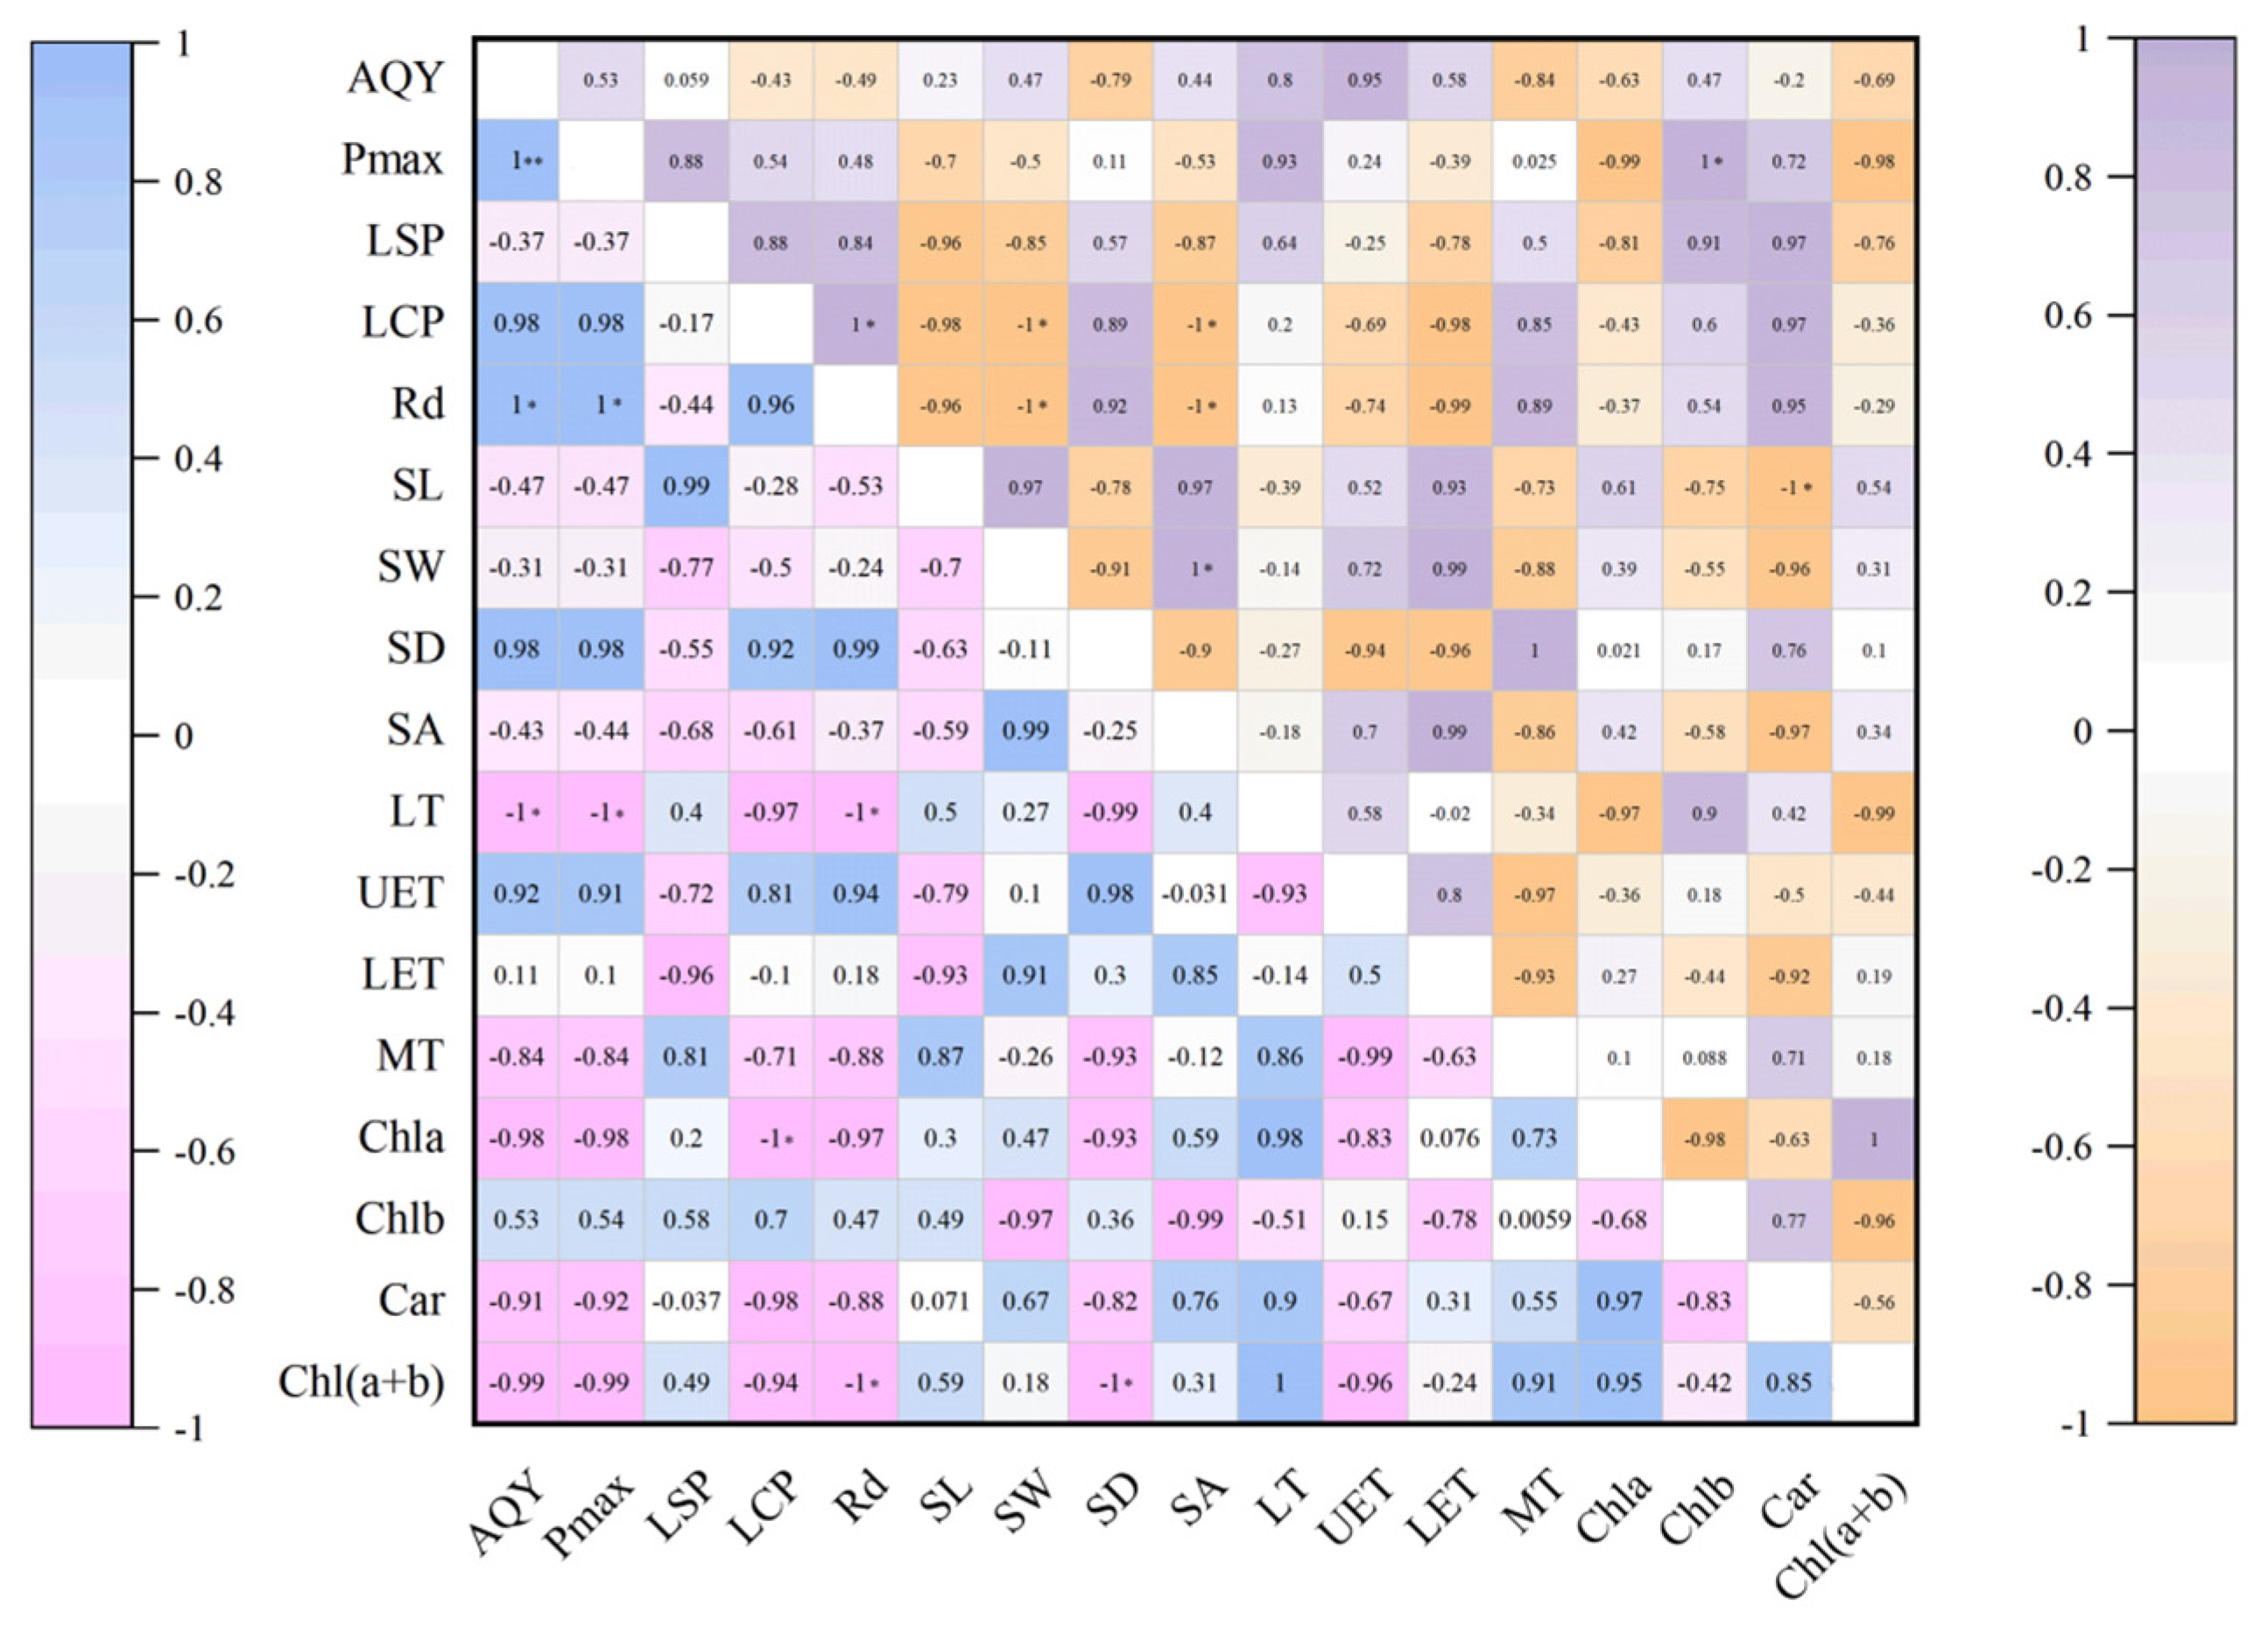
Figure 5 shows the correlation between leaf structure parameters and photosynthetic physiological indices during the reproductive growth period (upper triangle) and the nutrient growth period (lower triangle). During the reproductive growth period of P. parishii, correlations between the parameters were generally weak and scattered, with fewer significant relationships observed. Notably, a significant negative correlation was found between stomatal density (SD) and carotenoid content (r = −0.92, p < 0.05), as well as a strong negative correlation between the maximum photosynthetic rate (Pmax) and the light saturation point (LSP) (r = −1.00, p < 0.05). However, most correlations between photosynthetic pigment parameters and leaf structural parameters were not statistically significant. In contrast, during the nutrient growth period, the correlations between the parameters were stronger and more synergistic. For example, mesophyll tissue thickness (MT) was significantly and positively correlated with the maximum photosynthetic rate (Pmax) (r = 0.97, p < 0.01) and total chlorophyll content (Chl a + b) (r = 0.95, p < 0.05), while being negatively correlated with the dark respiration rate (Rd) (r = −0.96, p < 0.05). Additionally, leaf thickness (LT) and upper epidermis thickness (UET) showed a significant positive correlation (r = 0.97, p < 0.01).

4. Discussion

This study examined the dynamic changes in the photosynthetic physiological characteristics of P. parishii throughout its annual growth cycle by measuring light response parameters during the reproductive and vegetative phases. The results show that the nutrient growth period significantly outperformed the reproductive period in terms of apparent quantum efficiency (AQY), maximum net photosynthetic rate (Pmax), and light saturation point (LSP). However, no significant differences were observed in the light compensation point (LCP) and dark respiration rate (Rd). The higher photosynthetic parameters during the nutrient growth period indicate that P. parishii leaves exhibit enhanced light utilization and carbon assimilation capabilities during this phase. During the reproductive growth period, the plant allocates a significant portion of photosynthetic products to reproduction, which limits its leaf physiological functions to some extent. Upon transitioning to the nutrient growth period, the energy demand shifts from reproductive organs to vegetative organs, allowing the photosynthetic apparatus of the leaves to strengthen, thus significantly improving light energy conversion efficiency [23,24].
LCP and Rd are key indicators for assessing the energy expenditure required to sustain basic metabolic functions in plants. The absence of significant differences between the two periods suggests that, despite variations in photosynthetic capacity, the energy consumption needed to maintain fundamental life processes in P. parishii remains relatively constant. This conservation of energy expenditure may represent an evolutionary adaptation, enabling the species to maintain a baseline level of survival even when environmental light conditions fluctuate. The lower LCP also aligns with the species’ characteristics as an orchid, which may grow in low-light understory environments, reflecting its efficient adaptation to such conditions [25].
Stomata, essential for gas exchange between plants and the atmosphere, play a crucial role in regulating the carbon and water cycles within ecosystems [26]. By adjusting the opening, closing, size, density, and distribution of stomata, plants optimize gas exchange efficiency [27]. Studies indicate that under drought conditions, plants often increase stomatal density while reducing stomatal area to enhance water retention and improve photosynthetic efficiency to cope with stress [28]. Chlorophyll, the key pigment for light energy absorption and conversion, is positively correlated with photosynthetic capacity and serves as an important indicator of a plant’s photosynthetic potential [29].
In the reproductive growth phase of P. parishii during this study, warmer and more humid conditions in June led to larger but more sparse stomatal structures. The leaf structure became simplified, with loosely arranged cells, as nutrients were prioritized for flower development. During the nutrient growth period in October, under conditions of low rainfall and decreasing temperatures, a smaller but denser stomatal pattern developed. Stomata opened more frequently, enhancing photosynthetic activity and nutrient accumulation, which provided energy reserves for the subsequent growth cycle. This suggests that during the nutrient growth period, P. parishii increases its photosynthetic capacity and nutrient storage primarily through the development of mesophyll tissue.
Following the transition from the reproductive growth period to the nutrient growth period, the leaves of P. parishii underwent significant anatomical adaptations, most notably the substantial thickening of both the entire leaf structure and the mesophyll tissue. This structural transformation provides the foundation for physiological shifts that optimize photosynthetic efficiency. Along with the increase in stomatal density, these changes create a synergistic high-yielding pattern, designed to efficiently accumulate photosynthetic products and establish a strong material base for the next growth cycle [30]. The primary functions of the epidermis are protection and gas exchange. The stable thickness of the epidermis across both periods suggests that its protective function remains a fundamental requirement, unaffected by fluctuations during the reproductive phase.
The dynamic changes in photosynthetic capacity across different growth periods have become a central focus in ecological research. Through a series of physiological adjustments, plants regulate the functionality of their photosynthetic apparatus, energy allocation strategies, and carbon assimilation efficiency. These adaptations allow plants to meet resource demands during various developmental phases and environmental conditions, responding to shifts in developmental needs. As a result, plants can efficiently accumulate and optimally utilize photosynthetic products. Zhang et al. [31] studied the photosynthetic characteristics of Osmanthus fragrans Lour. during the initial flowering, reproductive growth, and final flowering stages. Their results showed that the net photosynthetic rate (Pn) and stomatal conductance (Gs) initially decreased, then increased, across these stages, while intercellular CO2 concentration (Ci) and transpiration rate (Tr) steadily increased. The authors suggest that this dynamic photosynthetic pattern is regulated by endogenous hormones, with a significant rise in abscisic acid (ABA) content during the late flowering stage. Low concentrations of ABA help modulate stomatal aperture and chlorophyll content, which may contribute to the recovery of photosynthetic capacity in the later stages [32,33]. In contrast to the fluctuating patterns observed in perennial woody plants like Osmanthus fragrans, annual crops such as Sesamum indicum L. [34] and Oryza sativa L. [35] typically exhibit a steady decline in net photosynthetic rate (Pn), stomatal conductance (Gs), and chlorophyll content from the onset to the end of flowering. This is likely due to their different life history strategies: annual plants rapidly shift nutrient allocation from vegetative organs (leaves) to reproductive organs (flowers and fruits) after flowering. This redirection of resources accelerates leaf senescence, reducing transpiration and lowering stomatal conductance to minimize water loss, which leads to a sustained decline in photosynthetic rates.
The results of this study indicate that P. parishii exhibits superior photosynthetic performance during its nutrient growth period compared to the reproductive period. This reflects a rational resource allocation strategy: prioritizing reproductive growth during the reproductive period, while focusing on recovery and enhancement of nutrient growth after flowering. These findings offer valuable practical insights. In artificial cultivation or conservation efforts, particular attention should be given to post-flowering care management. This includes ensuring adequate light exposure and nutrient supply after flowering to fully capitalize on the plant’s high photosynthetic efficiency during the nutrient growth period. Such practices will support plant recovery and nutrient accumulation, thereby ensuring consistent flowering quality year after year and maintaining overall plant health.

5. Conclusions

This study compared the photosynthetic physiology and leaf structural characteristics of P. parishii during its reproductive and vegetative growth phases, yielding the following key conclusions: Plants in the nutrient growth period significantly outperformed those in the reproductive period in terms of light energy utilization efficiency, carbon assimilation capacity, and light tolerance. This was manifested by higher apparent quantum efficiency (AQY), maximum net photosynthetic rate (Pmax), and light saturation point (LSP). Structurally, the nutrient growth period exhibited markedly increased stomatal density and thickened mesophyll tissue, alongside significant elevations in chlorophyll a, b, and total chlorophyll content. These changes indicate enhanced physiological activity and light-harvesting capacity within the photosynthetic apparatus. The synergistic alterations in photosynthetic and structural traits reflect P. parishii physiological adaptation during post-flowering nutrient recovery—optimizing photosynthetic performance and accumulating nutrients to accommodate the transition between growth phases. These findings provide crucial physiological and ecological evidence for developing conservation and cultivation strategies for P. parishii.

Author Contributions

Conceptualization, L.L.; methodology, J.T.; software, S.F. and G.H.; validation, X.L.; formal analysis, X.C.; investigation, H.J.; resources, J.T.; data curation, X.W.; writing—original draft preparation, L.L.; writing—review and editing, L.L. and H.J.; visualization, S.F.; supervision, X.W.; project administration, J.T.; funding acquisition, X.W. All authors have read and agreed to the published version of the manuscript.

Funding

This research was funded by Jianmin Tang Assoc. Prof. seven fund projects: Guangxi Natural Science Foundation (Nos. GuikeAB24010014, 2024GXNSFAA010452 and 2023GXNSFAA026253); the National Key Research and Development Program (No. 2022YFF1300703); Guangxi Key Laboratory of Plant Functional Phytochemicals Research and Sustainable Utilization (Nos.: ZRJJ2024-3 and ZRJJ2024-11); Hechi Science and Technology Foundation and Talent Project (Heke AC231113).

Data Availability Statement

Data will be made available on request.

Acknowledgments

The authors used DeepL Translator (Köln, GER) and Grammarly to improve the English language and readability of this manuscript. These tools were used solely for language editing purposes only; no AI tools were used to generate, analyze, or interpret the scientific content. The authors reviewed and verified all content and take full responsibility for the final version of the manuscript.

Conflicts of Interest

The authors declare no conflicts of interest.

Abbreviations

The following abbreviations are used in this manuscript:
P. parishiiPaphiopedilum parishii (Rchb.f.) Stein
TEM_AvgMonthly average temperature
PRETotal monthly precipitation
PARPhotosyntetically Active Radiation
PnNet Photosynthetic Rate
AQYApparent Quantum Efficiency
LSPLight Saturation Point
LCPLight Compensation Point
PmaxMaximum Net Photosynthetic Rate
RdDark Respiration Rate
SLThe long axis of Stomata
SWThe short axis of Stomata
SDStomatal Density
SASingle Stomatal Area
LTLeaf thickness
UETUpper epidermal thickness
LETLower epidermal thickness
MTMesophyll tissue thickness
ChlaChlorophyll a
ChlbChlorophyll b
CarCarotenoids
Chl(a+b)Chlorophyll(a+b)
Chla/ChlbThe ratio of chlorophyll a to b
Car/ChlThe carotenoid-to-total-chlorophyll ratio

References

  1. Liu, J.; Ge, Y.Y.; Hong, Z.; Zhang, Y.; Zhai, W.; Xiang, X.; Tao, Y. Photosynthetic Characteristics of Different Needle Ages in Pinus dabeshanensis Plantation. Anhui Agric. Sci. Bull. 2024, 30, 36–44. [Google Scholar] [CrossRef]
  2. Pan, L.P.; Tang, J.M.; Jiang, H.D.; Zou, R.; Chai, S.; Wei, X. Comparison of Leaf Photosynthesis and Structure between Seedlings and Adult Plants of the Endangered Plant Manglietia aromatica. Mol. Plant Breed. 2023, 1–11. [Google Scholar]
  3. Zhao, L.J.; Quan, J.H.; Zhu, L.Q.; Huang, T.; Jin, Y. Ecological Adaptation of Saplings of the Endangered Plant Bhesa robusta Under Different Habitats. Guihaia 2022, 42, 501–509. [Google Scholar] [CrossRef]
  4. Zhang, J.R.; Fang, L.; Zeng, J.J.; Li, L.; Wu, K.; Zeng, S. Species and Geographical Distribution of Paphiopedilum. Chin. J. Trop. Crops 2024, 45, 1572–1584. [Google Scholar] [CrossRef]
  5. Wang, Z.; Cong, L.; Liu, Y. Research Status of Paphiopedilum. Sci. Silvae Sin. 2006, 7, 113–119. [Google Scholar]
  6. Yin, Y.Y.; Fang, L.; Li, L.; Chen, X.; Fu, W.; Wu, K.; Zeng, S. Research Advances in Flowering Regulation of Paphiopedilum. Chin. J. Trop. Crops 2022, 43, 769–778. [Google Scholar] [CrossRef]
  7. Ran, J.C.; Yu, R.; Liu, J.; Lu, C. Ethnomedicinal Orchids in Maolan Reserve and Their Conservation Strategies. J. Guizhou Norm. Univ. (Nat. Sci.) 2012, 30, 1–5. [Google Scholar] [CrossRef]
  8. Huang, B.Y.; Lyu, H.Z.; Huang, X.Y.; Wei, Y.; Zhang, Z. Investigation on New Resources of Medicinal Orchids in Guangxi. Southwest China J. Agric. Sci. 2012, 25, 1940–1943. [Google Scholar] [CrossRef]
  9. CITES Secretariat. CITES Appendices I, II and III. Convention on International Trade in Endangered Species of Wild Fauna and Flora (CITES). Available online: https://cites.org/eng/app/appendices.php (accessed on 7 February 2025).
  10. Luo, Y.B.; Jia, J.S.; Wang, C.L. A Preliminary Discussion on Conservation Strategies and Potential Resource Advantages of Paphiopedilum in China. Biodivers. Sci. 2003, 6, 491–498. [Google Scholar]
  11. Zhang, Y.; An, M.T.; Wu, J.Y.; Yang, Y.; Li, Z.; Ye, C. Survival Status and Conservation Effectiveness of Subgenus Brachypetalum of Paphiopedilum in China. China Environ. Sci. 2022, 42, 3461–3472. [Google Scholar] [CrossRef]
  12. Flora of China Editorial Committee. Flora of China; Science Press: Beijing, China, 2006; Volume 18. [Google Scholar]
  13. Wei, X.; Zhu, S.J.; Yang, Y.S. Advances in Physiological Ecology and Conservation Genetics of Paphiopedilum (Orchidaceae) in China. Guangxi Sci. 2025, 32, 218–225. [Google Scholar] [CrossRef]
  14. Chen, L.J.; Liu, Z.J. Orchid Mating: The Anther Steps onto the Stigma. Plant Signal. Behav. 2014, 9, e976484. [Google Scholar] [CrossRef]
  15. Kao, H.X.; Zhao, Y.X.; Yang, M.Q.; Sun, Y.; Cheng, J. The Complete Chloroplast Genome Sequences of an Endangered Orchid Species Paphiopedilum parishii (Orchidaceae). Mitochondrial DNA Part B Resour. 2021, 6, 2521–2522. [Google Scholar] [CrossRef]
  16. Gao, X.Z.; Tang, L.; Wang, Y.; Shao, S.; Luo, Y. Intraspecific Variation of the Complete Chloroplast Genome of the Rare and Endangered Paphiopedilum parishii. Guihaia 2024, 1, 1–14. [Google Scholar] [CrossRef]
  17. Zhu, G.F.; Yang, Z.J.; Wang, B.Q.; Zhang, X. Karyotype Analysis of 12 Species in Subgenus Paphiopedilum. J. Trop. Subtrop. Bot. 2011, 19, 152–158. [Google Scholar] [CrossRef]
  18. Gao, J.; Wang, F.; Wu, J.R. Study on the Microstructure of Mycorrhizae in Four Terrestrial Orchids. J. Northwest A&F Univ. (Nat. Sci. Ed.) 2014, 42, 133–140. [Google Scholar] [CrossRef]
  19. Zeng, S.J.; Xia, N.H.; Chen, Z.L.; Wu, K.; Duan, J. Ornamental Value Evaluation of Native Paphiopedilum Species in China and Their Application Prospects in South China. Chin. Wild Plant Res. 2011, 30, 9–13. [Google Scholar] [CrossRef]
  20. Wang, Q.; Jin, Z.X.; Guo, S.L.; Guan, M.; Wang, X. Photosynthetic Eco-Physiological Characteristics of the Endangered Plant Amentotaxus argotaenia. Acta Ecol. Sin. 2014, 34, 6460–6470. [Google Scholar] [CrossRef]
  21. Li, Z.L. Plant Microtechnique, 2nd ed.; Science Press: Beijing, China, 1987. [Google Scholar]
  22. Li, H.S. Principles and Techniques of Plant Physiological Biochemical Experiment; Higher Education Press: Beijing, China, 2000; pp. 134–137. [Google Scholar]
  23. Yang, M.H.; Zeng, X.L.; You, M.H.; Liu, J.; Yang, L. Effects of Drought Intensity on Sexual Reproduction Index and Seed Yield of Arthraxon xinanensis. J. Grassland 2024, 1, 30–35. [Google Scholar] [CrossRef]
  24. Zhao, P.Y.; Zhao, W.; Wang, F.F.; Hou, Z.; Cao, Z.; Wang, K.; Han, Y.; Yang, Y. Seasonal Dynamics of Morphology and Physiological Characteristics of Paeonia ostii. Spec. Wild Econ. Anim. Plant Res. 2022, 44, 98–103. [Google Scholar] [CrossRef]
  25. Jiang, G.M. Plant Physiological Ecology; Higher Education Press: Beijing, China, 2004; pp. 55–58. [Google Scholar]
  26. Taylor, S.H.; Franks, P.J.; Hulme, S.P.; Spriggs, E.; Christin, P.A.; Edwards, E.J.; Woodward, F.I.; Osborne, C.P. Photosynthetic Pathway and Ecological Adaptation Explain Stomatal Trait Diversity Amongst Grasses. New Phytol. 2012, 193, 387–396. [Google Scholar] [CrossRef]
  27. Shi, S.J.; Fu, H.; Liang, Z.L.; Li, B.; Lou, X. Effects of Photoperiod on Stomatal Characteristics and Photosynthetic Properties of Blueberry Leaves. China Fruit Veg. 2025, 45, 26–35. [Google Scholar] [CrossRef]
  28. Li, J.W.; Bai, B.; Hou, Y.Q.; Zhang, L.; He, R.; Guo, Y.; Du, X. Analysis of Stomatal and Photosynthetic Physiological Characteristics of Dryland Winter Wheat Varieties in Semi-Arid Rainfed Area of Northwest China. J. Triticeae Crops 2025, 45, 593–607. [Google Scholar]
  29. Peng, L.H.; Chen, N.; Yang, Z.; Jiang, H.; Wei, X.; Chai, S.; Zeng, D. Comparative Study on Photosynthetic Characteristics and Leaf Anatomical Structure of Three Rare and Endangered Dendrobium Species. J. Chin. Med. Mater. 2024, 47, 2966–2973. [Google Scholar] [CrossRef]
  30. Mu, F.; Feng, B.L.; Gao, X.L.; Miao, F.; Liu, P.T.; Xia, M.Y. Ultrastructure of Leaves at Different Stem Nodes and Growth Stages in Broomcorn Millet. Acta Bot. Boreali-Occident. Sin. 2009, 29, 1–8. [Google Scholar]
  31. Zhang, C.; Wang, X.Y.; Wang, X.R.; Duan, Y.; Zhang, M.; Shi, D.; Zhu, Y.; Song, Y.; Chai, Z.; Li, L. Changes of Photosynthesis and Endogenous Hormones in Andromonoecious Osmanthus fragrans During Different Floral Stages. J. Nanjing For. Univ. (Nat. Sci. Ed.) 2022, 46, 75–80. [Google Scholar] [CrossRef]
  32. Yao, X.M.; Ou, C.; Zhang, Y.L.; Yang, L.; Xu, M.; Wang, Q.; Qu, C. Effects of Abscisic Acid on Ion Absorption and Photosynthesis of Toona sinensis Seedlings Under Salt Stress. J. Northeast For. Univ. 2020, 48, 27–32. [Google Scholar] [CrossRef]
  33. Corrêa de Souza, T.; Magalhães, P.C.; Mauro de Castro, E.; Pereira de Albuquerque, P.E.; Marabesi, M.A. The Influence of ABA on Water Relation, Photosynthesis Parameters, and Chlorophyll Fluorescence Under Drought Conditions in Two Maize Hybrids with Contrasting Drought Resistance. Acta Physiol. Plant. 2013, 35, 515–527. [Google Scholar] [CrossRef]
  34. Zhang, T.D.; Wu, K.; Du, Z.W.; Mei, H.; Liu, Y.; Zheng, Y. Study on Photosynthetic Characteristics and Chlorophyll Content of Sesame at Flowering Stage. Seed 2019, 38, 7–10+17. [Google Scholar] [CrossRef]
  35. Santanoo, S.; Lontom, W.; Dongsansuk, A.; Vongcharoen, K.; Theerakulpisut, P. Photosynthesis Performance at Different Growth Stages, Growth, and Yield of Rice in Saline Fields. Plants 2023, 12, 1903. [Google Scholar] [CrossRef]
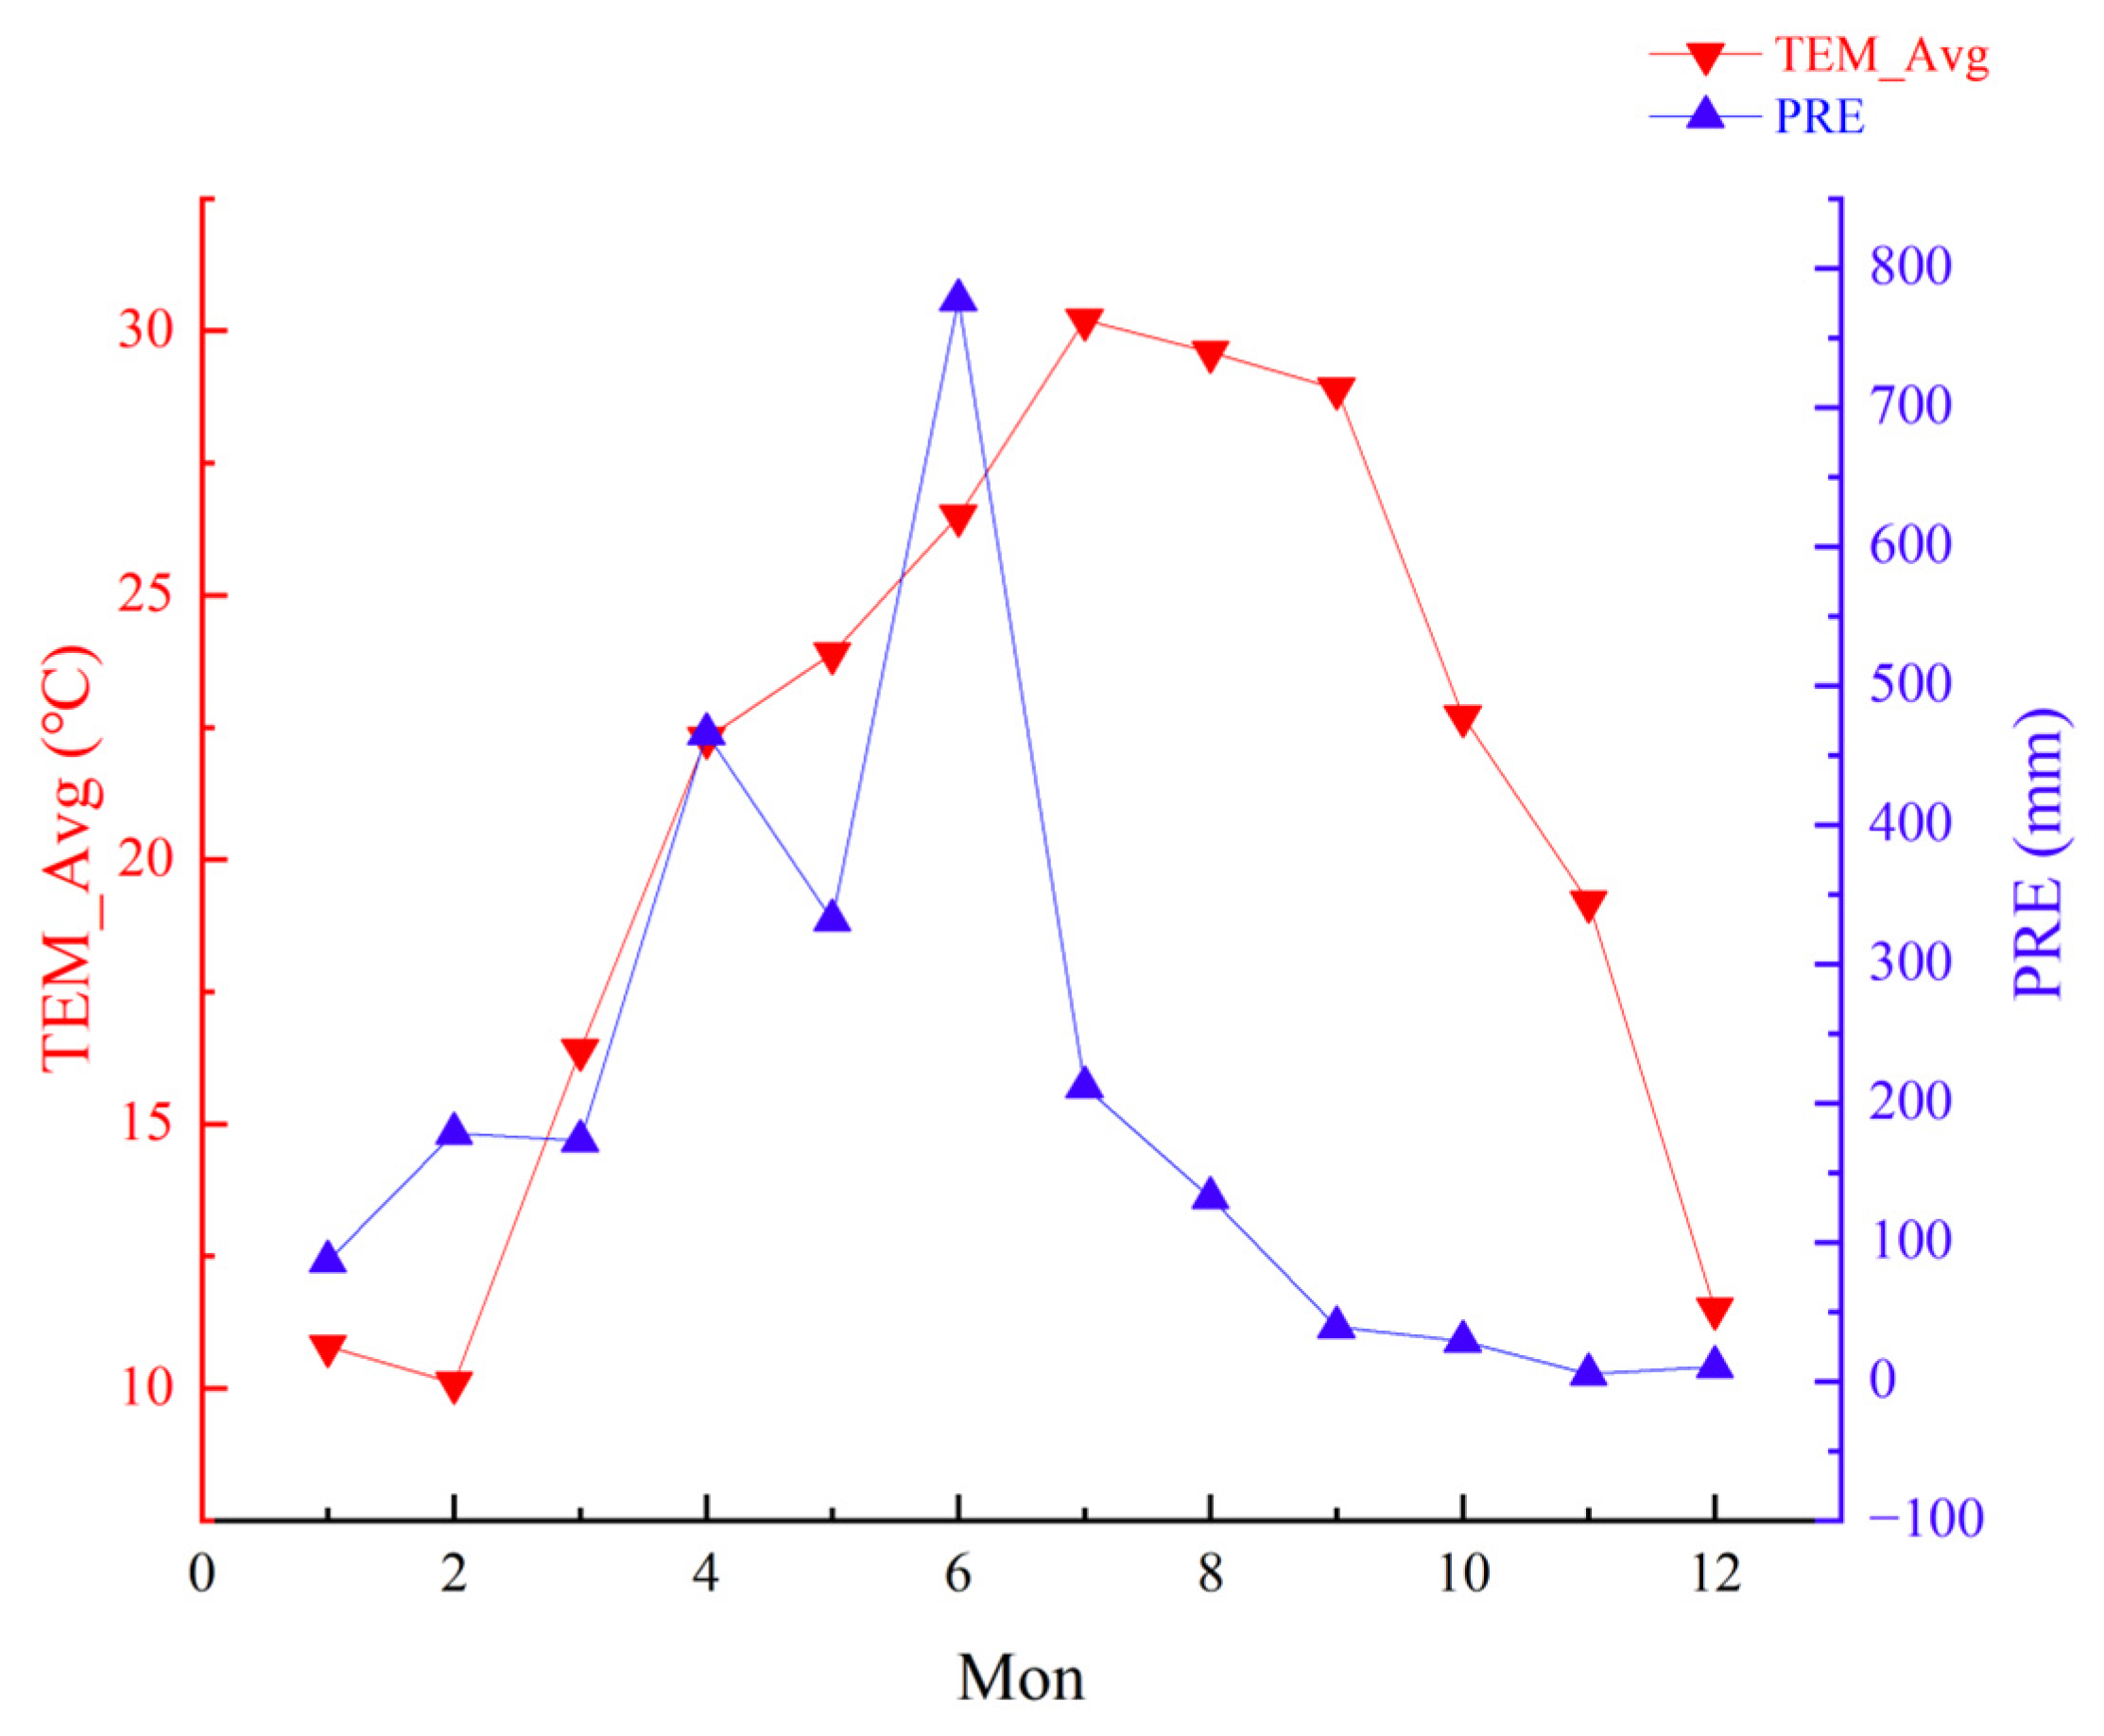
Figure 1. Guilin City rainfall and temperature overview map.
Agronomy 15 02713 g001
Figure 2. Light Response Curves of P. parishii at Different Growth Periods.
Agronomy 15 02713 g002
Figure 3. Leaf epidermal structure of P. parishii in different growth periods ((a): Upper epidermis of the leaf surface during the reproductive growth period. (b): Lower epidermis of the leaf surface during the reproductive growth period. (c): Stomata of the leaf surface during the reproductive growth period. (d): Upper epidermis of the leaf surface during the nutrient growth period. (e): Lower epidermis of the leaf surface during the nutrient growth period. (f): Stomata of the leaf surface during the nutrient growth period).
Agronomy 15 02713 g003
Figure 4. Anatomical structure of leaves of P. parishii in different growth periods. ((a): Anatomical structure of the leaf during the reproductive growth period. (b): Anatomical structure of the leaf during the nutrient growth period).
Agronomy 15 02713 g004
Figure 5. Correlation analysis of leaf structure and photosynthetic physiology. (Upper triangle: Reproductive growth period; lower triangle: Nutrient growth period; * indicates p < 0.05; ** means p < 0.01).
Agronomy 15 02713 g005
Table 1. Light Response Parameters of P. parishii at Different Growth Periods.
Growth PeriodAQY (mol·mol−1)Pmax (μmol·m−2·s−1)LSP (μmol·m−2·s−1)LCP (μmol·m−2·s−1)Rd (μmol·m−2·s−1)
Nutrient0.0103 ± 0.0012 b2.0274 ± 0.0103 b440.5724 ± 8.1323 b9.6067 ± 1.4269 a0.6633 ± 0.1254 a
Reproductive0.0120 ± 0.0020 a2.2391 ± 0.0514 a448.4288 ± 6.6514 a9.6102 ± 1.6677 a0.6850 ± 0.1526 a
Note: Different lowercase letters in the same column indicate significant differences (p < 0.05) according to Duncan’s multiple range test.
Table 2. Comparison of Stomatal Characteristics of P. parishii in Different Growth Periods.
Growth PeriodSL (μm)SW (μm)SD (Individual·mm−2)SA (μm2)
Nutrient41.014 ± 2.0896 a38.719 ± 2.4801 a78.730 ± 6.8252 b1248.354 ± 122.9003 a
Reproductive40.009 ± 1.5160 b37.586 ± 2.7082 b84.444 ± 13.4020 a1182.354 ± 117.7894 b
Note: Different lowercase letters in the same column indicate significant differences (p < 0.05) according to Duncan’s multiple range test.
Table 3. Comparison of Tissue Thickness of P. parishii Leaves at Different Growth Periods.
Growth PeriodLeaf Thickness (LT, μm)Upper Epidermal Thickness (UET, μm)Lower Epidermal Thickness (LET, μm)Mesophyll Tissue
Thickness (MT, μm)
Nutrient1236.40 ± 20.34 b629.03 ± 30.04 a69.61 ± 7.04 a538.24 ± 28.86 b
Reproductive1334.89 ± 19.22 a638.86 ± 41.12 a74.05 ± 7.16 a623.32 ± 30.64 a
Note: Different lowercase letters in the same column indicate significant differences (p < 0.05) according to Duncan’s multiple range test.
Table 4. Comparison of leaf tissue thickness and its ratio of P. parishii in Different Growth Periods.
Growth PeriodChla (mg·g−1)Chlb (mg·g−1)Car (mg·g−1)Chl (a + b) (mg·g−1)Chla/ChlbCar/Chl
Nutrient2.4183 ± 0.0054 b1.5136 ± 0.0017 b0.3957 ± 0.0041 b3.9319 ± 0.0038 b1.5976 ± 0.0053 b0.1006 ± 0.0011 a
Reproductive2.4971 ± 0.0032 a1.5264 ± 0.0011 a0.4095 ± 0.0016 a4.0235 ± 0.0026 a1.6360 ± 0.0030 a0.1018 ± 0.0003 a
Note: Different lowercase letters in the same column indicate significant differences (p < 0.05) according to Duncan’s multiple range test.
Disclaimer/Publisher’s Note: The statements, opinions and data contained in all publications are solely those of the individual author(s) and contributor(s) and not of MDPI and/or the editor(s). MDPI and/or the editor(s) disclaim responsibility for any injury to people or property resulting from any ideas, methods, instructions or products referred to in the content.