Article

Sugarcane Genetic Diversity Study of Germplasm Bank and Assessment of a Core Collection †

by
Maria Francisca Perera
*,
Andrea Natalia Peña Malavera
,
Diego Daniel Henriquez
,
Aldo Sergio Noguera
,
Josefina Racedo
and
Santiago Ostengo
Instituto de Tecnología Agroindustrial del Noroeste Argentino (ITANOA), Estación Experimental Agroindustrial Obispo Colombres (EEAOC)—Consejo Nacional de Investigaciones Científicas y Técnicas (CONICET), CCT NOA Sur. Av. William Cross 3150, Las Talitas T4101XAC, Tucumán, Argentina
*
Author to whom correspondence should be addressed.
This paper is an extended version of our paper published in Perera, M.F.; Peña Malavera, A.N.; Noguera, A.S.; Racedo, J.; Ostengo, S. Sugarcane genetic diversity study of EEAOC´s germplasm bank and assessment of a core collection. In Proceedings of the ISSCT XXXII Centennial Congress 2025, Cali, Colombia, 24–28 August 2025.
Agronomy 2025, 15(11), 2638; https://doi.org/10.3390/agronomy15112638
Submission received: 24 July 2025 / Revised: 20 August 2025 / Accepted: 12 November 2025 / Published: 18 November 2025
(This article belongs to the Section Crop Breeding and Genetics)

Abstract

Understanding the genetic diversity and population structure of sugarcane germplasm banks is essential for generating progenies with maximum variability. In this study, 350 accessions from the EEAOC germplasm bank were genotyped using DArT-seq markers. Genetic diversity, population structure, and variability were assessed through Bayesian analysis, principal coordinate analysis (PCoA), and analysis of molecular variance (AMOVA). Additionally, different sizes of core collections were evaluated. After filtering, 74,969 high-quality SNPs were retained, and two outlier genotypes were excluded. The mean observed heterozygosity (HO) was 0.28, while the mean expected heterozygosity (HE) was 0.3. Polymorphic information content (PIC) values ranged from 0 to 0.38 (mean 0.22), and the mean discrimination power (Dj) was 0.28. Structure and PCoA analyses consistently revealed three genetic clusters. AMOVA indicated that most of the genetic variation was found within subpopulations, while 10.25% was attributable to differences among them (p < 0.0001), where ΦFST suggested moderate genetic differentiation. Core collection analysis showed that a subset of 35 genotypes (10%) captured nearly 96% of the total genetic diversity, while a 30% core captured over 98%. These results provide valuable information for the effective management and utilization of sugarcane genetic resources and support the design of breeding strategies to develop superior cultivars.

1. Introduction

Cultivated sugarcane (Saccharum interspecific hybrids) is a perennial C4 grass crop recognized as the most productive bioenergy crop due to its ability to produce high biomass [1]. These hybrids are polyploidy, aneuploidy, with variable numbers of chromosomes; therefore, they exhibit high levels of allelic variation among individuals in the same locus [2]. Modern cultivars are all derived from a few interspecific hybridizations performed a century ago between “sweet” octoploid S. officinarum and “wild” polyploidy S. spontaneum. To restore high sugar yield, hybrids underwent successive backcrosses with S. officinarum. As a result, modern cultivars retain approximately 80% of the S. officinarum genome, 10% of S. spontaneum, and 10% recombinants between the two genomes [3].
Sugarcane is cultivated in tropical and subtropical regions as the main source of sucrose, accounting for nearly 80% of global sugar production. Beyond its role as a food commodity, sugarcane also holds worldwide economic importance as a key feedstock for ethanol production, electricity cogeneration, and as a biorefinery resource for the generation of numerous by-products.
Argentina has three sugarcane breeding programs, Estación Experimental Agroindustrial Obispo Colombres (EEAOC), Instituto Nacional de Tecnología Agropecuaria (INTA) and Chacra Experimental Agrícola Santa Rosa (Chacra), with specific regional scopes and goals [4]. Tucumán, the leading sugar-producing province (responsible for more than 66% of the national output) relies predominantly on varieties developed by the breeding program of the EEAOC. Since 2009, this program has released nine TUC varieties. Over 98% of the sugarcane area surveyed in the province is planted with cultivars developed by EEAOC, underscoring its central role in the regional sugarcane industry [4]. The whole breeding process is labor-intensive and time consuming; each cycle starts with parental selection and takes between 11 and 14 years from crossing to variety release. Parents are selected from the germplasm collection that mainly involves advanced clones and commercial varieties of national and foreign origin [4]. This selection is based on phenotypic characteristics (yield performance, sugar content, disease resistant and other agronomic traits) and progeny performance. Selection based on phenotype, for parents and clones, can be challenging due to confounding environmental effects and the quantitative nature of the traits with low to moderate heritability [1].
The basis of any breeding program relays in their genetic variability. The manipulation of this variability through suitable methods leads to the generation of superior genotypes with agronomic characteristics of interest. In that sense, the knowledge of germplasm diversity and genetic relationships could be an invaluable aid in crop improvement strategies to guide hybridization schemes [5]. For that, germplasm banks have an essential role in preserving this genetic variability, although the management could be complex due to the large number of accessions [6]. Redundancy of alleles should be reduced to a minimum, and the introduction of new accessions should be optimized to broaden the genetic base, thus expanding the gene pool.
Crop improvement and conservation programs to ensure the long-term use of genetic resources require a thorough understanding of genetic diversity and population structure of germplasm banks [7]. In general, they have several accessions but only a small proportion of these resources are used in practice. Hence, it is crucial to optimize the use of these resources by grouping enough accessions in a core collection that maximizes the genetic diversity described in the whole collection.
Diverse data sets have been used to analyze genetic diversity in crop plants, with DNA-based markers allowing more reliable differentiation of genotypes [5]. Previously, the genetic diversity and population structure of only a few sugarcane genotypes from EEAOC’s germplasm bank were characterized using AFLP [4] and TRAP and SSR markers [8] (36 and 47 genotypes, respectively). At present, single-nucleotide polymorphisms (SNPs) are the preferred molecular markers for assessing genetic diversity, as they are abundant, reliable, suitable for high-throughput automated genotyping, and provide highly reproducible results. In addition, their efficiency and cost-effectiveness have made them a superior alternative to earlier types of molecular markers for variant detection [9]. The aim of the present work was to study a wider set of accessions and to provide further insight into the genetic diversity and structure of the sugarcane germplasm bank of EEAOC. Thus, a core collection could be established to optimize resource use. Almost half of the germplasm bank of EEAOC was molecularly characterized by a significant number of SNPs, which also allowed the assessment of a core collection that captured most of the genetic diversity and optimized resources.

2. Materials and Methods

2.1. Plant Material

The population involved 350 sugarcane genotypes out of the 789 that constitute the germplasm collection of the EEAOC’s breeding program [4]. While most of them were the most frequently used as parents for crossing, others were included to capture allele diversity. Genotypes are maintained in the experimental field of the EEAOC Central Research Station located in Las Talitas city, Tucumán province, Argentina (Table S1).
For sampling, +1 young leaves (the first one fully expanded) of three plants from each genotype were collected.

2.2. DNA Extraction

DNA was extracted from ~100 mg frozen leaf tissue following the Diversity Arrays Technology (DArT) Pty Ltd. protocol (www.diversityarrays.com/orderinstructions/plant-dna-extraction-protocol-for-dart; accessed on 2 November 2025). The quality and quantity of DNA were verified on 0.8% agarose gels, stained with gelred.

2.3. DArT-Seq

Genotyping of all accessions was performed using the DArT-seq platform (Yarralumla, Australia), which combines genome complexity reduction with next-generation sequencing. The approach selectively targets genomic regions that are mainly associated with coding sequences, which are subsequently sequenced through NGS technologies. The raw sequence data were processed with the proprietary DArT-seq analytical pipelines. In brief, SNP detection involved clustering all sequence tags from the libraries using the C++ algorithm implemented in DArTsoft14 and then assigning them to SNP loci according to a set of technical parameters. Quality control included the removal of markers with a minor allele frequency (MAF) below 0.1. Genotyping data were classified into three classes, as 0: reference homozygote; 1: homozygous for SNP; and 2: heterozygous, since allele dosage was not inferred. Data were recoded according to the software used for the different analyses.

2.4. Polymorphism Level in Genotyping Data

Statistics descriptive of polymorphism level of genotyping data were computed for SNP markers across all accessions using R: effective number of alleles (Ne), null allele frequency (NA), observed heterozygosity (HO), expected heterozygosity (HE), polymorphism information content (PIC) and discriminating power (Dj).
The Ne is the number of equally frequent alleles that would be required to achieve the same HE and thus enumerates alleles expected at a locus in the studied population [10].
The HO is the percentage of loci in a population that is heterozygous, and it is determined for each locus by dividing the total number of heterozygotes by the sample size. In contrast, HE in multi-locus systems is the likelihood that the population will be heterozygous across the locus being assessed, i.e., the projected percentage of the population that would be heterozygous for each randomly selected locus [11].
PIC was used to measure the information of a given marker locus, while Dj was employed as a measure of marker efficiency for the purpose of identification of accession, i.e., the probability that two randomly chosen individuals have different patterns [12].
Distance-based methods proceed by calculating a pairwise distance matrix, the entries of which provide the distance between every pair of individuals. This matrix may then be represented using some convenient graphical tool, such as a dendrogram. Cluster analyses were carried out using Ward method and distances expressed as 1–S. All calculations were carried out by circlize and dendextend libraries in R (4.4.0 version).

2.5. Genetic Structure Analysis

To assess the overall germplasm structuring, three approaches with different grouping criteria were used, a Bayesian model-based approach, principal coordinate analysis (PCoA) and analysis of molecular variance (AMOVA).
The population structure was investigated using the Bayesian algorithm implemented in the LEA package of R. Models were fitted considering values of K ranging from 2 to 10, in order to infer the most likely number of genetic clusters and to estimate the probability of assignment of each individual. This method detects allele frequency differences and allocates individuals to subpopulations by maximizing likelihood values. The procedure begins with a random allocation of individuals into a fixed number of groups, followed by estimation of allele frequencies within each group and iterative reassignment of individuals according to those estimates. Through multiple burn-in iterations, the model converges toward stable allele frequency distributions and membership coefficients, which sum to one for each individual across all clusters. To compare the resulting groups with those previously obtained by cluster analyses, Pearson’s chi-square test was applied to categorical data.
In parallel, PCoA was conducted as an alternative multivariate approach. Unlike Bayesian clustering, this method does not assume Hardy–Weinberg equilibrium, linkage equilibrium, or explicit evolutionary models. The procedure involves a principal component transformation of the genetic distance matrix, followed by a discriminant analysis applied to the retained axes in order to visualize genetic differentiation among individuals.
AMOVA was determined by using pegas package in R considering the subpopulations found by structure analysis.

2.6. Core Collection

Different samples were generated by changing the size parameter of the desired core collections (10, 20 and 30%), to identify the subset of genotypes that could capture the entire diversity of alleles by using R package corehunter 3.0. The following optimization objective was selected in corehunter: EN, average entry-to-nearest-entry distance. This option maximizes the average distance between each selected individual and the closest other selected item in the core; this favors diverse cores in which each individual is sufficiently different from the most similar other selected item. For each sample, the genetic diversity parameters were determined.
For an efficient utilization of the genotypes included in the core collections in sugarcane breeding, agronomic characterization should be considered to identify genotypes of special interest for particular traits. In order to identify genotypes belonging to the 30% core collection with the best behavior for agronomic traits of interest, a principal components analysis was adjusted using as input variables: PCoA 1 and 2 axes obtained through the molecular analysis, sugar recovered (SR%) and stalk weight (SW). Sugar recovered was determined in the whole population, following procedures described in Diez et al. [13]. Briefly, samples of 10 stalks were randomly collected from each plot, at first ratoon. Stalks were cleaned, topped and processed in the laboratory using a cane hammer shredder (Legar S.R.L., Tucumán, Argentina; about 95% open cell), and the juice was extracted using a hydraulic press (Legar S.R.L., Tucumán, Argentina; subjected to a pressure of 240 kg cm−2 per min). Regarding biomass, the SW was determined by weighing 10 stalks randomly sampled from each plot. Phenotypic data were analyzed using mixed linear models in order to obtain the genetic predictors (BLUPs) for each trait (Table S2).

3. Results

3.1. Genetic Diversity

To study genetic diversity, 350 genotypes from the EEAOC germplasm bank were characterized using DArT-seq, yielding a total of 74,969 SNPs. In the initial analysis, two genotypes (L 79-1002 and POJ 28-78) were identified as outliers and removed, and the analysis was repeated on the remaining 348 genotypes.
Descriptive statistics for the 348 genotypes are presented in Table 1. The mean HO was 0.28 (range: 0–1), while the HE ranged from 0 to 0.5, with a mean of 0.3. The average PIC value obtained was 0.22, with a maximum of 0.38 for several SNPs. Of the 74,969 SNPs, 39,622 had PIC values between 0.25 and 0.38, representing the most informative markers for differentiating genotypes. The mean Dj was 0.28.
According to the circular dendrogram generated using SNP data, the 348 genotypes were clustered into three main groups (Figure 1 and Table S1). The first group included 125 genotypes, the second 154 and the third only 69. Interestingly, for all breeding programs represented by multiple genotypes, individuals were distributed across the three genetic groups (CO, CP, FAM, HOCP, L, NA and TUC, Table S3).

3.2. Genetic Structure Analysis

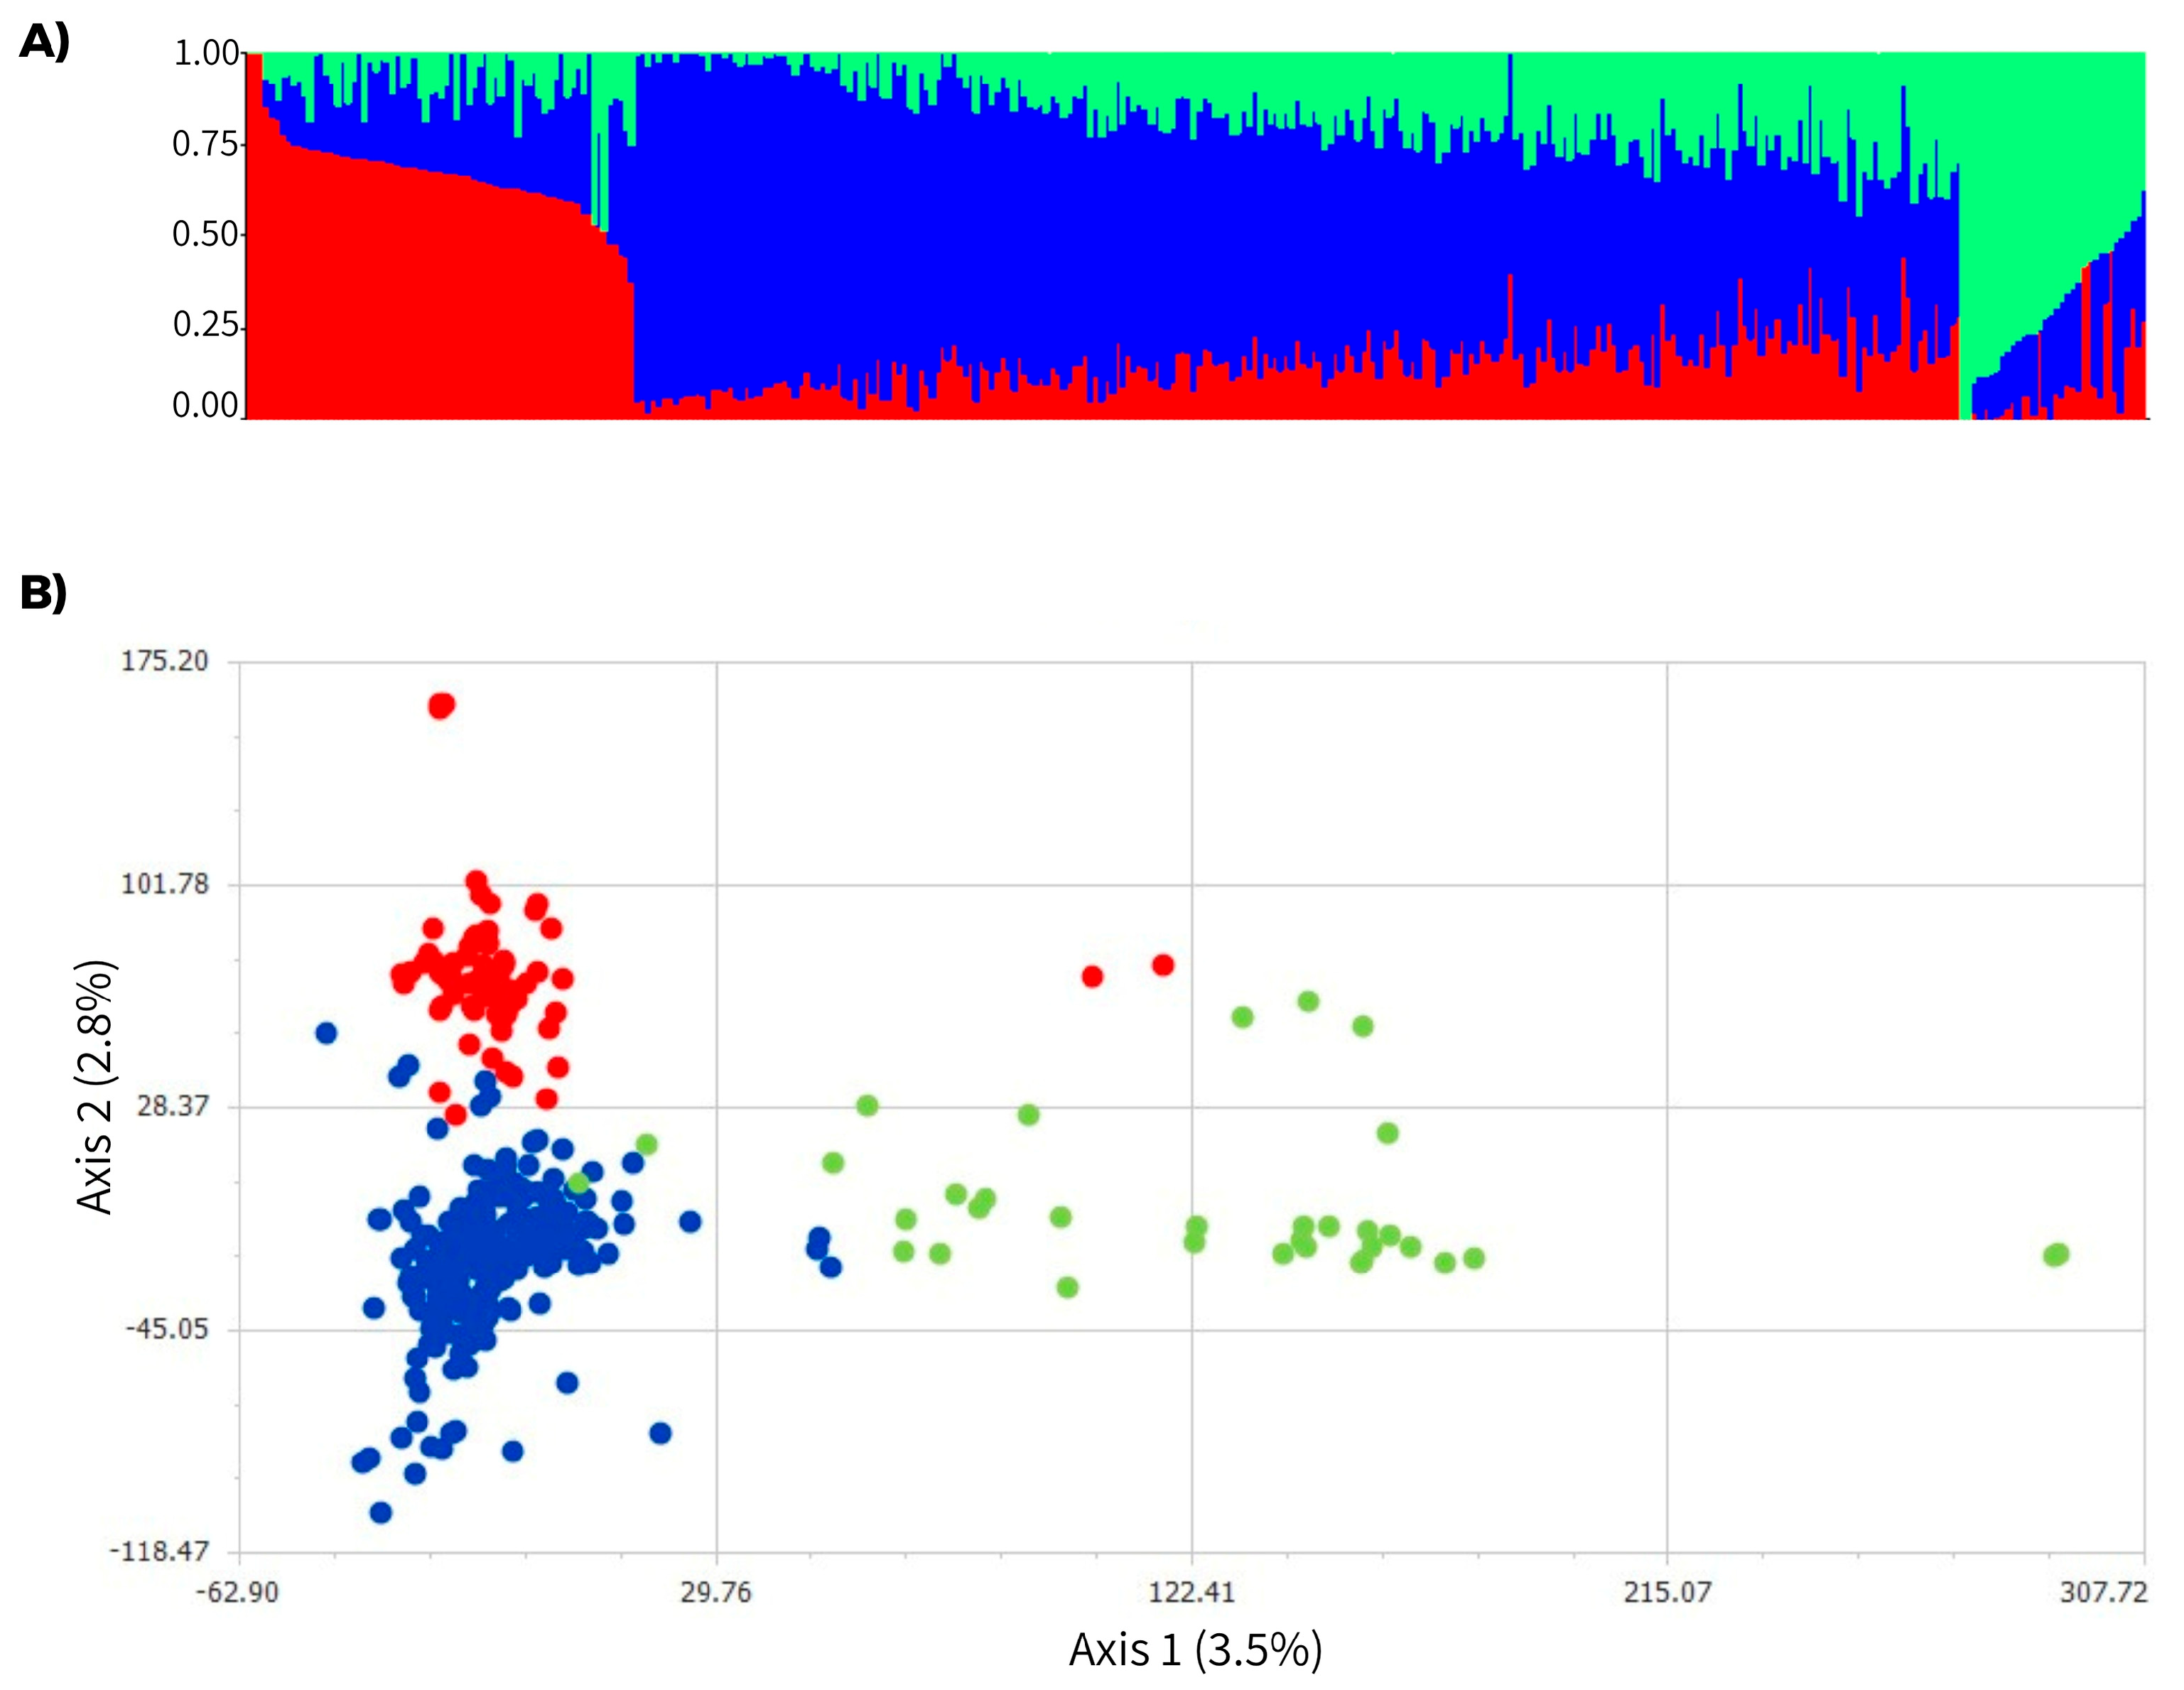
Regarding the structure analysis conducted using the Bayesian method, an optimal K = 3 was obtained. Accessions were assigned to groups according to their highest membership probabilities. Group I included 71 genotypes, group II 243 genotypes, and group III 34 genotypes (Figure 2A and Table S1). Group II clustered most of the genotypes, mainly those of foreign origins (CB, CO, CP, FAM, NA, NCO, R, SP, US and VESTA), whereas TUC, HO, HOCP, L and LCP genotypes were distributed across the three groups. While K = 3 was optimal for SNP data, the analysis was repeated using a 60% membership threshold (to account for genotypes with low maximum probabilities of belonging to a single group), which identified a new admixture group of 103 genotypes (Table S4).
Subsequently, the diversity pattern of the collection was represented through a PCoA performed with the LEA package (Figure 2B). The first two coordinates cumulatively accounted for 6.3% of the total variation, revealing that genotypes consistently clustered into three groups, as observed in the Bayesian structure analysis.
When the groups obtained by structure analysis were compared with those from the cluster analyses, Pearson’s chi-square test revealed a correlation of r = 0.32 and a value of 64.10 (p < 0.0001). This indicated that although genotypes in each group were slightly different, there was a moderate correspondence between groups obtained by both analyses (Table S5).
Considering the three groups detected by structure analysis, AMOVA was performed. It indicated that a greater percentage of variation existed within subpopulations (89.75%) than among them (10.25%; p < 0.0001). The ΦFST index (10%) reflected moderate genetic differentiation among the three groups identified in this study.

3.3. Core Collection

In order to identify a core collection capturing most of the genetic diversity with a reduced number of genotypes, three different sizes were tested. Interestingly, a core collection of 35 genotypes (10%) captured almost 96% of the diversity (Table 2).
Regarding the agronomic characterization of individuals in each core collection, average values of SR% and SW are presented in Table 2. Although values were similar among the core collections and the entire population, SR% slightly increased as more genotypes were included, whereas the opposite trend was observed for SW.
As shown in Figure 3 and Table 3, most genotypes in the smallest core collection were included in the larger ones. Descriptive statistics across the three core collections are presented in Table S6.
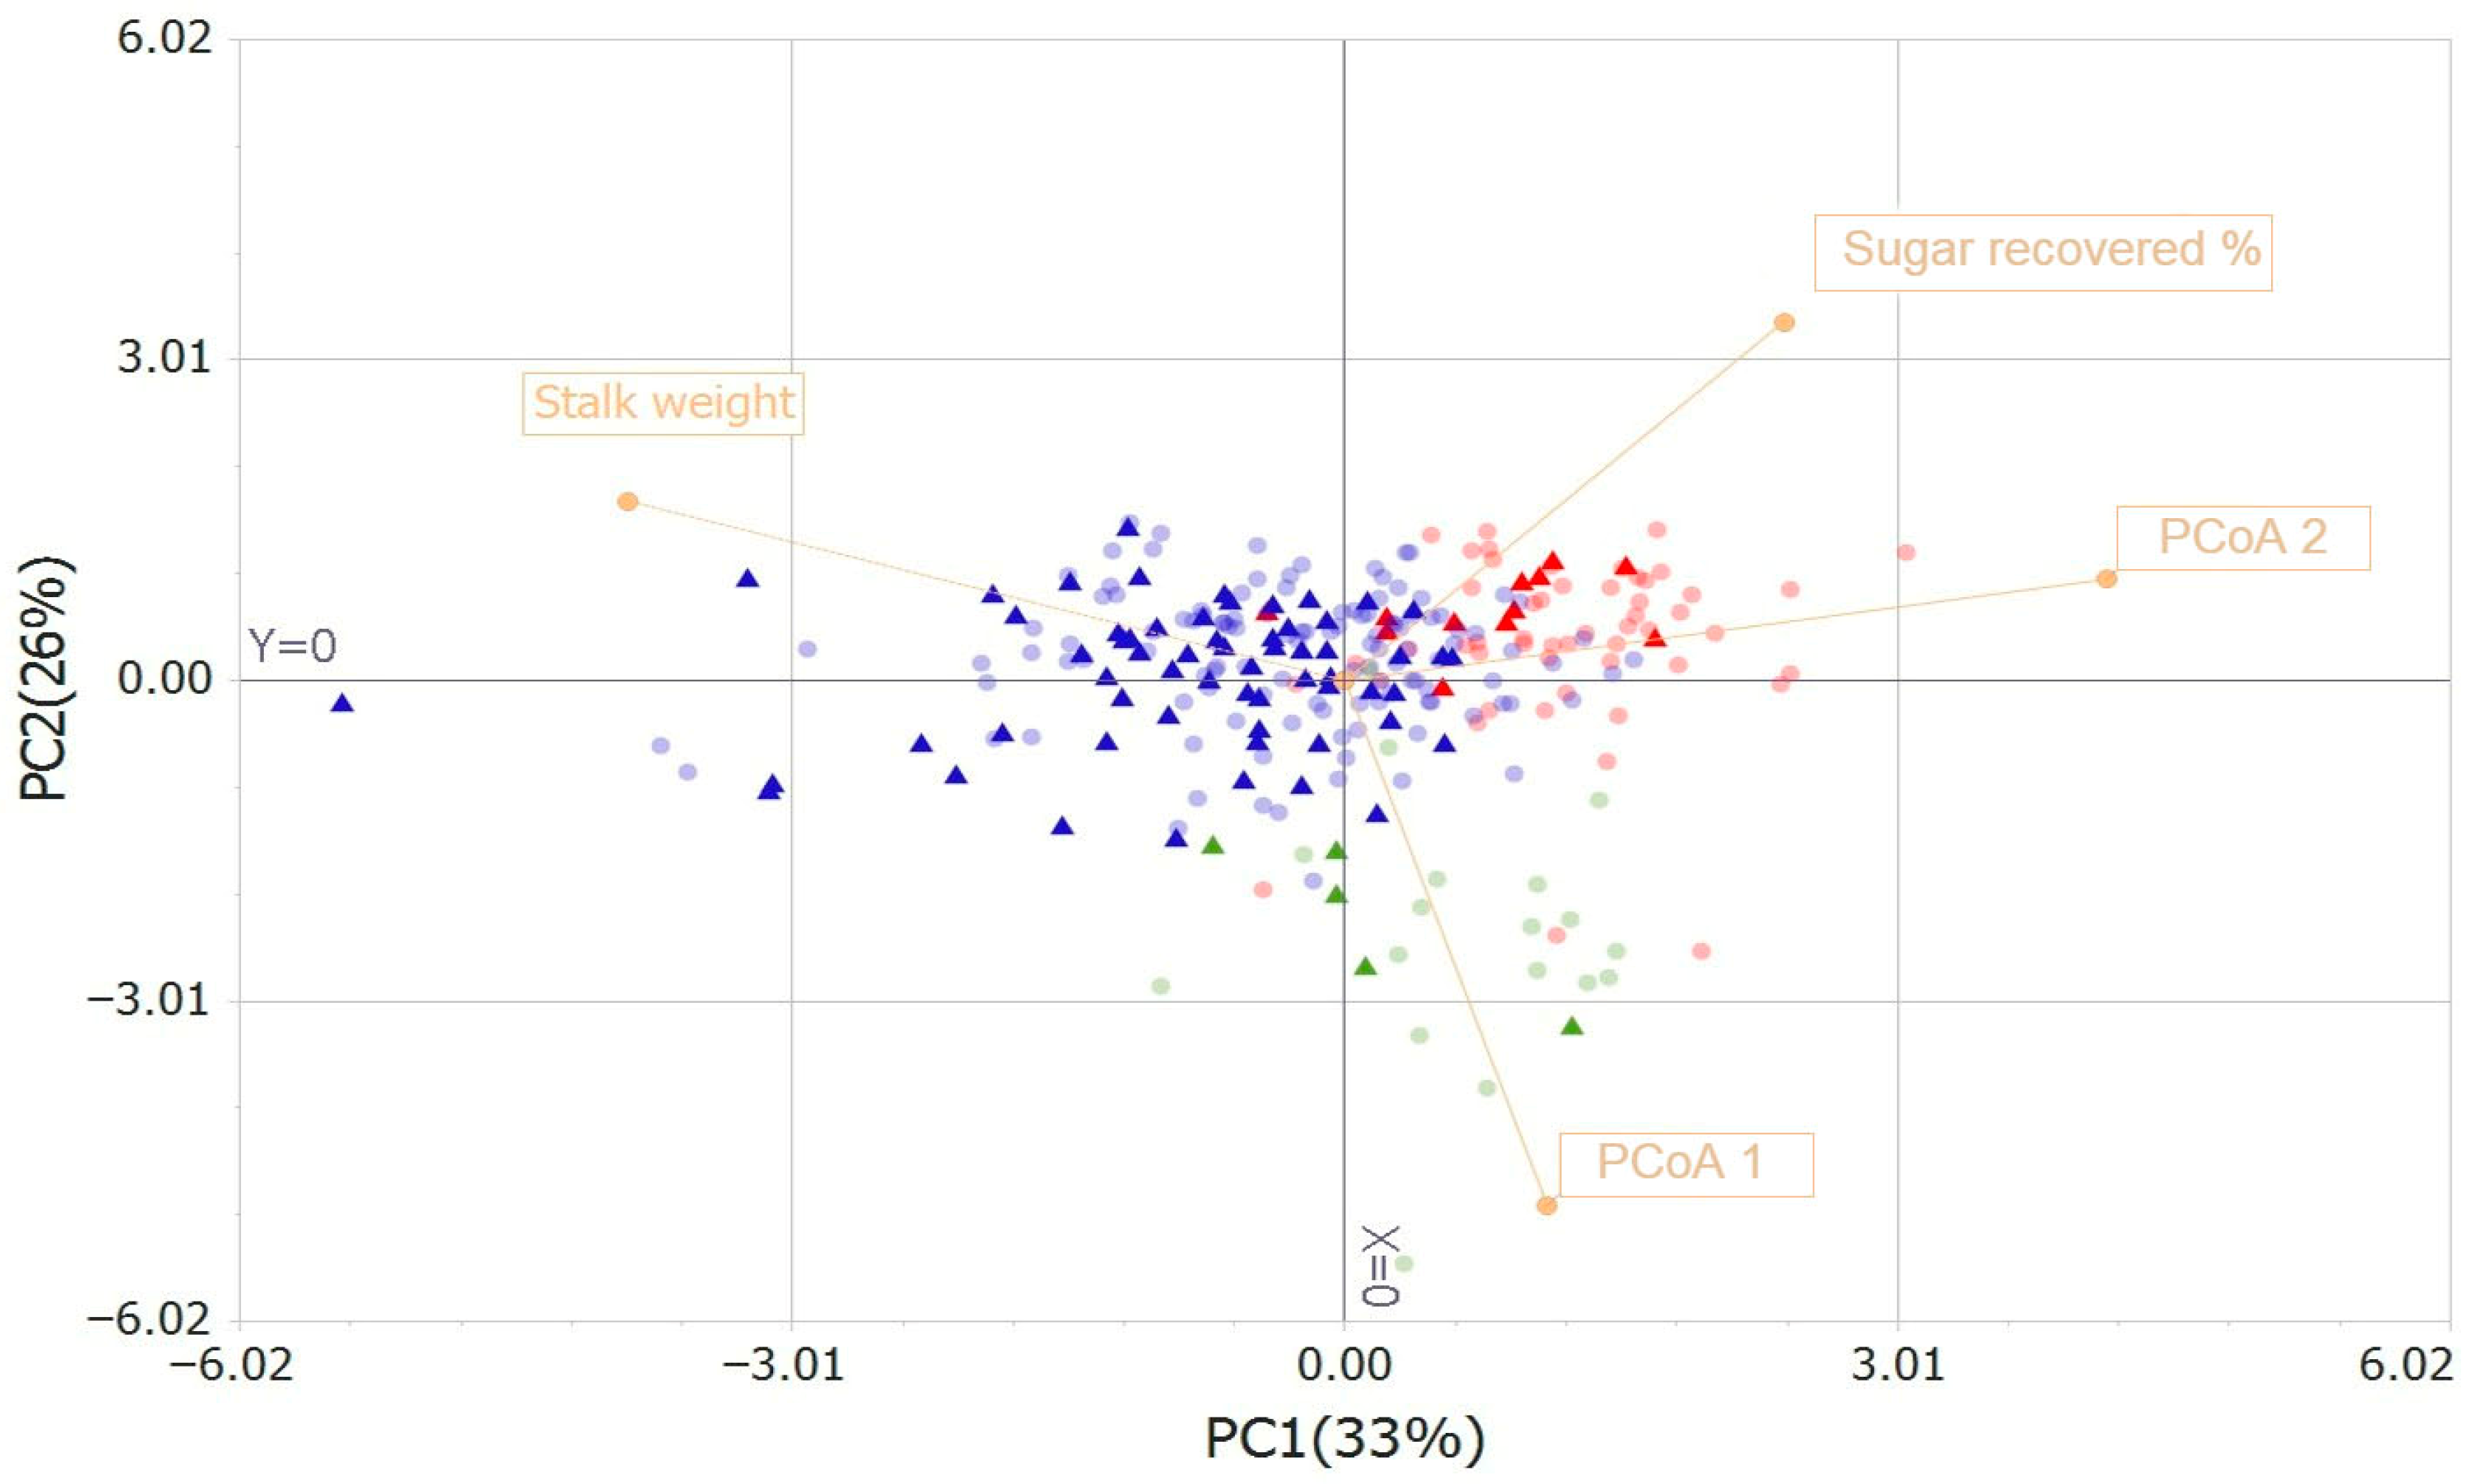
When PCA was performed (Figure 4) on the 104 genotypes of the 30% core collection, 5 genotypes exhibited high SR%, whereas 22 were associated with high SW (biomass). These genotypes are listed in Table 3. Both PCA axes explained 59% of the total variability. Interestingly, because several genotypes with high SW were included in the 30% core collection, the average SW value is higher in the core than in the entire population.

4. Discussion

A better understanding of the genetic diversity and the existence of population structure in the available sugarcane germplasm is a necessary first step to determine how to compartmentalize the observed variation in the collection [14] and to guide hybridization schemes that better exploit heterosis, thereby providing new opportunities for sugarcane breeding programs [15].
To study the genetic diversity of EEAOC’s sugarcane germplasm bank, 348 genotypes were characterized using 74,969 SNPs. The highly polyploid nature of sugarcane’s genome required intensive sequencing depth to accurately characterize individuals [16]. Descriptive analysis suggested that HO was slightly lower than HE, which could indicate some degree of inbreeding [7]. The average PIC value obtained was 0.22, similar to results previously reported for a subset of these genotypes using TRAP (0.24) and SSR (0.26) markers [8]. In barley, an average PIC of 0.216 also indicated high genetic diversity among genotypes [9]. However, the maximum PIC value for several SNPs was 0.38; these markers were the most suitable for differentiating sugarcane genotypes, as Kanaka et al. [7] suggested that markers with PIC values between 0.25 and 0.50 are considered informative, whereas values below 0.25 are uninformative.
Cluster analysis, Bayesian model-based structure analysis and PCoA revealed three groups, with a significant moderate correspondence between genotypes in each group. This moderate correlation could be attributed to the fact that numerous genotypes (103) could be considered admixture if the membership threshold in the Bayesian method is increased to 60%. Furthermore, previous results from one of the two world sugarcane collections revealed some differences between groups obtained by both analyses [16]. Melchinger [17] compared the efficiency of PCoA and cluster analysis in assessing genetic diversity in crop plants; in general, PCoA provided a faithful representation of relationships between major groups of individuals, but pedigree relationships were often distorted when a small proportion (<25%) of the total variation was explained by the first two or three principal coordinates, likely as in the present study.
Interestingly, TUC, HO, HOCP, L and LCP genotypes were distributed across all groups identified through the various analyses. This pattern is consistent with the findings of Perera et al. [8], who, using TRAP and SSR in a subset of varieties from EEAOC’s breeding program, reported that U.S. genotypes were present in all subgroups within the EEAOC cluster group, which was clearly differentiated from the Brazilian cluster. The EEAOC breeding program maintained an active variety exchange with sugarcane breeding programs in Florida (USDA-ARS, Sugarcane Field Station, Canal Point, CP varieties) and Louisiana (Louisiana State University Agricultural Center, L varieties; and USDA-ARS, Sugarcane Research Unit, Houma, HO varieties) [4]. This exchange likely explains the number of shared SNPs between TUC genotypes and those from the US breeding programs.
Although structure analysis identified three groups, reanalysis with a 60% membership threshold revealed a new group consisting of 103 genotypes. These individuals, distributed among the three groups in the first analysis, can be classified as admixed, similar to a previous structure analysis of Brazilian grapevine genotypes using a lower probability threshold of 0.70 [6].
AMOVA indicated a greater percentage of variation within subpopulations than among them, and the presence of diversity within genotypes confirmed their potential as a source of breeding material. Similarly, when 254 sugarcane accessions from a Brazilian germplasm were characterized using TRAP markers, molecular variance was higher within populations than among them [12]. Comparable results were reported in other studies [18,19,20]. The ΦFST index indicated moderate genetic differentiation among the three groups identified. This index reflects the degree of gene differentiation among populations in terms of allele frequencies where subpopulations that do not intermate exhibit allele frequencies different from those of the total population [21]. According to Wright [22], ΦFST values between 0 and 0.05 indicate low population differentiation, whereas values of 0.05–0.15 and 0.15–0.25 correspond to moderate and high genetic differentiation, respectively.
A core collection with a reduced number of non-redundant genotypes, representative of the maximum genetic diversity in the entire germplasm collection, allows efficient management of resources while maximizing genetic gain [1]. Notably, a core collection of 35 genotypes (10%) captured almost 96% of the diversity, with most genotypes in the smallest core included in the larger ones. In a previous study, 47 genotypes, including advanced clones and commercial varieties of national and foreign origin frequently used as parents in the EEAOC breeding program and included in the present study, were molecularly characterized using TRAP and SSR markers [8]. Of these 47 genotypes, only 1 was included in the 20% core collection (TUC 96-52), 3 in the 30% core collection (TUC 00-23, TUC 01-2, TUC 02-22), and 4 in both core collections (LCP 85-376, TUC 00-19, TUC 07-21, TUC 95-46) (Table 3). These core collections were constructed to provide a logical subset of germplasm for evaluation when the entire collection cannot be used. They will also be useful for the breeding program to include new parents in crossing schemes. In this context, genotypes of diverse origins such as CB, CO, R and SUMATRA can contribute new alleles to progenies. Additionally, individuals from CP, FAM, HO, HOCP, L, NA and TUC programs will serve as a source of variability. However, linkage of undesirable alleles with useful genes could hinder efficient utilization of these genotypes in breeding. Therefore, complementary criteria, such as phenotypic and agronomic characterization and their adaptive traits, should be associated with the core collection to ensure it is fully representative and to identify genotypes of particular interest. Sugar recovered (SW%) and stalk weight (SW) were measured, and genotypes with higher values were identified. These results will enable more effective introgression of useful alleles [1].

5. Conclusions

In this work, the study presented in [23] is expanded upon. The present study provides a comprehensive molecular characterization of the EEAOC sugarcane germplasm bank using high-throughput SNP genotyping obtained through DArT-seq. Genetic diversity and structure analyses, including a Bayesian model-based approach and PCoA revealed three major groups with moderate differentiation, with most of the variability occurring within groups rather than between them, as indicated by AMOVA. Despite sugarcane’s complex polyploid genome, the HO and PIC values suggest a broad but unevenly distributed genetic base. Notably, a core collection comprising only 10% of the genotypes captured nearly 96% of the total diversity, providing a powerful and manageable subset for future breeding efforts. Furthermore, the integration of molecular and phenotypic data (SW and SR%) in the 30% core collection further enhances its utility for targeted selection and breeding design. In summary, these results enable more strategic and efficient use of genetic resources, facilitating the identification of underused parental genotypes to exploit heterosis in sugarcane.

Supplementary Materials

The following supporting information can be downloaded at: https://www.mdpi.com/article/10.3390/agronomy15112638/s1, Table S1: Genotypes, origin, cluster and structure groups; Table S2: Genetic predictors (BLUPs) for sugar recovered (SR%) and stalk weight (SW) of the genotypes; Table S3: Number of genotypes of the different breeding programs in each genetic group obtained by cluster analysis; Table S4: Pearson’s chi-square statistical test used for determine whether structure groups with different thresholds were significantly different; Table S5: Pearson’s chi-square statistical test used to determine whether structure groups were significantly different from cluster groups; Table S6: Effective alleles (Ne), Observed heterozygosity (HO), expected heterozygosity (HE), polymorphism information content (PIC) and discriminating power (Dj) for the 74,969 SNPs along the three core collections.

Author Contributions

Conceptualization, M.F.P., J.R. and S.O.; Methodology, M.F.P., D.D.H. and J.R.; Formal Analysis, M.F.P., A.N.P.M. and J.R.; Investigation, M.F.P. and J.R.; Resources, A.S.N. and S.O.; Data Curation, A.N.P.M. and D.D.H.; Writing—Original Draft Preparation, M.F.P.; Writing—Review and Editing, M.F.P., A.N.P.M., J.R. and S.O.; Supervision, A.S.N. and S.O.; Project Administration, J.R.; Funding Acquisition, J.R. and S.O. All authors have read and agreed to the published version of the manuscript.

Funding

This research was funded by EEAOC and Instituto de Tecnología Agroindustrial del Noroeste Argentino (ITANOA, EEAOC-CONICET) as part of the project PICT A-CatI-2021-110 from Agencia Nacional de Promoción Científica y Tecnológica.

Data Availability Statement

The datasets that support the findings of this study are available on request from the corresponding author (MFP).

Conflicts of Interest

The authors declare no conflicts of interest.

Abbreviations

The following abbreviations are used in this manuscript:
AMOVAanalysis of molecular variance
DArTDiversity Arrays Technology
Djdiscrimination power
EEAOCEstación Experimental Agroindustrial Obispo Colombres
HEexpected heterozygosity
HOobserved heterozygosity
MAFminor allele frequency
NAnull allele frequency
Neeffective number of alleles
PCAprincipal component analysis
PCoAprincipal coordinate analysis
PICpolymorphism information content
SNPsingle-nucleotide polymorphism

References

  1. Fickett, N.D.; Ebrahimi, L.; Parco, A.P.; Gutierrez, A.V.; Hale, A.L.; Pontif, M.J.; Todd, J.; Kimbeng, C.A.; Hoy, J.W.; Ayala-Silva, T.; et al. An enriched sugarcane diversity panel for utilization in genetic improvement of sugarcane. Sci. Rep. 2020, 10, 13390. [Google Scholar] [CrossRef] [PubMed]
  2. Crystian, D.; Messias dos Santos, J.; Veríssimo, G.; Souza, B.; Almeida, C. Genetic diversity trends in sugarcane germplasm: Analysis in the germplasm bank of the RB varieties. Crop Breed. Appl. Biotechnol. 2018, 18, 426–431. [Google Scholar] [CrossRef]
  3. Healey, A.L.; Garsmeur, O.; Lovell, J.T.; Shengquiang, S.; Sreedasyam, A.; Jenkins, J.; Plott, C.B.; Piperidis, N.; Pompidor, N.; Llaca, V.; et al. The complex polyploid genome architecture of sugarcane. Nature 2024, 628, 804–810. [Google Scholar] [CrossRef] [PubMed]
  4. Ostengo, S.; Serino, G.; Perera, M.F.; Racedo, J.; Mamaní González, S.Y.; Yañez Cornejo, F.; Cuenya, M.I. Sugarcane breeding, germplasm development and supporting genetic research in Argentina. Sugar Tech 2021, 24, 166–180. [Google Scholar] [CrossRef]
  5. Mohammadi, S.A.; Prasanna, B.M. Analysis of genetic diversity in crop plants. Salient statistical tools and considerations. Crop Sci. 2003, 43, 1235–1248. [Google Scholar] [CrossRef]
  6. de Oliveira, G.L.; de Souza, A.P.; de Oliveira, F.A.; Zucchi, M.I.; de Souza, L.M.; Moura, M.F. Genetic structure and molecular diversity of Brazilian grapevine germplasm: Management and use in breeding programs. PLoS ONE 2020, 15, e0240665. [Google Scholar] [CrossRef] [PubMed]
  7. Kanaka, K.K.; Sukhija, N.; Goli, R.C.; Singh, S.; Ganguly, I.; Dixit, S.; Dash, A.; Malik, A.A. On the concepts and measures of diversity in the genomics era. Curr. Plant Biol. 2023, 33, 100278. [Google Scholar] [CrossRef]
  8. Perera, M.F.; Ostengo, S.; Peña Malavera, A.N.; Balsalobre, T.W.A.; Onorato, G.D.; Noguera, A.S.; Hoffmann, H.P.; Carneiro, M.S. Genetic diversity and population structure of Saccharum hybrids. PLoS ONE 2023, 18, e0289504. [Google Scholar] [CrossRef] [PubMed]
  9. Yirgu, M.; Kebede, M.; Feyissa, T.; Lakew, B.; Woldeyohannes, A.B.; Fikere, M. Single nucleotide polymorphism (SNP) markers for genetic diversity and population structure study in Ethiopian barley (Hordeum vulgare L.) germplasm. BMC Genome 2024, 24, 7. [Google Scholar] [CrossRef] [PubMed]
  10. Kimura, M.; Crow, J.F. The number of alleles that can be maintained in a finite population. Genetics 1964, 49, 725–738. [Google Scholar] [CrossRef] [PubMed]
  11. Nei, M. Genetic distance between populations. Am. Nat. 1972, 106, 283–292. [Google Scholar] [CrossRef]
  12. Medeiros, C.; Balsalobre, T.W.A.; Carneiro, M.S. Molecular diversity and genetic structure of Saccharum complex accessions. PLoS ONE 2020, 15, e0233211. [Google Scholar] [CrossRef] [PubMed]
  13. Diez, O.; Zossi, S.; Chavanne, E.R.; Cárdenas, G. Calidad industrial de las cañas de azúcar de maduración temprana LCP85-384 y LCP85-376 en Tucumán. Análisis de sus principales constituyentes físico-químicos. RIAT 2000, 77, 39–48. [Google Scholar]
  14. Suman, A.; Ali, K.; Arro, J.; Parco, A.S.; Kimbeng, C.A.; Baisakh, N. Molecular diversity among members of the Saccharum complex assessed using TRAP markers based on lignin-related genes. Bioenergy Res. 2012, 5, 197–205. [Google Scholar] [CrossRef]
  15. Mahadevaiah, C.; Appunu, C.; Aitken, K.; Suresha, G.S.; Vignesh, P.; Swamy, H.K.M.; Valarmathi, R.; Hemaprabha, G.; Alagarasan, G.; Ram, B. Genomic selection in sugarcane: Current status and future prospects. Front. Plant Sci. 2021, 12, 708233. [Google Scholar] [CrossRef] [PubMed]
  16. Yang, X.; Luo, Z.; Todd, J.; Sood, S.; Wang, J. Genome-wide association study of multiple yield traits in a diversity panel of polyploid sugarcane (Saccharum spp.). Plant Genome. 2020, 13, e20006. [Google Scholar] [CrossRef] [PubMed]
  17. Melchinger, A.E. Use of RFLP markers for analyses of genetic relationships among breeding materials and prediction of hybrid performance. In International Crop Science I; Buxton, D.R., Shibles, R., Forsberg, R.A., Blad, B.L., Asay, K.H., Paulsen, G.M., Wilson, R.F., Eds.; Crop Science Society of America: Madison, WI, USA, 1993; pp. 621–628. [Google Scholar]
  18. Glynn, N.C.; McCorkle, K.; Comstock, J.C. Diversity among mainland USA sugarcane cultivars examined by SSR genotyping. J. Am. Soc. Sugar Cane Technol. 2009, 29, 36–52. [Google Scholar]
  19. Tazeb, A.; Haileselassie, T.; Tesfaye, K. Molecular characterization of introduced sugarcane genotypes in Ethiopia using inter simple sequence repeat (ISSR) molecular markers. Afr. J. Biotechnol. 2017, 16, 434–449. [Google Scholar]
  20. Manechini, J.R.V.; Costa, J.B.; Pereira, B.T.; Carlini-Garcia, L.; Xavier, M.A.; Landell, M.G.A.; Rossini Pinto, L. Unraveling the genetic structure of Brazilian commercial sugarcane cultivars through microsatellite markers. PLoS ONE 2018, 23, e0195623. [Google Scholar] [CrossRef] [PubMed]
  21. Weir, B.S.; Cockerham, C.C. Estimating F-statistics for the analysis of population structure. Evolution 1984, 38, 1358–1370. [Google Scholar] [CrossRef] [PubMed]
  22. Wright, S. Evolution and the Genetics of Populations. Volume 4: Variability within and among Natural Populations; University of Chicago Press: Chicago, IL, USA, 1978. [Google Scholar]
  23. Perera, M.F.; Peña Malavera, A.N.; Noguera, A.S.; Racedo, J.; Ostengo, S. Sugarcane genetic diversity study of EEAOC´s germplasm bank and assessment of a core collection. In Proceedings of the ISSCT XXXII Centennial Congress 2025, Cali, Colombia, 24–28 August 2025; Volume 32, pp. 180–186. [Google Scholar]
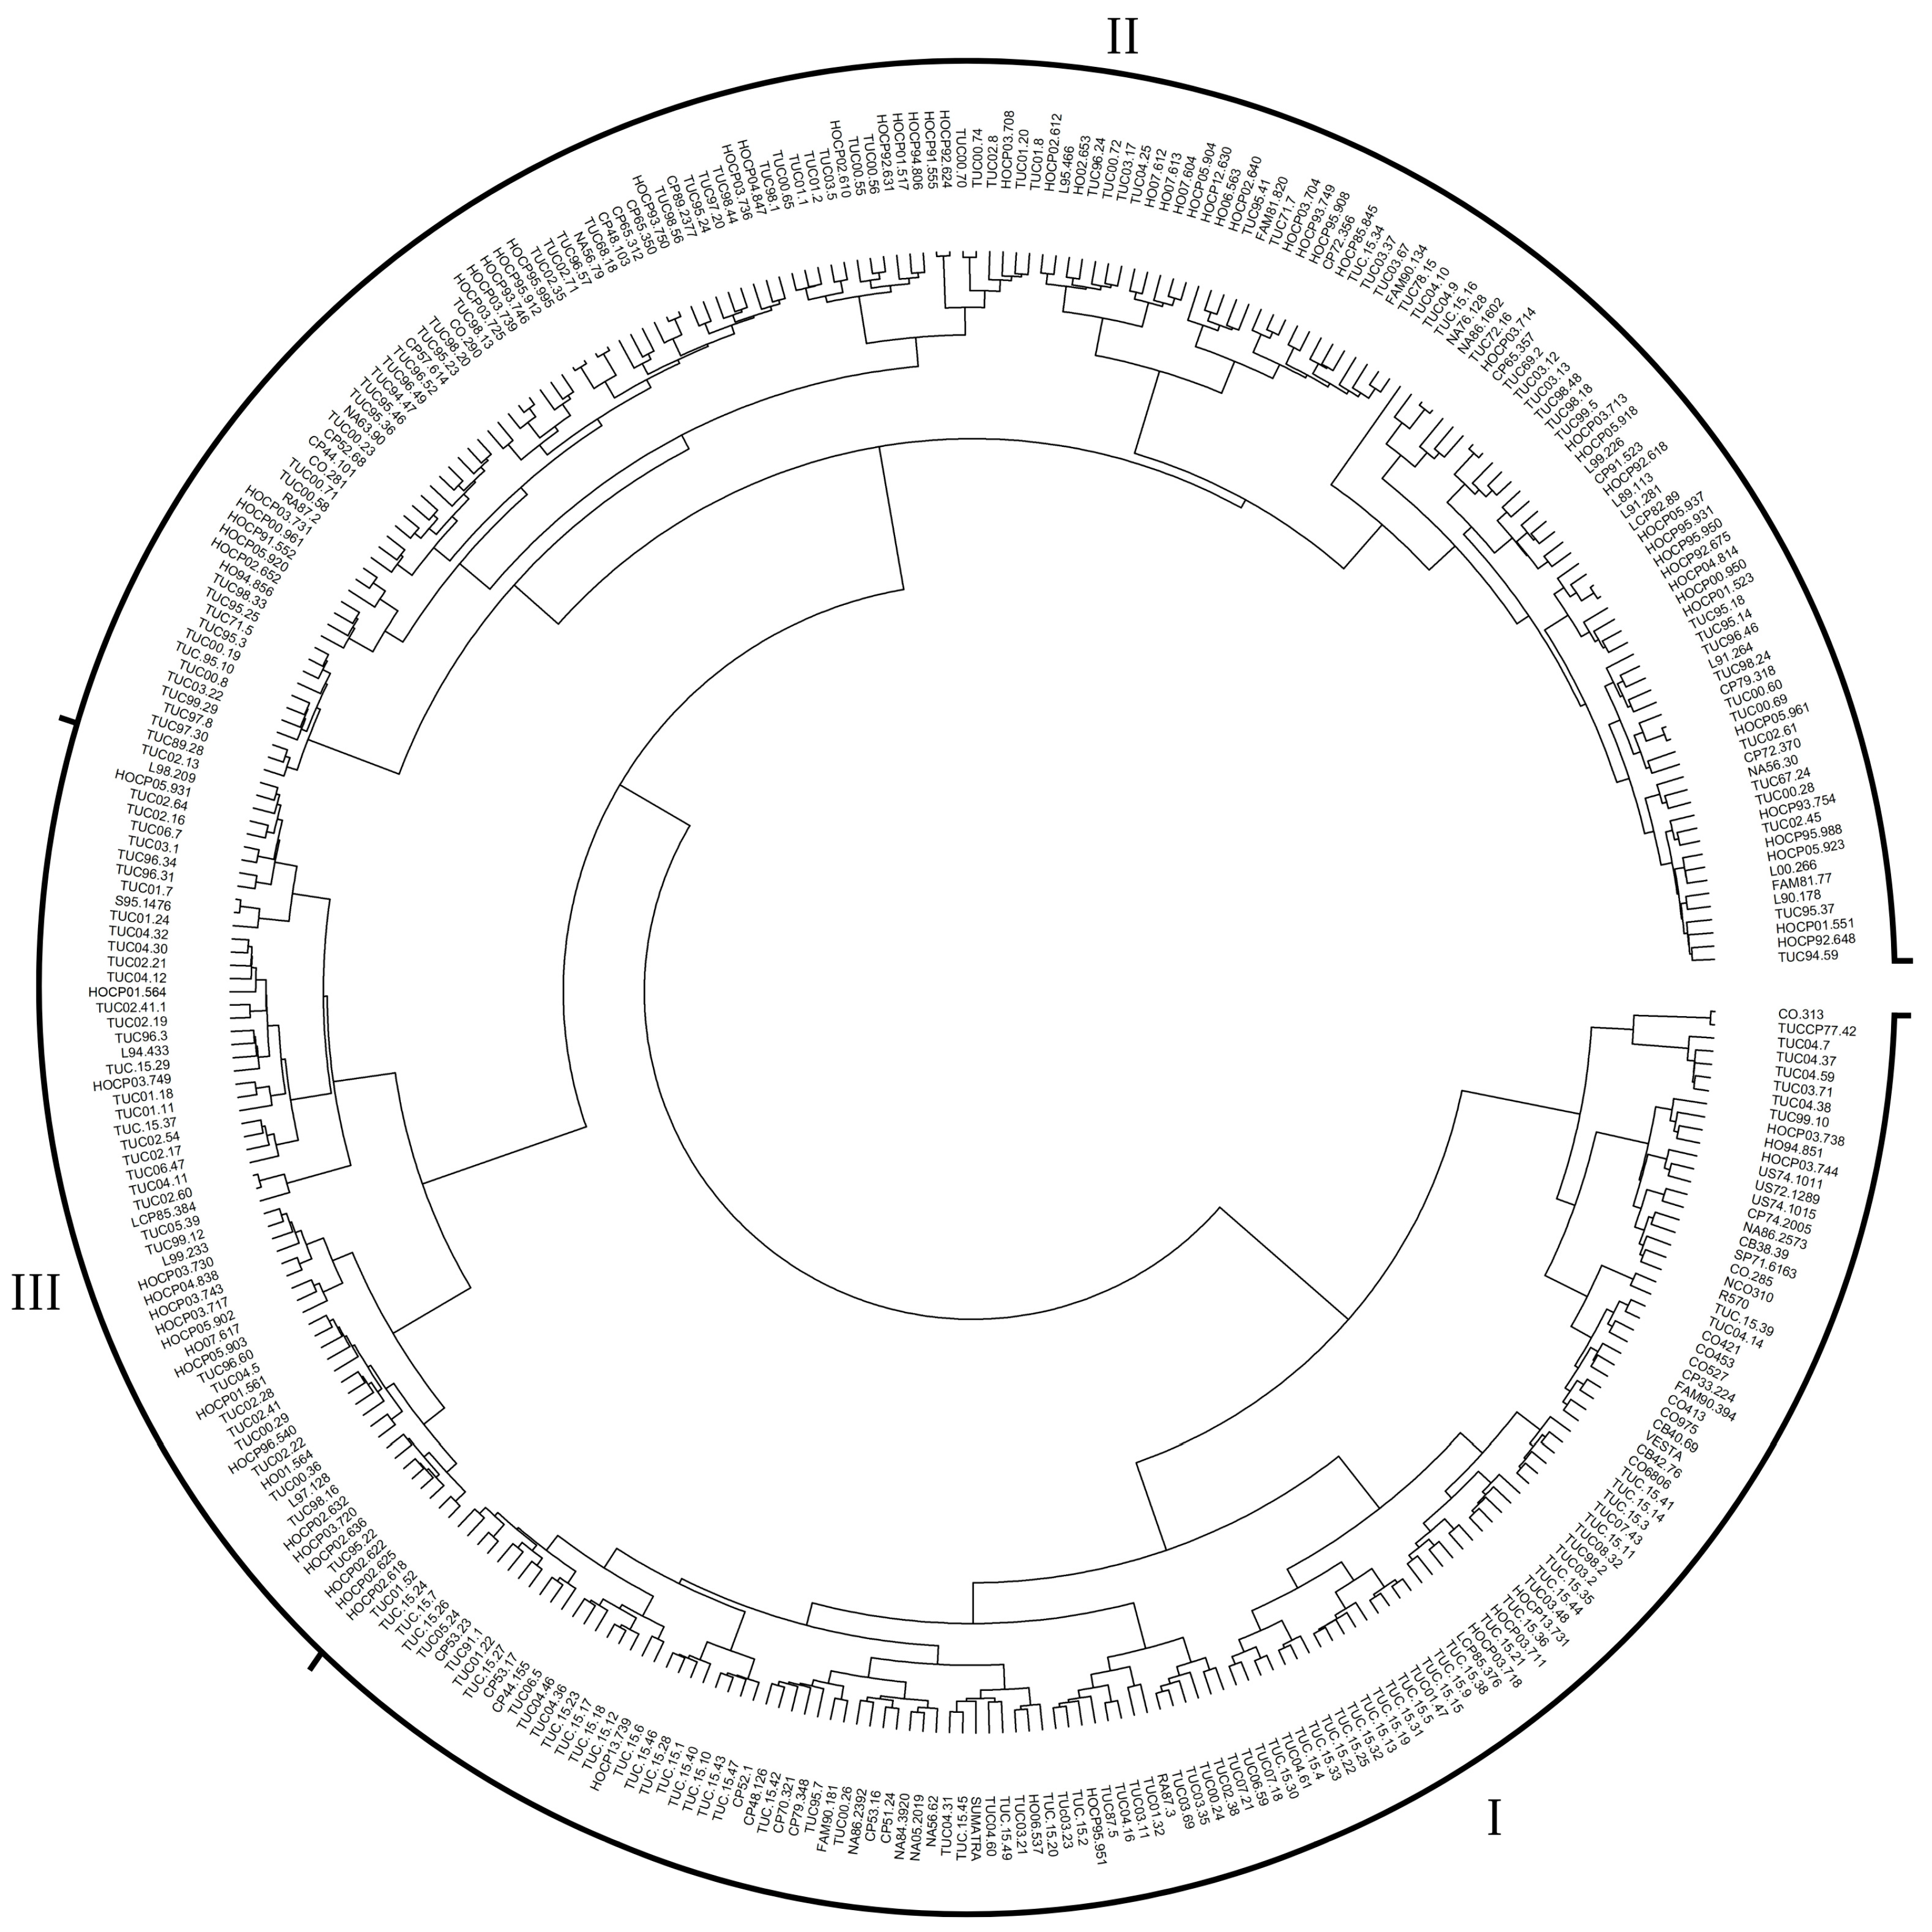
Figure 1. Dendrogram representing the genetic relationships among 348 sugarcane accessions, constructed from SNP data using the Jaccard similarity coefficient and Ward’s hierarchical clustering method in R. Numbers correspond to the three groups detected (group I: 125, group II: 154 and group III: 69 genotypes).
Agronomy 15 02638 g001
Figure 2. Genetic structure of 348 sugarcane accessions obtained with 74,969 SNPs. (A) Bayesian method where each genotype is represented by a single vertical line, partitioned into colors according to its estimated membership in each group (red: group I; blue: group II and green: group III). (B) PCoA where genotypes are represented by dots with the same colors as in the Bayesian method.
Agronomy 15 02638 g002
Figure 3. PCoA of 348 sugarcane accessions obtained with 74,969 SNPs. Genotypes of the core collections are indicated in dark purple, whereas the rest of the genotypes are in light purple. (A) Core collection with 35 genotypes (10%). (B) Core collection with 70 genotypes (20%). (C) Core collection with 104 genotypes (30%).
Agronomy 15 02638 g003
Figure 4. PCA of 348 sugarcane accessions using as input variables: PCoA 1 and 2 axes obtained through the molecular analysis, sugar recovered (SR%) and stalk weight (SW). In red, group I; in blue, group II; and in green, group III. Genotypes of the 30% core collection are indicated in triangles of each color.
Agronomy 15 02638 g004
Table 1. Descriptive analysis for the 74,969 SNPs across the 348 sugarcane genotypes.
VariableMeanS.D.MinMax
Ne1.540.401.002.00
NA0.380.220.000.90
HO0.280.330.001.00
HE0.300.200.000.50
PIC0.220.150.000.38
Dj0.280.200.000.50
Ne: Number of effective alleles; NA: frequency of null alleles, HO: observed heterozygosity, HE: expected heterozygosity; PIC: polymorphism information content; Dj: discriminating power.
Table 2. Diversity captured by different sizes of core collections.
Size (%)Number of GenotypesNumber of AllelesCaptured DiversityAverage SR%Average SW
1035137,04095.78%11.08 ± 1.340.76 ± 0.22
2070139,01397.16%11.02 ± 1.240.73 ± 0.20
30104140,55498.24%11.13 ± 1.160.72 ± 0.18
100348143,063100%11.43 ± 1.150.67 ± 0.19
SR%: sugar recovered; SW: stalk weight.
Table 3. Genotypes included in the three core collections.
GenotypesCore (%)GenotypesCore (%)GenotypesCore (%)
102030102030102030
CB 38-39 xHOCP 95-951xxx bTUC 06-47 xx
CB 42-76 xx bHOCP 95-995 x TUC 07-18 xx
CO 413xxx bHOCP 95-988 xTUC 07-21 xx b
CO 453 xx bL 00-266 xTUC 68-18xxx b
CO 527xxx bL 94-433 xTUC 94-47 x b
CO 6806xxx bL 98-209 x aTUC 94-59 x
CO 290 xLCP 85-376 xxTUC 95-7xxx b
CP 33-224xxx bNA 05-2019xxx bTUC 95-23 x
CP 44-101 xNA 84-3920 xx bTUC 95-24 xx
CP 44-155 xxNA 86-2392 x bTUC 95-36x
CP 48-126xxxNA 86-2573 xxTUC 95-46 xx
CP 51-24xxxR 570xxx bTUC 96-3 x
CP 52-1xxxSUMATRAxxxTUC 96-34 xx
CP 53-16 x bTUC 00-19 xxTUC 96-46 x
CP 53-17 xxTUC 00-23 xTUC 96-49 x
CP 53-23 xTUC 00-26 xxTUC 96-52 x
CP 65-350 x TUC 01-2 xTUC 97-20xxx
CP 70-321xxxTUC 01-11 x aTUC 98-48 x
CP 74-2005 xxTUC 00-71 x TUC 99-10 xx
CP 89-2377 xTUC 01-22xxxTUC 15-2 x
FAM 81-77 x bTUC 01-47 xTUC 15-5 xx
FAM 90-181 xx bTUC 02-13 x TUC 15-7 x
FAM 90-394xxx bTUC 02-16x TUC 15-12 xx
HO 07-613x TUC 02-17 xx aTUC 15-20 xx
HO 07-604 xxTUC 02-22 x aTUC 15-21 xx
HO 07-612 xxTUC 02-41 xTUC 15-22 xx
HO 94-851xxxTUC 02-54 xxTUC 15-23 x
HOCP 00-961 xTUC 02-71 xTUC 15-24 xx
HOCP 01-517xx TUC 03-11 xTUC 15-27 x
HOCP 03-704 xTUC 03-23 xTUC 15-29 xx
HOCP 03-711x TUC 03-67 x bTUC 15-36 x
HOCP 03-731xxxTUC 04-9 xTUC 15-37 xx
HOCP 03-736 xxTUC 03-71 x TUC 15-39 x
HOCP 03-738xx TUC 04-11xxxTUC 15-40x x
HOCP 03-739 xx bTUC 04-30 xTUC 15-42xxx
HOCP 03-744xxx bTUC 04-31 xxTUC 15-43 x
HOCP 03-749 xTUC 04-38x x aTUC 15-45xxx
HOCP 04-847 xTUC 04-60xxxTUC 15-49xxx
HOCP 05-920 xTUC 04-61x US 74-1011xxx
HOCP 93-750 xTUC 05-24 xx
Genotypes in bold and underlined were included in the most frequently used parents in the breeding program, previously characterized by SSR and TRAP markers. a Genotypes associated with high sugar recovered. b Genotypes associated with high stalk number.
Disclaimer/Publisher’s Note: The statements, opinions and data contained in all publications are solely those of the individual author(s) and contributor(s) and not of MDPI and/or the editor(s). MDPI and/or the editor(s) disclaim responsibility for any injury to people or property resulting from any ideas, methods, instructions or products referred to in the content.