Article

Effects of Intercropping Long- and Short-Season Varieties on the Photosynthetic Characteristics and Yield Formation of Maize in High-Latitude Cold Regions

1
College of Agriculture, Heilongjiang Bayi Agricultural University, Daqing 163319, China
2
Keshan Branch of Heilongjiang Academy of Agricultural Sciences, Qiqihar 161601, China
3
Crop Development Research Institute, Heilongjiang Academy of Land Reclamation Sciences, Harbin 150038, China
4
College of Animal Science and Veterinary Medicine, Heilongjiang Bayi Agricultural University, Daqing 163319, China
*
Authors to whom correspondence should be addressed.
Agronomy 2025, 15(11), 2505; https://doi.org/10.3390/agronomy15112505
Submission received: 2 October 2025 / Revised: 23 October 2025 / Accepted: 27 October 2025 / Published: 28 October 2025
(This article belongs to the Section Farming Sustainability)

Abstract

The high-latitude cold regions of northeastern China present scarce thermal resources, exhibit a short frost-free period, and lack high-yielding maize (Zea mays L.) varieties suitable for dense planting. These factors have long constrained the realization of maize yield potential under dense planting conditions. This study investigated the effects of intercropping maize varieties with different growth periods on the photosynthetic performance, yield formation, and interspecific competition. The long-season varieties Zhengdan958 (ZD958) and Xianyu335 (XY335), which are representative of the region, were intercropped with the shorter-season variety Yinongyu10 (YNY10), six intercropping row ratios (6:6, 4:4, 2:2, 1:1, 0:1, and 1:0) were set, and monoculture plots (0:1 and 1:0) were used as the controls. The results indicated that as the row ratio decreased in the intercropped plots, the leaf area index, relative leaf chlorophyll content, photosynthetic rate, stomatal conductance, and transpiration rate increased while the intercellular CO2 concentration gradually decreased compared with those in the monoculture plots. Simultaneously, dry matter accumulation, allocation, transport efficiency, 100-kernel weight, number of kernels per ear, and grain yield progressively increased, reaching maximum values at a 1:1 intercropping row ratio. Conversely, YNY10 in the intercropped plots exhibited opposite trends in these parameters. The land equivalent ratios for all intercropped row ratios exceeded 1. During the 2023–2024 growing season, the composite population grain yield was significantly higher (p < 0.05) at an intercropping row ratio of 1:1 for ZD958 (4.11–4.26%) and XY335 (3.54–3.65%) compared with the monoculture treatments, demonstrating the strong yield advantage of intercropping. Furthermore, in the intercropping systems, ZD958 and XY335 exhibited positive aggressivity and a competitive ratio greater than 1, thus showing stronger competitive ability than YNY10. Moreover, the increased grain yield of ZD958 and XY335 effectively compensated for the ecological disadvantages of YNY10, thereby leveraging the synergistic effects of close planting and intercropping patterns to promote improvements in maize composite population productivity.

1. Introduction

In recent years, global crop production growth rates have shown a downward trend, raising concerns about whether future agricultural production will be able to keep pace with demand [1]. Maize (Zea mays L.) is an important crop used for food, economic, and feed purposes; therefore, significantly increasing maize production is an important strategy for effectively addressing the growing demand for food and feed caused by population growth and economic development under limited arable land resources [2]. As the second largest maize-producing country, China produces 260 million tons of maize annually, accounting for 23% of the global maize supply [3]. However, the deficit in domestic maize production and supply capacity have led to rapid increases in maize imports, which reached a peak of 28.4 million tons in 2021, accounting for approximately 11% of the total domestic maize production [4]. Therefore, in lieu of expanding the maize planting area, continuously increasing the yield per unit area of maize is of great significance for ensuring global food security. Increasing crop yields depends on the complex interactions between genotype, environmental factors (including soil and climate conditions), and agricultural management, with climate change and agronomic measures contributing more to the increasing yield than genetic improvements [5]. Numerous studies have shown that reasonably dense planting not only maximizes yield potential of plant populations but also represents the most economical, effective, and easily scalable yield-enhancing measure [6]. However, as planting density gradually increases, canopy closure and ventilation conditions within maize populations may deteriorate, thereby decreasing the photosynthetic capacity. This can easily result in a significant decline in grain weight and grain setting rate, limiting the sustained increase in grain yield and ultimately constraining the synergistic development of high-density planting and high-yield efficiency in maize production.
The planting method is one of the most important factors in coordinating the ventilation, light transmission, and nutritional status of individual crops under dense planting conditions [7] and promoting increases in population yield. Moreover, planting methods represent a research topic of interest in the field of crop production research. Intercropping is a cultivation method in which two or more crops are grown on the same plot of land, and it is now widely used worldwide [8,9]. Research on intercropping short-stemmed crops, such as maize and peanuts [10], soybeans [11], or alfalfa [12], generally suggests that intercropping composite groups forms a permeable canopy structure and three-dimensional light reception pattern [13], which can promote the light energy capture capacity and photosynthetic performance of the leaves [14], increase the distribution of dry matter of the grain, and improve the soil coverage and utilization, resulting in significant yield advantages compared with monoculture. In recent years, intercropping plants, such as rice [15], wheat [16], maize [17], and cassava [18], using different genotypes of the same crop enhances the complementarity between plant types and populations, improves the canopy structure of the population, utilizes space and natural resources, and reduces the risk of lodging. Moreover, these systems can control and mitigate the occurrence of pests and diseases through biodiversity and complementary mechanisms, thereby achieving the goal of increasing population yield [19,20,21]. In the ecological zone of the Huang Huai Hai region of China, where summer maize planting occurs, intercropping maize varieties with different plant heights [22] or compactness [23] can enhance the ventilation and light transmission ability of dense planting populations, delay the aging rate of lower leaves, maintain high leaf area index (LAI) and canopy coverage (CAP), reduce respiratory consumption, increase dry matter accumulation in the aboveground parts during physiological maturity, and ultimately achieve higher yields. Heilongjiang Province is located in the high-latitude cold region of northeastern China. It ranks first in China in terms of agricultural mechanization, and its maize planting area and total production account for more than 15% of the national total. It is an extremely important commercial grain production base in China [24,25]. Since 2005, the maize planting density in this region has shown a significant upward trend, with the highest growth rate compared to other maize-producing regions in China [26]. However, due to the short frost-free period, low effective accumulated temperature, and lack of high-yielding maize varieties suitable for dense planting in this region, the full potential of maize yields under dense planting conditions has long been constrained. Previous researchers have conducted studies and practical experiments on wide-narrow row spacing [27,28] and intercropping [29] based on different planting densities and cultivation methods. Such research has promoted maize canopy structure and yield formation optimization in high-latitude cold regions. However, few reports have investigated the use of the complementary advantages of different growth periods varieties to achieve synergistic improvements in agricultural resource utilization efficiency and yield under the light and heat resource conditions of this region.
Therefore, in this study, we selected two long-season varieties and one short-season variety that are mainly cultivated in the high-latitude cold regions of northeastern China and intercropped them according to different row ratios. Investigating the photosynthetic characteristics, dry matter accumulation, competitive indices, and yield differences among these intercropped maize populations. The results of this study will provide technical support for establishing suitable planting patterns of high- and stable-population productivity and enhancing the efficient utilization of agricultural resources under maize-dense planting conditions in high-latitude cold regions.

2. Materials and Methods

2.1. Experimental Site

The experiment was conducted from 2023 to 2024 at the experimental internship base of Heilongjiang Bayi Agricultural Reclamation University (Anda, 125°352′ E, 46°402′ N). The geographical location of the research site is detailed in Figure 1. This region is located in the heart of the Songnen Plain in Northeast China, within the temperate continental monsoon climate zone. The major features of this region are cold and dry winters, rainy and hot summers, strong and frequent spring and autumn monsoons, annual average precipitation of 442.40 mm, annual average temperature of 3.20 °C, and annual average sunshine duration of 2659 h. Changes in the average daily temperature, daily precipitation, and hydrothermal coefficient (K) during the maize growing season are detailed in Figure 2. The formula for the hydrothermal coefficient is as follows: K = R × 10 / t , where R represents the sum of precipitation for the period with air temperatures above +10 °C (mm), and t represents the sum of air temperatures for the same time (°C)] [30]. Meteorological data at the experimental site were monitored using a CR1000 automatic weather observation system (Beijing Huayi Rui Technology Co., Ltd., Beijing, China). The soil type in the experimental field is meadow soil, with uniform fertility. The average bulk density of the 0–20 cm plow layer is 1.26 g·cm−3 and the soil pH is 7.79 (measured using KCl as the reference standard). The organic matter content is 29.71 g·kg−1; total nitrogen, 1.40 g·kg−1; alkali-hydrolyzable nitrogen, 115.88 mg·kg−1; available phosphorus, 5.12 mg·kg−1; available potassium, 106.33 mg·kg−1; organic carbon, 17.23 g·kg−1; available iron, 21.23 mg·kg−1; available zinc, 0.62 mg·kg−1; exchangeable calcium, 28.74 cmol·kg−1; and exchangeable magnesium, 6.85 cmol·kg−1.

2.2. Experimental Design

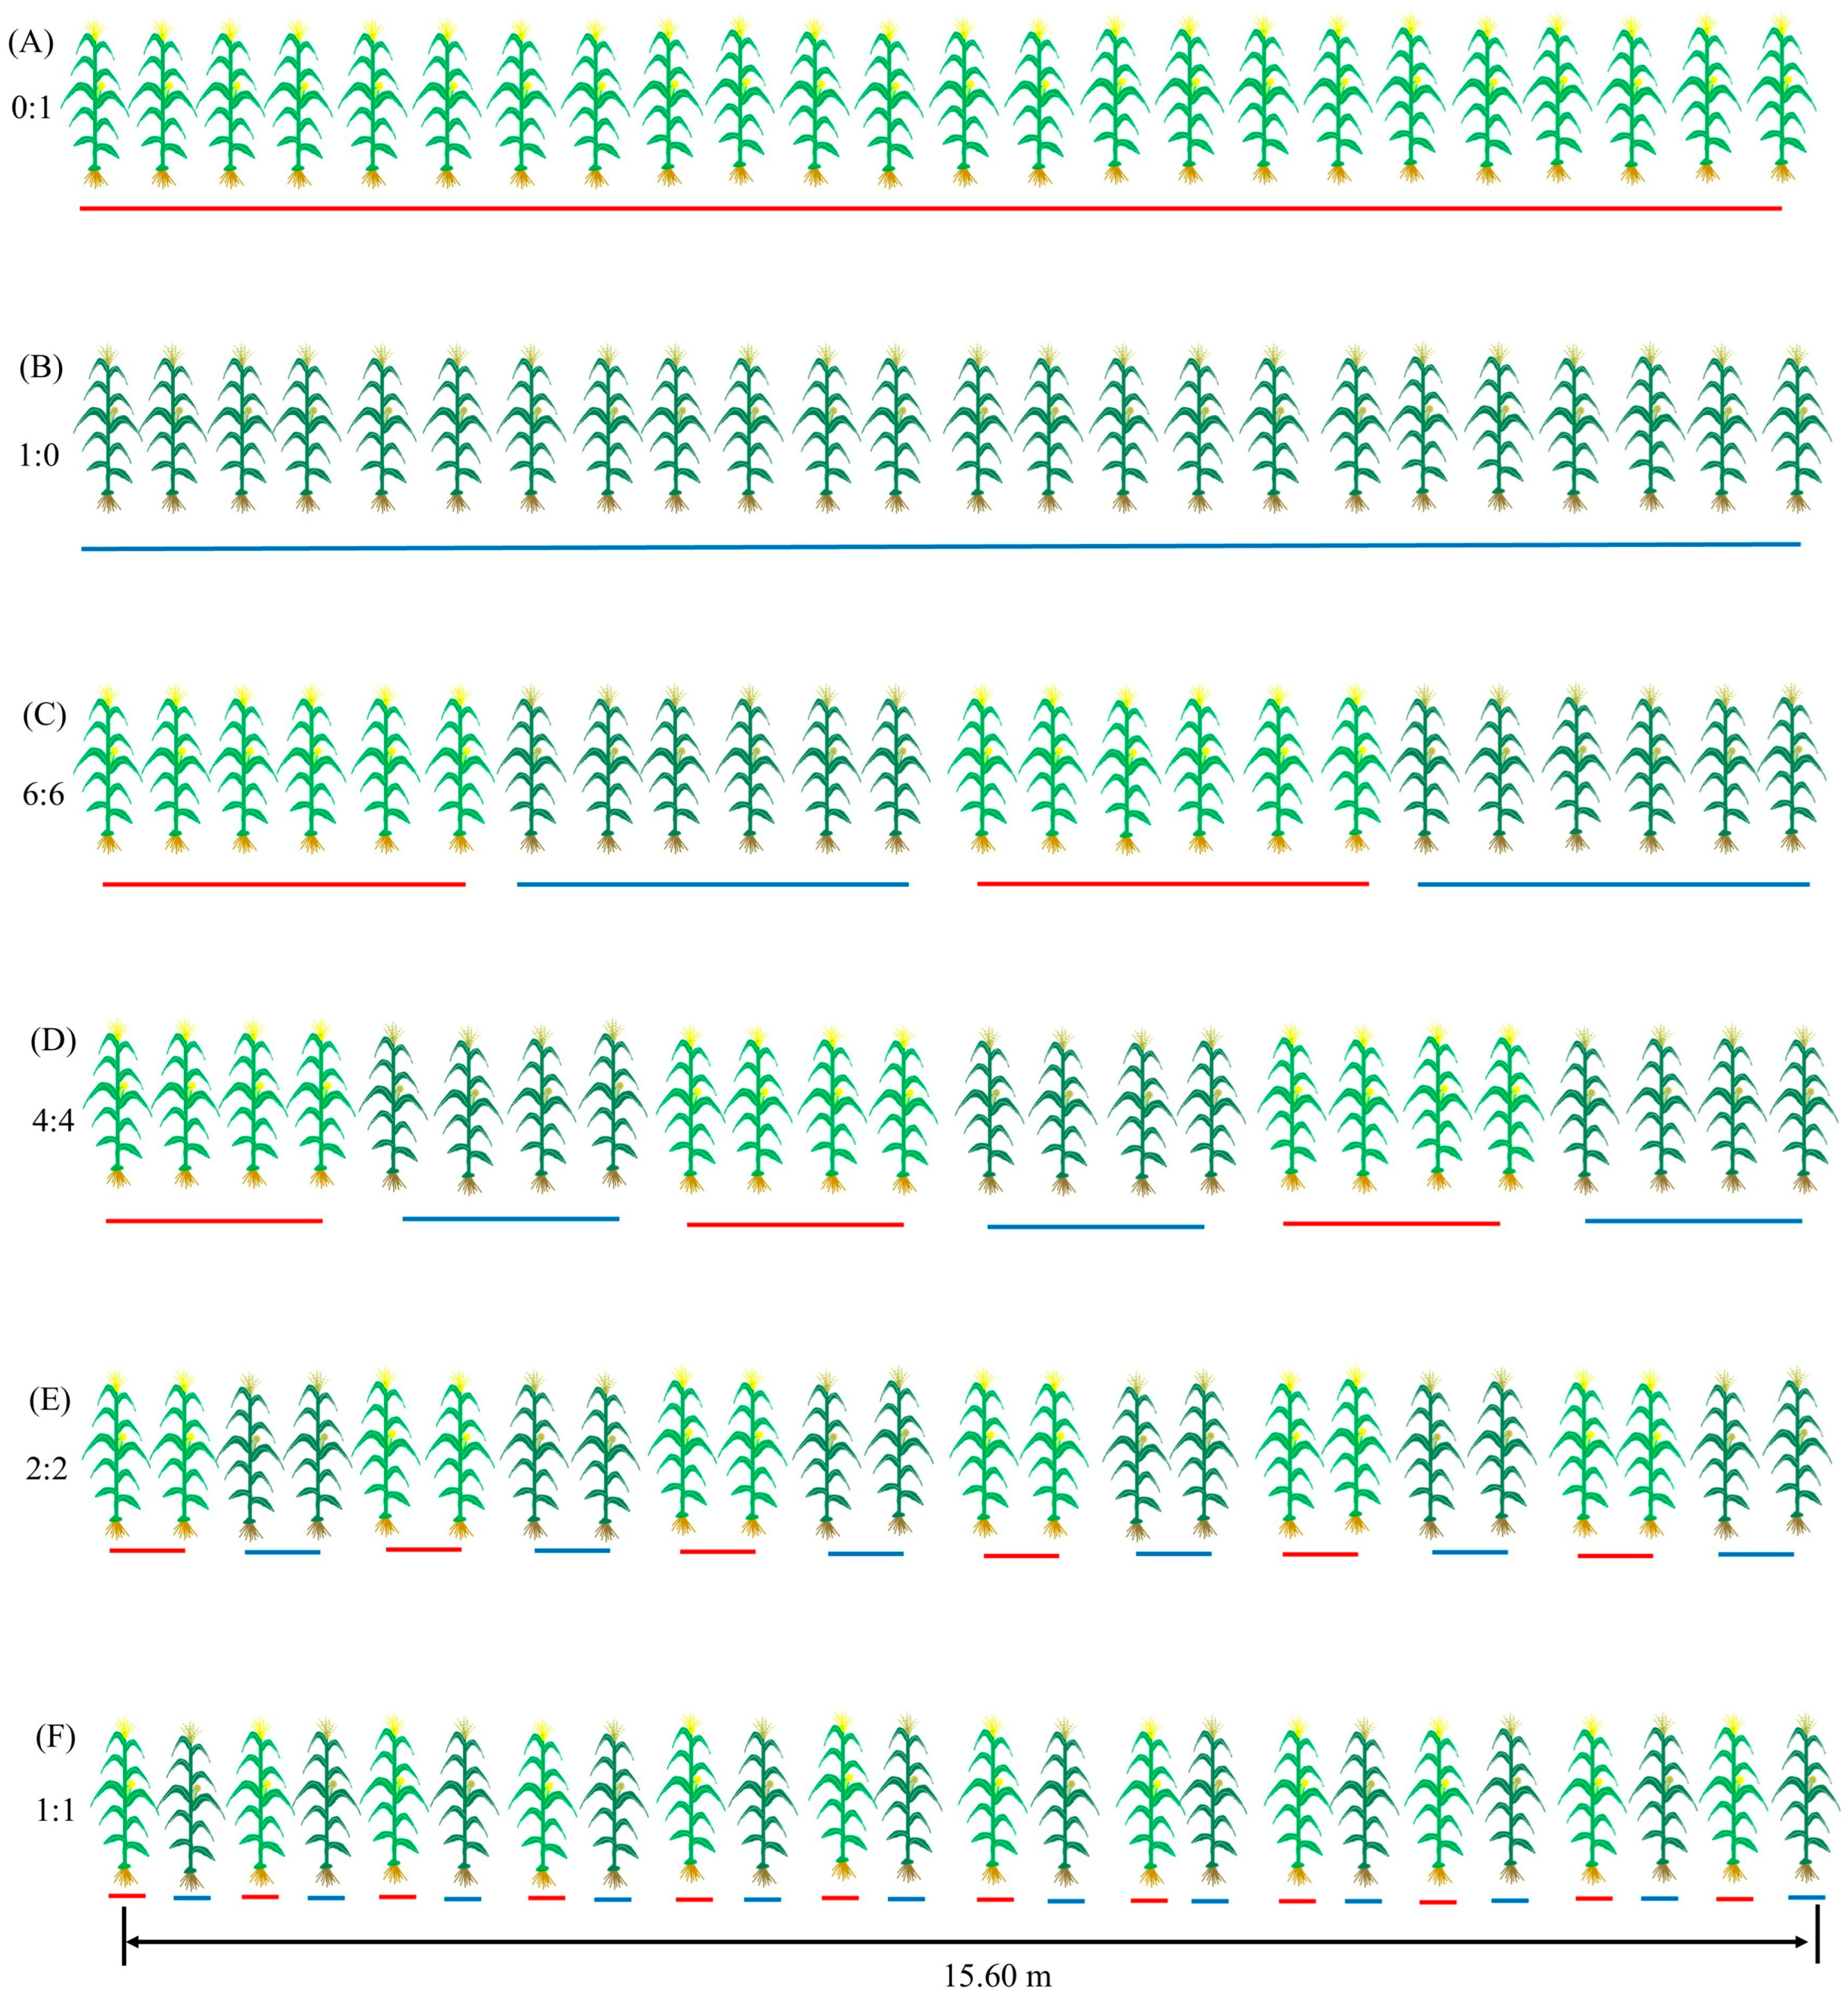
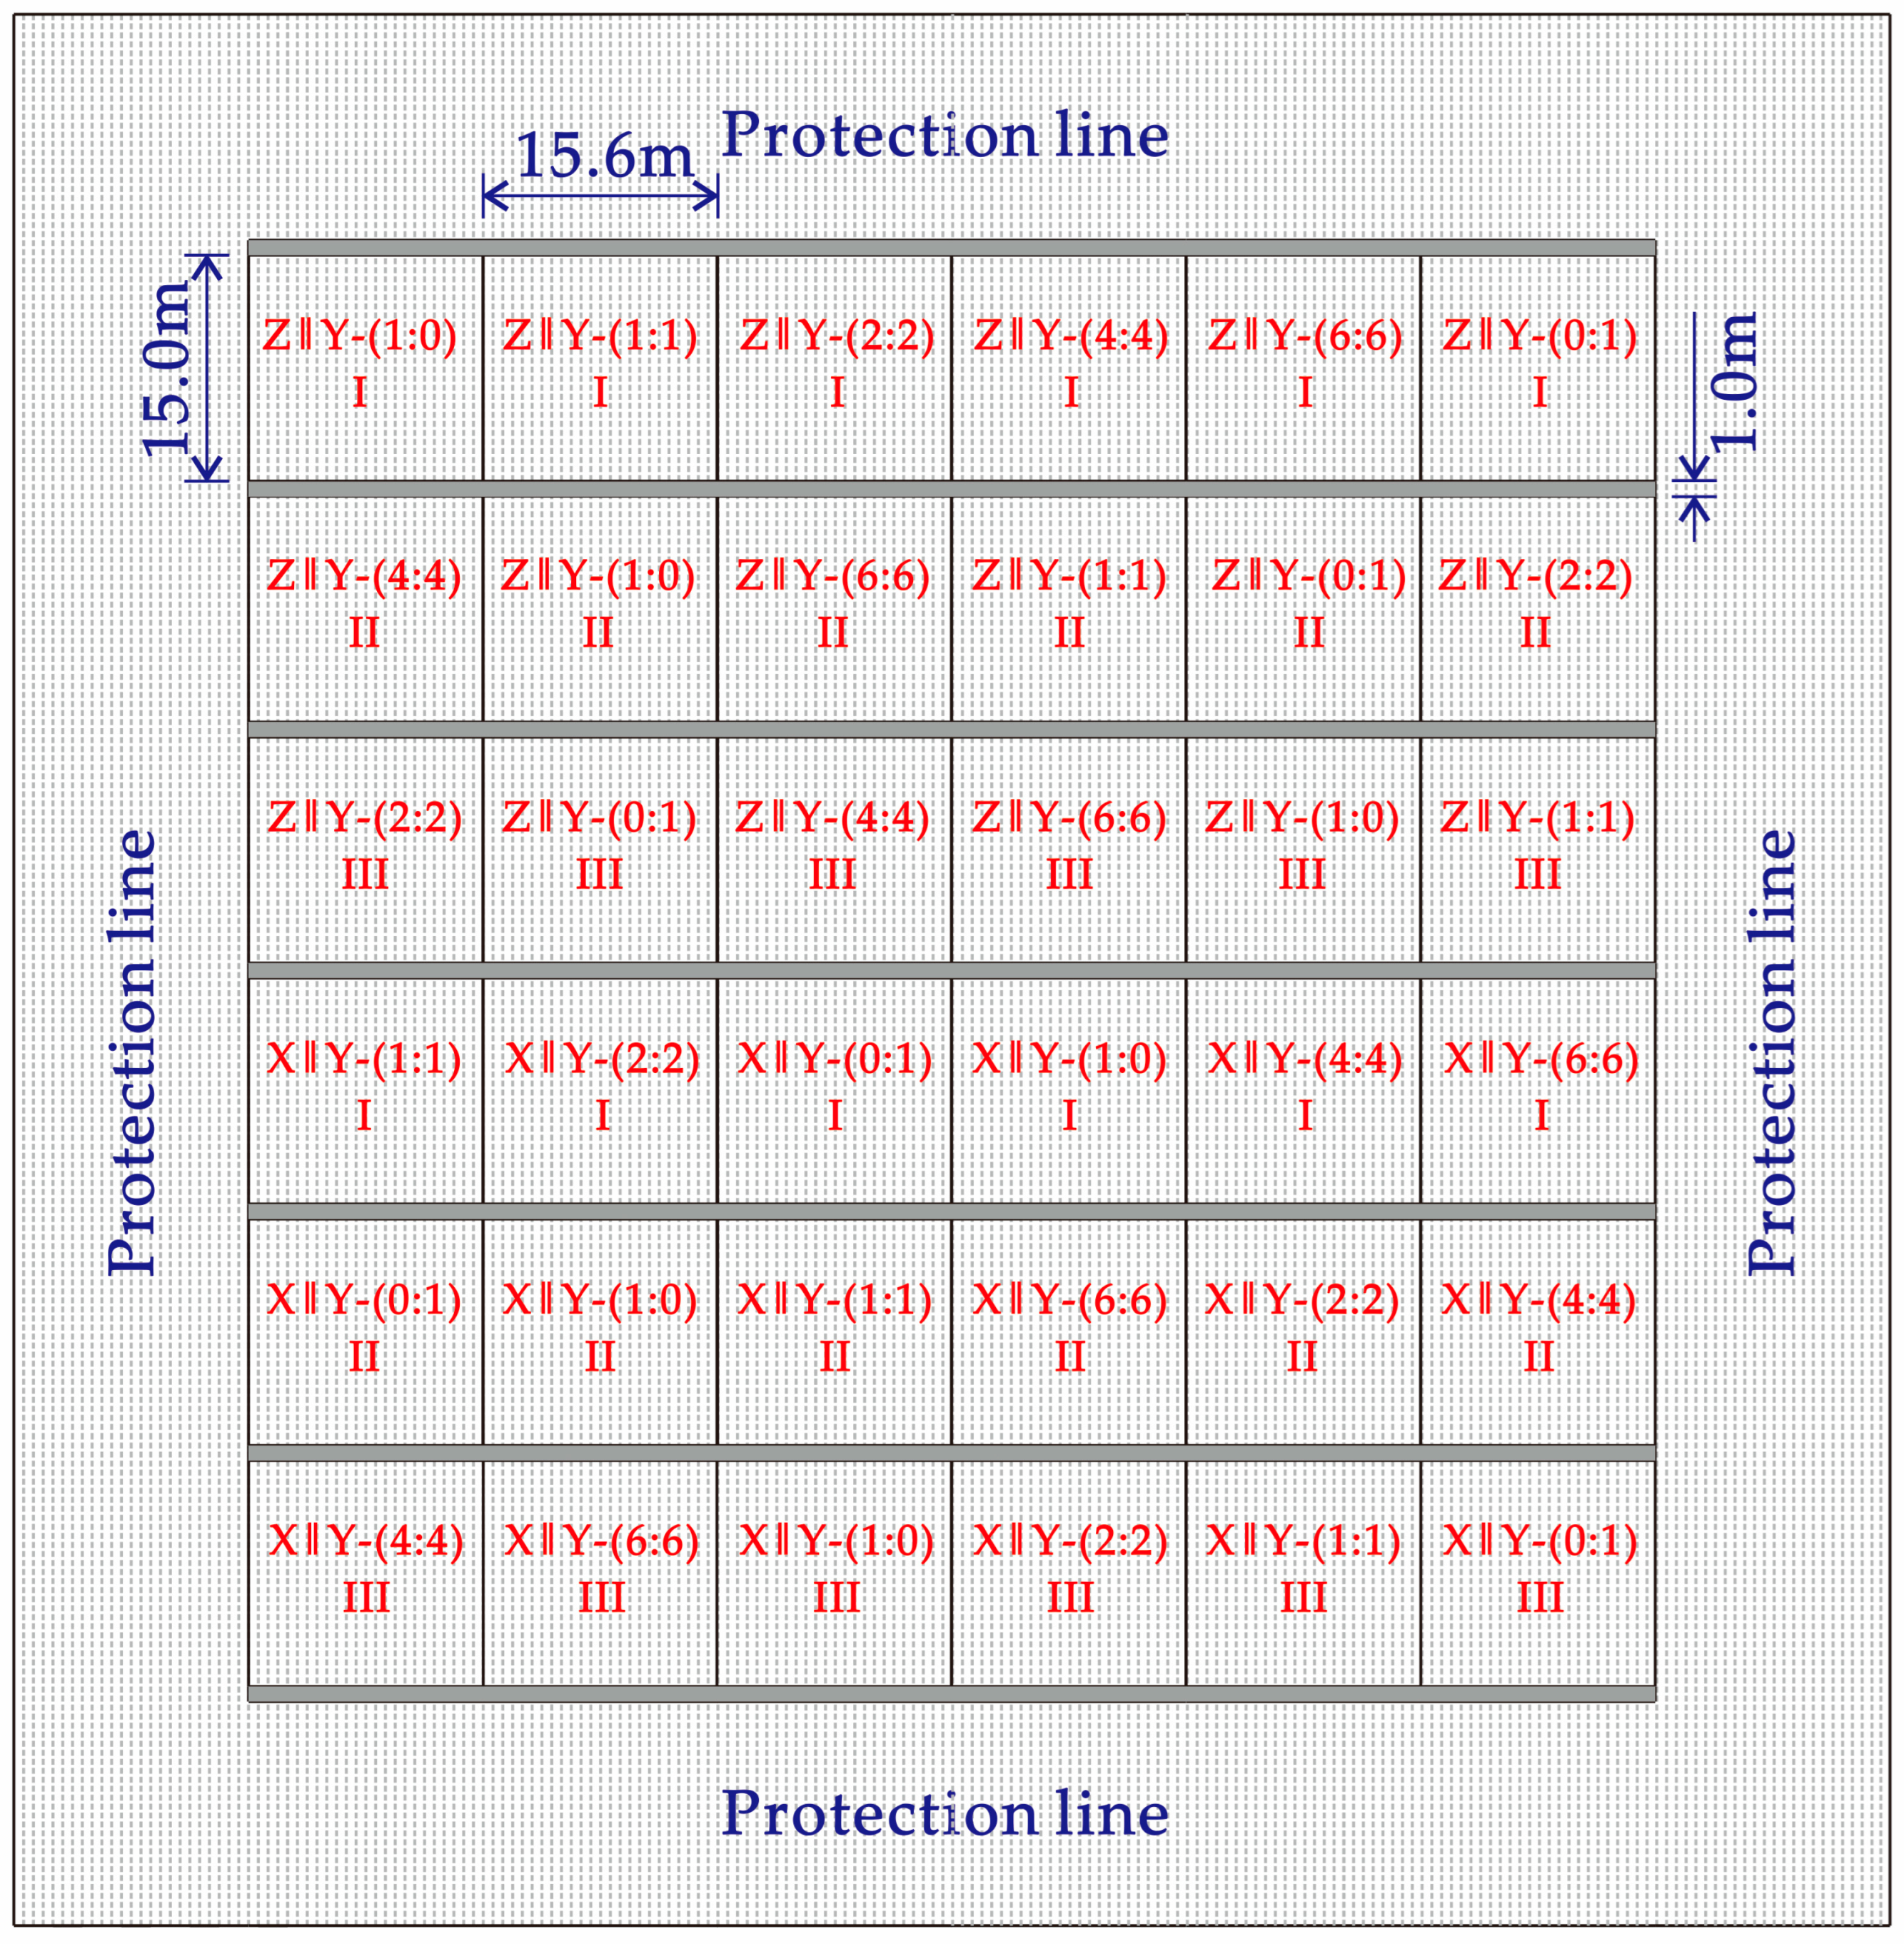
This study utilized representative major cultivated varieties in the region as the experimental materials: long-season Zhengdan958 (ZD958) and Xianyu335 (XY335) and short-season Yinongyu10 (YNY10). Detailed characteristics of the varieties are presented in Table 1. Intercropping was conducted between the long- and short-season varieties: ZD958 intercropped with YNY10 (Z‖Y) and XY335 intercropped with YNY10 (X‖Y). Six intercropping width (row number) ratios were established: 6:6, 4:4, 2:2, 1:1, 0:1, and 1:0. Each variety’s monoculture (0:1 and 1:0) served as the control, and each treatment combination was replicated three times, with 24 rows per plot. Row length was 15 m, row spacing was 0.65 m, and plot area was 224.25 m2. The treatment methods for intercropping maize varieties with different growth periods using different row ratios are detailed in Table 2 and Figure 3. A diagram of the field experiment layout for the intercropping of maize varieties with different growth periods is shown in Figure 4. The experimental plots were sown on 30 April 2023, and 29 April 2024, with a planting density of 75,000 plants ha−1. The harvest date was October 24 in both years. The application rates for urea (N ≥ 46%), diammonium phosphate (N ≥ 18%, P2O5 ≥ 46%), and potassium chloride (K2O ≥ 60%) were 438 kg·ha−1, 306 kg·ha−1, and 156·kg ha−1, respectively. Specifically, 30% of the nitrogen fertilizer and the entire amount of phosphorus and potassium fertilizers were applied as basal fertilizer, while the remaining 70% of nitrogen fertilizer was applied as topdressing. Other field management practices followed local field production standards.

2.3. Test Items and Methods

2.3.1. Leaf Area Index and Relative Chlorophyll Content

Samples were collected during the jointing stage (JS) and at 15, 30, 45, 60, 75, and 90 days after jointing (JS-15, JS-30, JS-45, JS-60, JS-75, and JS-90, respectively), totaling seven sampling events. Three plants of each variety were randomly sampled from each plot, and their relative chlorophyll content (SPAD) values, single-plant leaf areas, and LAI were calculated. The specific methods are as follows.
SPAD values should be measured in the latest fully expanded new leaves on a sunny morning before the emergence of female spikes. After the emergence of female spikes, the spike position leaves should be measured. During measurement with a chlorophyll meter SPAD-502 Plus (Konica Minolta Holdings, Inc., Tokyo, Japan), the leaves were divided into upper, middle, and lower positions [31,32,33].
Fully expanded leaf area = length × width × 0.75,
Leaf area index (LAI) = total leaf area per plant × number of plants per unit land area/unit land area.

2.3.2. Photosynthetic Parameters

During the JS-45 and JS-75 periods, three plants with consistent growth were randomly sampled from each variety in each plot. A portable photosynthesis measurement system LI-6400 (LI-COR Biosciences, Lincoln, OR, USA) was used to measure the net photosynthetic rate (Pn), transpiration rate (Tr), stomatal conductance (Gs), and intercellular CO2 concentration (Ci) in the middle leaves of maize ears on sunny mornings between 8:00 and 11:00. The light intensity was set to 1200 μmol∙m−2∙s−1, temperature was 25 ± 5 °C, flow rate was 500 mL∙min−1, CO2 concentration was 400 μmol∙mol−1, and relative humidity was 70–80%. Each leaf was measured three times, and the average value was taken as one measurement.

2.3.3. Accumulation and Distribution of Dry Matter

During the JS-15, JS-30, JS-45, JS-60, JS-75, and JS-90 periods, three uniformly growing and representative plants were selected from each variety within each plot. Plant samples collected during the JS-15 and JS-30 periods were disassembled into three parts: stems, leaves, and sheaths. For the JS-45, JS-60, and JS-75 periods, plant samples were disassembled into seven parts: stems, leaves, sheaths, tassels, husks, cobs, and kernels. Each part was placed into separate kraft paper bags. Subsequently, all kraft paper bags were placed in the oven at 105 °C for 30 min to remove moisture and dried at 80 °C until reaching a constant weight.

2.3.4. Yield and Yield Composition Factors

During the mature stage, two points were randomly selected from each variety in each plot, and two rows in the middle were selected at each point. All ears within a 5 m length were collected for investigation of yield composition factors, with two rows selected at intervals between varieties in the 1:1 treatment. The harvest area for grain yield measurement in each plot was 6.50 m2.
Yield = Number of effective ears per unit area × Number of grains per ear × Hundred-grain weight × (1 − Moisture content)/(1 − 14%)/105

2.3.5. Calculation of Other Relevant Indicators

According to the method proposed by Cox et al. [34], the dry matter transport capacity (DMT), dry matter transport rate (DMTE), and the contribution rate of transferred dry matter to grains (DMTP) were evaluated using the following formula:
DMT = Dry weight of nutritional organs during flowering period − dry weight of nutritional organs during maturity period;
DMTE = Dry matter transport capacity of pre-flowering nutrient organs/dry weight of nutrient organs during flowering × 100%;
DMTP = Dry matter transport capacity/Dry weight of mature kernels × 100%.
The land equivalent ratio (LER) is generally used to evaluate the yield advantage of intercropping over monocropping. It was calculated based on the method of Li et al. [35] as follows:
LER1 = yi/y1, LER2 = yii/y2, LER = (LER1 + LER2)/2
where yi and yii represent the yields of intercropping longer and shorter growth period per unit area, respectively, while y1 and y2 represent the yields of longer growth period and shorter growth period grown as monocrops under the same unit area conditions.
Aggressivity (A) is often used to characterize the difference in the magnitude of yield increase between crop species 1 and species 2 [36]. The specific calculation method is as follows:
A1 = (yi/y1Z1i) − (yii/y2Z2i), A2 = (yii/y2Z2i) − (yi/y1Z1i)
where A1 and A2 represent the aggressivity of long- and short-season varieties, respectively, under the intercropping model, while Z1i and Z2i represent the planting area ratios of long- and short-season varieties, respectively, under the intercropping model.
If A1 = 0, the two long- and short-season varieties have the same competitiveness; if A1 > 0, the long-season variety has an advantage; whereas if A2 > 0, the short-season variety has an advantage.
The competitive ratio (CR) is an important indicator for evaluating competition between species [37]. The formula is as follows:
CR1 = (LER1/LER2) × (Z2i/Z1i), CR2 = (LER2/LER1) × (Z1i/Z2i)
where CR1 and CR2 represent the competition ratios of varieties with long and short growing seasons, respectively, under the intercropping model.

2.4. Data Statistics and Analysis

The data were processed using Microsoft Excel 2021 (Microsoft Corporation, Redmond, WA, USA). Statistical analyses were performed using SPSS 25.0 software (version 25.0, SPSS Inc., Chicago, IL, USA). Analysis of variance (ANOVA) and Duncan’s multiple range test were used for multiple comparisons (α = 0.05). Interaction effects between factors were analyzed using multifactor ANOVA. Differences were considered statistically significant at p < 0.05. OriginPro 2021 (OriginLab, Hampton, MA, USA) was used for graphing.

3. Results

3.1. LAI and SPAD Values

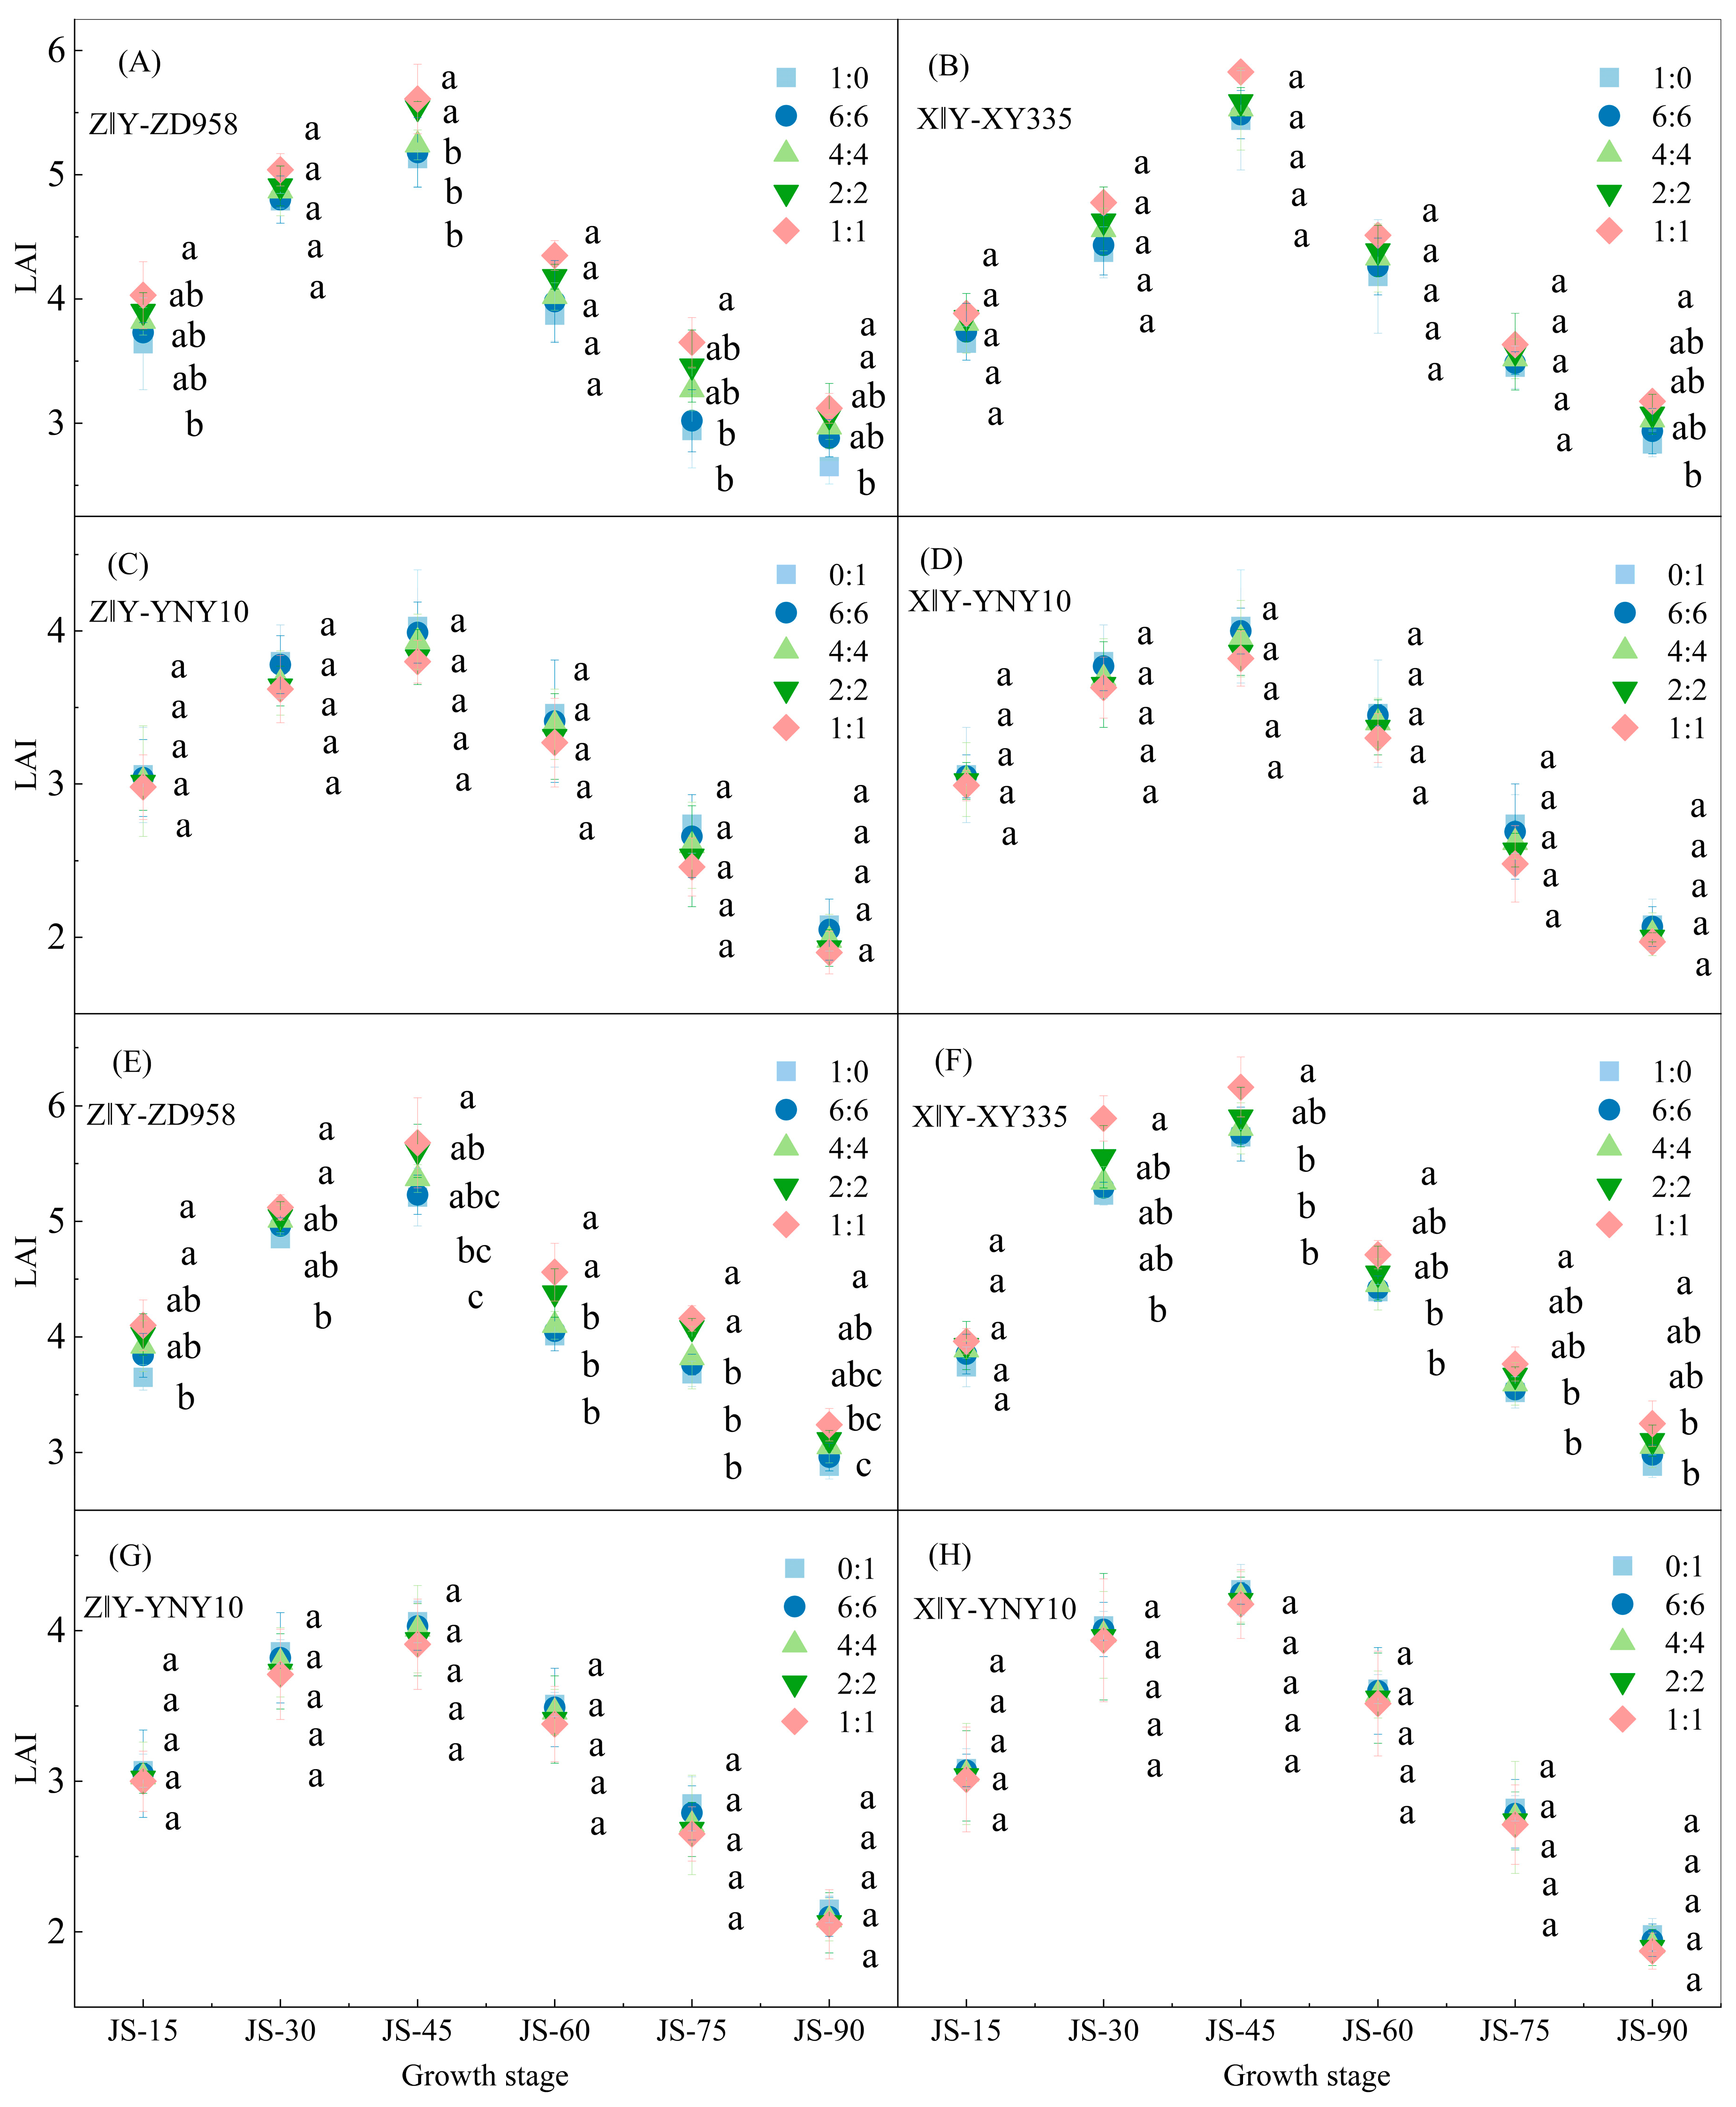
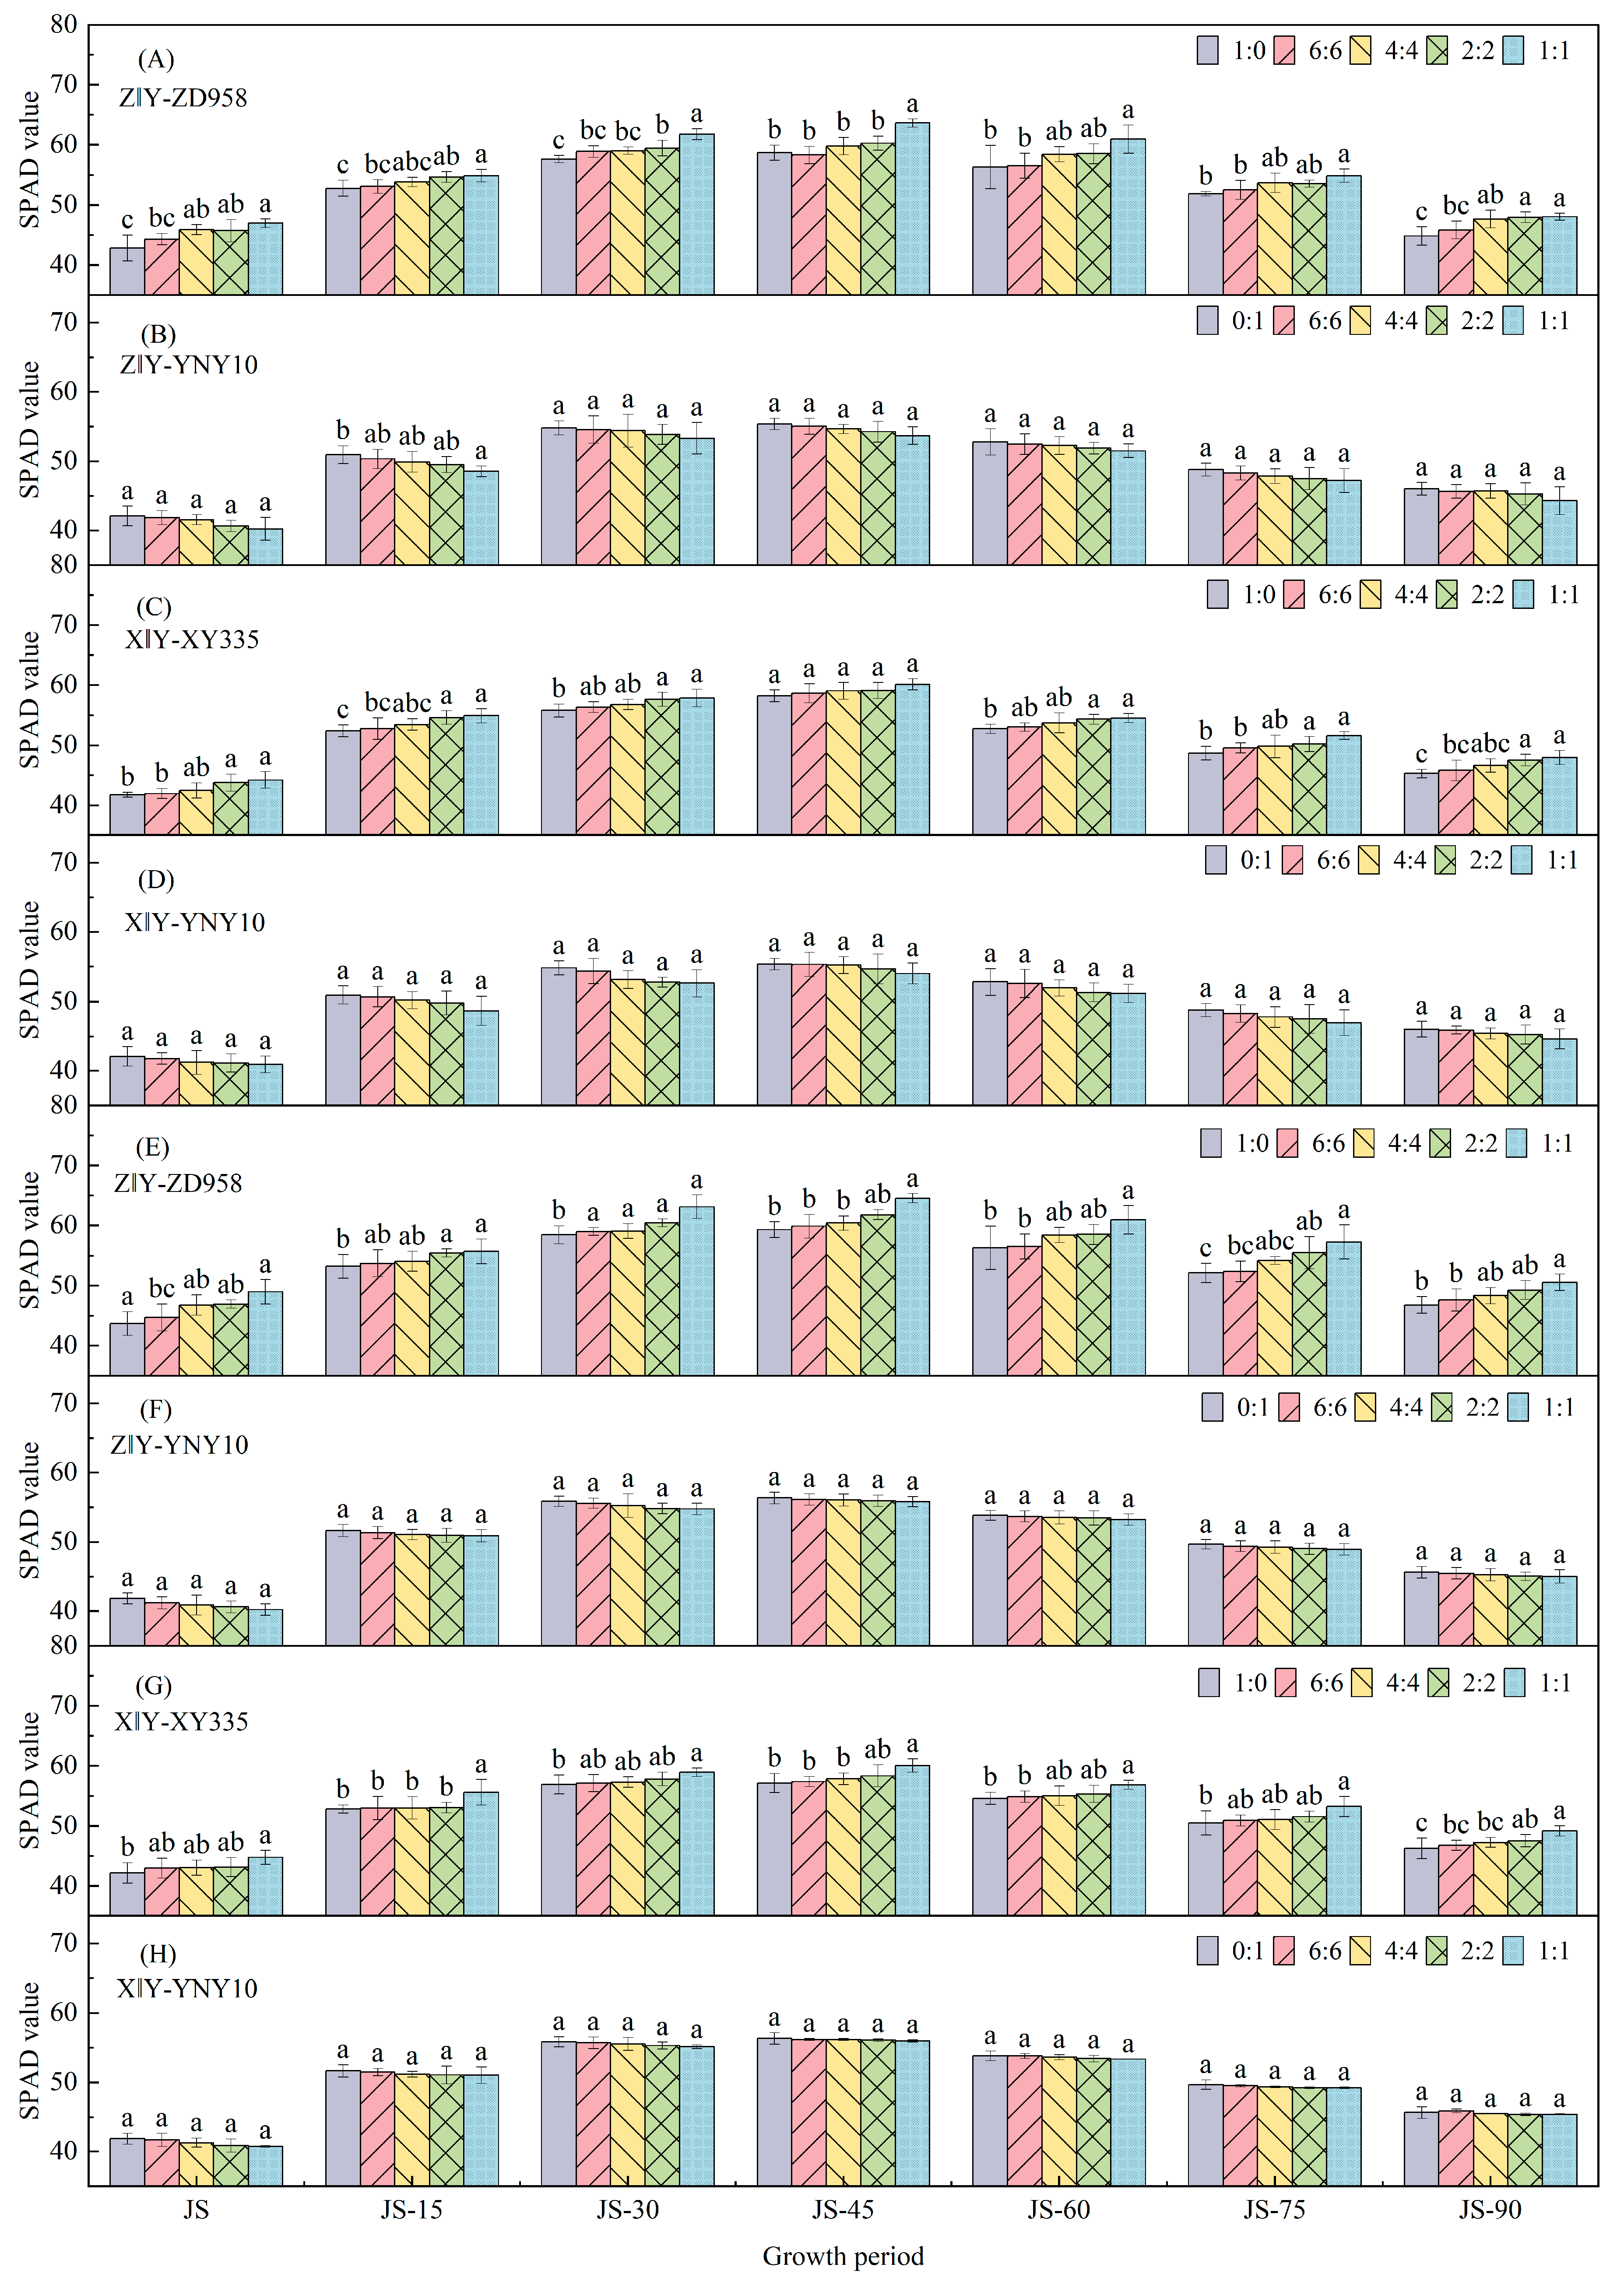
As shown in Figure 5 and Figure 6, under monoculture conditions, the overall LAI and SPAD values for each sampling period were ZD958 > XY335 > YNY10. Under the intercropping pattern, as the row ratio decreased, the LAI and SPAD values gradually increased for the long-season varieties ZD958 and XY335 but gradually decreased for the short-season variety YNY10. However, the difference between intercropped YNY10 and its monoculture was not significant.
In the 2023–2024 trials, compared with the monoculture, ZD958 in Z‖Y-(2:2) and Z‖Y-(1:1) increased the average LAI by 7.97% and 9.27% during the JS-45 period, respectively, and by 11.59% and 15.17% during the JS-90 period, respectively, with the values of both periods being significant (p < 0.05). Compared with the monoculture, the average LAI of XY335 in X‖Y-(6:6–1:1) increased by 0.59–7.11% during the JS-45 period, but the difference was significant only in 2023 (p < 0.05). However, the average LAI of XY335 in X‖Y-(1:1) significantly increased by 11.84% during the JS-90 period. Meanwhile, SPAD measurements revealed that during the JS-45 and JS-90 periods, the average increase in ZD958 in Z‖Y-(1:1) was 8.64% and 7.56%, respectively, compared with the monoculture, while the average increase in XY335 in X‖Y-(1:1) was 4.21% and 6.11%, respectively, which significantly differed from the monoculture (p < 0.05).

3.2. Photosynthesis Parameters

As shown in Table 3 and Table 4, during the JS-45 and JS-75 periods, as the intercropping row ratio decreased, the long-season varieties showed gradual increases in Pn, Gs, and Tr, reaching maximum values at an intercropping row ratio of 1:1, while Ci showed a gradual downward trend. The patterns of photosynthetic parameter changes for the short-season variety were opposite to those of the long-season varieties. ANOVA showed that during the JS-45 and JS-75 periods, the effects of year and intercropping ratio as single factors on Pn, Gs, Ci, and Tr in both the long- and short-season varieties reached a highly significant level (p < 0.01).
Over the 2-year trials, during the JS-45 periods, the Pn, Gs, and Tr values of ZD958 in Z‖Y-(6:6-1:1) and XY335 in X‖Y-(6:6-1:1) increased on an average by 2.03–10.06%, 12.05–43.12%, and 11.00–33.26%, and by 2.16–7.39%, 6.64–35.19%, and 13.04–25.72%, respectively, compared with the monocultures, while Ci decreased by 5.55–14.78% and 2.76–10.63%, respectively. For YNY10 in Z‖Y-(1:1) and X‖Y-(1:1), the average Pn, Gs, and Tr decreased by 1.83–6.58%, 5.08–45.80%, and 5.94–15.38%, and by 1.10–6.28%, 12.67–33.78%, and 6.00–11.83%, respectively, compared with the monocultures. However, the Ci values increased by 0.42–7.38% and 1.87–6.05% compared with the monocultures (Table 3).
Similarly, during the JS-75 period, the Pn, Gs, and Tr values of ZD958 in Z‖Y-(6:6-1:1) and XY335 in X‖Y-(6:6-1:1) increased by 2.43–8.49%, 12.94–42.29%, and 5.20–19.52%, and by 2.14–9.20%, 8.33–47.69%, and 1.76–15.08%, respectively, while Ci decreased by 2.77–8.17% and 1.13–4.67%, respectively, compared to the monocultures. However, the photosynthetic parameters of the short-season variety decreased in this period (Table 4). Overall, ZD958 in Z‖Y-2:2 and 1:1, and XY335 in X‖Y-2:2 and 1:1 showed significant improvements (p < 0.05) in photosynthetic parameters.

3.3. Accumulation of Dry Matter in Different Organs

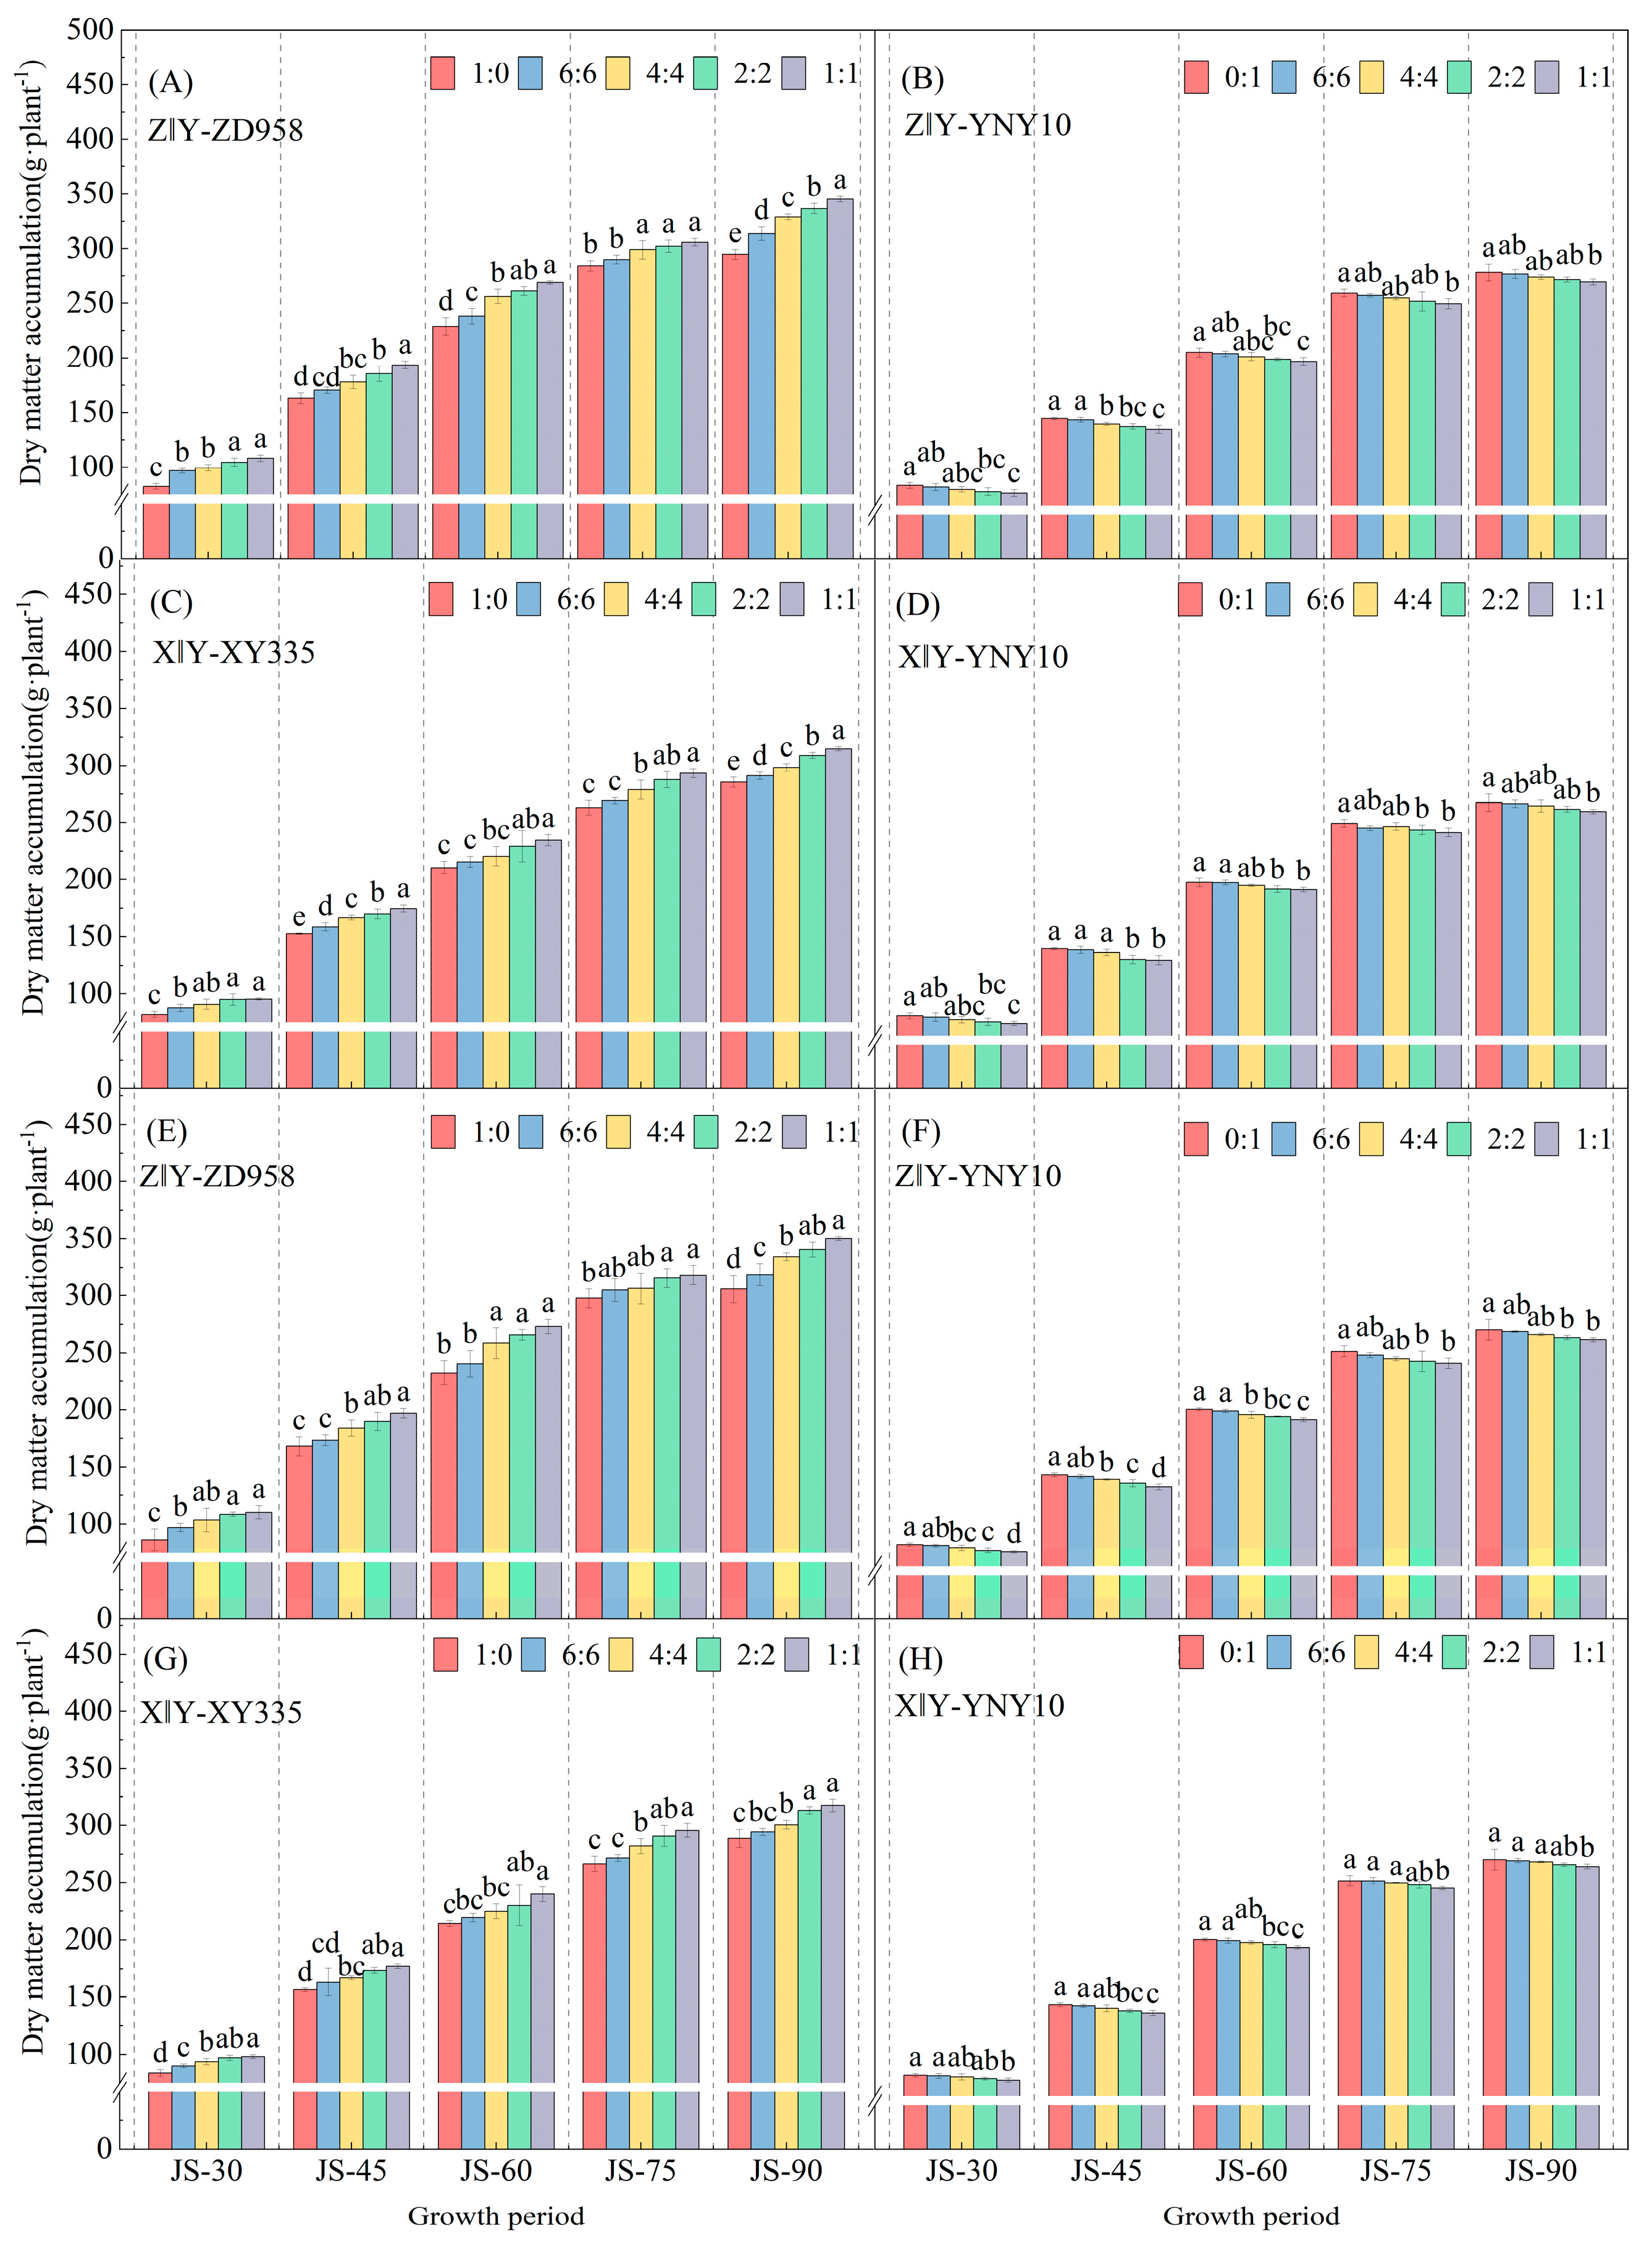
As shown in Figure 7, under monoculture conditions, the dry matter accumulation generally followed the order ZD958 > XY335 > YNY10. Under intercropping patterns of long- and short-season varieties, as the intercropping row ratio decreased, the dry matter accumulation of long-season varieties gradually increased, while that of the short-season variety gradually decreased. Over the 2-year trials, during the JS-45 and JS-90 stages, dry matter accumulation of ZD958 in Z‖Y-(4:4-1:1) and XY335 in X‖Y-(4:4-1:1) increased by 9.34–18.01% and 10.47–15.78% (2023) and 8.12–13.90% and 4.32–10.11% (2024), respectively, compared with the monocultures; while that of YNY10 in Z‖Y-(4:4-1:1) and X‖Y-(4:4-1:1) decreased by 3.24–7.34% and 1.57–3.22% (2023) and 2.19–6.12% and 0.95–2.65% (2024), respectively, compared with the monocultures.
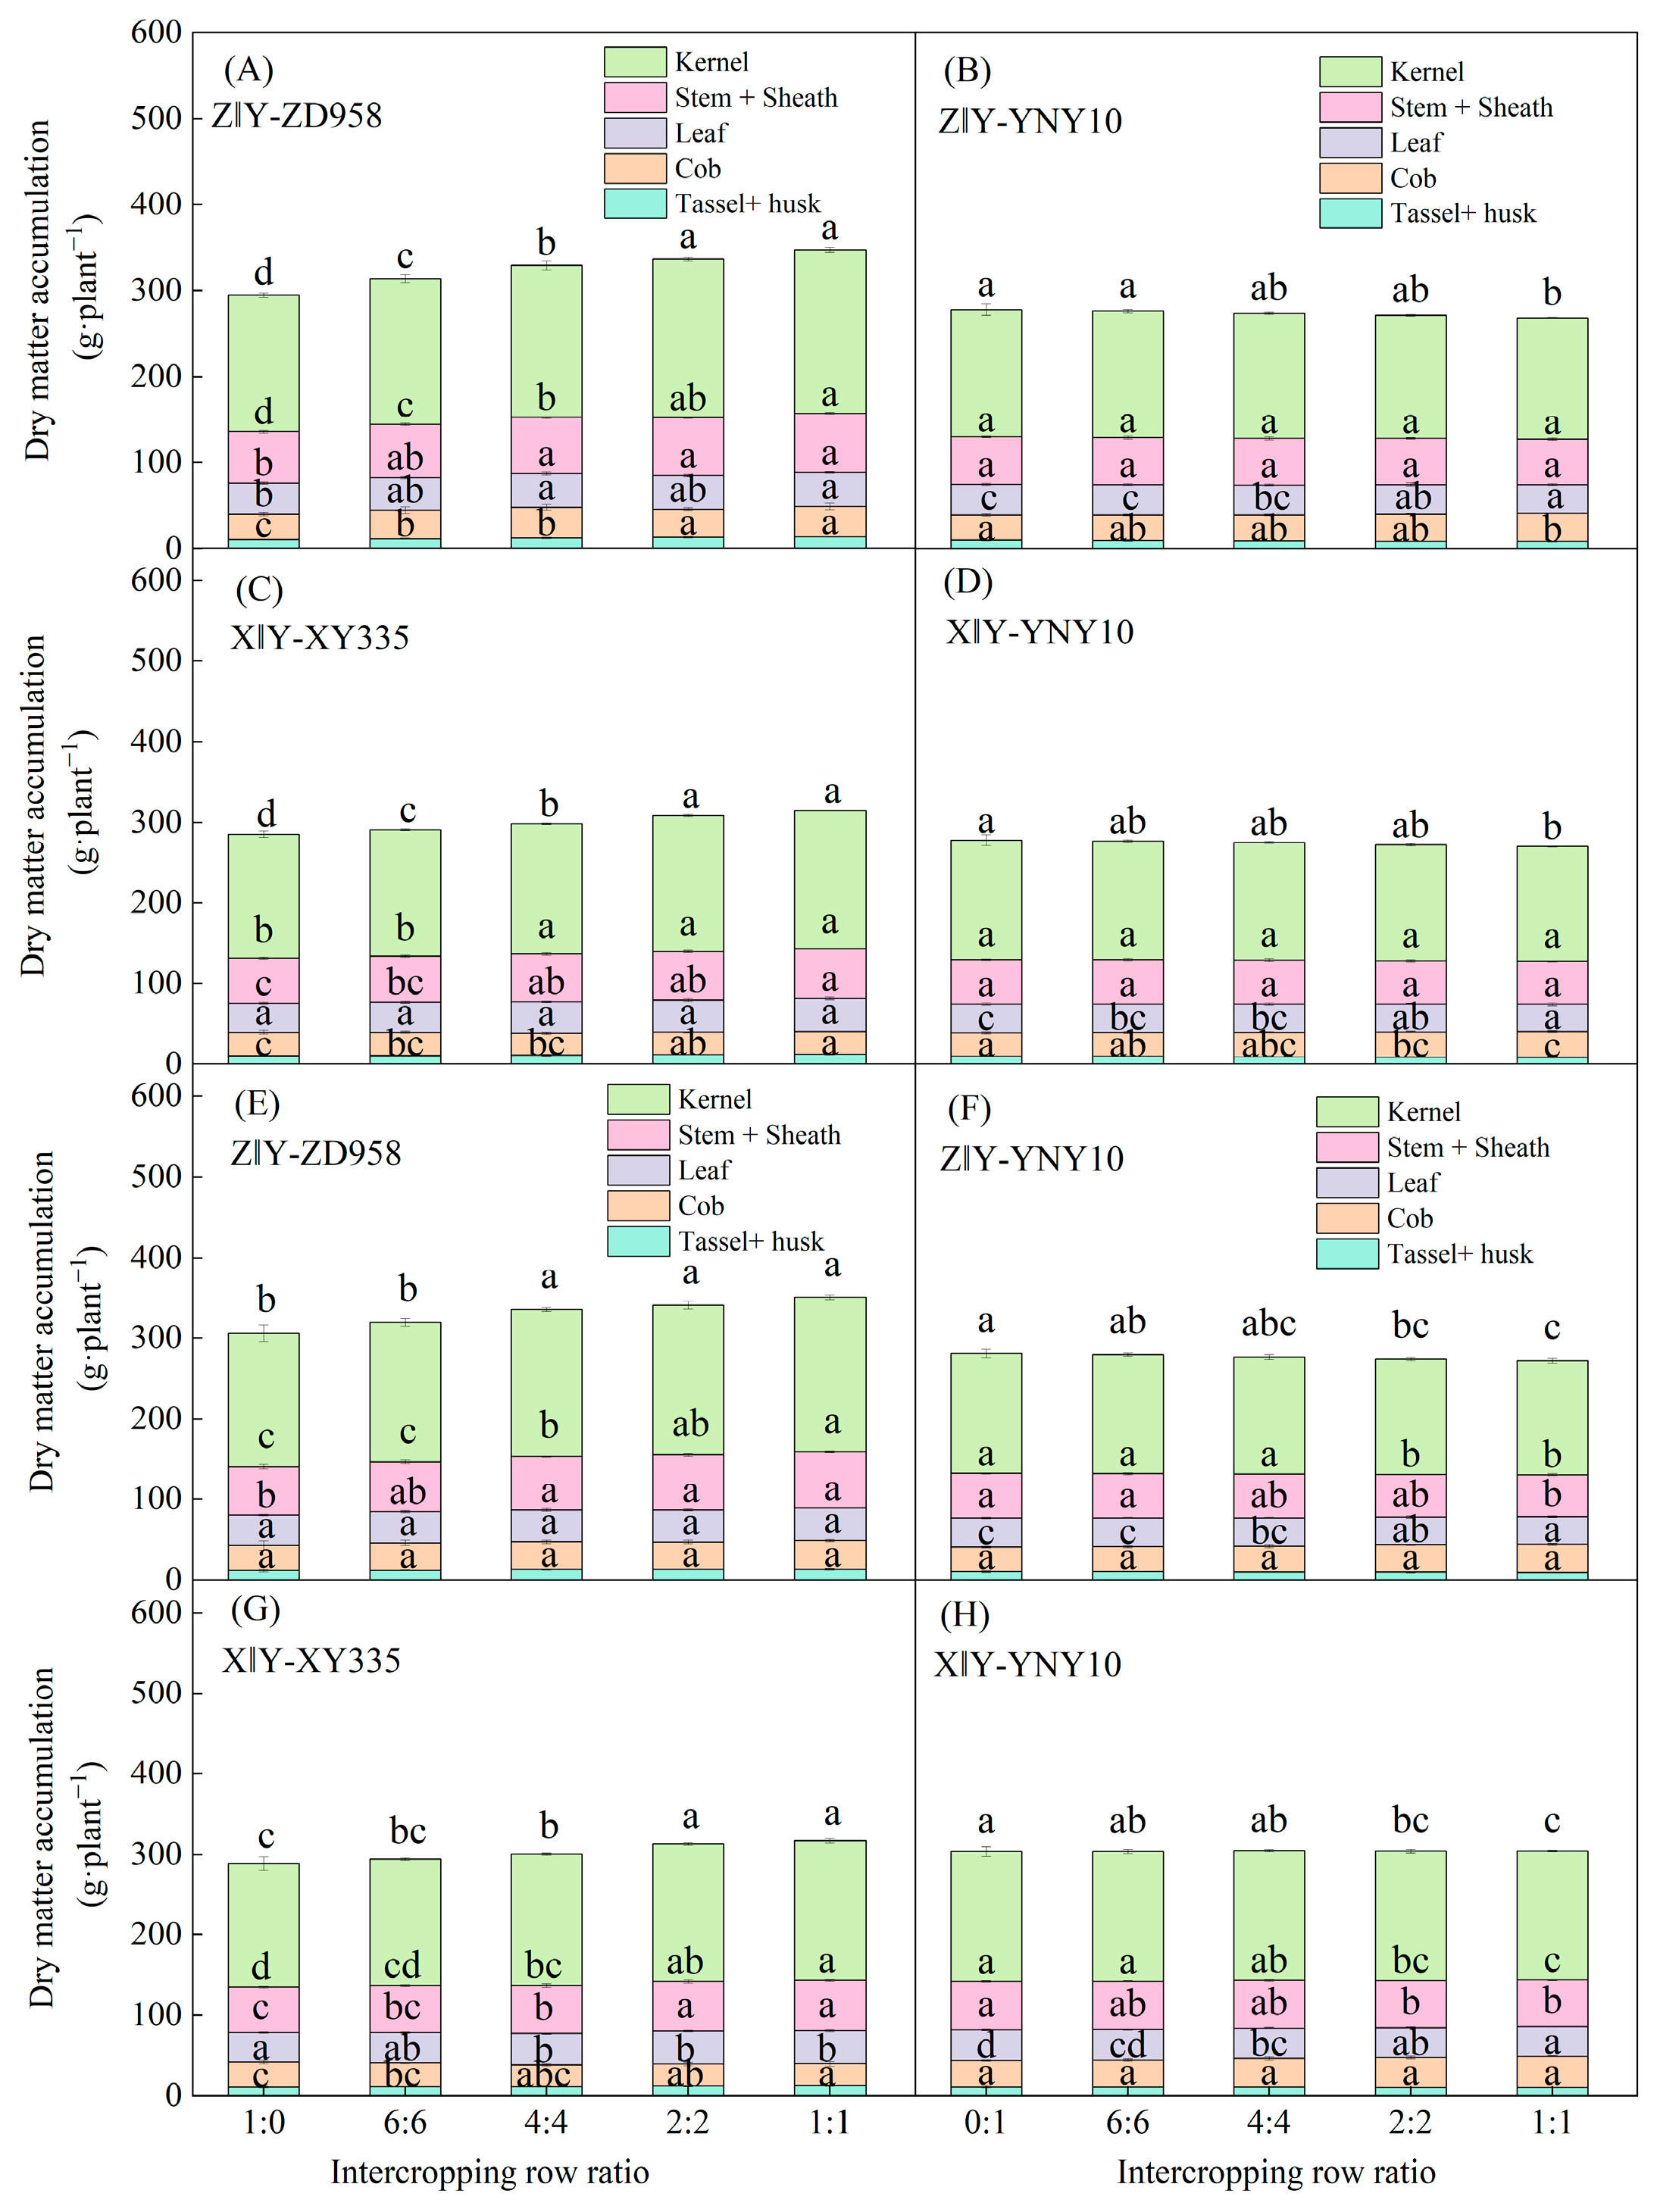
Figure 8 further shows that dry matter accumulation during the JS-90 period was mainly distributed in the kernels, specifically in the following order: kernels > stems + sheaths > leaves > cobs > tassels + husks. Based on the 2-year average, under monoculture conditions, the proportion of kernel accumulation to total biomass was as follows: ZD958 (53.87%) > XY335 (53.62%) > YNY10 (53.06%). The kernel accumulation of ZD958 in Z‖Y-(6:6-1:1) and XY335 in X‖Y-(6:6-1:1) accounted for 54.07–54.71% and 53.77–54.73% of the total biomass, respectively. Compared to their monocultures, these values increased by 0.20–0.84% and 0.15–1.10%. Meanwhile, in the 2-year trial, the kernel accumulation of YNY10 in Z‖Y-(6:6-1:1) and YNY10 in X‖Y-(6:6-1:1) accounted for an average of 52.97–52.17% and 52.8–51.90% of the total biomass, respectively, which was 0.08–0.89% and 0.18–1.16% lower than their respective monocultures, respectively.

3.4. Transportation of Dry Matter and Its Contribution Rate to Grain Yield

As shown in Table 5, based on changes in dry matter transfer capacity and transfer rate and the contribution rate of transferred dry matter to grain yield, as the intercropping row ratio decreased, the proportion of the long-season varieties gradually increased, while the proportion of the short-season variety decreased. Compared to the monocultures over the 2 years, ZD958 in Z‖Y-(6:6-1:1) showed average increases of 7.03–44.08%, 3.48–22.77%, and 1.90–22.94%, while XY335 in X‖Y-(6:6-1:1) showed average increases of 5.39–29.89%, 1.89–13.27%, and 3.07–15.61%, respectively. When the intercropping row ratio was 1:1, the dry matter transportation of ZD958 and XY335 significantly increased (p < 0.05). However, YNY10 did not significantly differ between the monocropping and intercropping treatments.

3.5. Grain Yield and Yield Components

Shown in Table 6 are the effects of the combination of varieties and intercropping rows ratio on the number of effective ears, number of kernels per ear, hundred-kernel weight, and grain yield of long-season varieties at the significant or extremely significant (p < 0.01) levels. Intercropping row ratio had an extremely significant (p < 0.01) effect on the grain yield of short-season variety. Year and variety combination only had an interactive effect on the number of kernels per ear of long-season varieties. As shown by the results from the 2-year trail, the grain yield of each variety grown in monoculture was ZD958 > XY335 > YNY10. As the intercropping row ratio decreased, the grain yield ZD958 and XY335 gradually increased. Among these, the grain yield of ZD958 and XY335 in the Z‖Y-(6:6-1:1) and X‖Y-(6:6-1:1) plots had 6.94–18.16% and 3.44–15.63% higher grain yields, respectively, than their monocultures over the 2 years, with all differences reaching significance (p < 0.05). The increase in grain yield was primarily attributed to significant improvements in hundred-kernel weight and number of kernels per ear. However, for YNY10, the grain yield and hundred-kernel weight declined with decreasing intercropping row ratio, although the differences were not significant.

3.6. Average Grain Yield of Composite Population During Harvest Season

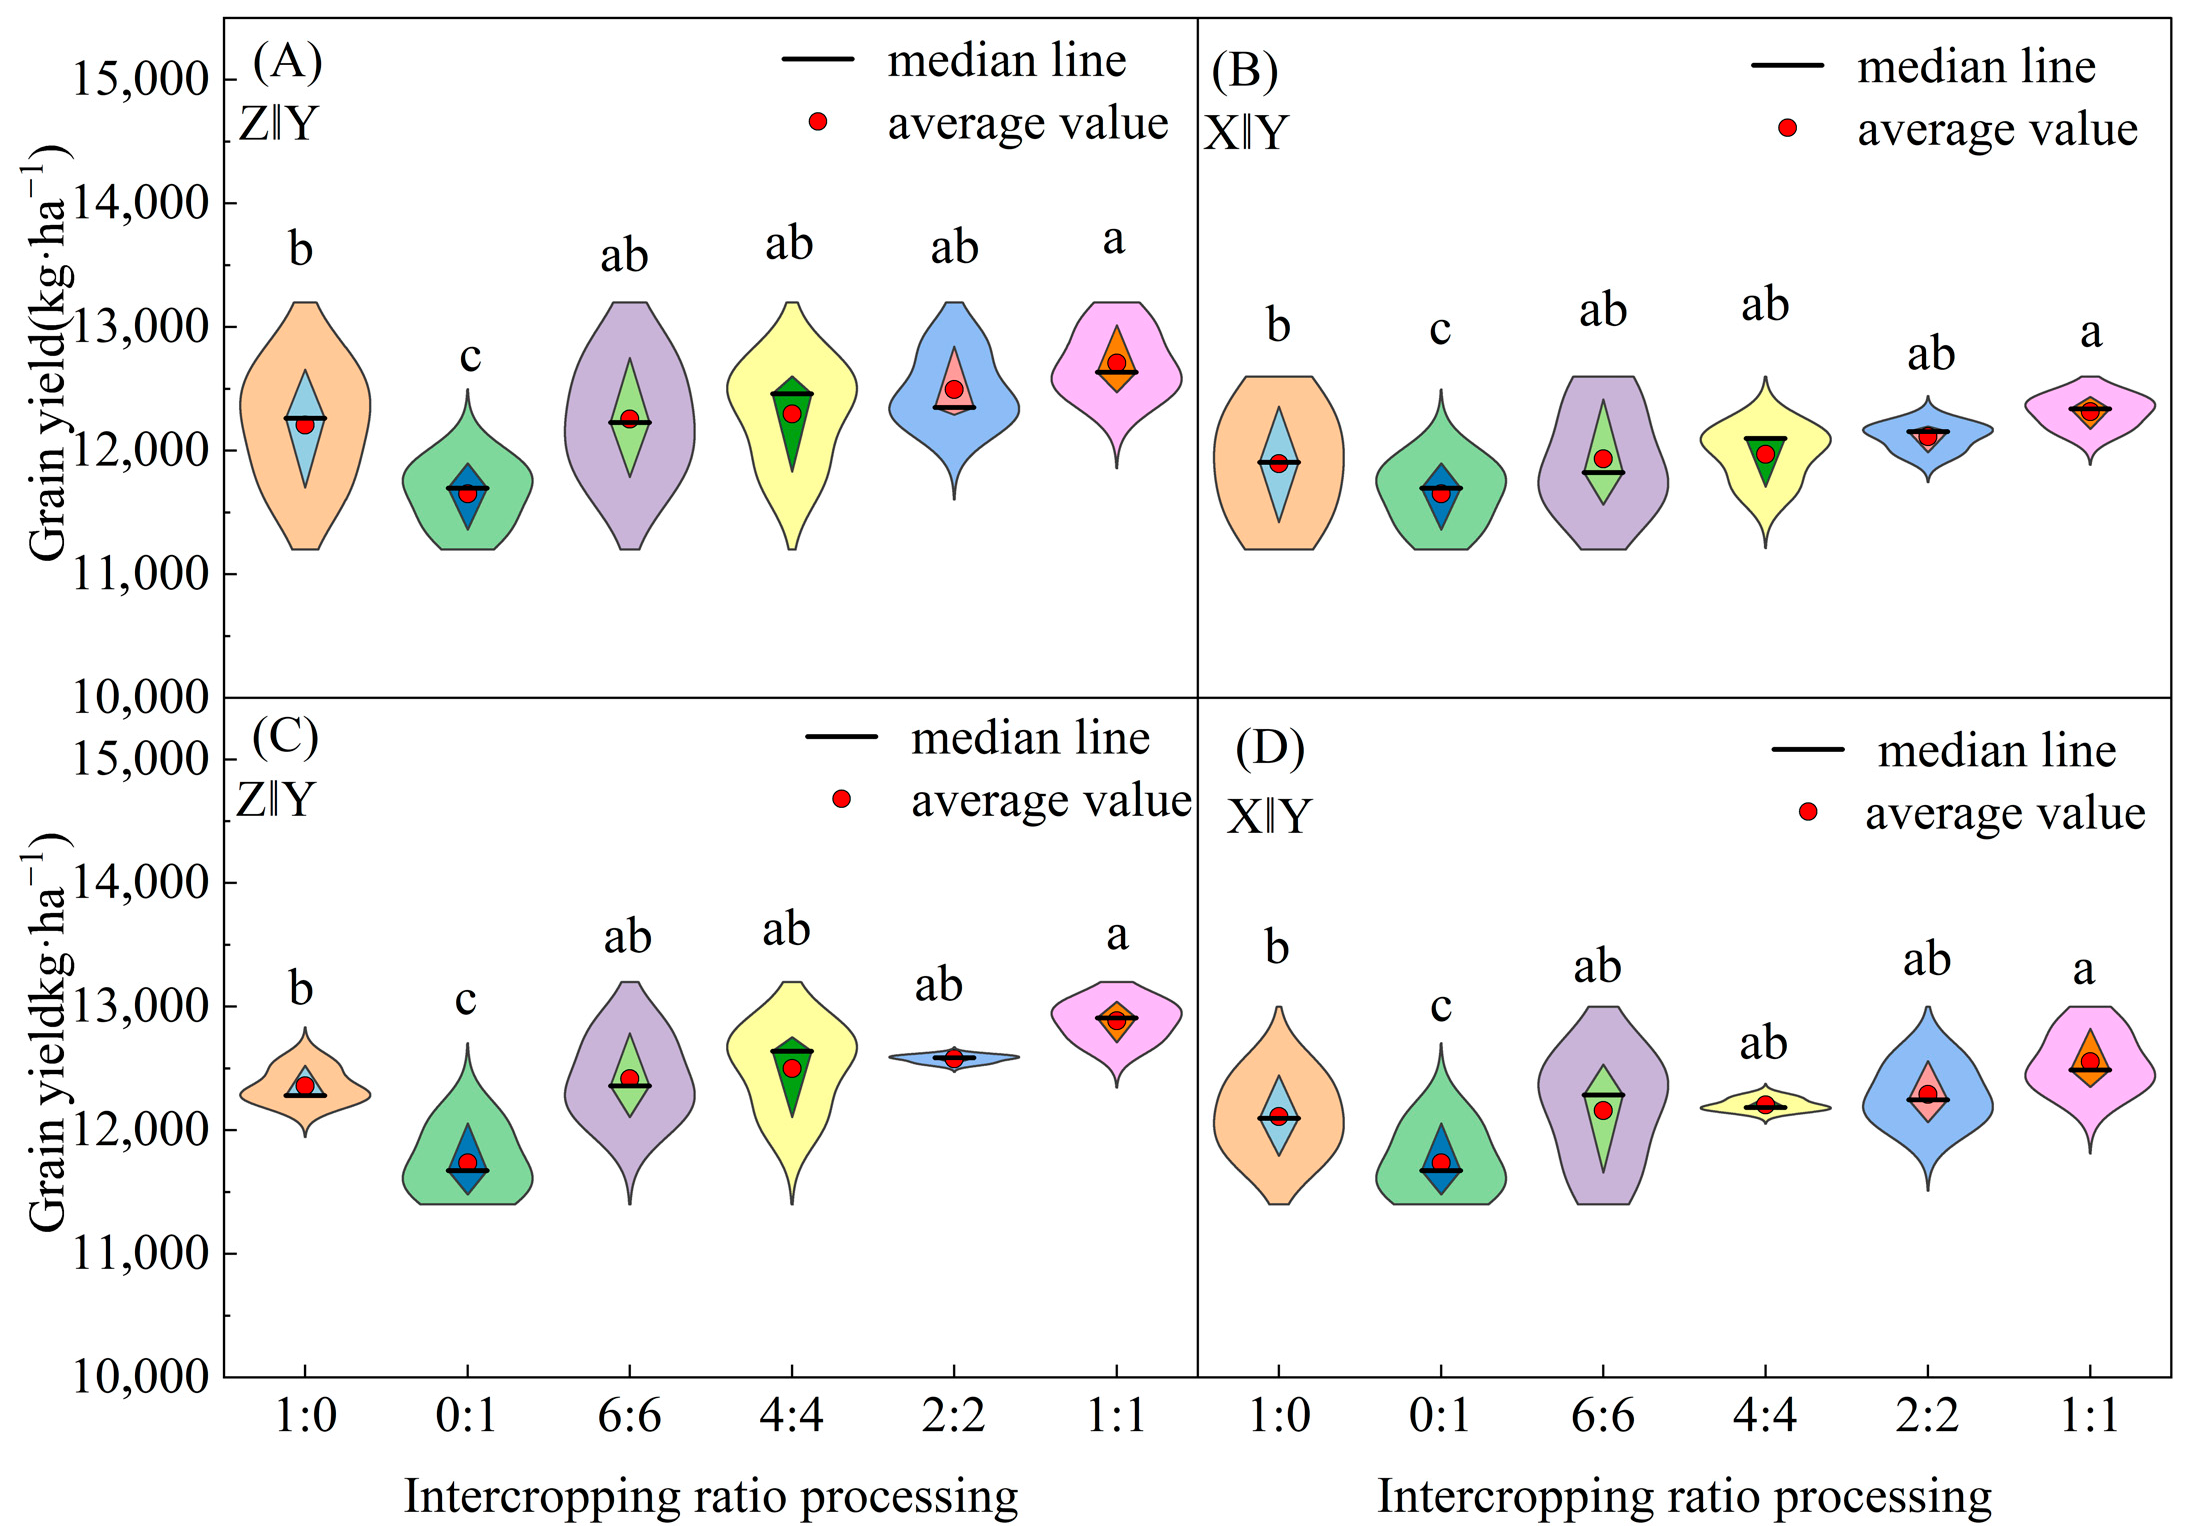
From the average grain yield of the Z‖Y-(6:6-1:1) and X‖Y-(6:6-1:1) maize composite populations (Figure 9), as the intercropping row ratio decreased, the average grain yield of the composite population showed an increasing trend, with the highest average grain yield observed at an intercropping row ratio of 1:1. The grain yield reached 12,707.69 and 12,886.26 kg·ha−1 (Z‖Y-1:1), and 12,316.57 and 12,553.43 kg·ha−1 (X‖Y-1:1) for the 2 years, which were significantly (p < 0.05) higher than that of the monocultures of ZD958 and XY335 by 4.11% and 4.26%, and 3.54% and 3.65%, respectively. In addition, compared with the YNY10 monoculture (Z‖Y-0:1 and X‖Y-0:1), the composite population in the Z‖Y-(6:6-1:1) and X‖Y-(6:6-1:1) plots showed significant (p < 0.05) increases in the average grain yield over the 2 years, ranging from 5.48% to 9.43% and 3.00% to 6.33%, respectively.

3.7. Land Equivalent Ratio (LER), Aggressivity (A), and Competition Ratio (CR)

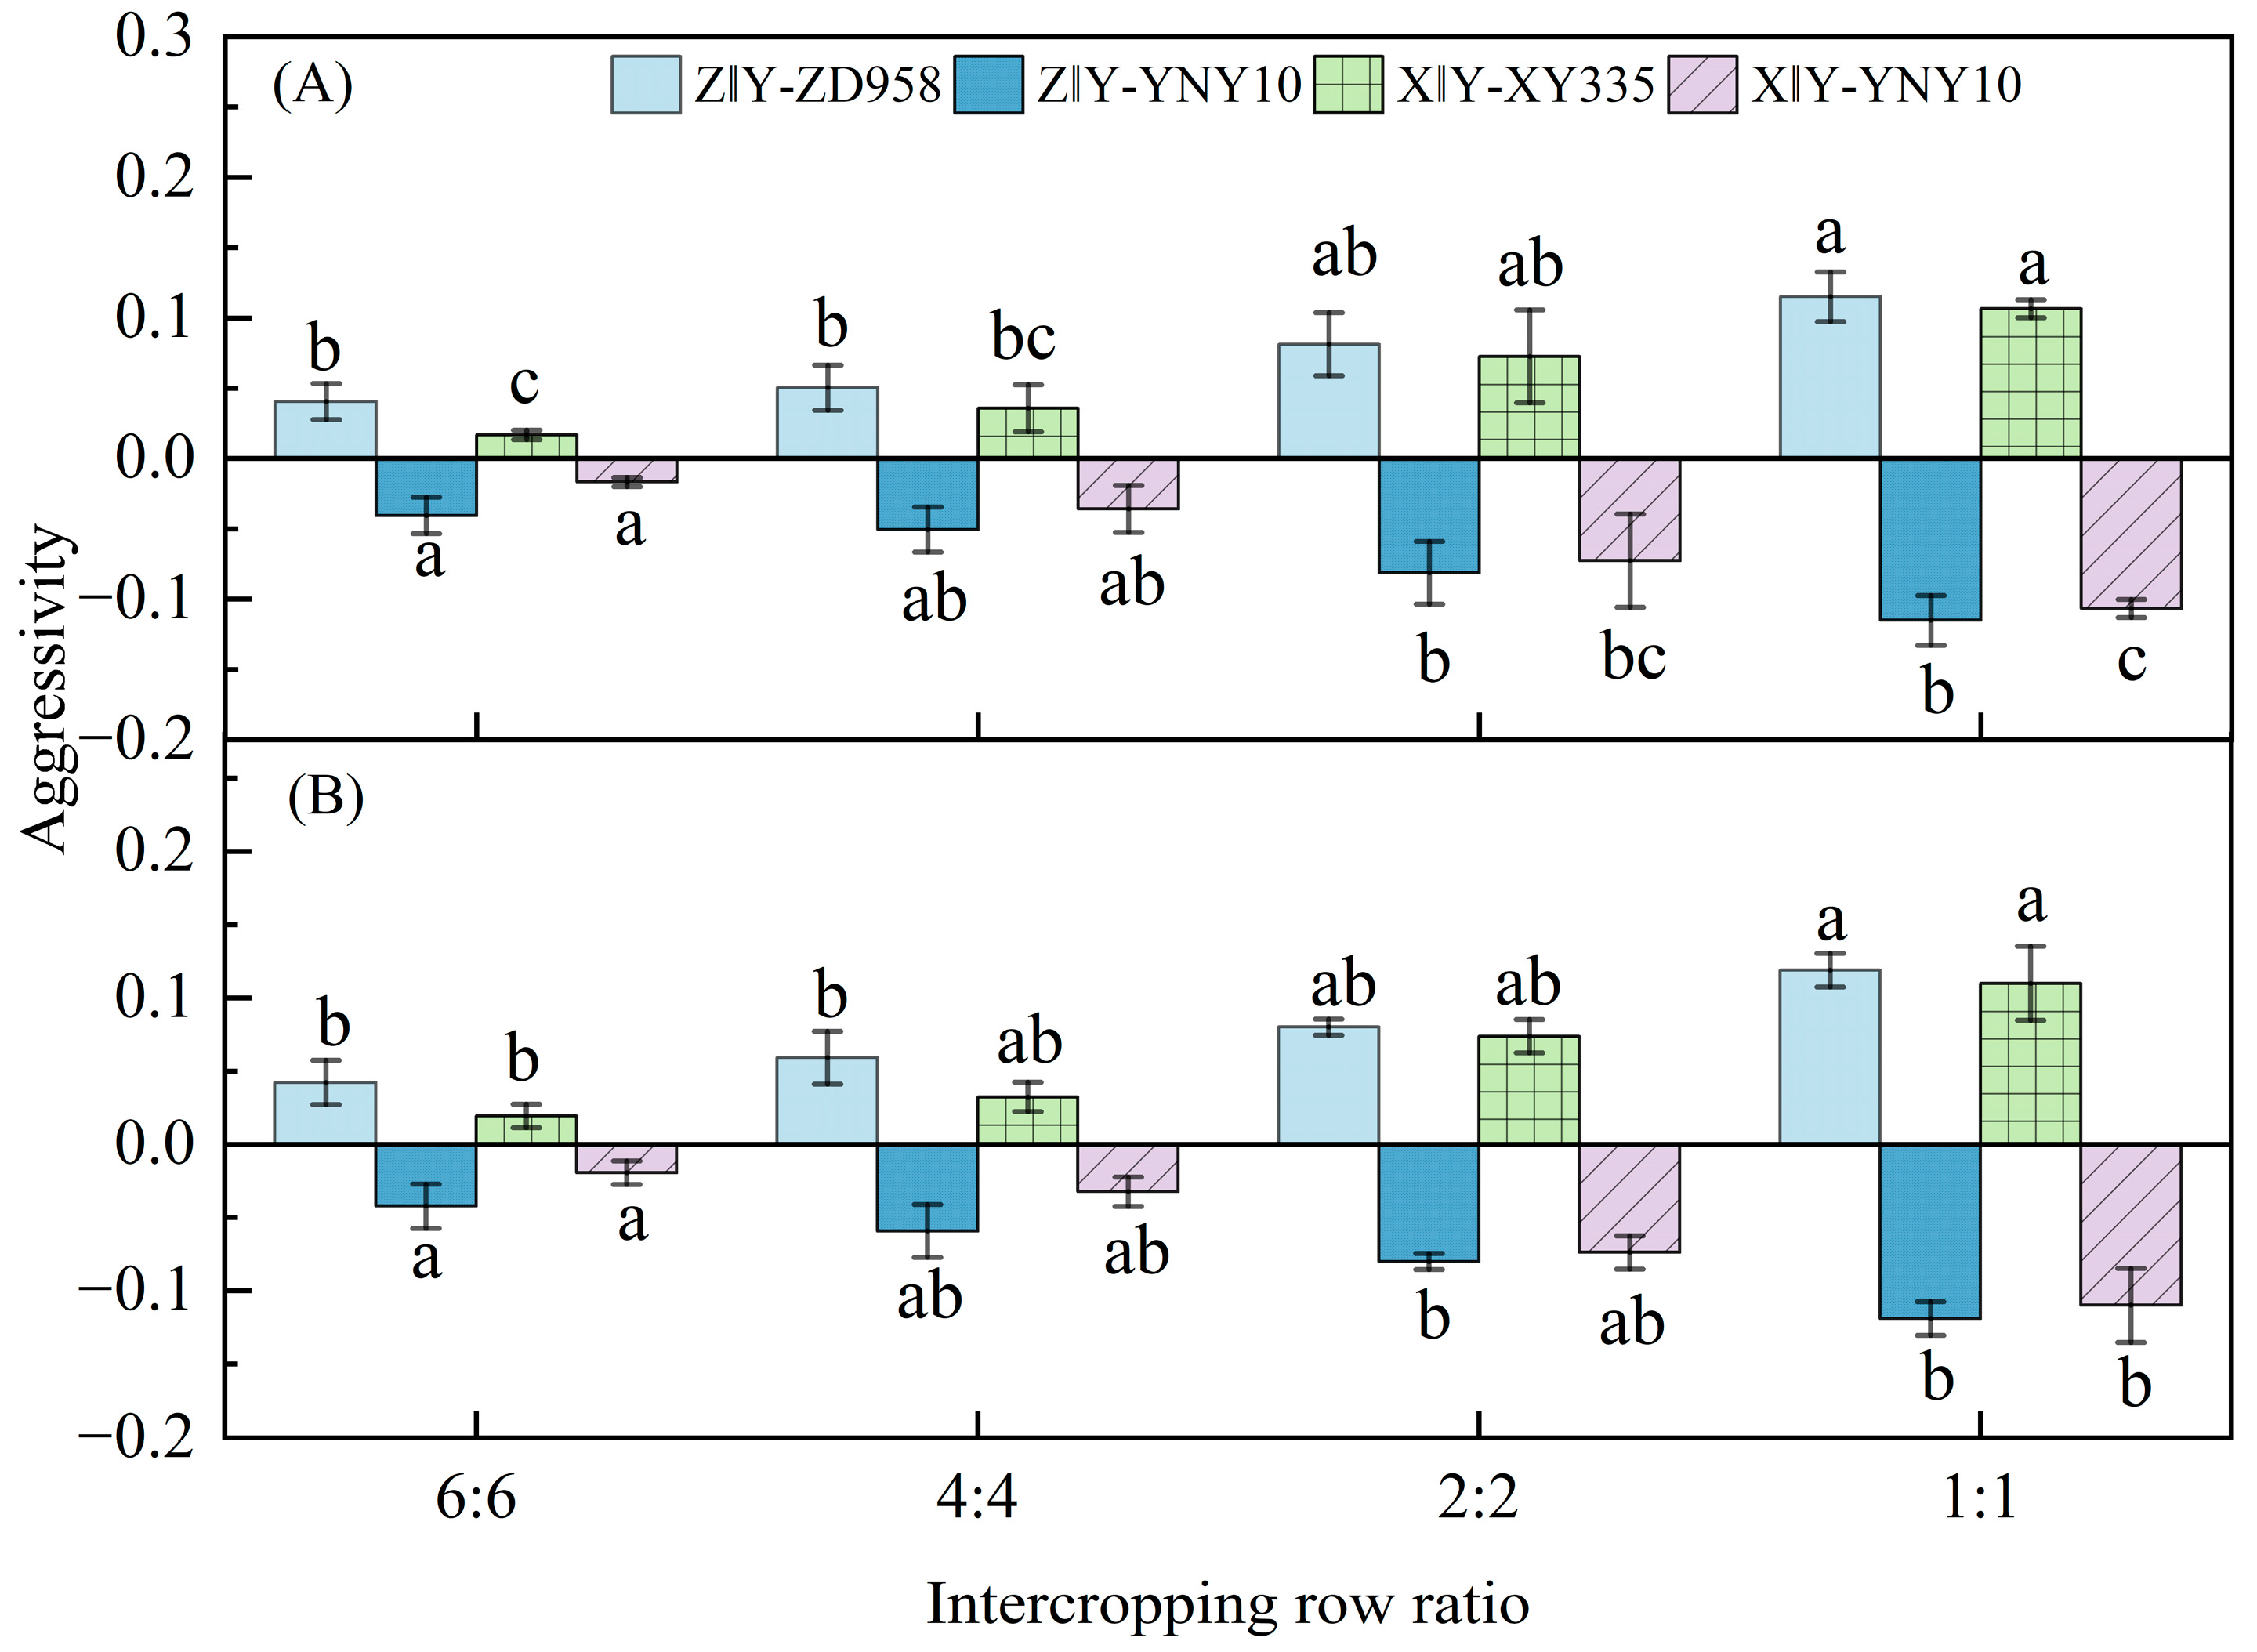
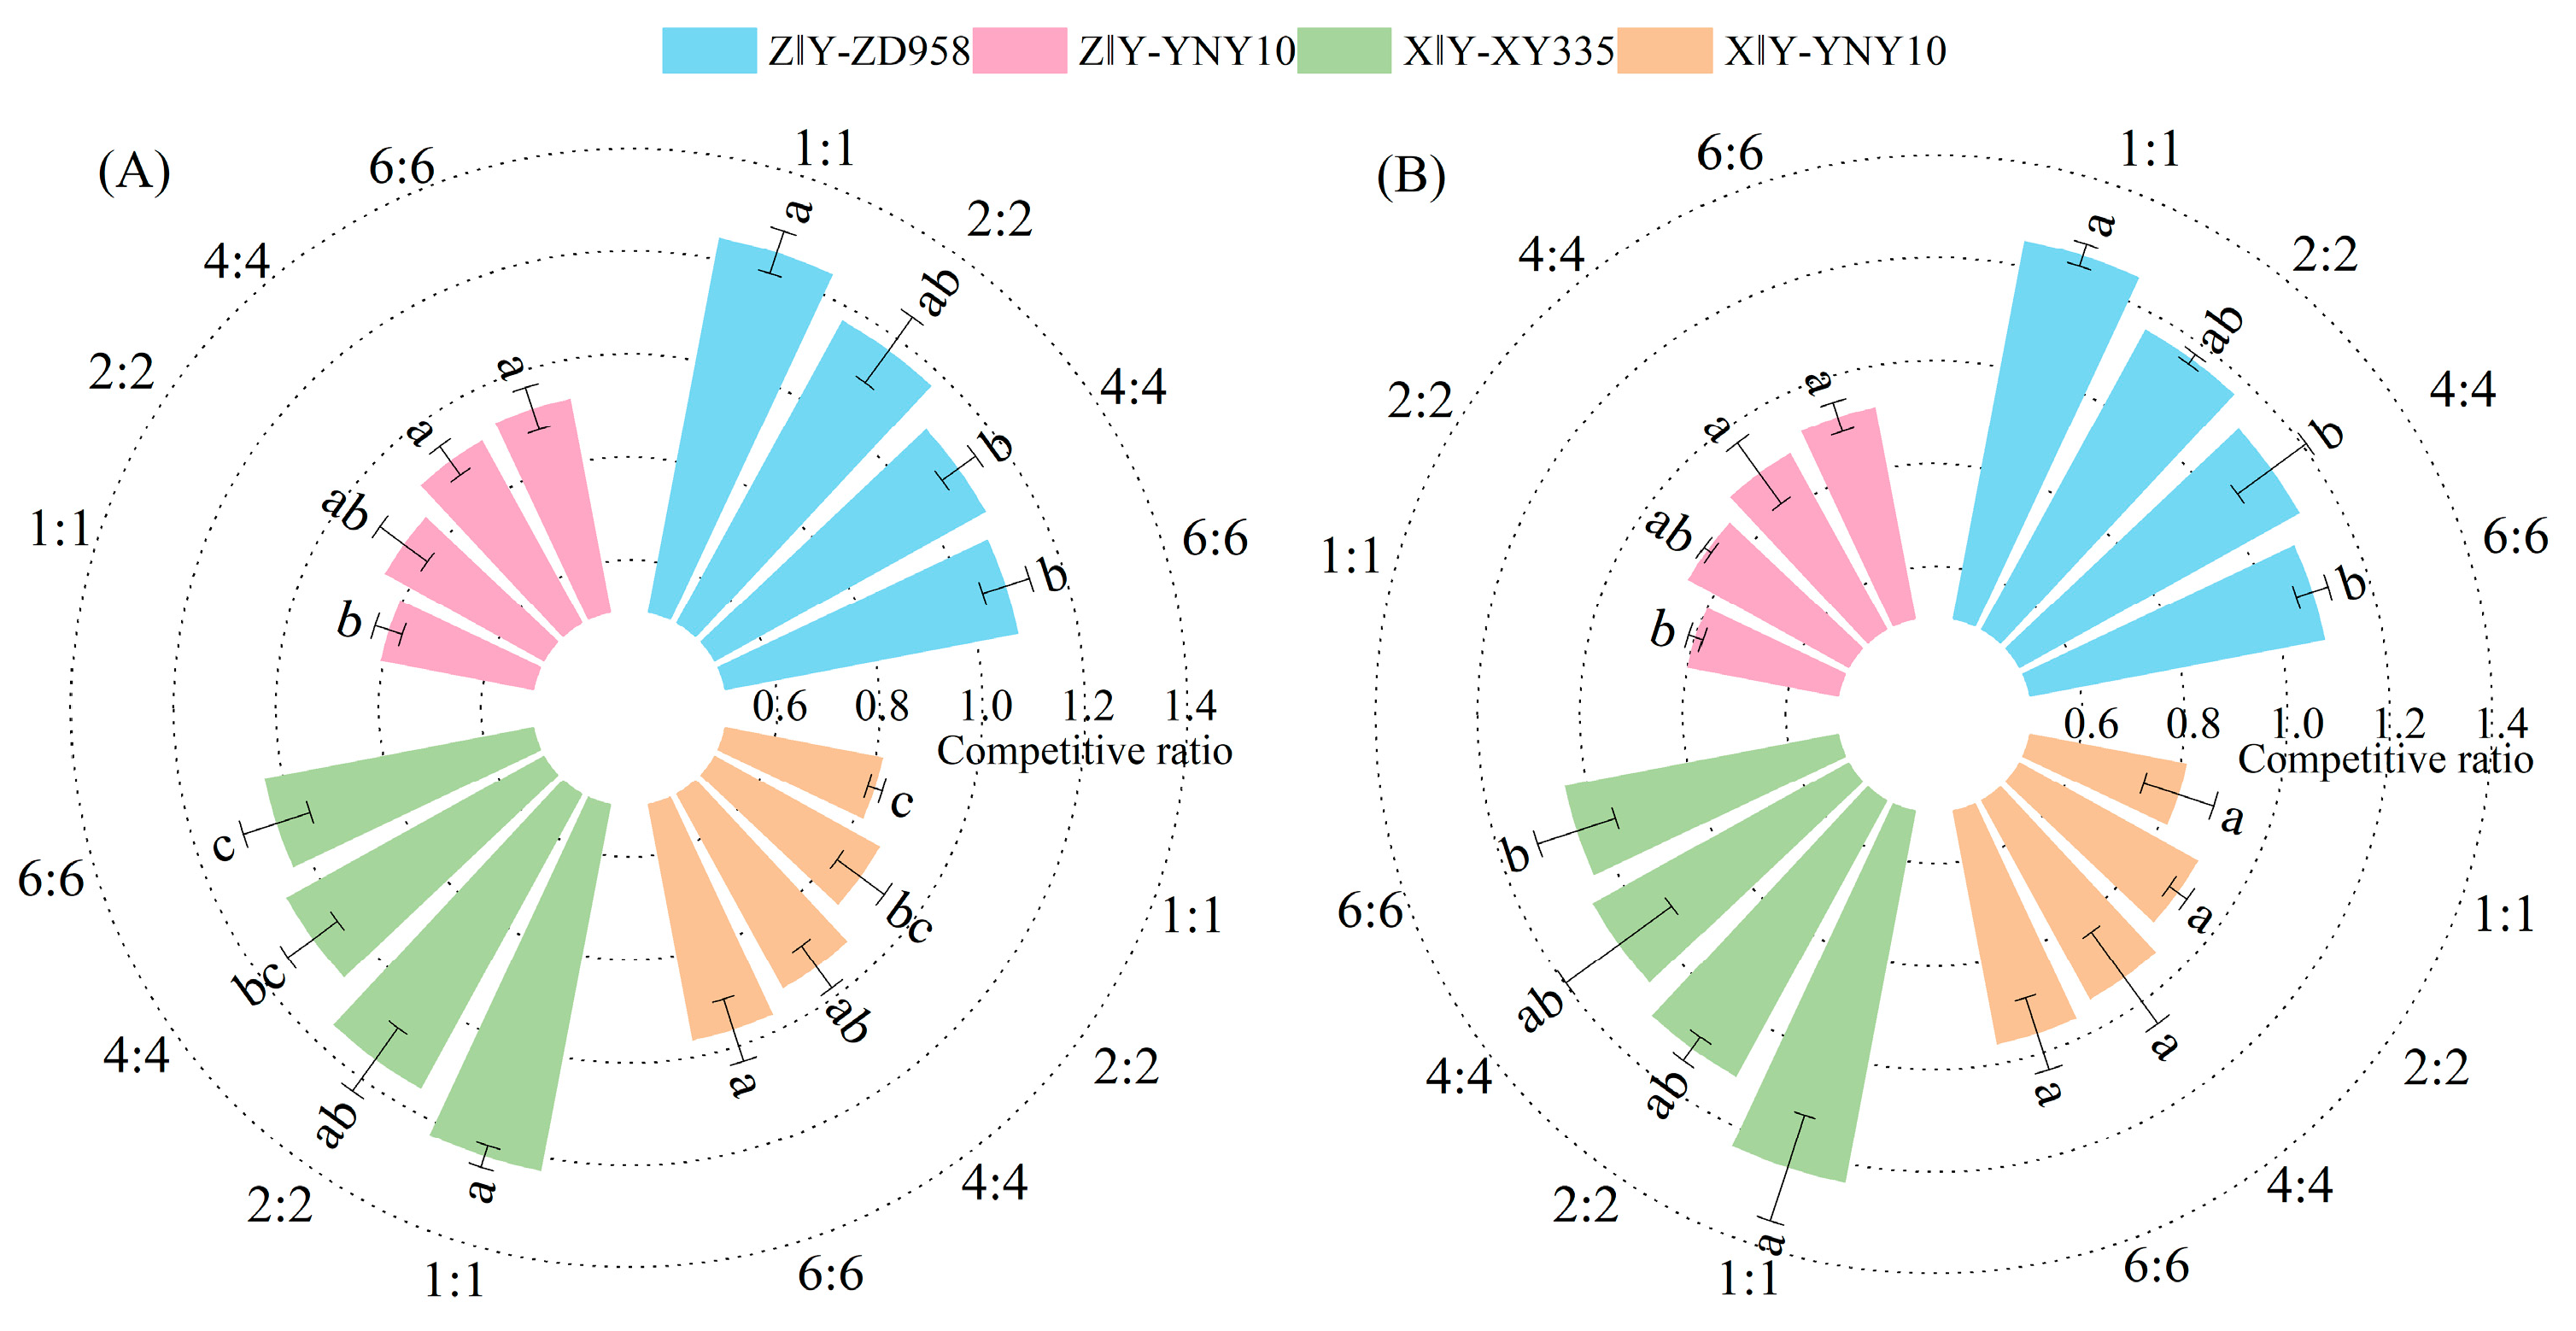
As shown in Figure 10, the LER of intercropping different long- and short-season varieties was greater than 1 in the 2-year trial, indicating that intercropping these varieties has certain yield advantages. The LER was the highest when the intercropping row ratio was 1:1 in the Z‖Y and X‖Y patterns, with 2-year averages of 1.06 and 1.05, respectively. Further analysis revealed that the A values of the long-season variety were all positive, while those of the short-season variety were negative. This indicates that the long-season variety has a competitive advantage, whereas the short-season variety is at a disadvantage (Figure 11). In addition, similar to the trend of LER and A, CR gradually increased with a decrease in the intercropping row ratio and reached its maximum value when the intercropping row ratio was 1:1 (CR values of ZD958 and XY335 were 0.12 and 0.11, respectively), while the short-season variety showed the opposite trend (Figure 12).

4. Discussion

4.1. Effect of Intercropping Row Ratio on the Photosynthetic Characteristics of Maize Under Different Intercropping Patterns of Long- and Short-Season Maize Varieties

In recent years, high-density planting has become a key measure and development trend for achieving large-scale high yields in maize production worldwide [38]. However, with increases in planting density, the leaves cover each other, which not only makes the light transmittance in the ear layer and lower layers of the population become worse, but also affects the kernel filling process, resulting in a significant decrease in kernel weight [39,40,41]. Extensive theoretical research and production practice have demonstrated that improving canopy structure and its internal light distribution, achieving higher light interception and utilization rates of the population is crucial for fully realizing the yield advantage of densely planted maize population [42,43]. As a key measure to coordinate individual spatial configuration in the field and optimize group light environment, innovation in planting methods has always been a topic of interest in crop production research [44,45]. Previous studies have shown that intercropping maize/soybean [11] and maize/peanut [46] can form a high and low staggered canopy structure, significantly improving the photosynthetic performance parameters in maize, such as Gs, Tr, and Pn [47]. The intercropping between maize and alfalfa can optimize the light environment of the maize ear layer and bottom layer, and increase the leaf area per plant after flowering, although it is not conducive to improving the light environment of alfalfa [48]. Intercropping studies of maize varieties with different plant types revealed that compact varieties exhibit higher SPAD and Pn in mature leaves than their monoculture counterparts [35]. The results of this study indicate that photosynthetic performance parameters, SPAD, and LAI of the long-season varieties gradually increased as the intercropping row ratio decreased. Under a 1:1 intercropping row ratio, the increase was most pronounced compared to monocropping, with all parameters reaching significant levels (p < 0.05). In contrast, the short-season variety exhibited a decreasing trend, with only Gs and Tr showing significant differences (p < 0.05) under the 1:1 row ratio compared to the monoculture. Previous studies have shown that taller crops can shade shorter crops, leading to reduced photosynthetic capacity in the shorter plants [49]. However, increasing the strip width of shorter crops can mitigate the shading effect of taller crops, thereby enhancing the photosynthetic performance of the shorter plants [50]. In this study, due to differences in plant architecture among maize varieties with varying growth periods, establishing intercropping patterns between these varieties can improve canopy structure under dense planting conditions, creating a more three-dimensional light environment [51]. This promotes the optimization of photosynthetic characteristics in long-season varieties, leading to varying degrees of shading effects exerted by these varieties on short-season varieties. This shading effect gradually increases as the intercropping row ratio decreases, but it only impacts certain photosynthetic traits.

4.2. Effect of Intercropping Row Ratio on Dry Matter Accumulation and Distribution in Intercropping Patterns of Long- and Short-Season Maize Varieties

Dry matter accumulation plays a crucial role in determining the economic yield of crops, and the production and distribution of dry matter after flowering are key factors influencing yield [52,53]. Therefore, investigating the dynamic changes in dry matter accumulation and distribution across different crop organs is essential for elucidating the mechanisms underlying yield performance differences under various cropping systems. Maize/peanut intercropping [54] or maize/soybean intercropping [55] enhances maize’s access to sunlight, thereby increasing maize biomass. Moreover, the increase in maize biomass exceeds the decrease in soybean or peanut biomass, which in turn facilitates the realization of the community’s productivity advantage. Liu et al. [56] reported that intercropping compact and semi-compact maize varieties primarily and significantly affected dry matter accumulation after silking. This effect promoted accumulation in semi-compact varieties but reduced it in compact varieties. The results of this study indicate that as the intercropping row ratio decreased, both the dry matter accumulation per plant during each growth stage and the proportion of mature grain in total dry matter weight gradually increased for the long-season variety, with the opposite trend observed in the short-season variety. Under a 1:1 intercropping row ratio, significant differences (p < 0.05) were observed between all varieties and their monocultures. Meanwhile, under intercropping conditions, the increase in dry matter accumulation in the long-season varieties consistently exceeded the decrease observed in the short-season variety. Gao et al. [57] found that a maize-peanut intercropping system increased maize dry matter accumulation and the contribution rate of dry matter transport to grain yield but reduced the dry matter transport efficiency of peanuts. The results of this study indicate that as the intercropping row ratio decreased, the dry matter transport capacity of long-season varieties showed a gradual increase, while that of short-season varieties exhibited no significant change. Typically, in intercropping systems, competition among different species extends beyond light resources to include competition for water and nutrients [58]. Root morphology and spatial distribution effectively reflect a crop’s ability to compete for nutrients and water within such systems [59]. When maize and peanuts are intercropped, differences in root system plasticity allow maize roots to extend beneath peanut roots, thereby occupying a larger soil volume. This grants maize a competitive advantage in nutrient acquisition, resulting in increased dry matter accumulation. Conversely, peanut roots exhibit reduced lateral spread, leading to decreased dry matter accumulation [60]. Given this, the higher dry matter accumulation observed in the long-season varieties in this study may be attributed to the remodeling of their root systems, which enhances their competitive ability for water and nutrient resources compared to the short-season variety [61,62]. This, in turn, promoted their extended green leaf duration and higher photosynthetic efficiency [63]. Additionally, although the short-season variety was at a disadvantage, the higher increase in dry matter accumulation observed in the long-season varieties compensated for the loss in dry matter accumulation of the short-season variety. This provides a crucial material foundation for enhancing the average grain yield of intercropped composite populations. However, the relationship between changes in root morphology and water-nutrient resource competition capacity under intercropping conditions among maize varieties with different growth periods and their dry matter production performance warrants further investigation.

4.3. Effect of Intercropping Row Ratio on Maize Yield and Competition Index Under Different Intercropping Modes of Long- and Short-Season Maize Varieties

In recent years, crop diversification has emerged as a research focus among numerous scholars. Among these approaches, intercropping not only offers the advantages of crop diversity but also incorporates spatial diversity. It has been demonstrated to maximize land resource utilization and enhance agricultural sustainability [64,65]. Indicators, such as A, CR, and LER, are commonly used to evaluate the competitive ability of different species in intercropping systems [66,67]. Numerous studies have demonstrated that intercropping maize with pea [68], maize with soybeans [69], and maize with alfalfa [70], all exhibit significant yield advantages. Li et al. [10] found that compared to the monoculture, the intercropping system of maize and peanuts increased the maize yield by 61.05% while reducing the peanut yield by 31.80%, with an LER greater than 1, demonstrating yield advantages. Hu et al. [71] reported that in a maize-pea intercropping system, maize and pea yields increased by 29% and 37%, respectively, compared to their respective monocultures, with an LER of 1.33. However, other studies have suggested that composite populations in interspecies intercropping systems do not exhibit yield advantages [72,73]. In this study, as the intercropping row ratio decreased, the grain yield of long-season maize varieties gradually increased compared with their monocultures. Meanwhile, the A of these long-season maize varieties was positive, and their CR was greater than 1, indicating that they occupied a dominant position in the intercropping system. Furthermore, under the 1:1 intercropping row ratio, the grain yield, A, and CR of the long-season maize varieties reached the highest values. The significant increase (p < 0.05) in the grain yield of the long-season varieties was attributed to the rational canopy structure and favorable ventilation conditions, which promoted the improvement of photosynthetic performance and increased dry matter accumulation [74,75], thereby increasing the 100-kernel weight and kernels number per ear. In contrast, the short-season maize variety exhibited the opposite trend and was disadvantaged in the intercropping system; however, the difference in their grain yield compared with monoculture was not significant. Li et al. [76] reported that wheat/maize intercropping increased wheat yield while decreasing maize yield. However, the increase in wheat yield exceeded the decrease in maize yield, resulting in a higher average total yield for the intercropping pattern than the monocultures. Similarly, comparable results were obtained in studies of maize/soybean intercropping [77] and maize/peanut intercropping [78]. In this study, the long-season maize varieties compensated for grain yield reductions in the short-season maize variety through higher grain yield increases, ultimately achieving increased grain yields in the intercropped composite populations. The grain yields of the Z‖Y-(1:1) and X‖Y-(1:1) intercropping patterns differed significantly (p < 0.05) from those of monocultures across all maturity groups. Concurrently, the LER of intercropped maize varieties across different growth period exhibited an increasing trend as the intercropping row ratio decreased, with all values exceeding 1. This indicates that an optimal intercropping row ratio is crucial for realizing yield advantages when intercropping long- and short-season maize varieties. However, in practical applications, it is necessary to select suitable combinations of varieties with different growth periods based on the climatic conditions and geographical characteristics of the region of interest. Meanwhile, it is essential to ensure that the varieties remain consistent in terms of cob color, kernel type, and intrinsic quality to avoid a reduction in the commercial value of grains caused by trait differences during the mechanical harvesting process. Furthermore, attention should also be paid to the similarity of ear height in the field for the intercropping composite population to create favorable conditions for efficient mechanical grain harvesting. In the future, more systematic and in-depth research is still needed on the optimal variety combination configuration for the intercropping patterns of maize varieties with different growth periods in high-latitude cold regions.

5. Conclusions

In high-latitude cold regions, intercropping of maize varieties with different growth periods (at a row ratio of 1:1) can effectively coordinate the complementary relationships between individuals within the population; improve the canopy structure of the complex population; and enhance the LAI, SPAD, and photosynthetic parameters of the leaves, and dry matter accumulation and translocation efficiency of long-season varieties. This further promoted a significant increase in kernel weight, kernels number per ear, and grain yield of long-season varieties. Moreover, compared with the short-season variety, the long-season varieties exhibited stronger competitive ability. Meanwhile, the higher yield increases for the long-season varieties effectively offset the yield loss of the short-season variety caused by their niche disadvantage, ultimately achieving an overall increase in the grain yield of the intercropped composite population.

Author Contributions

Investigation, writing—original draft, software, data curation, visualization, S.X.; investigation, validation, formal analysis, methodology, software, resources, L.M.; conceptualization, methodology, software, writing—original draft, writing—review and editing, project administration, Y.Z.; investigation, validation, formal analysis, methodology, software, Z.W.; investigation, validation, formal analysis, methodology, software, F.L.; investigation, validation, formal analysis, methodology, software, T.W.; methodology, software, formal analysis, writing—review and editing, C.Z.; conceptualization, data curation, funding acquisition, K.Y.; data curation, validation, formal analysis, methodology, writing—review and editing, S.Y. (Song Yu); investigation, validation, formal analysis, software, M.L.; investigation, validation, resources, visualization, S.Y. (Shiqiang Yu); investigation, validation, resources, visualization, J.H.; investigation, validation, resources, visualization, J.A.; investigation, validation, resources, visualization, M.G.; investigation, validation, resources, visualization, X.T.; investigation, validation, resources, visualization, J.L. All authors have read and agreed to the published version of the manuscript.

Funding

This study was supported by the National Key Research and Development Program of China (grant number: 2023YFD2301704), the Postdoctoral Science Foundation Funded General Project of Heilongjiang Province (Grant number: LBH-Z19196), the University Nursing Program for Young Scholars with Creative Talents in Heilongjiang Province (grant number: UNPYSCT-2020037), Graduate Innovation Research Project of Heilongjiang Bayi Agricultural University (grant number: NXYYJSCX2023-Y01).

Data Availability Statement

The original contributions presented in this study are included in the article. Further inquiries can be directed to the corresponding authors.

Acknowledgments

We are grateful to the National Coarse Cereals Engineering Research Center of China and the Bio-technology Center of Heilongjiang Bayi Agricultural University for providing support in performing the experiments.

Conflicts of Interest

The authors declare that they have no known competing financial interests or personal relationships that could have appeared to influence the work reported in this paper.

Abbreviations

DMTdry matter transport capacity
DMTEdry matter transport rate
DMTPcontribution rate of transferred dry matter to grains
LERland equivalent ratio
LAIleaf area index
SPADrelative leaf chlorophyll content
Pnphotosynthetic rate
Gsstomatal conductance
Trtranspiration rate
Ciintercellular CO2 concentration
LSVlong-season variety
SSVshort-season variety
CRcompetitive ratio

References

  1. Agnolucci, P.; Rapti, C.; Alexander, P.; De Lipsis, V.; Holland, R.A.; Eigenbrod, F.; Ekins, P. Impacts of rising temperatures and farm management practices on global yields of 18 crops. Nat. Food 2020, 1, 562–571. [Google Scholar] [CrossRef] [PubMed]
  2. Tilman, D.; Balzer, C.; Hill, J.; Befort, B.L. Global food demand and the sustainable intensification of agriculture. Proc. Natl. Acad. Sci. USA 2011, 108, 20260–20264. [Google Scholar] [CrossRef] [PubMed]
  3. Food and Agriculture Organization of the United Nations. Permanent Missions to the United Nations; United Nations: Geneva, Switzerland, 2023. [Google Scholar] [CrossRef]
  4. World Trade Organization. Questionnaire—General Administration of China Customs (“China Customs”); World Trade Organization: Geneva, Switzerland, 2023. [Google Scholar] [CrossRef]
  5. Gonzalo, R.; Monzón, J.P.; Tenorio, F.A.; Howard, R.; Cassman, K.G.; Grassini, P. Climate and agronomy, not genetics, underpin recent maize yield gains in favorable environments. Proc. Natl. Acad. Sci. USA 2022, 119, e2113629119. [Google Scholar] [CrossRef]
  6. Duvick, D.N. The contribution of breeding to yield advances in maize (Zea mays L.). Adv. Agron. 2005, 86, 83–145. [Google Scholar] [CrossRef]
  7. Wang, R.N.; Sun, Z.H.; Bai, W.; Wang, E.L.; Wang, Q.; Zhang, D.S.; Zhang, Y.; Yang, N.; Liu, Y.; Nie, J.Y.; et al. Canopy heterogeneity with border-row proportion affects light interception and use efficiency in maize/peanut strip intercropping. Field Crops Res. 2021, 271, 108239. [Google Scholar] [CrossRef]
  8. Yang, G.; Duan, A.W.; Sun, J.S.; Li, F.S.; Liu, Z.G.; Liu, H.; Liu, Z.D. Crop coefficient and water-use efficiency of winter wheat/spring maize strip intercropping. Field Crops Res. 2009, 111, 65–73. [Google Scholar] [CrossRef]
  9. Ma, L.S.; Li, Y.J.; Wu, P.T.; Zhao, X.N.; Gao, X.D.; Chen, X.L. Recovery growth and water use of intercropped maize following wheat harvest in wheat/maize relay strip intercropping. Field Crops Res. 2020, 256, 107924. [Google Scholar] [CrossRef]
  10. Li, Y.-H.; Shi, D.-Y.; Li, G.-H.; Zhao, B.; Zhang, J.-W.; Liu, P.; Ren, B.; Dong, S.-T. Maize/peanut intercropping increases photosynthetic characteristics, 13C-photosynthate distribution, and grain yield of summer maize. J. Integr. Agric. 2019, 18, 2219–2229. [Google Scholar] [CrossRef]
  11. Liu, X.; Rahman, T.; Song, C.; Yang, F.; Su, B.Y.; Cui, L.; Bu, W.Z.; Yang, W.Y. Relationships among light distribution, radiation use efficiency and land equivalent ratio in maize-soybean strip intercropping. Field Crops Res. 2018, 224, 91–101. [Google Scholar] [CrossRef]
  12. Nasar, J.; Shao, Z.Q.; Arshad, A.; Jones, F.G.; Liu, S.R.; Li, C.L.; Khan, M.Z.; Khan, T.; Banda, J.S.K.; Zhou, X.; et al. The effect of maize–alfalfa intercropping on the physiological characteristics, nitrogen uptake and yield of maize. Plant Biol. 2020, 22, 1140–1149. [Google Scholar] [CrossRef]
  13. Liu, X.; Rahman, T.; Yang, F.; Song, C.; Yong, T.W.; Liu, J.; Zhang, C.Y.; Yang, W.Y. PAR Interception and utilization in different maize and soybean lntercropping patterns. PLoS ONE 2017, 12, e0169218. [Google Scholar] [CrossRef]
  14. Jiao, N.Y.; Ning, T.Y.; Yang, M.K.; Fu, G.Z.; Yin, F.; Xu, G.W.; LI, Z.J. Effects of maize‖peanut intercropping on photosynthetic characters and yield forming of intercropped maize. Acta Ecol. Sin. 2013, 33, 4324–4330. [Google Scholar] [CrossRef]
  15. Li, M.J.; Zhang, J.E.; Liu, S.W.; Ashraf, U.; Zhao, B.L.; Qiu, S.Q. Mixed-cropping systems of different rice cultivars have grain yield and quality advantages over mono-cropping systems. J. Sci. Food Agric. 2019, 99, 3326–3334. [Google Scholar] [CrossRef] [PubMed]
  16. Cai, T.; Peng, D.L.; Wang, R.; Jia, X.L.; Qiao, D.; Liu, T.N.; Jia, Z.K.; Wang, Z.L.; Ren, X.L. Can intercropping or mixed cropping of two genotypes enhance wheat lodging resistance? Field Crops Res. 2019, 239, 10–18. [Google Scholar] [CrossRef]
  17. Wang, X.L.; Zhang, S.Q.; Wang, S.Q.; Wang, Z.L. The dynamic variation of maize (Sea mays L.) population growth characteristics under cultivars-intercropped on the Loess Plateau. Acta Ecol. Sin. 2012, 32, 7383–7390. [Google Scholar] [CrossRef]
  18. Daellenbach, G.C.; Kerridge, P.C.; Wolfe, M.S.; Frossard, E.; Finckh, M.R. Plant productivity in cassava-based mixed cropping systems in Colombian hillside farms. Agric. Ecosyst. Environ. 2004, 105, 595–614. [Google Scholar] [CrossRef]
  19. Creissen, H.E.; Jorgensen, T.H.; Brown, J.K.M. Increased yield stability of field-grown winter barley (Hordeum vulgare L.) varietal mixtures through ecological processes. Crop Prot. 2016, 85, 1–8. [Google Scholar] [CrossRef]
  20. Huang, C.; Sun, Z.Y.; Wang, H.G.; Luo, Y.; Ma, Z.H. Effects of wheat cultivar mixtures on stripe rust: A Meta-Analysis on Field trials. Crop Prot. 2012, 33, 52–58. [Google Scholar] [CrossRef]
  21. Zhu, Y.Y.; Chen, H.; Fan, J.H.; Wang, Y.Y.; Li, Y.; Chen, J.B.; Fan, J.X.; Yang, S.S.; Hu, L.P.; Leung, H.; et al. Genetic diversity and disease control in rice. Nature 2000, 406, 718–722. [Google Scholar] [CrossRef]
  22. Wang, Y.Q.; Zhao, Z.G.; Li, J.P.; Zhang, M.; Zhou, S.L.; Wang, Z.M.; Zhang, Y.H. Does maize hybrid intercropping increase yield due to border effects? Field Crops Res. 2017, 214, 283–290. [Google Scholar] [CrossRef]
  23. Hu, D.D.; Li, R.F.; Zhang, J.W.; Zhao, B.; Liu, P.; Dong, S.T. Mixed cropping of different hybrids of maize optimizes canopy structure and promotes higher grain yield. Agron. J. 2019, 111, 2692–2702. [Google Scholar] [CrossRef]
  24. Liu, X.; Cao, K.H.; Li, M. Assessing the impact of meteorological and agricultural drought on maize yields to optimize irrigation in Heilongjiang Province, China. J. Clean. Prod. 2023, 434, 139897. [Google Scholar] [CrossRef]
  25. Chu, Z.D.; Ming, B.; Li, L.L.; Xue, J.; Zhang, W.X.; Hou, L.Y.; Xie, R.Z.; Hou, P.; Wang, K.R.; Li, S.K. Dynamics of maize grain drying in the high latitude region of Northeast China. J. Integr. Agric. 2022, 2, 365–374. [Google Scholar] [CrossRef]
  26. Ming, B.; Xie, R.Z.; Hou, P.; Li, L.L.; Wang, K.R.; Li, S.K. Changes of maize planting density in China. Sci. Agric. Sin. 2017, 50, 1960–1972. [Google Scholar] [CrossRef]
  27. Piao, L.; Zhang, S.Y.; Yan, J.Y.; Xiang, T.X.; Chen, Y.; Li, M.; Gu, W.R. Contribution of fertilizer, density and row spacing practices for maize yield and efficiency enhancement in Northeast China. Plants 2022, 11, 2985. [Google Scholar] [CrossRef] [PubMed]
  28. Piao, L.; Qi, H.Y.; Li, C.F.; Zhao, M. Optimized tillage practices and row spacing to improve grain yield and matter transport efficiency in intensive spring maize. Field Crops Res. 2016, 198, 258–268. [Google Scholar] [CrossRef]
  29. Qian, X.; Zang, H.D.; Xu, H.S.; Hu, Y.G.; Ren, C.Z.; Guo, L.C.; Wang, C.L.; Zeng, Z.H. Relay strip intercropping of oat with maize, sunflower and mung bean in semi-arid regions of Northeast· China: Yield advantages and economic benefits. Field Crops Res. 2018, 223, 33–40. [Google Scholar] [CrossRef]
  30. Vedeneeva, V.A.; Potashkina, Y.N. Influence of hydrothermal parameters on potato irrigation regime. Indian J. Agric. Res. 2023, 57, 618–623. [Google Scholar] [CrossRef]
  31. Abdelhamidg, M.T.; Horiuchi, T.; Oba, S. Evaluation of the SPAD value in faba bean (Vicia faba L.) leaves in relation to different fertilizer applications. Plant Prod. Sci. 2003, 6, 185–189. [Google Scholar] [CrossRef]
  32. Wang, F.; Guo, B.B.; Sun, Z.G.; YIin, F.; Liu, L.; Jiao, N.Y.; Fu, G.Z. Effects of elevated temperature and CO2 concentration on growth and yield of maize under intercropping with peanut. Acta Agron. Sin. 2021, 47, 2220–2231. [Google Scholar] [CrossRef]
  33. Wang, X.M.; Luo, W.H.; Liu, P.Z.; Zhang, Q.; Wang, R.; LI, J. Regulation effects of water saving and nitrogen reduction on dry matter and nitrogen accumulation, transportation and yield of summer maize. Sci. Agric. Sin. 2021, 54, 3183–3197. [Google Scholar] [CrossRef]
  34. Cox, M.C.; Qualset, C.O.; Rains, D.W. Genetic variation for nitrogen assimilation and translocation in wheat. III. nitrogen translocation in relation to grain yield and protein1. Crop Sci. 1986, 26, 737–740. [Google Scholar] [CrossRef]
  35. LI, C.H.; Su, X.H.; Sun, D.L. Ecophysiological effects of intercropping composite populations of corn with different genotypes. Acta Ecol. Sin. 2002, 12, 2096–2103. [Google Scholar]
  36. Agegnehu, G.; Ghizaw, A.; Sinebo, W. Yield performance and land-use efficiency of barley and faba bean mixed cropping in Ethiopian highlands. Eur. J. Agron. 2006, 25, 202–207. [Google Scholar] [CrossRef]
  37. Dhima, K.; Lithourgidis, A.; Vasilakoglou, I.; Dordas, C. Competition indices of common vetch and cereal intercrops in two seeding ratio. Field Crops Res. 2007, 100, 249–256. [Google Scholar] [CrossRef]
  38. Assefa, Y.; Vara Prasad, P.V.; Carter, P.; Hinds, M.; Bhalla, G.; Schon, R.; Jeschke, M.; Paszkiewicz, S.; Ciampitti, I.A. Yield responses to planting density for US modern corn hybrids: A synthesis-analysis. Crop Sci. 2016, 56, 2802–2817. [Google Scholar] [CrossRef]
  39. Li, R.; Zhang, G.Q.; Liu, G.Z.; Wang, K.R.; Xie, R.Z.; Hou, P.; Ming, B.; Wang, Z.G.; Li, S.K. Improving the yield potential in maize by constructing the ideal plant type and optimizing the maize canopy structure. Food Energy Secur. 2021, 10, e312. [Google Scholar] [CrossRef]
  40. Antonietta, M.; Fanello, D.D.; Acciaresi, H.A.; Guiamet, J.J. Senescence and yield responses to plant density in stay green and earlier-senescing maize hybrids from Argentina. Field Crops Res. 2014, 155, 111–119. [Google Scholar] [CrossRef]
  41. Abeledo, L.G.; Savin, R.; Slafer, G.A. Maize senescence under contrasting source-sink ratios during the grain filling period. Environ. Exp. Bot. 2020, 180, 104263. [Google Scholar] [CrossRef]
  42. Zhang, C.Y.; Ding, X.P.; Zhang, J.W.; Liu, P.; Ren, B.C.; Zhao, B. Effects of staggered planting with Increased density on the photosynthetic characteristics and yield of summer maize. Sci. Agric. Sin. 2020, 53, 3928–3941. [Google Scholar] [CrossRef]
  43. Zhang, L.; van der Werf, W.; Bastiaans, L.; Zhang, S.; Li, B.; Spiertz, J.H.J. Light interception and utilization in relay intercrops of wheat and cotton. Field Crops Res. 2008, 107, 29–42. [Google Scholar] [CrossRef]
  44. Raza, M.A.; Feng, L.Y.; Van der Werf, W.; Cai, G.R.; Bin Khalid, M.H.; Iqbal, N.; Hassan, M.J.; Meraj, T.A.; Naeem, M.; Khan, I.; et al. Narrow-wide-row planting pattern increases the radiation use efficiency and seed yield of intercrop species in relay-intercropping system. Food Energy Secur. 2019, 8, e170. [Google Scholar] [CrossRef]
  45. Liu, H.T.; Chen, S.H.; Li, B.G.; Guo, S.; Tian, J.; Yao, L.; Lin, C.W. The effect of strip orientation and width on radiation interception in maize–soybean strip intercropping systems. Food Energy Secur. 2022, 11, e364. [Google Scholar] [CrossRef]
  46. Wang, R.N.; Sun, Z.X.; Zhang, L.Z.; Yang, N.; Feng, L.S.; Bai, W.; Zhang, D.S.; Wang, Q.; Evers, J.B.; Liu, Y.; et al. Border-row proportion determines strength of interspecific interactions and crop yields in maize/peanut strip intercropping. Field Crops Res. 2020, 253, 107819. [Google Scholar] [CrossRef]
  47. Zheng, H.Y.; Wang, J.Y.; Cui, Y.; Guan, Z.Y.; Yang, L.; Tang, Q.Q.; Sun, Y.; Yang, H.S.; Wen, X.Q.; Mei, N.; et al. Effects of row spacing and planting pattern on photosynthesis, chlorophyll fluorescence, and related enzyme activities of maize ear leaf in maize–soybean intercropping. Agronomy 2022, 12, 2503. [Google Scholar] [CrossRef]
  48. Yang, S.; Bai, W.; Cai, Q.; Du, G.J. Characteristics of light distribution in maizeǁalfalfa intercropping systems and their effects on plant traits and yield. Acta Agron. Sin. 2025, 51, 2514–2526. [Google Scholar] [CrossRef]
  49. Liu, X.; Rahman, T.; Song, C.; Su, B.Y.; Yang, F.; Yong, T.W.; Wu, Y.; Zhang, C.Y.; Yang, W.Y. Changes in light environment, morphology, growth and yield of soybean in maize-soybean intercropping systems. Field Crops Res. 2017, 200, 38–46. [Google Scholar] [CrossRef]
  50. Lu, J.T.; Dong, Q.Q.; Lan, G.H.; He, Z.C.; Zhou, D.Y.; Zhang, H.; Wang, X.G.; Liu, X.B.; Jiang, C.J.; Zhang, Z.; et al. Row ratio increasing improved light distribution, photosynthetic characteristics, and yield of peanut in the maize and peanut strip intercropping system. Front. Plant Sci. 2023, 14, 35580. [Google Scholar] [CrossRef]
  51. Gou, F.; van Ittersum, M.K.; Simon, E.; Leffelaar, P.A.; Van der Putten, P.E.L.; Zhang, L.Z.; van der Werf, W. Intercropping wheat and maize increases total radiation interception and wheat RUE but lowers maize RUE. Eur. J. Agron. 2016, 84, 125–139. [Google Scholar] [CrossRef]
  52. Zhou, B.Y.; Yue, Y.; Sun, X.F.; Wang, X.B.; Wang, Z.M.; Ma, W.; Zhao, M. Maize grain yield and dry matter production responses to variations in weather conditions. Agron. J. 2016, 108, 196–204. [Google Scholar] [CrossRef]
  53. Echarte, L.; Luque, S.; Andrade, F.H.; Sadras, V.O.; Cirilo, A.G.; Otegui, M.A.E.; Vega, C.R.C. Response of maize kernel number to plant density in Argentinean hybrids released between 1965 and 1993. Field Crops Res. 2000, 68, 108779. [Google Scholar] [CrossRef]
  54. Zhang, W.P.; Li, Z.X.; Gao, S.N.; Yang, H.; Xu, H.S.; Yang, X.; Fan, H.X.; Su, Y.; Surigaoge; Weiner, J.; et al. Resistance vs. surrender: Different responses of functional traits of soybean and peanut to intercropping with maize. Field Crops Res. 2023, 291, 108779. [Google Scholar] [CrossRef]
  55. Prasad, R.B.; Brook, R.M. Effect of varying maize densities on intercropped maize and soybean in Nepal. Exp. Agric. 2005, 41, 365–382. [Google Scholar] [CrossRef]
  56. Liu, T.X.; Li, C.H.; Fu, J.; Yan, C.H. Population quality of different Maize (Zea mays L.) genotypes intercropped. Acta Ecol. Sin. 2009, 29, 6302–6309. [Google Scholar] [CrossRef]
  57. Gao, H.X.; Zhang, C.C.; Van der Werf, W.; Ning, P.; Zhang, Z.; Wan, S.B.; Zhang, F.S. Intercropping modulates the accumulation and translocation of dry matter and nitrogen in maize and peanut. Field Crops Res. 2022, 284, 108561. [Google Scholar] [CrossRef]
  58. Onoda, Y.; Saluñga, J.B.; Akutsu, K.; Aiba, S.I.; Yahara, T.; Anten, N.P.R. Trade-off between light interception efficiency and light use efficiency: Implications for species coexistence in one-sided light competition. J. Ecol. 2013, 102, 167–175. [Google Scholar] [CrossRef]
  59. Ma, L.S.; Li, Y.J.; Wu, P.T.; Zhao, X.N.; Chen, X.L.; Gao, X.D. Effects of varied water regimes on root development and its relations with soil water under wheat/maize intercropping system. Plant Soil 2018, 439, 113–130. [Google Scholar] [CrossRef]
  60. Dong, Q.Q.; Zhao, X.H.; Sun, Y.X.; Zhou, D.Y.; Lan, G.H.; Pu, J.Y.; Chen, F.; Zhang, H.; Shi, X.L.; Liu, X.B.; et al. Border row effects improved the spatial distributions of maize and peanut roots in an intercropping system, associated with improved yield. Front. Plant Sci. 2024, 15, 1414844. [Google Scholar] [CrossRef]
  61. Wei, W.; Liu, T.; Zhang, S.; Shen, L.; Wang, X.; Li, L.; Zhu, Y.; Zhang, W. Root spatial distribution and belowground competition in an apple/ryegrass agroforestry system. Agric. Syst. 2024, 215, 103869. [Google Scholar] [CrossRef]
  62. Yu, R.P.; Yang, H.; Xing, Y.; Zhang, W.P.; Lambers, H.; Li, L. Belowground processes and sustainability in agroecosystems with intercropping. Plant Soil 2022, 476, 263–288. [Google Scholar] [CrossRef]
  63. Feng, L.Y.; Raza, M.A.; Shi, J.Y.; Ansar, M.; Titriku, J.K.; Meraj, T.A.; Shah, G.A.; Ahmed, Z.; Saleem, A.; Liu, W.G.; et al. Delayed maize leaf senescence increases the land equivalent ratio of maize soybean relay intercropping system. Eur. J. Agron. 2020, 118, 126092. [Google Scholar] [CrossRef]
  64. Li, Y.Z.; Tian, D.; Feng, G.; Yang, W.; Feng, L.P. Climate change and cover crop effects on water use efficiency of a corn-soybean rotation system. Agric. Water Manag. 2021, 255, 107042. [Google Scholar] [CrossRef]
  65. Tesfaye, S.S.; Ayalew, T.; Gobena, R.A.; Mohammed, B.H. Intercropping and Rhizobium Inoculation Affected Microclimate and Performance of Common Bean (Phaseolus vulgaris L.) Varieties. Scientifica 2022, 2022, 3471912. [Google Scholar] [CrossRef]
  66. Gitari, H.I.; Karanja, N.N.; Gachene, C.K.; Kamau, S.; Sharma, K.; Schulte-Geldermann, E. Nitrogen and phosphorous uptake by potato (Solanum tuberosum L.) and their use efficiency under potato-legume intercropping systems. Field Crops Res. 2018, 222, 78–84. [Google Scholar] [CrossRef]
  67. Lithourgidis, A.S.; Vlachostergios, D.N.; Dordas, C.A.; Damalas, C.A. Dry matter yield, nitrogen content, and competition in pea-cereal intercropping systems. Eur. J. Agron. 2011, 34, 287–294. [Google Scholar] [CrossRef]
  68. Tan, Y.; Hu, F.L.; Chai, Q.; Li, G.; Coulter, J.A.; Zhao, C.; Yu, A.Z.; Fan, Z.L.; Yin, W. Expanding row ratio with lowered nitrogen fertilization improves system productivity of maize/pea strip intercropping. Eur. J. Agron. 2020, 113, 125986. [Google Scholar] [CrossRef]
  69. Xu, Z.; Li, C.; Zhang, C.; Yu, Y.; van der Werf, W.; Zhang, F. Intercropping maize and soybean increases efficiency of land and fertilizer nitrogen use; A meta-analysis. Field Crops Res. 2020, 246, 107661. [Google Scholar] [CrossRef]
  70. Ma, H.; Yu, X.; Yu, Q.; Wu, H.; Zhang, H.; Pang, J.; Gao, Y. Maize/alfalfa intercropping enhances yield and phosphorus acquisition. Field Crops Res. 2023, 303, 109136. [Google Scholar] [CrossRef]
  71. Hu, F.; Gan, Y.; Chai, Q.; Feng, F.; Zhao, C.; Yu, A.; Mu, Y.; Zhang, Y. Boosting system productivity through the improved coordination of interspecific competition in maize/pea strip intercropping. Field Crops Res. 2016, 198, 50–60. [Google Scholar] [CrossRef]
  72. Coll, L.; Cerrudo, A.; Rizzalli, R.; Monzon, J.P.; Andrade, F.H. Capture and use of water and radiation in summer intercrops in the south-east Pampas of Argentina. Field Crops Res. 2012, 134, 105–113. [Google Scholar] [CrossRef]
  73. Yang, H.; Zhou, Y.; Chen, P.; Du, Q.; Zhang, B.C.; Pu, T.; Wen, J.; Yang, W.Y.; Yong, T.W. Effects of nutrient uptake and utilization on yield of maize-legume strip intercropping system. Acta Agron. Sin. 2022, 48, 1476–1487. [Google Scholar] [CrossRef]
  74. Li, C.J.; Hoffland, E.; Kuyper, T.W.; Yu, Y.; Zhang, C.C.; Li, H.G.; Zhang, F.S.; van der Werf, W. Syndromes of production in intercropping impact yield gains. Nat. Plants 2020, 6, 653–660. [Google Scholar] [CrossRef]
  75. Wei, S.S.; Wang, X.Y.; Shi, D.Y.; Li, Y.H.; Zhang, J.W.; Liu, P.; Zhao, B.; Dong, S.T. The mechanisms of low nitrogen induced weakened photosynthesis in summer maize (Zea mays L.) under field conditions. Plant Physiol. Biochem. 2016, 105, 118–128. [Google Scholar] [CrossRef] [PubMed]
  76. Li, Y.J.; Ma, L.S.; Wu, P.; Zhao, X.N.; Li, C.X.; Gao, X.D. Yield, yield attributes and photosynthetic physiological characteristics of dryland wheat (Triticum aestivum L.)/maize (Zea mays L.) strip intercropping. Field Crops Res. 2019, 248, 107656. [Google Scholar] [CrossRef]
  77. Wu, Y.S.; He, D.; Wang, E.L.; Liu, X.; Huth, N.I.; Zhao, Z.G.; Gong, W.Z.; Yang, F.; Wang, X.C.; Yong, T.W.; et al. Modelling soybean and maize growth and grain yield in strip intercropping systems with different row configurations. Field Crops Res. 2021, 265, 108122. [Google Scholar] [CrossRef]
  78. Zhang, D.S.; Sun, Z.X.; Feng, L.S.; Bai, W.; Yang, N.; Zhang, Z.; Du, G.J.; Chen, F.; Cai, Q.; Wang, Q.; et al. Maize plant density affects yield, growth and source-sink relationship of crops in maize/peanut intercropping. Field Crops Res. 2020, 257, 107926. [Google Scholar] [CrossRef]
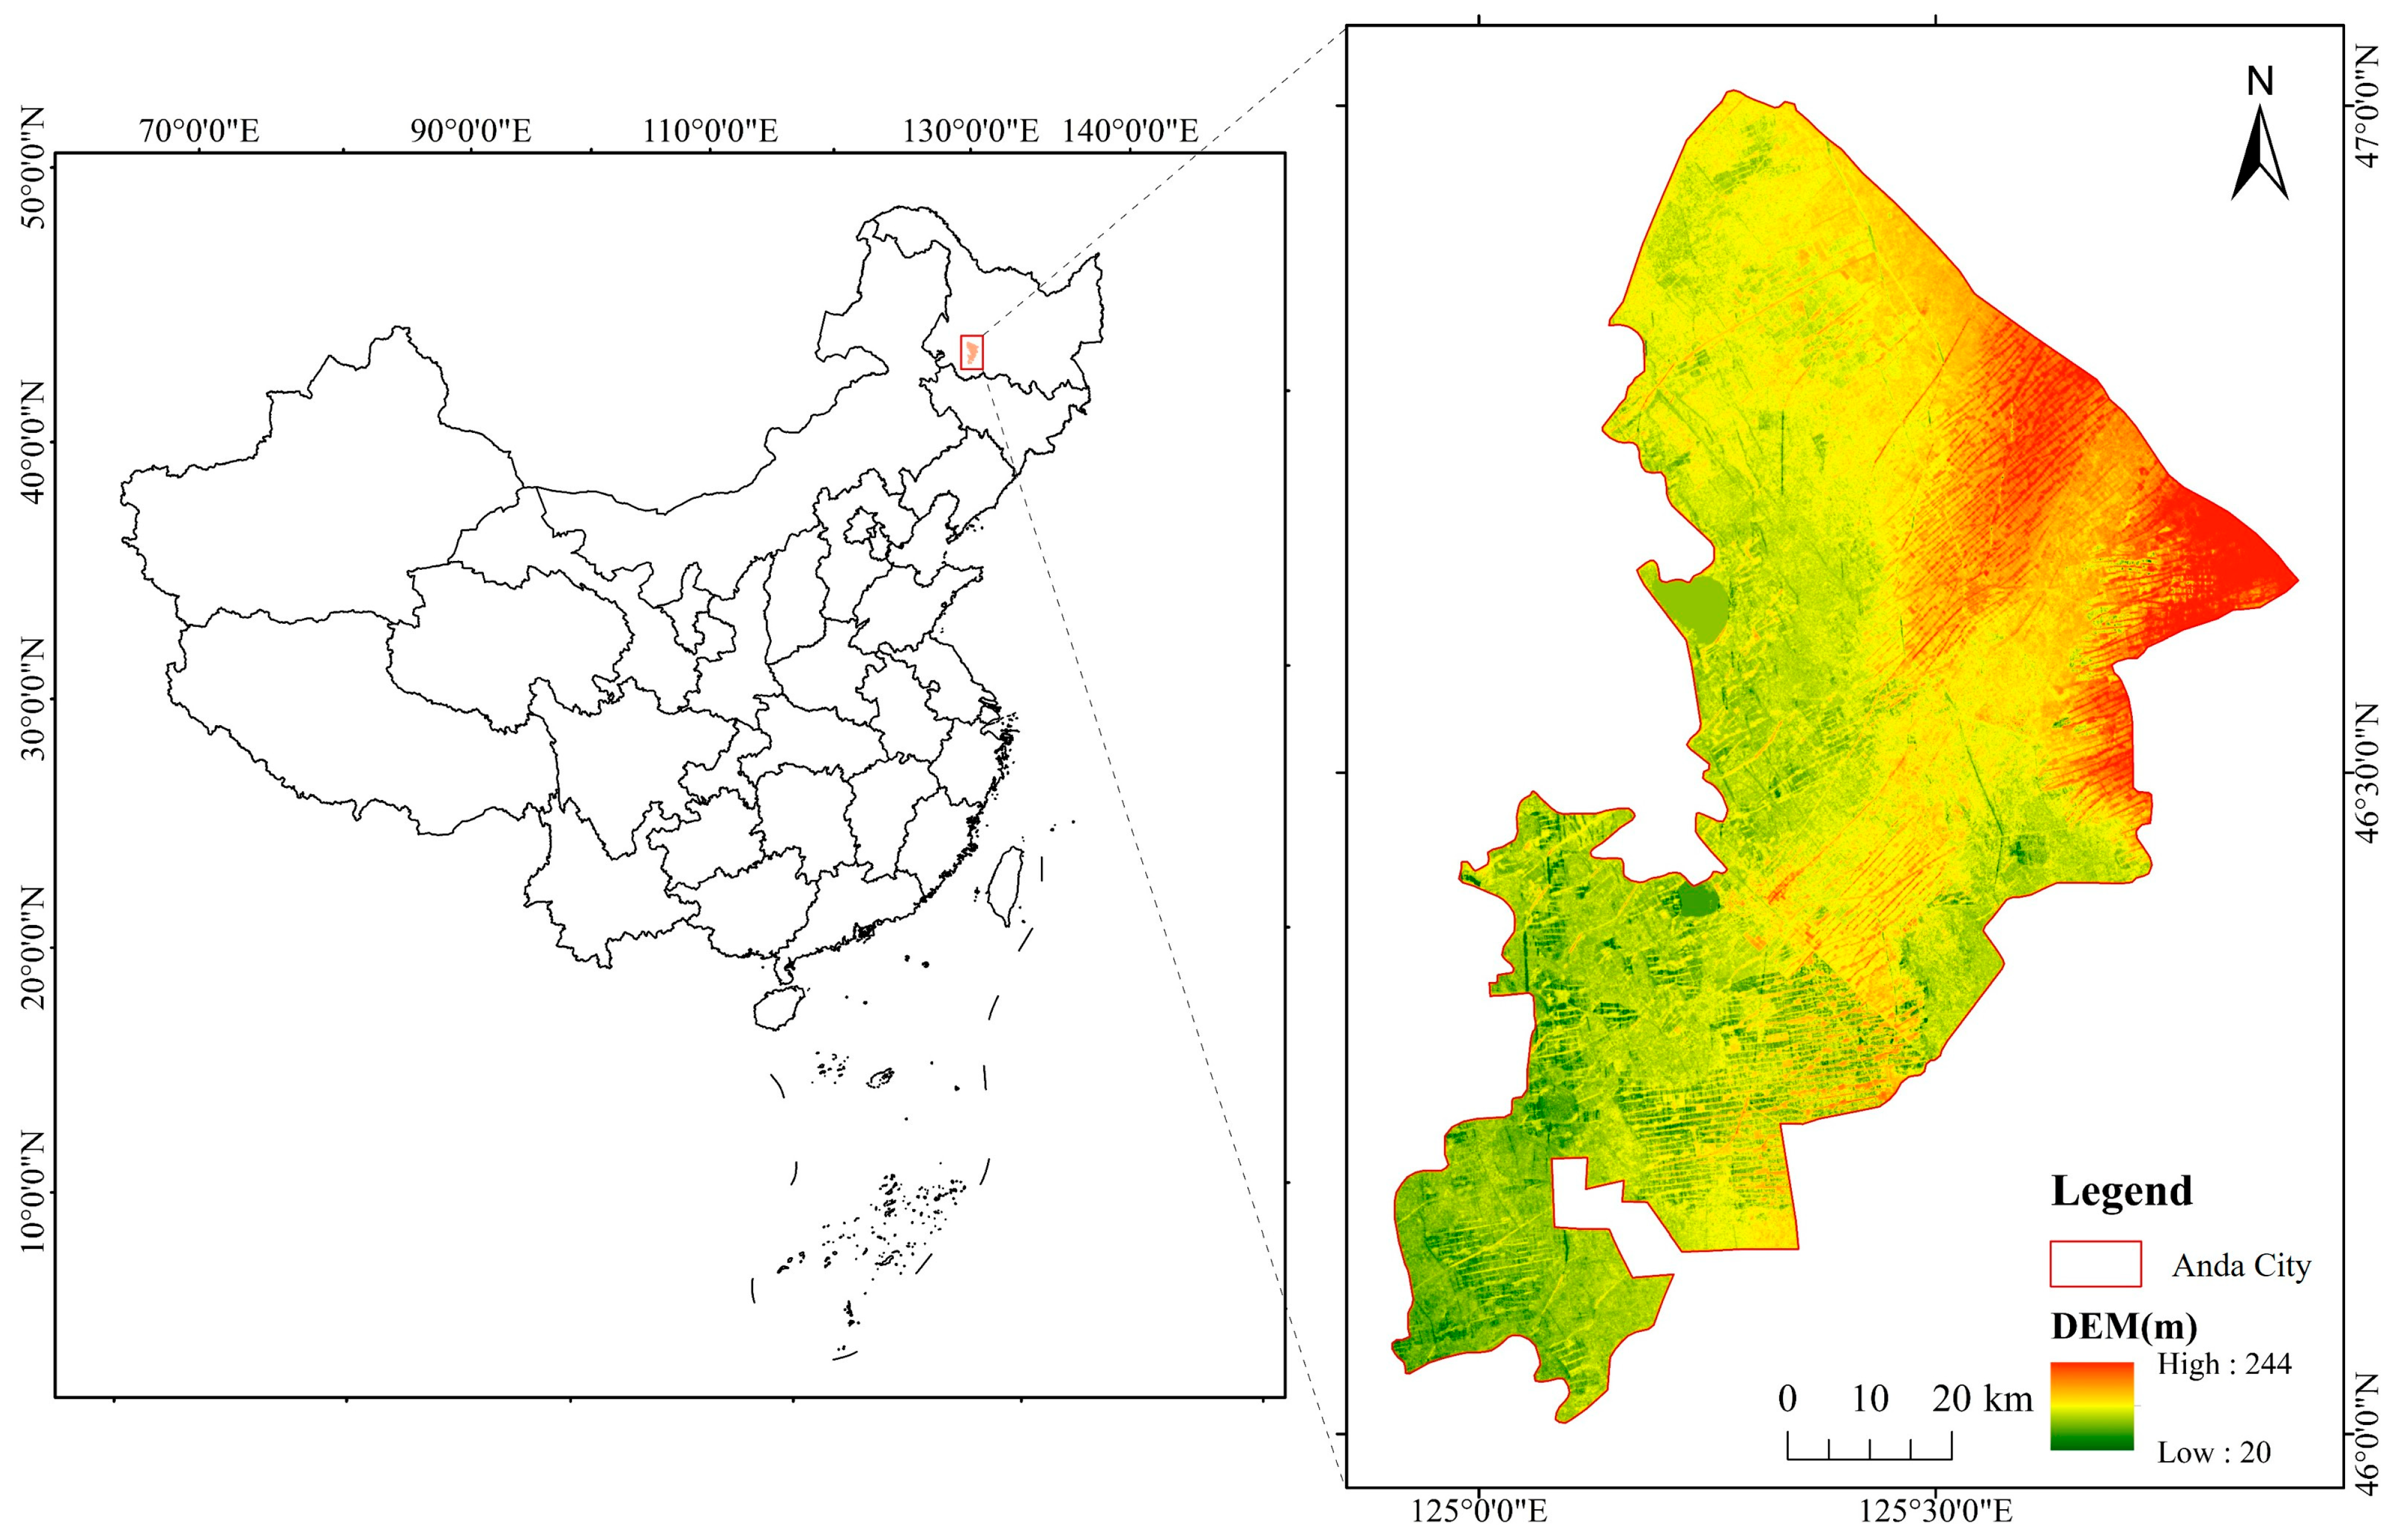
Figure 1. Schematic diagram of the research site location.
Agronomy 15 02505 g001
Figure 2. Changes in field average daily temperature, daily precipitation, and hydrothermal coefficient during the maize growth period. K denotes the hydrothermal coefficient.
Agronomy 15 02505 g002
Figure 3. Schematic diagram of the intercropping of maize varieties with different growth periods. Long- and short-season varieties are intercropped at a row ratio of (A) 0:1; (B) 1:0; (C) 6:6; (D) 4:4; (E) 2:2; and (F) 1:1. Red lines represent the short-season variety, and blue lines represent long-season varieties.
Agronomy 15 02505 g003
Figure 4. Diagram of the field experimental plot layout for intercropping of maize varieties with different growth periods. I, II and III, respectively, represent the serial number of each treatment combination replicates. The black thin solid lines represent the boundaries of each plot; the gray thin dashed lines indicate the direction of maize planting rows in the field; and the gray thick solid lines represent the aisles in the experimental field.
Agronomy 15 02505 g004
Figure 5. Changes in leaf area index trends among long- and short-season varieties under different intercropping row ratios. (A,E) LAI of ZD958 under different intercropping row ratios in the Z‖Y mode for 2023 and 2024, respectively; (B,F) LAI of XY335 under different intercropping row ratios in the X‖Y mode for 2023 and 2024, respectively; (C,G) LAI of YNY10 under different intercropping row ratios in the Z‖Y pattern for 2023 and 2024, respectively; (D,H) LAI of YNY10 under different intercropping row ratios in the X‖Y pattern for 2023 and 2024, respectively. Z‖Y: intercropping between ZD958 and YNY10; X‖Y: intercropping between XY335 and YNY10; JS-15: 15 days after jointing; JS-30: 30 days after jointing; JS-45: 45 days after jointing; JS-60: 60 days after jointing; JS-75: 75 days after jointing; JS-90: 90 days after jointing; LAI: leaf area index. Data are presented as mean ± standard error (n = 9). Different letters within the same growth stage indicate significant differences (p < 0.05).
Agronomy 15 02505 g005
Figure 6. Dynamic changes in SPAD values of long- and short-season varieties under different intercropping row ratio conditions. (A,E) SPAD values of ZD958 under different intercropping row ratios in the Z‖Y pattern for 2023 and 2024, respectively; (B,F) SPAD values of YNY10 under different intercropping row ratios in the Z‖Y pattern for 2023 and 2024, respectively; (C,G) SPAD values of XY335 under different intercropping row ratios in the X‖Y pattern for 2023 and 2024, respectively; (D,H) SPAD values of YNY10 under different intercropping row ratios in the X‖Y pattern for 2023 and 2024, respectively. Z‖Y: intercropping between ZD958 and YNY10; X‖Y: intercropping between XY335 and YNY10; JS: jointing stage; JS-15: 15 days after jointing; JS-30: 30 days after jointing; JS-45: 45 days after jointing; JS-60: 60 days after jointing; JS-75: 75 days after jointing; JS-90: 90 days after jointing; SPAD: relative chlorophyll content. Data are presented as mean ± standard error (n = 9). Different letters within the same growth stage indicate significant differences (p < 0.05).
Agronomy 15 02505 g006
Figure 7. Dynamic changes in dry matter accumulation among long- and short-season varieties under different intercropping row ratio conditions. (A,E) Dry matter accumulation of ZD958 under different intercropping row ratios in the Z‖Y pattern for 2023 and 2024, respectively; (B,F) dry matter accumulation of YNY10 under different intercropping row ratios in the Z‖Y pattern for 2023 and 2024, respectively; (C,G) dry matter accumulation of XY335 under different intercropping row ratios in the X‖Y mode for 2023 and 2024, respectively; (D,H) dry matter accumulation of YNY10 under different intercropping row ratios in the X‖Y mode for 2023 and 2024, respectively. Z‖Y: intercropping of ZD958 and YNY10; X‖Y: intercropping of XY335 and YNY10; JS-30: 30 days after jointing; JS-45: 45 days after jointing; JS-60: 60 days after jointing; JS-75: 75 days after jointing; JS-90: 90 days after jointing. Data are presented as mean ± standard error (n = 9). Different letters within the same growth stage indicate significant differences (p < 0.05).
Agronomy 15 02505 g007
Figure 8. Differences in dry matter allocation among long- and short-season varieties during the JS-90 period under different intercropping row ratio conditions. (A,E) Distribution of dry matter in different organs of ZD958 under different intercropping row ratios in the Z‖Y pattern for 2023 and 2024, respectively; (B,F) distribution of dry matter in different organs of YNY10 under different intercropping row ratios in the Z‖Y pattern for 2023 and 2024, respectively; (C,G) distribution of dry matter in different organs of XY335 under different intercropping row ratios in the X‖Y pattern for 2023 and 2024, respectively; (D,H) distribution of dry matter in different organs of YNY10 under different intercropping row ratios in the X‖Y pattern for 2023 and 2024, respectively. Z‖Y: intercropping of ZD958 and YNY10; X‖Y: intercropping of XY335 and YNY10. Data are expressed as mean ± standard error (n = 9). Different letters within the same organ indicate significant differences (p < 0.05).
Agronomy 15 02505 g008
Figure 9. Average grain yield of maize composite populations under different intercropping row ratio treatments. (A,C) Average grain yield of the maize composite population under different intercropping row ratios in the Z‖Y pattern for 2023 and 2024, respectively; (B,D) Average grain yield of the maize composite population under different intercropping row ratios in the X‖Y pattern for 2023 and 2024, respectively. Z‖Y: intercropping of ZD958 and YNY10; X‖Y: intercropping of XY335 and YNY10. The black horizontal line in the middle of the box represents the median of the sample, and the red dots in the box represent the mean of the sample. Data are presented as mean ± standard error (n = 6). Different letters indicate significant differences (p < 0.05).
Agronomy 15 02505 g009
Figure 10. Land equivalent ratio under different intercropping row ratio treatments. (A) Land equivalent ratios under different intercropping row ratios for the Z‖Y and X‖Y patterns in 2023; (B) Land equivalent ratios under different intercropping row ratios for the Z‖Y and X‖Y patterns in 2024. Z‖Y: intercropping of ZD958 and YNY10; X‖Y: intercropping of XY335 and YNY10. The red dotted line indicates that LER equals 1. Data are presented as mean ± standard error (n = 6). Different letters within the same variety and year indicate significant differences (p < 0.05).
Agronomy 15 02505 g010
Figure 11. Aggressivity of long- and short-season maize varieties under different intercropping row ratio treatments. (A) Aggressivity of ZD958 and YNY10 under different intercropping row ratios in the Z‖Y pattern in 2023 and aggressivity of XY335 and YNY10 under different intercropping row ratios in the X‖Y pattern; (B) Aggressivity of ZD958 and YNY10 under different intercropping row ratios in the Z‖Y pattern in 2024 and aggressivity of XY335 and YNY10 under different intercropping row ratios in the X‖Y pattern. Z‖Y: intercropping of ZD958 and YNY10; X‖Y: intercropping of XY335 and YNY10. Data are presented as mean ± standard error (n = 6). Different letters within the same variety and year indicate significant differences (p < 0.05).
Agronomy 15 02505 g011
Figure 12. Competition ratio of long- and short-season maize varieties under different intercropping row ratio treatments. (A) Competition ratio between ZD958 and YNY10 under different intercropping row ratios in the Z‖Y pattern in 2023 and competition ratio between XY335 and YNY10 under different intercropping row ratios in the X‖Y pattern; (B) Competitive ratios of ZD958 and YNY10 under different intercropping row ratios in the Z‖Y mode in 2024, and competitive ratios of XY335 and YNY10 under different intercropping row ratios in the X‖Y pattern. Z‖Y: intercropping of ZD958 and YNY10; X‖Y: intercropping of XY335 and YNY10. Data are presented as mean ± standard error (n = 6). Different letters within the same variety and year indicate significant differences (p < 0.05).
Agronomy 15 02505 g012
Table 1. Characteristics of the tested maize varieties.
VarietiesGrowing Period (d)Effective
Accumulated
Temperature Demand (°C)
Number of Leaves per PlantGrain TypesPlant Height (cm)
Zhengdan 958 ZD958128275022semi-dental type264
Xianyu 335 XY335127265020semi-hard grain type283
Yinongyu 10 YNY10120250018semi-dental type271
Table 2. Experimental treatment combinations.
Serial NumberTreatment CodeDescription of Each Treatment Method
1Z‖Y-(1:0)ZD958 planted alone
2Z‖Y-(0:1)YNY10 planted alone
3X‖Y-(1:0)XY335 planted alone
4X‖Y-(0:1)YNY10 planted alone
5Z‖Y-(6:6)Intercropping of 6 rows of ZD958 and 6 rows of YNY10
6Z‖Y-(4:4)Intercropping of 4 rows of ZD958 and 4 rows of YNY10
7Z‖Y-(2:2)Intercropping of 2 rows of ZD958 and 2 rows of YNY10
8Z‖Y-(1:1)Intercropping of 1 rows of ZD958 and 1 rows of YNY10
9X‖Y-(6:6)Intercropping of 6 rows of XY335 and 6 rows of YNY10
10X‖Y-(4:4)Intercropping of 4 rows of XY335 and 4 rows of YNY10
11X‖Y-(2:2)Intercropping of 2 rows of XY335 and 2 rows of YNY10
12X‖Y-(1:1)Intercropping of 1 rows of XY335 and 1 rows of YNY10
Table 3. Photosynthetic parameters during the JS-45 period for long- and short-season varieties under various intercropping row ratio conditions.
YearVarieties
Combination
Intercropping Row RatioPn
(μmol·m−2·s−1)
Gs
(mmol·m−2·s−1)
Ci
(μmol·mol−1)
Tr
(mmol·m−2·s−1)
LSVSSVLSVSSVLSVSSVLSVSSV
2023Z‖Y1:030.74 ± 1.00 c0.42 ± 0.03 c196.33 ± 11.06 a4.47 ± 0.53 c
6:631.31 ± 0.64 bc25.06 ± 0.71 a0.46 ± 0.03 c0.24 ± 0.03 ab185.00 ± 6.08 ab254.27 ± 4.41 b4.84 ± 0.43 bc2.51 ± 0.39 a
4:432.12 ± 0.67 abc24.84 ± 0.68 a0.52 ± 0.04 b0.20 ± 0.03 ab179.67 ± 12.01 ab258.77 ± 4.78 ab5.25 ± 0.13 bc2.45 ± 0.11 a
2:232.34 ± 0.76 ab24.45 ± 0.53 a0.54 ± 0.02 ab0.18 ± 0.03 bc169.67 ± 12.58 b266.73 ± 11.47 ab5.58 ± 0.57 ab2.42 ± 0.04 a
1:133.54 ± 0.70 a24.27 ± 0.73 a0.59 ± 0.03 a0.13 ± 0.04 c167.60 ± 3.83 b270.80 ± 6.88 a6.07 ± 0.25 a2.39 ± 0.22 a
0:125.57 ± 0.79 a0.25 ± 0.05 a253.47 ± 4.11 b2.78 ± 0.20 a
X‖Y1:027.65 ± 0.94 b0.28 ± 0.02 b238.17 ± 9.67 a3.10 ± 0.20 b
6:628.19 ± 0.98 ab25.17 ± 0.92 a0.30 ± 0.04 b0.22 ± 0.05 ab234.23 ± 14.52 ab259.20 ± 1.51 a3.57 ± 0.26 ab2.64 ± 0.27 a
4:428.55 ± 0.42 ab24.87 ± 0.68 a0.32 ± 0.03 ab0.19 ± 0.03 ab228.70 ± 12.77 ab264.27 ± 5.08 a3.68 ± 0.38 ab2.58 ± 0.03 a
2:229.27 ± 0.98 ab24.66 ± 1.14 a0.35 ± 0.03 ab0.17 ± 0.03 b225.53 ± 6.33 ab267.40 ± 3.29 a3.71 ± 0.48 ab2.52 ± 0.10 a
1:129.64 ± 1.11 a24.32 ± 0.40 a0.38 ± 0.05 a0.16 ± 0.03 b213.87 ± 7.51 b268.63 ± 17.67 a3.82 ± 0.34 a2.47 ± 0.19 a
0:125.57 ± 0.79 a0.25 ± 0.05 a253.47 ± 4.11 a2.78 ± 0.20 a
2024Z‖Y1:031.07 ± 1.36 b0.43 ± 0.03 c220.57 ± 12.17 a4.68 ± 0.33 c
6:631.75 ± 0.39 b26.38 ± 0.82 a0.50 ± 0.02 b0.27 ± 0.03 a208.74 ± 7.96 ab268.57 ± 13.11 ab5.32 ± 0.09 b2.87 ± 0.03 ab
4:432.89 ± 1.08 ab25.43 ± 0.73 a0.54 ± 0.04 b0.24 ± 0.04 a195.81 ± 4.98 bc274.38 ± 5.53 ab5.64 ± 0.41 ab2.62 ± 0.17 abc
2:233.44 ± 1.62 ab25.19 ± 0.84 a0.56 ± 0.05 ab0.22 ± 0.04 a190.88 ± 10.58 c282.82 ± 6.36 ab5.79 ± 0.23 ab2.56 ± 0.21 bc
1:134.48 ± 1.27 a24.68 ± 0.90 b0.62 ± 0.02 a0.16 ± 0.03 b187.70 ± 3.91 c288.24 ± 11.01 a6.13 ± 0.41 a2.45 ± 0.18 c
0:126.83 ± 1.54 a0.28 ± 0.03 a267.17 ± 12.75 b2.94 ± 0.27 a
X‖Y1:028.55 ± 0.87 c0.30 ± 0.03 c278.70 ± 10.73 a3.34 ± 0.17 b
6:628.75 ± 0.75 bc26.65 ± 1.07 a0.33 ± 0.04 bc0.25 ± 0.05 ab268.37 ± 1.94 ab271.19 ± 12.49 a3.71 ± 0.30 ab2.74 ± 0.20 a
4:429.83 ± 0.80 abc25.72 ± 1.29 a0.36 ± 0.06 abc0.23 ± 0.03 ab256.43 ± 6.72 ab275.29 ± 7.95 a3.90 ± 0.16 ab2.70 ± 0.13 a
2:230.54 ± 0.82 ab25.37 ± 0.76 a0.39 ± 0.02 ab0.21 ± 0.03 b253.64 ± 22.95 ab279.19 ± 10.13 a4.05 ± 0.27 ab2.64 ± 0.22 a
1:130.75 ± 1.56 a24.79 ± 0.62 a0.41 ± 0.02 a0.19 ± 0.01 b248.06 ± 14.37 b283.52 ± 9.10 a4.27 ± 0.29 a2.57 ± 0.14 a
0:126.83 ± 1.54 a0.28 ± 0.03 a267.17 ± 12.75 b2.94 ± 0.27 a
Significance (F-value)
Year (Y)11.60 **14.61 **10.01 **13.84 **95.12 **34.85 **9.85 **8.33 **
Varieties combination (V)156.35 **0.28390.52 **0.00385.38 **0.03365.26 **1.35
Intercropping row ratio (I)13.39 **6.48 **32.22 **16.68 **13.93 **7.44 **21.06 **6.97 **
(Y × V)0.370.040.260.054.58 *0.3321.060.33
(Y × I)0.270.580.180.100.420.050.040.23
(V × I) 0.470.032.280.950.290.332.080.23
(Y × V × I) 0.040.010.150.030.080.030.520.27
Note: The data represent the mean ± standard error of nine replicates, and different letters after the numerical value indicate a significant difference of 0.05. * Significant difference at p < 0.05; ** significant difference at p < 0.01. LSV represents long-season variety, while SSV represents short-season variety.
Table 4. Photosynthetic parameters during the JS-75 period for long- and short-season varieties under various intercropping row ratio conditions.
YearVarieties
Combination
Intercropping Row RatioPn
(μmol·m−2·s−1)
Gs
(mmol·m−2·s−1)
Ci
(μmol·mol−1)
Tr
(mmol·m−2·s−1)
LSVSSVLSVSSVLSVSSVLSVSSV
2023Z‖Y1:024.75 ± 0.90 b0.28 ± 0.04 c237.77 ± 12.31 a3.63 ± 0.12 c
6:625.47 ± 0.97 ab17.52 ± 0.36 a0.31 ± 0.00 b0.13 ± 0.03 a232.20 ± 11.95 ab300.27 ± 7.11 a3.95 ± 0.27 b2.23 ± 0.04 ab
4:425.70 ± 0.85 ab17.44 ± 0.52 a0.36 ± 0.03 ab0.10 ± 0.03 ab228.13 ± 9.65 ab302.97 ± 13.74 a4.07 ± 0.11 ab2.19 ± 0.12 ab
2:226.41 ± 0.67 a17.26 ± 0.76 a0.38 ± 0.04 ab0.08 ± 0.04 bc223.93 ± 6.47 ab304.57 ± 5.66 a4.17 ± 0.20 ab2.17 ± 0.09 ab
1:126.68 ± 0.80 a16.87 ± 0.16 a0.40 ± 0.04 a0.05 ± 0.02 c219.13 ± 3.46 b312.47 ± 2.89 a4.39 ± 0.18 a2.06 ± 0.09 b
0:117.68 ± 0.46 a0.14 ± 0.02 a298.47 ± 9.96 a2.27 ± 0.11 a
X‖Y1:020.45 ± 0.53 b0.17 ± 0.01 a286.60 ± 4.76 a2.47 ± 0.21 c
6:620.74 ± 0.73 b17.62 ± 0.26 a0.18 ± 0.01 a0.12 ± 0.01 ab285.33 ± 1.15 a299.47 ± 5.06 a2.50 ± 0.13 c2.20 ± 0.03 a
4:421.05 ± 0.42 ab17.45 ± 0.20 a0.20 ± 0.02 ab0.11 ± 0.02 ab282.67 ± 1.14 ab300.83 ± 5.76 a2.55 ± 0.09 bc2.16 ± 0.16 a
2:221.34 ± 0.41 ab17.34 ± 0.27 a0.24 ± 0.03 b0.09 ± 0.01 bc279.80 ± 3.36 ab310.25 ± 4.78 a2.75 ± 0.06 ab2.15 ± 0.09 a
1:121.93 ± 0.42 a17.12 ± 0.24 a0.25 ± 0.04 b0.07 ± 0.02 c275.47 ± 7.50 b311.60 ± 11.61 a2.85 ± 0.08 a2.13 ± 0.11 a
0:117.68 ± 0.46 a0.14 ± 0.02 a298.47 ± 9.96 a2.27 ± 0.11 a
2024Z‖Y1:026.22 ± 0.72 b0.30 ± 0.02 c269.33 ± 14.98 a3.86 ± 0.31 b
6:626.73 ± 0.18 ab18.93 ± 0.97 a0.34 ± 0.05 bc0.15 ± 0.01 ab260.83 ± 8.49 ab310.30 ± 12.05 ab3.94 ± 0.24 b2.62 ± 0.19 ab
4:427.5 ± 0.75 ab18.67 ± 0.49 a0.38 ± 0.03 ab0.11 ± 0.03 abc258.43 ± 1.50 ab316.33 ± 3.21 ab4.11 ± 0.17 ab2.56 ± 0.35 ab
2:228.35 ± 1.76 ab18.23 ± 1.15 a0.39 ± 0.04 ab0.09 ± 0.05 bc251.57 ± 3.19 b320.67 ± 10.80 a4.27 ± 0.34 ab2.32 ± 0.29 ab
1:128.61 ± 1.66 a17.88 ± 0.66 a0.42 ± 0.04 a0.06 ± 0.03 c246.55 ± 9.90 b327.21 ± 13.14 a4.57 ± 0.25 a2.19 ± 0.18 b
0:119.12 ± 0.40 a0.16 ± 0.03 a300.83 ± 8.32 b2.78 ± 0.23 a
X‖Y1:021.98 ± 0.95 b0.19 ± 0.04 a297.67 ± 11.59 a2.84 ± 0.11 b
6:622.59 ± 1.19 ab18.96 ± 0.96 a0.22 ± 0.02 ab0.14 ± 0.02 ab292.33 ± 5.30 ab304.80 ± 5.89 bc2.90 ± 0.18 b2.72 ± 0.12 ab
4:422.79 ± 0.90 ab18.73 ± 0.95 a0.23 ± 0.04 abc0.13 ± 0.03 ab288.33 ± 8.96 ab312.67 ± 13.01 abc3.13 ± 0.10 ab2.63 ± 0.23 ab
2:223.65 ± 0.53 ab18.44 ± 0.56 a0.26 ± 0.04 bc0.12 ± 0.03 ab283.00 ± 3.61 ab318.83 ± 1.61 ab3.17 ± 0.26 ab2.58 ± 0.23 ab
1:124.39 ± 1.89 a18.25 ± 0.86 a0.29 ± 0.03 c0.10 ± 0.03 b281.53 ± 7.45 b322.19 ± 10.07 a3.26 ± 0.16 a2.35 ± 0.16 b
0:119.12 ± 0.40 a0.16 ± 0.03 a300.83 ± 8.32 c2.78 ± 0.23 a
Significance (F-value)
Year (Y)53.41 **58.73 **8.72 **8.80 **76.38 **17.84 **29.48 **65.14 **
Varieties combination (V)330.68 **0.47245.29 **1.97432.47 **0.60624.1 **1.52
Intercropping row ratio (I)8.58 **3.72 **20.44 **17.08 **1.110.2715.60 **6.60 **
(Y × V)0.350.020.310.8830.35 **0.370.171.71
(Y × I)0.320.250.170.092.347.42 **10.75 **1.77
(V × I) 0.180.110.941.161.870.201.100.30
(Y × V × I) 0.060.010.020.083.94 **0.080.490.23
Note: The data represent the mean ± standard error of nine replicates, and different letters after the numerical value indicate a significant difference of 0.05. ** significant difference at p < 0.01. LSV represents long-season variety, while SSV represents short-season variety.
Table 5. Dry matter transport characteristics of long- and short-season maize varieties under different intercropping row ratio.
YearVarieties CombinationIntercropping Row RatioDMT (kg·ha−1)DMTE (%)DMTP (%)
LSVSSVLSVSSVLSVSSV
2023Z‖Y1:01500.77 ± 4.10 c17.23 ± 3.13 a12.57 ± 2.44 a
6:61614.19 ± 1.50 c1033.82 ± 4.31 a17.73 ± 1.17 a13.27 ± 3.96 a12.72 ± 1.23 a9.34 ± 2.91 a
4:41686.30 ± 3.35 bc899.27 ± 1.96 a17.71 ± 2.43 a11.89 ± 1.84 a12.74 ± 1.91 a8.22 ± 1.35 a
2:22040.80 ± 5.20 ab838.33 ± 2.65 a20.34 ± 3.29 a11.31 ± 2.61 a14.72 ± 2.72 a7.80 ± 1.88 a
1:12182.39 ± 2.04 a799.12 ± 2.56 a21.15 ± 1.24 a10.96 ± 2.45 a15.33 ± 0.87 a7.55 ± 1.83 a
0:11046.79 ± 2.33 a13.37 ± 2.12 a9.43 ± 1.76 a
X‖Y1:01383.68 ± 3.46 b16.73 ± 2.87 a12.00 ± 2.26 a
6:61485.05 ± 3.15 ab1031.42 ± 2.44 a17.37 ± 2.36 a13.25 ± 2.11 a12.60 ± 2.03 a9.32 ± 1.61 a
4:41552.82 ± 2.68 ab964.79 ± 4.93 a17.42 ± 2.05 a12.57 ± 4.61 a12.81 ± 1.67 a8.82 ± 3.45 a
2:21709.81 ± 3.52 ab853.39 ± 3.23 a18.54 ± 2.56 a11.42 ± 2.95 a13.49 ± 2.05 a7.91 ± 2.22 a
1:11821.73 ± 4.20 a715.09 ± 2.34 a19.17 ± 2.87 a9.88 ± 2.23 a14.13 ± 2.42 a6.69 ± 1.62 a
0:11046.79 ± 2.33 a13.37 ± 2.12 a9.43 ± 1.76 a
2024Z‖Y1:01589.65 ± 7.77 c17.51 ± 5.91 b12.80 ± 4.64 a
6:61693.36 ± 4.68 bc1067.38 ± 3.22 a18.22 ± 3.61 b13.46 ± 2.86 a13.12 ± 2.89 a9.68 ± 2.22 a
4:41792.72 ± 2.23 abc1008.21 ± 1.18 a18.31 ± 1.59 ab13.01 ± 1.03 a13.15 ± 1.09 a9.29 ± 0.93 a
2:22044.07 ± 6.75 ab929.59 ± 3.22 a19.93 ± 4.42 ab12.32 ± 3.01 a14.69 ± 3.42 a8.70 ± 2.23 a
1:12270.34 ± 2.03 a864.60 ± 2.44 a21.51 ± 1.13 a11.67 ± 2.38 a15.85 ± 0.93 a8.21 ± 1.83 a
0:11086.72 ± 2.45 a13.59 ± 2.07 a9.81 ± 1.80 a
X‖Y1:01466.18 ± 1.47 c17.41 ± 1.21 a12.69 ± 0.70 a
6:61518.43 ± 1.52 bc1077.36 ± 2.47 a17.41 ± 1.00 a13.56 ± 2.20 a12.84 ± 0.92 a9.77 ± 1.73 a
4:41617.32 ± 1.62 bc1013.82 ± 3.76 a18.00 ± 1.37 a12.94 ± 2.23 a13.17 ± 1.08 a9.32 ± 2.60 a
2:21726.27 ± 1.83 ab991.58 ± 0.72 a18.42 ± 1.50 a12.92 ± 0.67 a13.43 ± 1.13 a9.26 ± 0.54 a
1:11879.86 ± 2.72 a941.04 ± 1.24 a19.49 ± 2.05 a12.42 ± 1.04 a14.40 ± 1.70 a8.94 ± 0.87 a
0:11086.72 ± 2.45 a13.59 ± 2.07 a9.81 ± 1.80 a
Significance (F-value)
Year (Y)1.592.853.801.700.403.62
Varieties combination (V)2.440.040.500.001.640.08
Intercropping row ratio (I)14.11 **3.62 *5.65 **2.173.57 *2.38
(Y × V)4.60 *0.226.21 *0.200.000.13
(Y × I)0.130.180.160.210.030.23
(V × I) 1.310.020.880.020.350.04
(Y × V × I) 0.190.180.250.170.020.17
Note: DMT refers to dry matter transport capacity; DMTE refers to dry matter transport rate; DMTP refers to the contribution rate of transferred dry matter to kernels. The data represent the mean ± standard error of nine replicates, and different letters after the numerical value indicate a significant difference of 0.05. * Significant difference at p < 0.05; ** significant difference at p < 0.01. LSV represents long-season variety, while SSV represents short-season variety.
Table 6. Grain yield and yield components of long- and short-season maize varieties under different intercropping row ratios.
YearVarieties CombinationIntercropping Row RatioEffective Ears Number
(Ears ha−1)
Kernels Number per Ear
(Kernels Ear−1)
100-Kernel Weigh
(g)
Grain Yield
(kg ha−1)
LSVSSVLSVSSVLSVSSVLSVSSV
2023Z‖Y1:165,378.17 ± 440.37 a564.54 ± 7.69 b33.07 ± 1.14 d12,206.33 ± 480.09 d
6:665,639.05 ± 643.45 a66,185.33 ± 607.58 a570.68 ± 8.55 ab582.07 ± 1.19 a34.75 ± 0.28 c29.83 ± 1.85 a13,017.50 ± 292.74 c11,492.06 ± 688.25 a
4:465,800.97 ± 685.56 a66,086.34 ± 591.01 a571.64 ± 3.24 ab581.98 ± 2.64 a35.05 ± 0.14 c29.66 ± 1.51 a13,183.72 ± 134.46 bc11,411.28 ± 687.41 a
2:265,959.70 ± 921.08 a65,804.77 ± 683.38 a572.60 ± 4.17 ab581.11 ± 3.17 a36.42 ± 0.34 b29.36 ± 1.50 a13,754.82 ± 217.77 b11,233.36 ± 749.01 a
1:166,125.47 ± 737.12 a65,780.60 ± 500.81 a578.50 ± 7.14 a580.35 ± 4.30 a37.57 ± 0.25 a28.92 ± 0.59 a14,373.53 ± 374.97 a11,041.84 ± 334.46 a
0:166,275.18 ± 509.29 a583.60 ± 2.49 a30.13 ± 1.05 a11,652.06 ± 270.27 a
X‖Y1:165,071.94 ± 256.55 a573.35 ± 4.66 b31.88 ± 0.94 c11,895.30 ± 468.46 c
6:665,267.70 ± 222.64 a65,602.72 ± 698.57 a578.74 ± 5.59 ab581.22 ± 3.62 a32.42 ± 0.42 c30.47 ± 1.62 a12,246.04 ± 199.46 c11,620.93 ± 707.61 a
4:465,335.59 ± 327.36 a65,508.14 ± 483.44 a580.77 ± 5.27 ab580.81 ± 1.99 a32.98 ± 0.25 c30.04 ± 1.43 a12,514.36 ± 81.75 bc11,428.74 ± 524.47 a
2:265,597.22 ± 461.33 a65,441.22 ± 534.14 a583.21 ± 6.61 ab579.97 ± 2.51 a34.22 ± 0.91 b29.33 ± 1.06 a13,095.46 ± 551.90 ab11,129.32 ± 355.38 a
1:165,631.58 ± 601.30 a65,393.08 ± 623.99 a584.42 ± 5.50 a578.80 ± 2.22 a35.71 ± 0.18 a28.89 ± 0.39 a13,698.44 ± 312.25 a10,934.70 ± 176.96 a
0:166,275.18 ± 509.29 a583.60 ± 2.49 a30.13 ± 1.05 a11,652.06 ± 270.27 a
2024Z‖Y1:165,338.43 ± 683.90 a565.42 ± 5.17 b33.46 ± 0.36 d12,359.33 ± 142.06 d
6:665,764.96 ± 734.49 a66,349.38 ± 506.50 a568.42 ± 5.23 ab583.42 ± 6.90 a35.45 ± 0.87 c29.92 ± 0.39 a13,251.99 ± 375.94 c11,581.95 ± 307.31 a
4:465,842.92 ± 508.52 a66,287.63 ± 492.13 a569.42 ± 4.22 ab582.64 ± 4.04 a36.12 ± 0.57 bc29.65 ± 1.05 a13,541.54 ± 207.40 bc11,456.77 ± 561.22 a
2:266,048.55 ± 458.39 a66,152.19 ± 402.39 a570.96 ± 6.74 ab581.49 ± 5.15 a36.77 ± 0.42 b29.35 ± 1.00 a13,865.80 ± 191.8 b11,288.08 ± 223.68 a
1:166,448.17 ± 327.87 a66,123.22 ± 415.42 a576.55 ± 4.34 a580.76 ± 4.37 a38.24 ± 0.90 a28.96 ± 0.88 a14,652.84 ± 515.00 a11,119.68 ± 191.05 a
0:166,389.42 ± 411.98 a584.33 ± 4.23 a30.26 ± 1.14 a11,736.72 ± 293.29 a
X‖Y1:165,384.63 ± 323.90 a572.64 ± 1.69 c32.35 ± 0.81 c12,111.48 ± 325.77 c
6:665,429.36 ± 386.24 a65,684.29 ± 494.97 a576.95 ± 3.93 bc583.85 ± 3.59 a33.34 ± 0.52 bc30.57 ± 1.09 a12,587.42 ± 337.24 bc11,728.92 ± 576.12 a
4:465,580.23 ± 482.93 a65,498.06 ± 585.30 a577.16 ± 1.49 bc582.96 ± 4.58 a33.78 ± 1.41 bc30.46 ± 1.12 a12,782.44 ± 409.23 bc11,629.51 ± 404.69 a
2:265,692.75 ± 531.89 a65,387.13 ± 675.78 a578.22 ± 3.07 b581.60 ± 5.18 a34.59 ± 0.70 b30.08 ± 0.38 a13,141.60 ± 440.39 b11,438.03 ± 62.29 a
1:165,882.47 ± 585.47 a65,284.56 ± 766.51 a583.33 ± 2.91 a581.01 ± 4.93 a36.59 ± 0.76 a29.13 ± 1.04 a14,061.25 ± 359.47 a11,045.61 ± 313.78 a
0:166,389.42 ± 411.98 a584.33 ± 4.23 a30.26 ± 1.14 a11,736.72 ± 293.29 a
Significance (F-value)
Year (Y)1.300.692.011.6214.56 **0.421.65 **1.03
Varieties combination (V)6.07 *12.04 **35.60 **0.1351.34 **1.2817.70 **0.08
Intercropping row ratio (I)3.13 *2.92 *7.98 **1.6380.00 **2.5468.36 **4.29 **
(Y × V)0.140.642.14 *0.331.770.221.020.16
(Y × I)0.060.000.200.040.240.030.100.02
(V × I)0.200.770.110.130.830.200.720.12
(Y × V × I)0.070.090.080.020.310.060.110.05
Note: The data represent the mean ± standard error of nine replicates, and different letters after the numerical value indicate a significant difference of 0.05. * Significant difference at p < 0.05; ** significant difference at p < 0.01. LSV represents long-season variety, while SSV represents short-season variety.
Disclaimer/Publisher’s Note: The statements, opinions and data contained in all publications are solely those of the individual author(s) and contributor(s) and not of MDPI and/or the editor(s). MDPI and/or the editor(s) disclaim responsibility for any injury to people or property resulting from any ideas, methods, instructions or products referred to in the content.