Article

Composition Characteristics of Dissolved Organic Matter and Its Coupling with Nutrient Stoichiometry in Tea Garden Soils

Fujian Provincial Key Laboratory of Eco-Industrial Green Technology, College of Ecology and Resources Engineering, Wuyi University, Wuyishan 354300, China
*
Author to whom correspondence should be addressed.
Agronomy 2025, 15(11), 2449; https://doi.org/10.3390/agronomy15112449
Submission received: 2 October 2025 / Revised: 18 October 2025 / Accepted: 19 October 2025 / Published: 22 October 2025
(This article belongs to the Section Soil and Plant Nutrition)

Abstract

Nutrient stoichiometry and dissolved organic matter (DOM) govern essential ecosystem processes; however, their coupling in tea garden soils remains obscure, and cultivar-specific effects on this linkage remain virtually unknown. In this study, soil carbon (C), nitrogen (N), and phosphorus (P) contents and their C/N/P stoichiometry were measured in two contrasting tea cultivars, Rougui and Shuixian. DOM composition and sources were resolved using UV–visible spectroscopy, three-dimensional fluorescence spectroscopy, and parallel factor analysis. The tea garden soils exhibited low C/N/P ratios but high nutrient availability. DOM was dominated by fulvic- and tyrosine-like components, indicating low humification and high biodegradability. Soil organic matter and C/N/P stoichiometry jointly controlled the quantity and quality of DOM. In Rougui soils, protein-like DOM accounted for 61.92% ± 7.27% of total fluorescence and was primarily regulated by the N/P ratio. In Shuixian soils, humic-like DOM increased to 53.13% ± 8.58% of total fluorescence and was positively driven by the C/P ratio. These findings demonstrate that tea cultivars modulate the coupling between DOM and C/N/P stoichiometry, providing a basis for cultivar-specific fertilization strategies, efficient regulation of soil nutrient cycling, and sustainable tea garden management.

1. Introduction

Dissolved organic matter (DOM) serves as an immediate carbon (C) and nutrient source for soil microbes and is therefore pivotal to global biogeochemical cycling [1,2]. Its composition, structure, and origin are jointly shaped by biological, abiotic, and anthropogenic drivers, including plant inputs, microbial and fungal biomass, soil physicochemical conditions, land-use changes, and fertilization regimes [3,4,5]. Although DOM represents only a trace fraction of the total soil organic matter (SOM) [6,7], its high bioactivity renders it highly responsive to land management practices and vegetation shifts [8,9]. Consequently, soil DOM has emerged as a sensitive indicator of soil health, carbon stability, and nutrient-cycling efficiency [10,11], offering exceptional value for evaluating how agricultural strategies influence soil nutrient dynamics and long-term sustainability.
C, nitrogen (N), and phosphorus (P) are the cornerstone elements of living biomass [12]. Their stoichiometric ratios (C/N/P) serve as key indicators of soil nutrient cycling and “potential fertility” in terrestrial ecosystems, effectively reflecting whether the soil ecosystem remains in a steady state or becomes destabilized [12,13]. In contrast, alkali-hydrolyzable N (AN), available P (AP), and available potassium (AK) act as indicators of nutrient availability, reflecting the immediate capacity of the soil to supply nutrients to plants [14]. The total nutrient pools continuously replenish these labile fractions through mineralization and dissolution, whereas labile nutrients constitute critical coupling nodes in microbially driven nutrient cycling, which in turn impacts SOM mineralization via priming effects [15,16]. The balance between these pools governs the trajectory of soil fertility and is closely linked to fertilization efficiency and ecological security [17].
Extensive studies have documented the relationships among soil nutrient indices across diverse agroecosystems, including maize fields, paddy soils, and vegetable plots [17,18,19]. However, studies that explicitly link DOM compositional diversity (e.g., fluorescence components) to nutrient stoichiometry remain scarce [12,13], and the underlying mechanisms are poorly understood, particularly in acidifying tea garden soils [20]. Stoichiometric ratios reflect soil nutrient status and influence microbial communities and their metabolic traits. They also shape the diverse compositional features and ecological reactivities of DOM [11,15]. Conversely, as the most reactive fraction of SOM, DOM passively responds to shifts in soil nutrients and actively reshapes microbially driven nutrient-cycling patterns [1,13]. In China, as the world’s leading tea producer, several tea gardens are confronted with severe nutrient imbalances [21]. Global demand for tea and breeding advances have led to the production of a large array of tea cultivars. Genotypic differences modulate plant physiology, nutrient uptake, and storage [22,23], whereas divergent litter and root exudate chemistries can shape microbial communities and the associated nutrient cycling, eliciting cultivar-specific nutrient responses [24,25]. Systematic studies that comprehensively take into consideration DOM components and nutrient stoichiometry in tea garden soils are relatively scarce. Further, how different tea cultivars modulate this coupling remains largely unexplored. This knowledge gap hinders the development of precise nutrient management approaches in tea agroecosystems, where nutrient imbalances pose a threat to crop productivity and soil ecological security. We hypothesized that (1) soil nutrient stoichiometric ratios are coupled with DOM components in tea gardens and (2) the indicators driving this coupling vary by the planted tea cultivar. Given the high bioactivity of DOM, understanding cultivar-specific DOM–nutrient coupling can scientifically aid cultivar-differentiated tea plant fertilization management, enhance the sustainability of tea production and offer critical insights into the influence of crop genetic diversity on soil biogeochemistry in intensively managed agroecosystems.
We, therefore, investigated tea gardens planted with two widely cultivated genotypes in Southeast China—the shrub-type cultivar Rougui and the arbor-type cultivar Shuixian. We characterized the content and composition of tea garden soil DOM and elucidated how DOM fractions couple with nutrient stoichiometry in each cultivar. To the best of our knowledge, this is the first systematic study to report on the coupling of DOM components and nutrient stoichiometry in tea garden soils with different tea genotypes. Such information provides critical guidance for sustaining soil nutrient cycling, maximizing fertilizer efficiency, mitigating ecosystem nutrient losses, and mitigating downstream ecological risks.

2. Materials and Methods

2.1. Study Area

Wuyishan City (27°27′–28°04′ N, 117°37′–118°19′ E) lies in the northern part of Fujian Province, southeastern China, and is recognized as the birthplace of oolong and black tea [12]. The region has a mid-subtropical monsoon climate, characterized by a mean annual temperature of 17.9 °C, a mean annual precipitation of 1847 mm, and a mean relative humidity of 70–85%. The dominant soil type is acidic red soil. According to the USDA Soil Taxonomy, the red soils in this region are classified as oxisols [26]. These are highly suitable for tea cultivation and the development of premium quality tea [27]. Wuyi Rock tea, one of the most prestigious oolong teas and among China’s top 10 famous teas, is celebrated worldwide for its distinctive “rock rhyme” flavor. By 2024, the total Wuyi Rock tea plantation area in t Wuyishan City surpassed 200 km2, with Rougui and Shuixian being the principal cultivars [20].

2.2. Sampling and Laboratory Analyses

In May 2023, a comprehensive survey of green tea gardens was conducted in Wuyishan. Representative Rougui and Shuixian plantations established on identical or closely related parent rocks were selected from this census (Figure 1). Here, a tea garden is defined as a single, contiguous plot of approximately 200–500 m2, rather than an entire farm or geographic cluster. The horizontal distance between any two gardens is ≥1.5 km. During sampling, the daily mean air temperature was 21–22 °C, monthly precipitation was approximately 300 mm, and the average relative humidity was approximately 85%. For each plantation, five sampling points were arranged in an S-shaped pattern. Surface soils (0–20 cm) were collected using a standard soil auger and thoroughly mixed to obtain a composite sample per plot. In total, 43 samples were obtained from Rougui gardens and 45 from Shuixian gardens, yielding 88 soil samples. The cultivar, tree age, altitude, and GPS (Garmin GPSMAP 66 series, Shanghai Garmin Speed Aviation Technology Co., Ltd., Shanghai, China) coordinates were recorded for every sampling site. Owing to random field sampling, detailed records of fertilizer application were unavailable. Local tea plantations typically apply urea in combination with compound fertilizer. A smaller proportion of tea plantations use a combination of chemical fertilizers and organic manure, with a limited number of plots receiving no fertilization [27,28].
After transport to the laboratory, each soil sample was cleared of stones, roots, and other debris and then air-dried in the shade [1,5]. Once dry, the soil was gently crushed with a wooden roller and passed through a 2 mm sieve for the determination of pH and routine nutrient content. An aliquot of each sieved sample was subsequently ground in an agate mortar to <100 mesh size for DOM extraction and analysis.
Soil pH was determined potentiometrically in a 1:2.5 soil-to-water suspension [11]. The total organic carbon (TOC), total nitrogen (TN), and total phosphorus (TP) were measured using the potassium dichromate volumetric method, alkaline persulfate digestion-UV spectrophotometry, and molybdenum blue spectrophotometric method, respectively [29]. Alkali-hydrolysable N (AN), available P (AP), and readily exchangeable potassium (AK) were quantified using the alkaline diffusion method, 0.5 M NaHCO3 extraction followed by Mo-Sb anti-colorimetry, and 1 M NH4OAc extraction followed by flame photometry [14]. The above chemical reagents come from Shanghai Zhongqin Chemical Reagent Co., Ltd., Shanghai, China. All analyses were performed in triplicate for each composite sample, and the mean values were used for statistical analysis.
The DOM was extracted by shaking. Ten grams of air-dried soil (<100 mesh) was placed in a 250 mL centrifuge tube with 100 mL ultrapure water (soil: water = 1:10), shaken at 200 rpm for 24 h, and then centrifuged at 4000 rpm for 30 min. The supernatant was filtered through a 0.45 µm glass-fiber membrane, pre-combusted at 500 °C for 5 h, to yield the soil DOM extract [5]. The extracts were then stored in amber vials at 4 °C. The dissolved organic carbon (DOC) concentration was determined using a Shimadzu TOC-L analyzer (Shimadzu Co., Ltd., Kyoto, Japan).
The integration of UV–visible spectroscopy, three-dimensional excitation–emission matrix fluorescence spectroscopy (3D-EEM), and parallel factor analysis (PARAFAC) serves as an effective approach for characterizing the composition, structure, and sources of DOM [20]. UV–visible spectra were recorded using a Shimadzu UV–2550 spectrophotometer (200–800 nm, at 1 nm intervals, with ultrapure water as the blank; Shimadzu Co., Ltd., Kyoto, Japan) [30]. Three-dimensional fluorescence spectra were acquired with a Hitachi F-7100 fluorometer (Shimadzu Co., Ltd., Kyoto, Japan) using an excitation range of 200 to 400 nm and emission range of 250 to 550 nm (both slits 5 nm, scan speed 2400 nm/min) [5]. These methods ensure high sensitivity, low cost, and short analysis time, while also preserving the samples in their original, unaltered state. Consequently, they represent the simplest, most efficient, and most versatile approaches for studying DOM characteristics [1,2]. In addition, the SOM content was 1.72 times that of TOC content (based on the Bemmelen conversion coefficient) [1]. The DOM content was estimated based on the DOC concentration [5].

2.3. Data Processing and Analysis

2.3.1. Spectral Indices

From the acquired spectra, we calculated the following indices to characterize the DOM composition and origin. SUVA254 and SUVA260 are the specific UV–visible absorbances at 254 nm and 260 nm, respectively, expressed as absorbance (AU) per mg C/L (L/mg/m) [10,11]. E300/E400 is the ratio of the absorbance at 300 nm to that at 400 nm. SUVA254 and SUVA260 reflect the aromaticity and hydrophobicity, respectively [1,4]. Meanwhile, the E300/E400 ratio is a proxy for the molecular weight, aromaticity, and degree of humification [31]. The fluorescence index (FI) is the ratio is the amount of light emitted between 450 and 500 nm when an object is excited using light with a wavelength of 370 nm [12,32]. It enables rapid differentiation of DOM provenance; values < 1.4 indicate predominantly terrestrial (allochthonous) sources, while values > 1.9 indicate a microbial/autochthonous origin [12,32]. The humification index (HIX) is the ratio of integrated emission intensities at 435–480 nm to those at 300–345 nm at an excitation wavelength of 254 nm [6]. HIX quantifies the degree of DOM humification; HIX > 10 indicates highly humified, aromatic-rich material. Meanwhile, a HIX < 4 indicates low humification [30,33]. The biological index (BIX) is the ratio of emission at 380 to 430 nm at an excitation wavelength of 310 nm [6]. BIX reflects the proportion of recently produced, microbially derived DOM. A BIX < 0.6 indicates minimal autochthonous contribution and dominant terrestrial input. Meanwhile, 0.6 ≤ BIX ≤ 0.8 indicates moderate autochthonous character. A BIX > 1.0 indicates that fresh autochthonous or microbial degradation products prevail [30,33].

2.3.2. PARAFAC Modeling

The fluorescence data were subjected to PARAFAC analysis using the DOMFluor toolbox in MATLAB R2020b, resulting in the creation of a validated four-component model [30]. Component types were assigned according to each component’s maximum fluorescence intensity (Fmax). Their relative contribution to the total DOM pool was quantified by incorporating component-specific fluorescence efficiencies (SFEs) [1].

2.3.3. Structural Equation Modeling (SEM)

As a statistical modeling technique, SEM enables the elucidation of explicit interrelationships between empirical data through the mathematical representation of complex causal networks [5]. It enables the testing of hypothesized relationships using observed data and is often used to test multivariate theoretical hypotheses [34]. Partial least squares structural equation modeling (PLS-SEM) does not have strict requirements for sample distribution and can produce reliable estimates even with limited sample sizes [13]. SEM results are typically evaluated by integrating the path coefficients (β), their significance levels (p), and the proportion of explained variance (R2). In this study, PLS-SEM was used to evaluate the relationships between DOM (content and compositional characteristics) and nutrients (content and stoichiometric ratios) in the soils of tea plantations with different tea tree varieties.

2.3.4. Statistical Analyses

Sampling locations were mapped in ArcMap 10.8 (Esri, Redlands, CA, USA) using the recorded GPS coordinates; elevation data were obtained from our previously published dataset [12]. One-way ANOVA (p < 0.05) of the soil nutrient content and stoichiometric ratios was performed using SPSS 27 (SPSS Inc., Chicago, IL, USA). The spectral indices and DOM fluorescence components were computed using MATLAB 2020b (MathWorks Inc., Natick, MA, USA). Correlation heat maps between the DOM components were generated using GraphPad Prism 5 (GraphPad Software Inc., La Jolla, CA, USA) and Origin 2021 (Origin Lab. Inc., Northampton, MA, USA). Redundancy analysis (RDA) was conducted in Canoco 5 (Microcomputer Power, Ithaca, NY, USA) to assess DOM responses to soil nutrients. For RDA, predictor variables, i.e., soil nutrients, were log(x + 1)-transformed. DOM optical indices were left untransformed, and all variables were centered and standardized to comply with RDA’s linearity assumption. SmartPLS 4.0 (SmartPLS GmbH, Bönningstedt, Germany) was used to conduct PLS-SEM, and 5000 bootstrap samples were employed to test the significance of the path coefficients.

3. Results

3.1. Soil Nutrient Contents and Stoichiometric Ratios in Wuyi Rock Tea Gardens

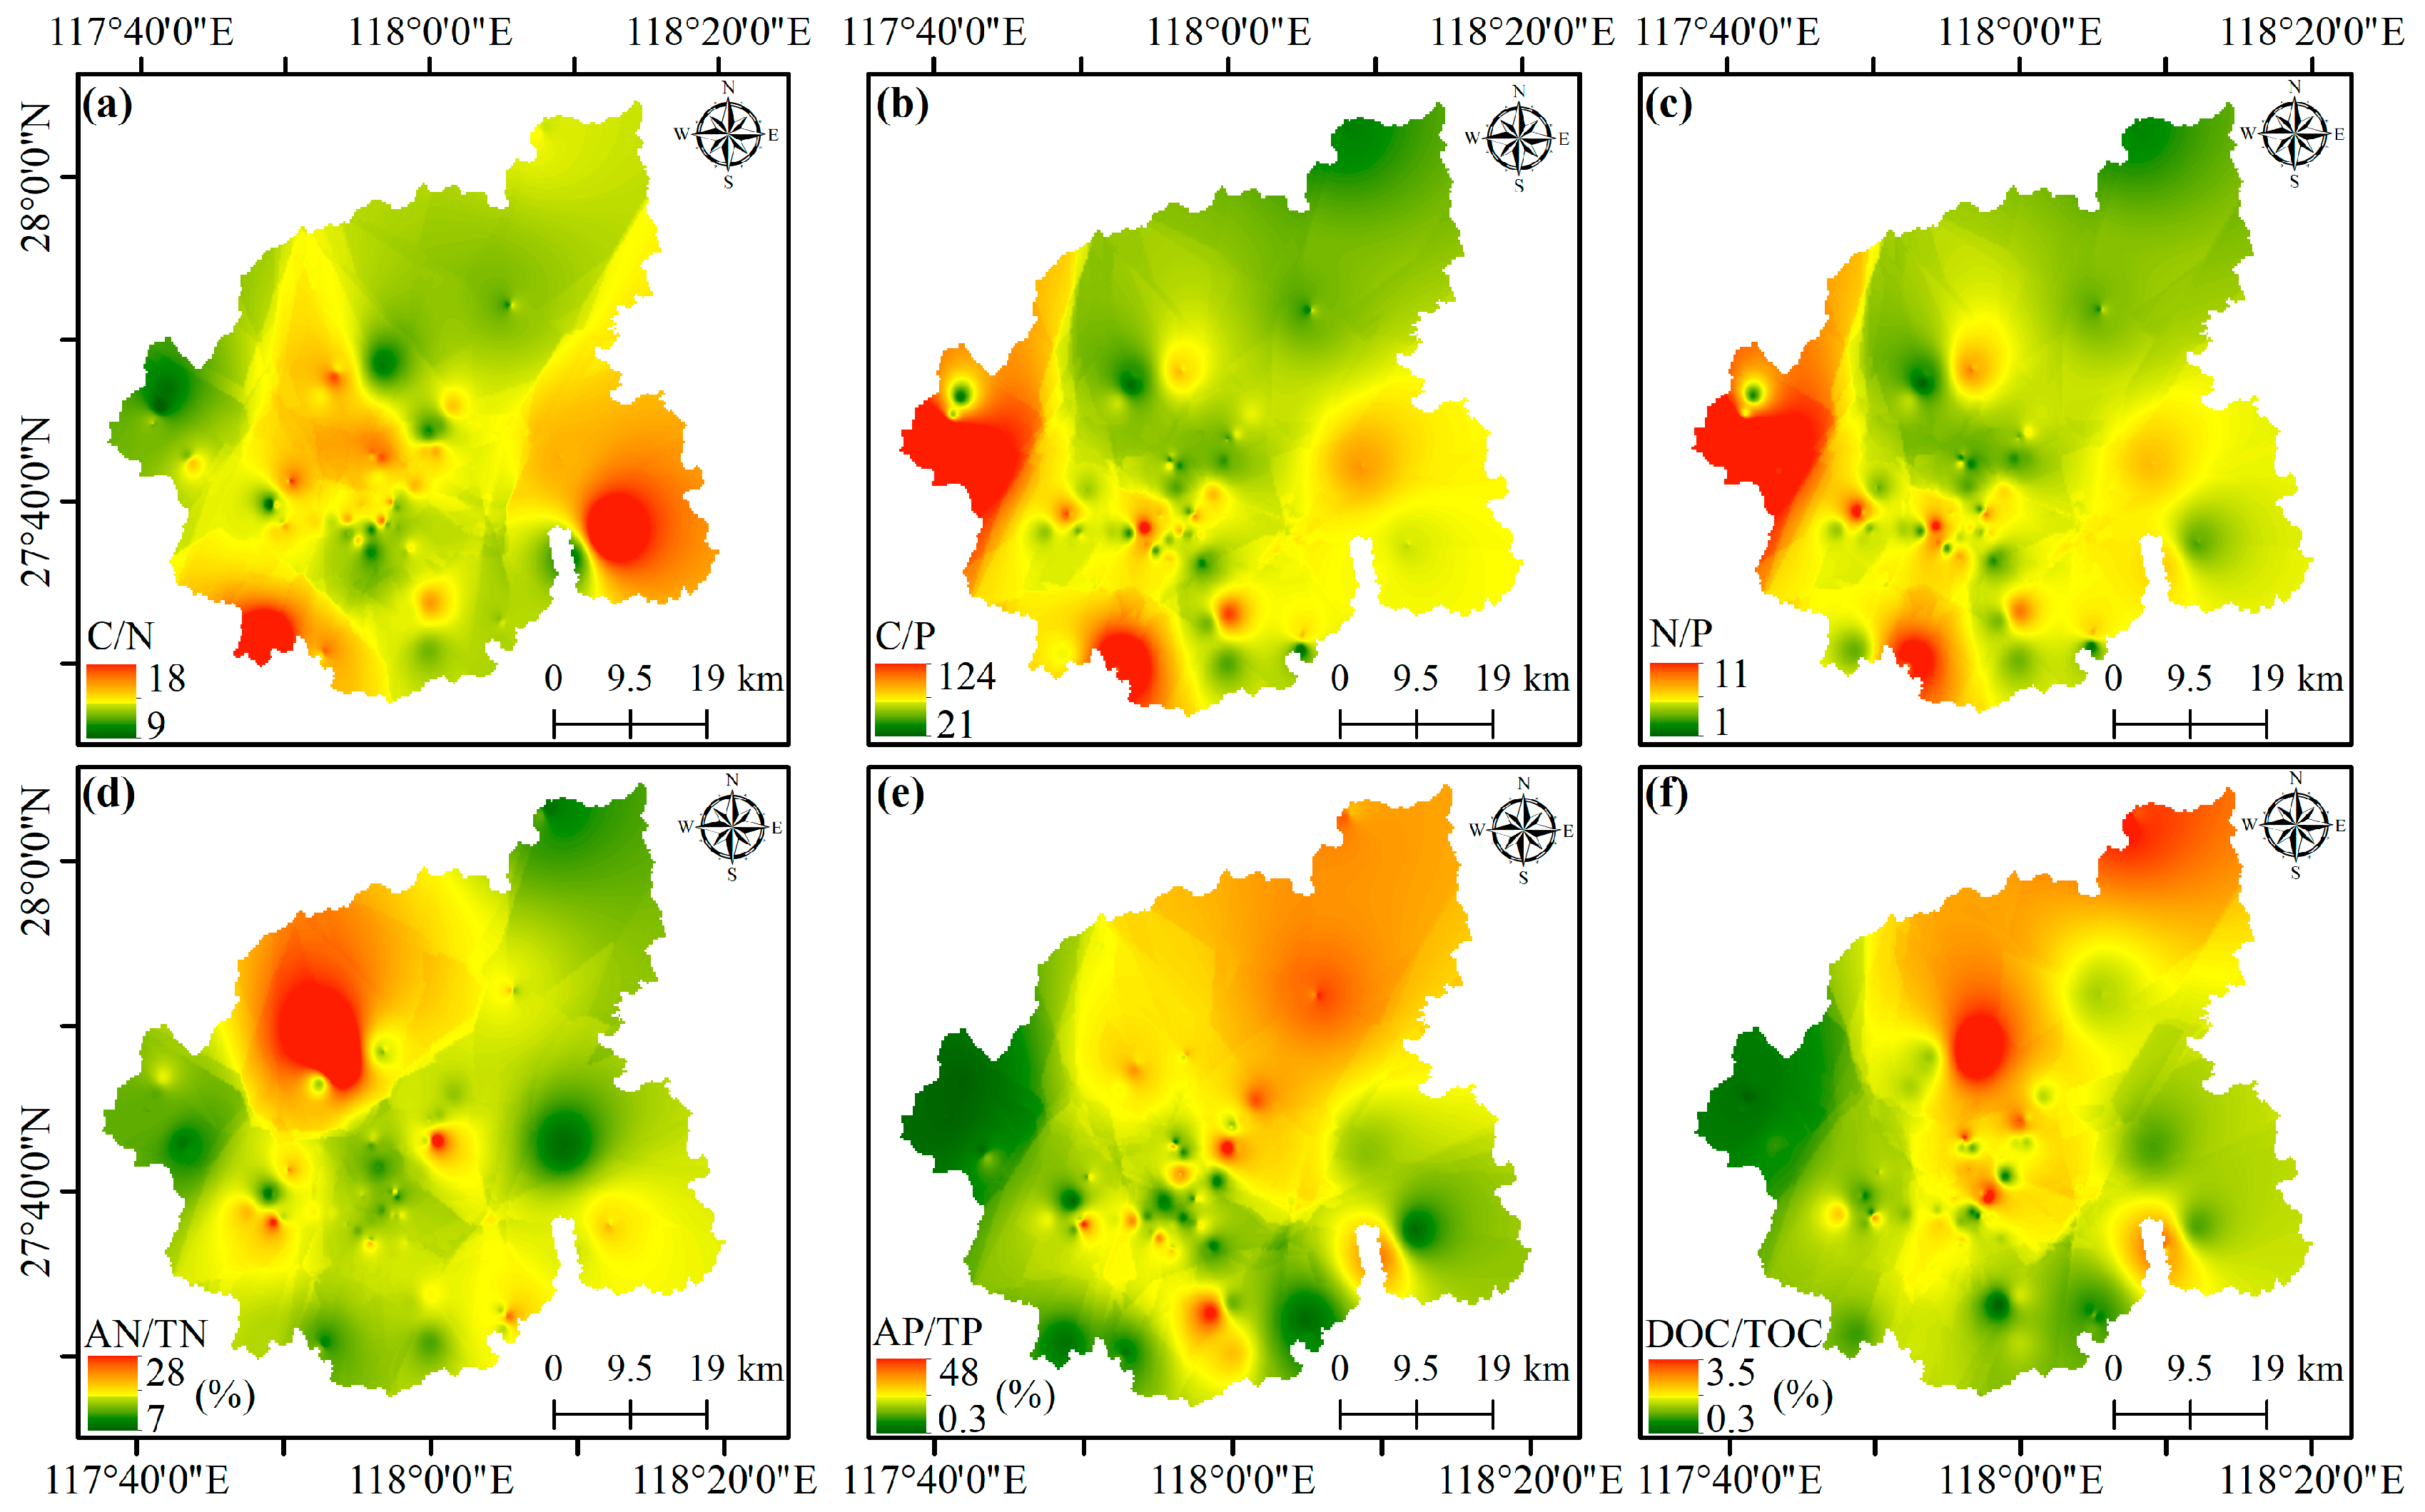
The soil pH in the Rougui tea gardens was significantly higher than that in the Shuixian tea gardens (Table S1). The SOC, TN, TP, and AN contents in the Rougui gardens were slightly lower than those in the Shuixian gardens, whereas the DOC, AP, and AK concentrations were markedly higher (Table S1). The soil stoichiometric ratios for both tea cultivars were comparable—C/N (Rougui: 12.24 ± 1.14; Shuixian: 12.94 ± 1.70), N/P (Rougui: 4.31 ± 1.64; Shuixian: 4.47 ± 2.35), C/P (Rougui: 52.63 ± 21.35; Shuixian: 56.54 ± 26.62), and AN/TN (Rougui: 11.41 ± 2.51%; Shuixian: 11.66 ± 4.10%) (Figure 2). However, the mean DOC/TOC (1.68 ± 0.80%) and AP/TP (18.52 ± 11.92%) ratios in Rougui gardens were significantly higher than those in Shuixian gardens (DOC/TOC = 1.02 ± 0.61%; AP/TP = 13.30 ± 13.57%), indicating greater P availability in Rougui tea garden soils (Figure 2).

3.2. Spectral Parameters and Composition of Soil DOM in Wuyi Rock Tea Gardens

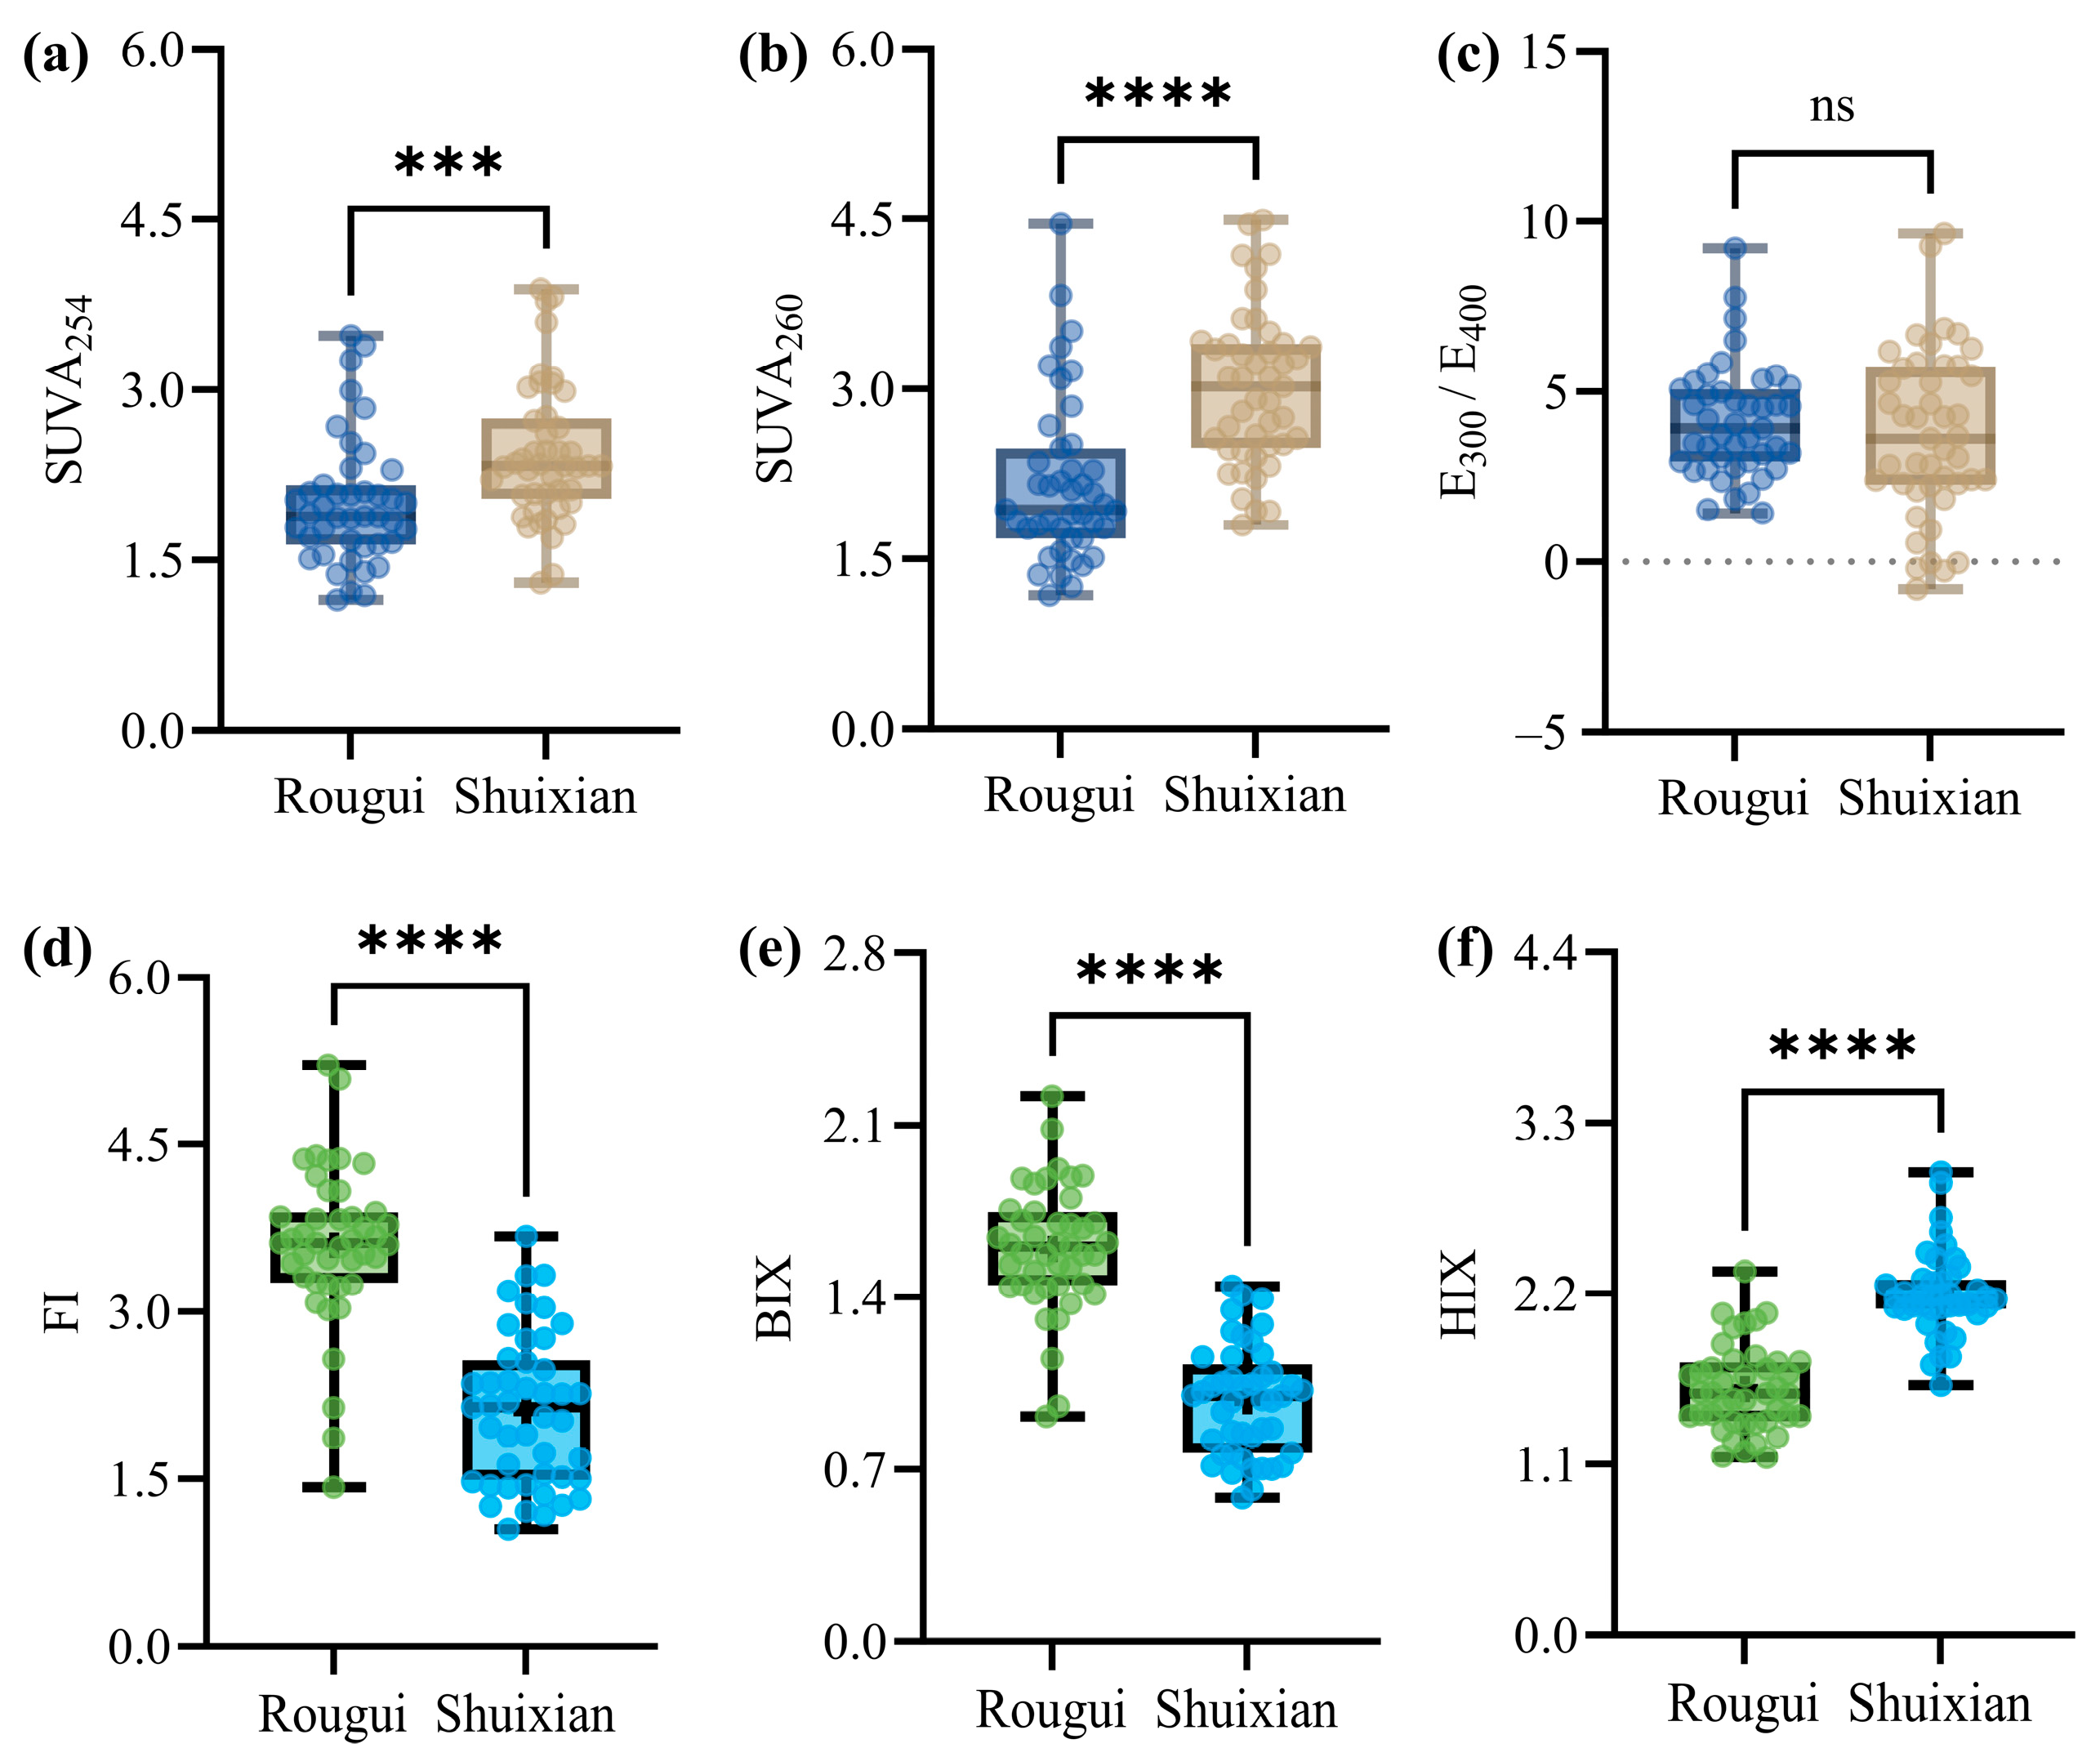
Among the UV–visible spectroscopic indices of DOM, the mean SUVA254 and SUVA260 values in Rougui tea garden soils were lower than those in Shuixian tea garden soils (Figure 3). The average E300/E400 ratio in the former group (4.12) was significantly higher than that in the latter (3.73) (Figure 3). In terms of the fluorescence spectroscopic indices, the FI and biological index (BIX) of Rougui tea garden soils (FI = 3.60 ± 0.71; BIX = 1.60 ± 0.26) were both higher than those of Shuixian tea garden soils (FI = 2.11 ± 0.68; BIX = 0.98 ± 0.22), whereas the humification index (HIX) of the former (1.59 ± 0.28) was lower than that of the latter (2.20 ± 0.27) (Figure 3).
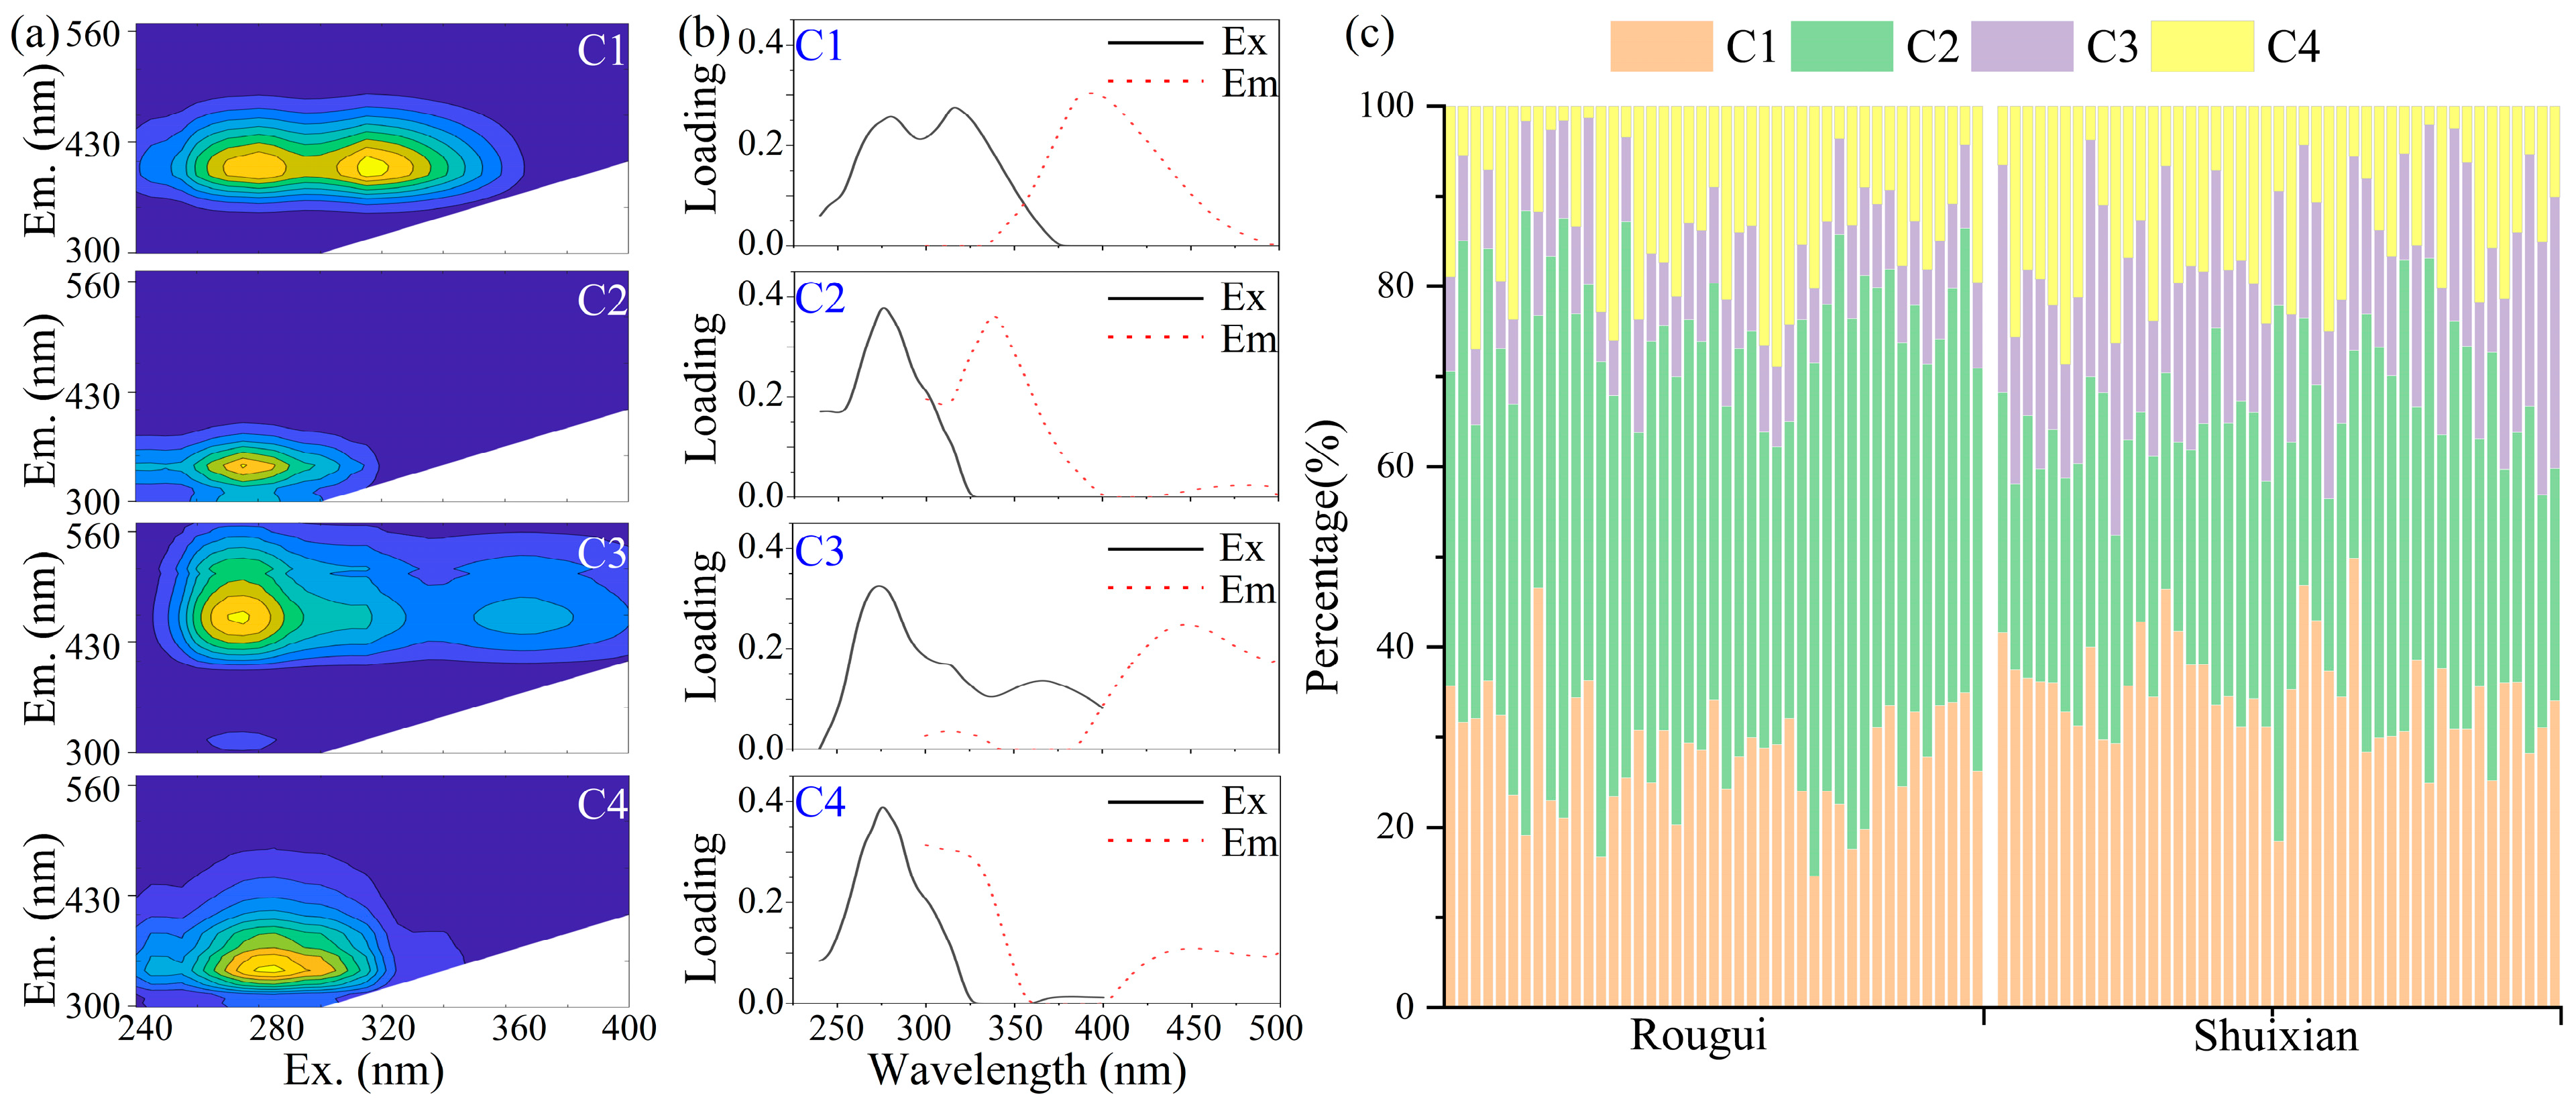
Four fluorescent components (C1–C4) of soil DOM were identified using PARAFAC modeling, as described in Section 2.3.2 (Figure 4a). The Ex/Em ratios of C1–C4 were 280, 315/390, 275/340, 275/450, and 280/340, respectively (Figure 4b). They had distinct distribution patterns for both cultivars (Figure 4c). In the Rougui tea garden soils, C2 was the dominant component, comprising 47.44 ± 9.46% of the total fluorescence, followed by C1 (28.13 ± 6.41%), C4 (14.48 ± 7.66%), and C3 (9.95 ± 2.15%). Conversely, in Shuixian tea garden soils, the relative abundance followed the sequence C1 (34.80 ± 5.99%) > C2 (31.79 ± 10.01%) > C3 (18.33 ± 4.50%) > C4 (15.08 ± 7.34%). Collectively, C1 and C2 represented the principal fluorescent constituents of soil DOM in the Wuyi Rock tea gardens.

3.3. Relationships Between Soil Nutrient Indices and DOM Characteristics

SOM, TN, and AN contents in the soils of both tea cultivars were positively correlated with the UV–visible spectral parameters (SUVA254, SUVA260, and E300/E400) (p < 0.05) (Figure 5a,b). These nutrient indices were negatively correlated with the DOC/TOC ratio in the Rougui soils (p < 0.05) (Figure 5a). In the Shuixian soils, the DOC/TOC ratio exhibited a significant positive relationship with the AP/TP ratio (Figure 5b). In the Rougui soils, the C/N, C/P, and N/P ratios exhibited positive correlations of varying degrees with SUVA254 and component C3, with C/P and N/P showing higher significance levels and larger correlation coefficients (Figure 5a). In Shuixian soils, both total and available nutrient contents were positively correlated with DOC concentration (Figure 5b). Moreover, the C/P and N/P ratios in these soils were significantly and positively correlated with SUVA254 and C3 (Figure 5b). pH, altitude, and tree age had weak overall correlations with DOM content and component indices (Figure 5).
RDA effectively quantified the explanatory power of soil nutrients on DOM quantity and quality in the two tea-cultivar gardens; the first two axes together explained over 70% of the total variation (Figure 6). Among all nutrient indices, SOM was the dominant predictor, accounting for over 30% of the variation (p = 0.002). Additionally, AN and the N/P ratio each explained approximately 10% of the variation in the Rougui soils. In Shuixian soils, the C/P, TN, and AP ratios explained 20.3%, 11.7%, and 5.8% of the variation, respectively. pH, altitude, and tree age contributed negligibly (<1%) to DOM across the Wuyi Rock tea gardens.

4. Discussion

4.1. Stoichiometric Characteristics of Soil Nutrients in Wuyi Rock Tea Gardens

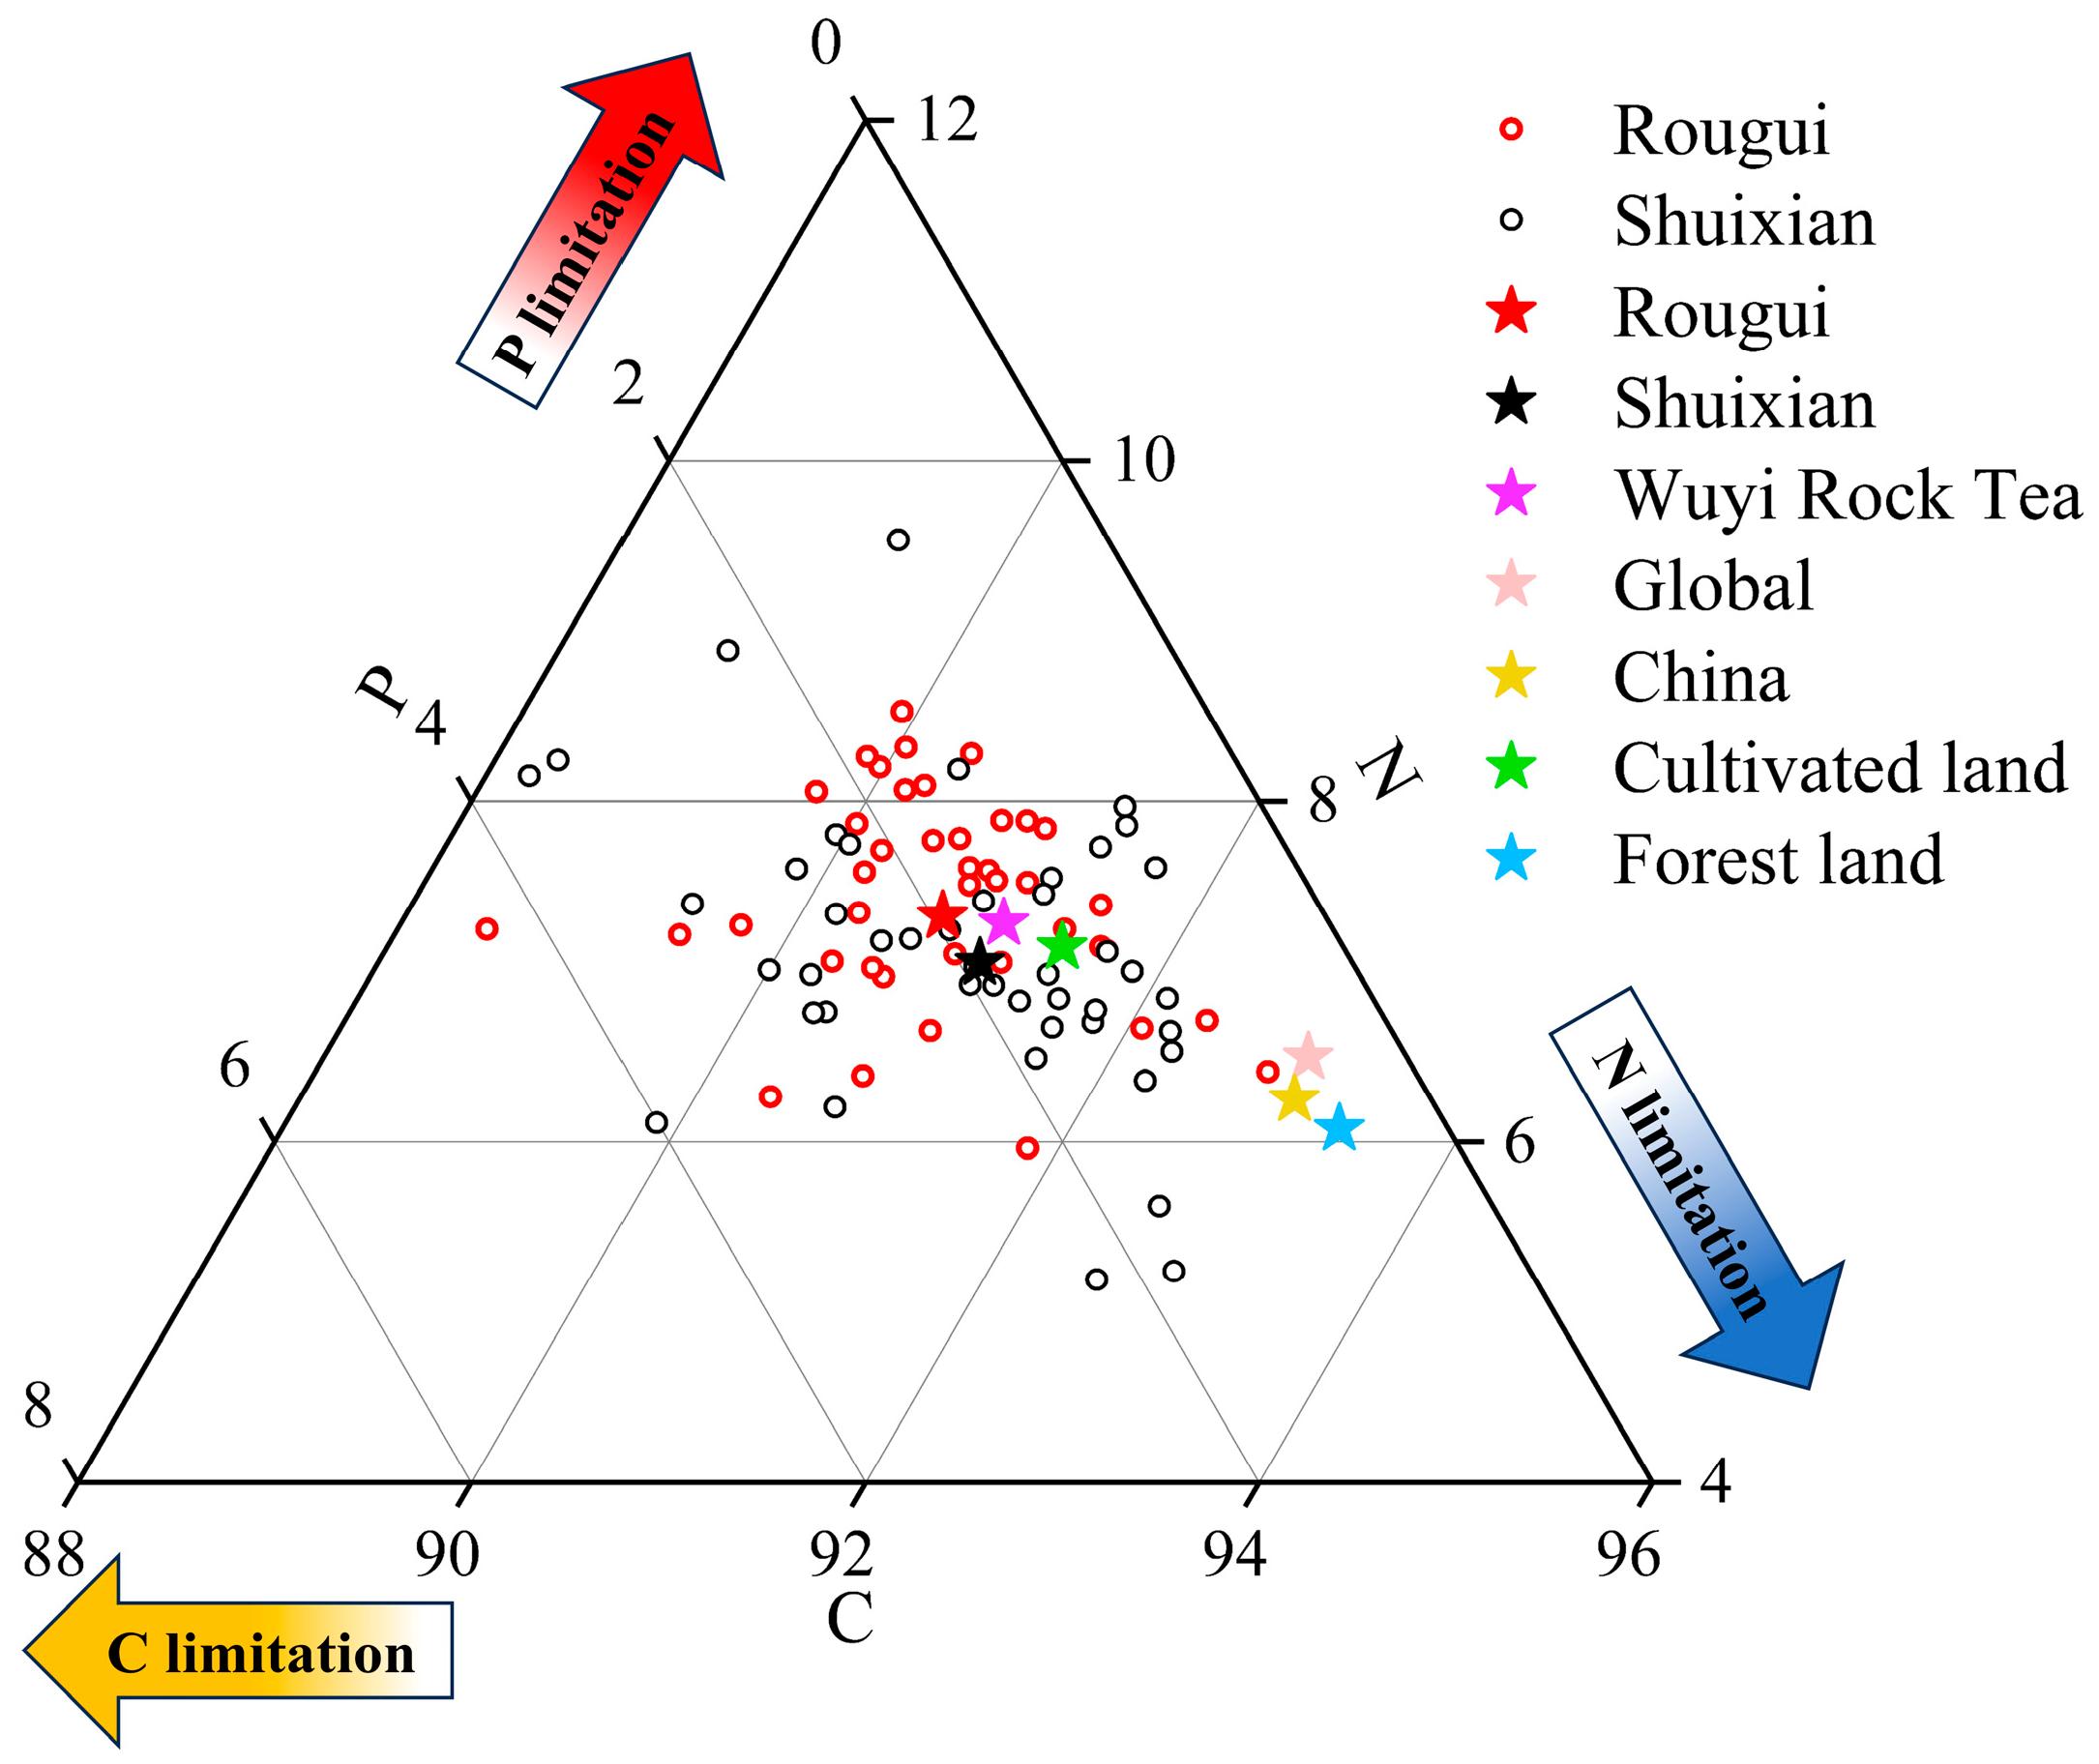
The stoichiometry of soil nutrients is shaped by land-use type, geographic position, and climatic conditions [21,35,36]. In the present study, the mean soil C/N/P ratio of the Wuyi Rock tea gardens was 55/4.4/1 (Figure 7), which was markedly lower than the global soil average of 186/13/1 [37] and the Chinese average of 134/9/1 [29]. This ratio is close to the global cropland average of 64/5/1 [38]. It exceeds that of high-latitude tea-growing regions (e.g., 31/3.3/1 in Shaanxi Province) [39] but is substantially below the tropical/subtropical forest average of 169/11/1 [38]. The relative abundance of soil P directly decreases the C/N/P ratio, with C/P and N/P being particularly responsive [12]. Low C/P and N/P ratios accelerate the decomposition and mineralization of SOM and raise available nutrient concentrations [21], explaining why the mean AN, AP, and AK in the studied tea gardens already meet the criteria for high-yield tea soils (AN ≥ 100 mg·kg−1, AP ≥ 20 mg·kg−1, AK ≥ 100 mg·kg−1) [40]. Enhanced nutrient availability favors competitive microbial taxa; however, narrow C/N and C/P ratios can reduce niche dimensionality and ultimately diminish soil biodiversity [13]. In particular, shifts in the C/P ratio are a primary driver of biodiversity loss and the decoupling of biodiversity–stability relationships in agricultural soils [13]. As soil acidification in tea gardens proceeds, fertilizer inputs, especially P, should be controlled to prevent a linear decline in C/N and C/P ratios. Increasing the application of organic amendments can alleviate microbial C limitations [27,28].
Long-term N fertilization markedly lowers soil pH in tea gardens (0.05–0.08 units yr−1) [41], while simultaneously enhancing soil C sequestration and promoting N accumulation and translocation, thereby increasing SOM and AN contents [14,21]. Conversely, the stoichiometry of soil nutrients plays a critical role in regulating microbial adaptation to soil acidification and nutrient availability [28]. Rougui garden soils have a pH of nearly 0.5 units higher than that of Shuixian soils (Table S1), which promotes microbial activity and the release of P and K from their respective pools [1,42]. This accounts for the significantly higher DOC, AP, and AK contents (Table S1) and elevated DOC/TOC and AP/TP ratios observed in the Rougui soils (Figure 2). In contrast, Shuixian tea garden soils had slightly higher contents of C, N, P, and AN (Table S1), and a higher C/P ratio (Figure 2). Differences in litter composition and root exudates among tea cultivars [23] create distinct nutrient demands and stoichiometric responses. Therefore, a deeper exploration of the stoichiometric characteristics and underlying mechanisms across cultivar-specific tea gardens is essential for refining fertilization management.

4.2. Composition and Origin of DOM in Wuyi Rock Tea Soils

Across the studied tea gardens, the DOC/TOC ratios ranged from 0.3% to 3.5% (Figure 2). Within the DOM pool, four fluorescent components were identified (Figure 4a,b). The first was C1, a fulvic-like fraction (“C” peak) [4,43], which was hydrophilic with a relatively low degree of humification [44]. The second, C2, a microbial tyrosine-like component (“D” peak) [10,30] was characterized by low-molecular-weight and strong hydrophobicity [32]. The third, C3, a humic-like component (“A” peak) [1,4], represented a high-molecular-weight fraction rich in aromatic moieties and strongly hydrophobic [11]. Finally, C4, a tryptophan-like component (“T” peak) [4,30], displayed a low-molecular-weight and pronounced hydrophobicity [6]. Components C1 and C3 were humic-like and reflected terrigenous organic inputs [4,11], whereas C2 and C4 were protein-like fractions of autochthonous origin with high bioavailability [7]. Overall, the DOM in tea garden soils was dominated by fulvic-like and tyrosine-like substances (Figure 4c), indicating a mixed source of terrestrial and microbial origins.
In the studied tea garden soils, the humic fraction is dominated by fulvic-like substances (E300/E400 ≥ 3.5), with overall low humification (HIX < 4), low aromaticity, and a high proportion of hydrophobic moieties (SUVA254, SUVA260 < 3) (Figure 3). Active microbial activity is evidenced by BIX values > 0.8, and the autochthonous contribution exceeds the allochthonous input (FI ≥ 1.9). These characteristics are consistent with previous findings in tea gardens in Huangshan City, China, where DOM exhibited low humification and a strong autochthonous signature [33]. Published studies have indicated that the degradability of DOM components decreases in the following order: tyrosine > tryptophan > fulvic acid > protein > humic acid [8]. Tea leaves are rich in secondary metabolites, such as polyphenols, alkaloids, amino acids, carbohydrates, and organic acids [45]. Compared to more highly humified forest soils [46], tea garden soils contain a greater proportion of fulvic-like (C1) and protein-like (C2 + C4) fractions, and a smaller proportion of humic-like (C3) substances. This, to a certain extent, reflects the stimulatory effects of cultivation and fertilization on soil microbial activity [47]. Therefore, under specific soil conditions in tea plantations, the combined influence of anthropogenic management (fertilization, tillage) and microbial activities results in DOM characterized by a simple structure, high decomposability, notable autochthonous contributions, and low humification levels.
In contrast, DOM in the Rougui tea garden soils was dominated by the tyrosine-like C2 component (Figure 4c) and exhibited higher E300/E400, FI, and BIX values (Figure 3), whereas DOM in Shuixian soils contained a larger proportion of the C3 component (Figure 4c) and showed higher SUVA254, SUVA260, and HIX values (Figure 3). These patterns indicate that microbial activity is more vigorous, and organic matter turnover is faster in Rougui soils [6,11], whereas DOM in Shuixian soils is more aromatic, hydrophobic, and humified. Thus, the composition and origin of DOM differed markedly between the two cultivar-specific tea gardens. The underlying cause may be two-fold. First, the quantity and composition of low-molecular-weight organic acids, such as oxalic, tartaric, and succinic acids, in leaf litter and root exudates differ between cultivars [23,48,49] and are readily transformed into fulvic-like substances [20]. Second, cultivar-dependent differences in soil microbial community composition influence nutrient supply and theanine biosynthesis in tea plants [22,24,25]. Indeed, UPLC-Q-TOF-MS analyses have shown that Rougui, a high-theanine cultivar, accumulates more theanine in its leaves than Shuixian [22]. Consequently, cultivar identity modulates the interactions among litter, root exudates, and microbes, thereby shaping soil DOM properties and tea quality.

4.3. Response of DOM Composition to Nutrient Stoichiometry in Wuyi Rock Tea Soils

Nutrient stoichiometry is a key indicator of the balance between nutrient supply and utilization in ecosystems [12]. The low soil C/N/P ratios observed in the study area (Figure 7), together with the predominantly autochthonous DOM components (Figure 4), indicate intense microbial decomposition. This accelerates SOM mineralization and may release more available nutrients (AN, AP, and AK), which may in turn shape DOM composition [12,39]. However, SEM results show that these available nutrients exert no significant effect (p > 0.05) on either the quantity or the compositional characteristics of DOM in the tea garden soils (Figure S1). It is widely accepted that SOM mineralization is governed by the interplay between biotic (primarily enzymatic) and abiotic drivers (e.g., temperature, moisture, and mineralogy) [6,50]. Microbial communities play a relatively passive role in DOM production when large amounts of fresh SOM are added, whereas abiotic factors are dominant [6]. Under such conditions, up to 70% of DOM generated through abiotic processes originates from already humified SOM [51]. In our tea gardens, SOM exhibited significant positive correlations with the UV–visible spectral characteristics of DOM (Figure 5) and was the primary contributor to the variations in DOM composition (Figure 6). These results suggest that SOM likely exerts a direct influence on the aromatic and hydrophobic humic-like fractions of DOM. The SEM results (Figure S1) further corroborate this inference, indicating a significant path effect (β > 0.6, p < 0.001) from soil nutrient contents (SOM, TN, and TP) to the ultraviolet–visible spectral parameters of DOM.
The soil C/N ratio is a key indicator of SOM quality [13]. In the studied tea garden soils, C/N ranged from 9 to 18, implying that SOM originated primarily from terrestrial humic substances (C:N = 12–30) [52,53] and microbial biomass (C:N = 5–8) [54], with only minor contributions from plant tissues and litter (C:N = 20–200) [53]. In contrast, DOM in these soils was predominantly autochthonous (Figure 4). The abundance of tryptophan-like DOM is positively correlated with microbial extracellular leucine aminopeptidase activity, which facilitates the microbial uptake of soil C and N [30]. This partly explains why the C/N ratio was positively correlated with the C1 (fulvic-like) fraction and SUVA260 (a hydrophobicity proxy) but negatively correlated with the C4 (tryptophan-like) fraction (Figure 5). Variations in C:N:P ratios, particularly changes in C/P ratios, are often represent the primary driving factors of soil biodiversity loss and the decoupling of biodiversity–stability relationships at local and regional scales [13,55]. In the tea garden soils, the C/P and N/P ratios showed highly significant positive correlations with the C3 (humic-like) fraction and SUVA254 (an aromaticity proxy) (Figure 5). This was also reflected in the SEM results (Figure S1), which indicate that soil stoichiometric ratios, particularly C/P and N/P, exert a highly significant (p < 0.001) positive effect on the terrestrial humic-like fractions of DOM (as indicated by ultraviolet–visible spectral parameters and the C3 component), while significantly decreasing (p < 0.05) the autochthonous tryptophan-like content (C4). Given the wide diversity of DOM components, their biodegradability and bioavailability vary significantly [5]. Rhizosphere microbes preferentially utilize the most labile DOM fractions and, by immobilizing N, solubilizing P, and mobilizing K, enhance the availability of key nutrients [45], thereby influencing the size, stability, and stoichiometry of nutrient pools [13,55]. Thus, soil nutrient stoichiometry and DOM composition were tightly coupled in the tea garden ecosystems, confirming our first hypothesis.
According to the RDA contribution rates, the N/P ratio explained 9.6% of the variation in DOM composition in Rougui gardens, whereas the C/P ratio explained 20.3% in Shuixian gardens (Figure 6). Relative to Rougui, Shuixian soils exhibited a higher SOM content (Table S1) and C/P ratio (Figure 2) but a lower DOC/TOC ratio (Figure 2) and greater DOM humification, indicating a more complex and stable DOM structure (Figure 3). In the SEM results (Figure S1), the stoichiometric ratios of the Rougui tea garden soil exhibited a stronger influence on DOM components (p < 0.001) than those of the Shuixian tea garden soil (p < 0.01), indicating that DOM composition in the Rougui site is more sensitive to changes in the C/N/P ratio. DOM plays a pivotal role in regulating SOM bioavailability [56,57]. Under conventional tillage and fertilization practices, different tea cultivars exert distinct priming effects on soil nutrients [47], thereby influencing SOM mineralization and DOM bioavailability [46]. Consequently, the coupling between soil C/N/P stoichiometry and DOM characteristics varied among the tea genotypes, confirming our second hypothesis.

4.4. Limitations and Suggestions

Soil DOM exhibits inherently highly spatiotemporal variability [8,11]. In the present study, random sampling was conducted across two major tea-cultivar plantations located in Wuyishan City. However, the limited sample size, lack of detailed records on climate, vegetation cover, tillage and fertilization practices, and the single-season sampling campaign may serve as a bottleneck for a comprehensive understanding of DOM quantity and compositional dynamics. Nevertheless, the observed general trends in soil DOM content and its spectroscopic fractions provide a valuable reference. Overall, the standardized path coefficients from available soil nutrients to either DOM concentration or its optical fractions were all <0.5, with most approaching zero and lacking statistical significance (p > 0.05) (Figure S1), indicating that available nutrients are not the primary drivers of DOM characteristics. Although soil nutrient contents and their stoichiometric ratios contributed minimally to the variance in DOM quantity (R2 < 0.25), they markedly influenced the variance in DOM composition (0.75 ≤ R2) (Figure S1). Climate variability and site-specific management practices (e.g., cultivation and fertilization) jointly regulate DOM pools in tea gardens [1,30]. Therefore, future studies should aim to optimize sampling designs by expanding surveys to encompass multiple regions, cultivars, seasonal cycles, quantified fertilization regimes and vegetation covers, thereby minimizing potential sampling bias [58].
Given the tight coupling between soil nutrient stoichiometry and DOM characteristics in tea gardens, we propose that a scientifically balanced combination of chemical and organic fertilizers be applied to modulate soil N/P and C/P ratios. This approach has the potential to simultaneously enhance DOM bioavailability or promote soil C and nutrient sequestration [2], with potential downstream effects on tea quality. Microbial mineralization is the primary pathway for DOM degradation and directly affects the global C cycle [59,60]. In soil C sequestration initiatives focusing solely on C increment risk misinterpretation, long-term efficacy requires equal attention to C stability [55]. Therefore, future studies should incorporate the microbial carbon pump concept [55,57] and integrate molecular-level DOM characterization [61] with soil microbial functional genes [45] to elucidate the mechanisms by which tea genotypes modulate microbially derived C fluxes (inputs and outputs), ultimately affecting both tea yield and quality.

5. Conclusions

Our study provides novel insights by comparing the relationships between DOM components and nutrient stoichiometric ratios in the soils of Rougui and Shuixian tea gardens in Wuyi Rock tea-producing areas. The DOM was dominated by fulvic-like and tyrosine-like fractions, with an autochthonous contribution exceeding terrigenous input and an overall low level of humification. Variations in DOM composition and source characteristics were strongly governed by SOM quality and degree of humification. Soil C/N/P ratios positively influenced terrigenous, humic-like DOM fractions, while exerting a negative effect on autochthonous, protein-like fractions. DOM in Rougui soils displayed higher biodegradability and was primarily constrained by the N/P ratio, whereas the DOM in Shuixian soils was more aromatic, hydrophobic, and humified and was more strongly regulated by the C/P ratio. Therefore, fertilization regimes should be tailored to each cultivar to optimize soil C/N/P stoichiometry and DOM characteristics, thereby preventing a shift toward C limitation. It is recommended that future research should incorporate microbial-level mechanisms, long-term fertilization experiments, and cross-regional, seasonal, or multi-cultivar comparisons. These findings provide a comprehensive perspective on the complex coupling between nutrient stoichiometry and DOM composition, offering a scientific basis for nutrient-cycling management in tea gardens having tea plants of different genotypes and enhancing the sustainability of tea garden−ecology coupled systems. This also provides a key reference for studies on soil nutrient cycling and precision-fertilization strategies in agricultural lands in other contexts.

Supplementary Materials

The following supporting information can be downloaded at: https://www.mdpi.com/article/10.3390/agronomy15112449/s1. Table S1: Distribution of soil nutrient content in 88 samples from Wuyi Rock tea gardens in Wuyishan City. Figure S1: SEMs showing the effects of nutrient content and stoichiometric ratios on the content, ultraviolet–visible (UV–vis) spectral parameters (SUVA254, SUVA260, E300/E400) and components (C1–C4) of dissolved organic matter (DOM) in the soil from 88 Wuyi Rock tea gardens in Wuyishan City. (a) Rougui (n = 43) and (b) Shuixian (n = 45), where SOM, TN, TP, and DOC represent soil organic matter, total nitrogen, total phosphorus, and dissolved organic carbon, respectively; AN, AP, and AK represent alkaline nitrogen, available phosphorus, and available potassium, respectively. The red and black arrows indicate positive and negative effects, respectively. The numbers adjacent to the arrows are standardized path coefficients, and the arrow widths are proportional to the magnitude of these coefficients. R2 denotes the proportion of explained variance. Significance levels for each predictor are * p < 0.05, ** p < 0.01, *** p < 0.001.

Author Contributions

Conceptualization, H.Y. and M.H.; methodology, H.Y., M.H. and A.S.; software, H.Y., M.H. and A.S.; validation, H.Y., M.H. and A.S.; formal analysis, H.Y.; investigation, H.Y., Y.L. and Y.Z.; resources, H.Y.; data curation, H.Y., M.H. and A.S.; writing—original draft preparation, H.Y.; writing—review and editing, H.Y.; visualization, H.Y., A.S. and Y.L.; supervision, H.Y.; project administration, H.Y.; funding acquisition, H.Y. All authors have read and agreed to the published version of the manuscript.

Funding

This research and APC was funded by the Natural Science Foundation of Fujian Province, China (Grant number 2024I0030), and Natural Science Foundation of Nanping, China (Grant number N2023J005).

Data Availability Statement

The original contributions presented in the study are included in the article/Supplementary Material; further inquiries can be directed to the corresponding author.

Acknowledgments

The authors express their gratitude and appreciation to all staff members involved in the collection and processing of soil samples in this research. The authors also thank Haiyan Zhang for their technical support during the data survey and analysis. The authors acknowledge the Quark software for its support in the AI-assisted creation of the graphical abstract.

Conflicts of Interest

The authors declare no conflicts of interest.

Abbreviations

The following abbreviations are used in this manuscript:
DOMDissolved organic matter
CCarbon
TOCTotal organic carbon
SOMSoil organic matter
NNitrogen
ANAlkali-hydrolysable nitrogen
PPhosphorus
APAvailable phosphorus
AKAvailable potassium
EEMsExcitation–emission matrices
ExExcitation
EmEmission
FIFluorescence index
HIXHumification index
BIXBiological index
PARAFACParallel factor

References

  1. Azeem, M.; Wang, J.; Kubwimana, J.J.; Kazmi, S.S.H.; Khan, Z.H.; He, K.; Han, R. Biochar-derived dissolved organic matter (BDOM) shifts fungal community composition: BDOM-soil DOM interaction. Appl. Soil Ecol. 2025, 207, 105916. [Google Scholar] [CrossRef]
  2. Mou, Z.; Hao, Y.; Chen, X.; Wang, T.; Turner, B.L.; Kandeler, E.; Lambers, H.; Liu, Z. Climate and pedogenesis exert divergent controls on dissolved organic matter during long-term ecosystem development. Catena 2025, 254, 109004. [Google Scholar] [CrossRef]
  3. Filep, T.; Zacháry, D.; Jakab, G.; Szalai, Z. Chemical composition of labile carbon fractions in Hungarian forest soils: Insight into biogeochemical coupling between DOM and POM. Geoderma 2022, 419, 115867. [Google Scholar] [CrossRef]
  4. Gao, Z.; Shi, P.; Min, Z.; Li, Z.; Li, P.; Li, Z. Spatiotemporal dynamics of river dissolved organic matter in small watershed with vegetation restoration on the Loess Plateau. Catena 2025, 259, 109357. [Google Scholar] [CrossRef]
  5. Liu, D.; Bai, M.; Yan, X.; Song, Y.; Yang, F.; Qian, F.; Yu, H. Applying EEM spectra with absolute principal component coefficients to explore characteristic fingerprints and fractions of DOM from diverse land-use soils in a large-scale irrigation area. Catena 2024, 238, 107903. [Google Scholar] [CrossRef]
  6. Ding, Y.; Shi, Z.; Ye, Q.; Liang, Y.; Liu, C. Chemodiversity of soil dissolved organic matter. Environ. Sci. Technol. 2022, 54, 6174–6184. [Google Scholar] [CrossRef]
  7. Peng, Y.; Fan, Z.; Wang, Z.; Zhang, Z.; Yan, Y.; Shi, J.; Huo, C.; Wang, X. Erosion-driven vertical decoupling: Molecular signatures of dissolved organic matter and microbial coevolution in subsoil hotspots. Environ. Sci. Technol. 2025, 59, 15792–15802. [Google Scholar] [CrossRef]
  8. Li, W.; Li, X.; Han, C.; Gao, L.; Wu, H.; Li, M. A new view into three-dimensional excitation-emission matrix fluorescence spectroscopy for dissolved organic matter. Sci. Total Environ. 2023, 855, 158963. [Google Scholar] [CrossRef] [PubMed]
  9. Ye, Q.; Wang, Y.; Zhang, Z.; Huang, W.; Li, L.; Li, J.; Liu, J.; Zheng, Y.; Mo, J.; Zhang, W.; et al. Dissolved organic matter characteristics in soils of tropical legume and non-legume tree plantations. Soil Biol. Biochem. 2020, 148, 107880. [Google Scholar] [CrossRef]
  10. Gao, J.; Liang, C.; Shen, G.; Lv, J.; Wu, H. Spectral characteristics of dissolved organic matter in various agricultural soils throughout China. Chemosphere 2017, 176, 108–116. [Google Scholar] [CrossRef]
  11. Zhang, R.; Li, M.; Gao, X.; Duan, Y.; Cai, Y.; Li, H.; Zhao, X.; Wang, Y. Changes in the characteristics of soil dissolved organic matter over time since inter-planting with white clover (Trifolium repens L.) in apple orchards on the Loess Plateau in China. Plant Soil 2024, 499, 293–310. [Google Scholar] [CrossRef]
  12. Ye, H.; Tang, F.; Zhang, H.; Chen, Y.; Huang, L.; Hu, J.; Huang, C.; Huang, T. Stoichiometric insights into sediment carbon, nitrogen, and phosphorus deposition in small forest reservoirs in southeast China under forest conversion and climate change. Catena 2025, 250, 108741. [Google Scholar] [CrossRef]
  13. Qi, X.; Hu, Z.; Li, X.; Wang, D.; Xu, C.; Hu, F.; Chen, X.; Liu, M. Land-use driven changes in elemental stoichiometry decouple the positive soil biodiversity-stability relationship. Soil Biol. Biochem. 2025, 209, 109907. [Google Scholar] [CrossRef]
  14. Hou, P.; Li, B.; Cao, E.; Liu, Z.; Li, Y.; Sun, Z.; Xiao, Y.; Ma, C. Optimizing nitrogen and phosphorus fertilizer application for wheat yield on alkali soils: Mechanisms and effects. Agronomy 2025, 15, 734. [Google Scholar] [CrossRef]
  15. Aumtong, S.; Chotamonsak, C.; Pongwongkam, P.; Cantiya, K. Chemical fertilization alters soil carbon in paddy soil through the interaction of labile organic carbon and phosphorus fractions. Agronomy 2023, 13, 1588. [Google Scholar] [CrossRef]
  16. Mehnaz, K.R.; Corneo, P.E.; Keitel, C.; Dijkstra, F.A. Carbon and phosphorus addition effects on microbial carbon use efficiency, soil organic matter priming, gross nitrogen mineralization and nitrous oxide emission from soil. Soil Biol. Biochem. 2019, 134, 175–186. [Google Scholar] [CrossRef]
  17. Sun, X.; Deng, C.; Gao, J.; Lu, J.; Zheng, Y.; Guo, Z.; Sun, Y.; Wang, C.; Deng, Y. Fertilizer types and nitrogen rates integrated strategy for achieving sustainable quinoa yield and dynamic soil nutrient-water distribution at high altitude. Sci. Rep. 2025, 15, 5599. [Google Scholar] [CrossRef]
  18. Aumtong, S.; Foungyen, P.; Kanchai, K.; Chuephudee, T.; Chotamonsak, C.; Lapyai, D. Impact of reduced nitrogen inputs on soil organic carbon and nutrient dynamics in arable soil, northern Thailand: Short-term evaluation. Agronomy 2024, 14, 2587. [Google Scholar] [CrossRef]
  19. Liao, J.; Dou, Y.; Wang, B.; Gunina, A.; Yang, Y.; An, S.; Chang, S.X. Soil stoichiometric imbalances constrain microbial-driven C and N dynamics in grassland. Sci. Total Environ. 2024, 924, 171655. [Google Scholar] [CrossRef] [PubMed]
  20. Guo, S.; Liang, Y.; Ye, H.; Ye, Y.; Zhang, J.; Wang, Q.; Shi, A. Spectral characteristics of dissolved organic matter in tea garden soil. Environ. Chem. 2025, 44, 3100–3109. (In Chinese) [Google Scholar] [CrossRef]
  21. Wang, D.; Liu, B.; Li, F.; Wang, Z.; Hou, J.; Cao, R.; Zheng, Y.; Yang, W. Status and influential factors of soil nutrients and acidification in Chinese tea plantations: A meta-analysis. Soil 2025, 11, 175–191. [Google Scholar] [CrossRef]
  22. Xin, W.; Zhang, J.; Yu, Y.; Tian, Y.; Li, H.; Chen, X.; Li, W.; Liu, Y.; Lu, T.; He, B.; et al. Root microbiota of tea plants regulate nitrogen homeostasis and theanine synthesis to influence tea quality. Curr. Biol. 2024, 34, 868–880.e866. [Google Scholar] [CrossRef] [PubMed]
  23. Zhu, D.; Peng, S.; Liu, W.; Yu, S.; Hui, D. Nutrient resorption and stoichiometric characteristics of Wuyi Rock Tea cultivars. Forests 2023, 14, 675. [Google Scholar] [CrossRef]
  24. Kamau, D.M.; Spiertz, J.H.J.; Oenema, O. Carbon and nutrient stocks of tea plantations differing in age, genotype and plant population density. Plant Soil 2008, 307, 29–39. [Google Scholar] [CrossRef]
  25. Xing, S.; Chen, C.; Zhang, H.; Zhou, B.; Nang, Z.; Xu, Z. Genotype and slope position control on the availability of soil soluble organic nitrogen in tea plantations. Biogeochemistry 2011, 103, 245–261. [Google Scholar] [CrossRef]
  26. Yan, X.; Yang, W.; Chen, X.; Wang, M.; Wang, W.; Ye, D.; Wu, L. Soil phosphorus pools, bioavailability and environmental risk in response to the phosphorus supply in the red soil of southern China. Int. J. Environ. Res. Public Health 2020, 17, 7384. [Google Scholar] [CrossRef]
  27. Ye, H.; Hu, Y.; Zhu, D.; Zheng, S.; Tang, X.; Wu, J.; Guo, S. Effects of forest conversion on the stocks and stoichiometry of soil carbon, nitrogen, and phosphorus at a county scale in subtropical China. Forests 2024, 15, 1515. [Google Scholar] [CrossRef]
  28. Li, T.; Wang, R.; Cai, J.; Meng, Y.; Wang, Z.; Feng, X.; Liu, H.; Turco, R.F.; Jiang, Y. Enhanced carbon acquisition and use efficiency alleviate microbial carbon relative to nitrogen limitation under soil acidification. Ecol. Process. 2021, 10, 32. [Google Scholar] [CrossRef]
  29. Tian, H.; Chen, G.; Zhang, C.; Melillo, J.M.; Hall, C.A.S. Pattern and variation of C:N:P ratios in China’s soils: A synthesis of observational data. Biogeochemistry 2010, 98, 139–151. [Google Scholar] [CrossRef]
  30. An, L.; Zheng, Z.; Li, T.; He, S.; Zhang, X.; Wang, Y.; Huang, H.; Yu, H.; Ye, D. Quantity and quality characteristics of DOM loss in sloping cropland under natural rainfall in southwestern China. Catena 2024, 240, 108000. [Google Scholar] [CrossRef]
  31. Li, T.; Song, F.; Zhang, J.; Liu, S.; Feng, W.; Zuo, L.; Pu, J.; Xing, B.; Giesy, J.P.; Bai, Y. Investigation of eluted characteristics of fulvic acids using differential spectroscopy combined with gaussian deconvolution and spectral indices. Environ. Sci. Pollut. Res. 2020, 27, 11000–11011. [Google Scholar] [CrossRef] [PubMed]
  32. Fellman, J.B.; Hood, E.; Spencer, R.G.M. Fluorescence spectroscopy opens new windows into dissolved organic matter dynamics in freshwater ecosystems: A review. Limnol. Oceanogr. 2010, 55, 2452–2462. [Google Scholar] [CrossRef]
  33. Yao, Y.; Li, J.; Ma, K.; Zhang, J.; Lin, Y.; Tan, H.; Yu, J.; Fang, F. Characteristics of dissolved organic matter (DOM) combined with as in Fe-rich red soils of tea plantations in the southern Anhui Province, east China. Agriculture 2024, 14, 2289. [Google Scholar] [CrossRef]
  34. Schmidt, T.S.; Van Metre, P.C.; Carlisle, D.M. Linking the agricultural landscape of the midwest to stream health with structural equation modeling. Environ. Sci. Technol. 2019, 53, 452–462. [Google Scholar] [CrossRef] [PubMed]
  35. Chen, Y.; Li, Y.; Duan, Y.; Wang, L.; Wang, X.; Yao, C.; Chen, Y.; Cao, W.; Niu, Y. Patterns and driving factors of soil ecological stoichiometry in typical ecologically fragile areas of China. Catena 2022, 219, 106628. [Google Scholar] [CrossRef]
  36. Zheng, S.; Xia, Y.; Hu, Y.; Chen, X.; Rui, Y.; Gunina, A.; He, X.; Ge, T.; Wu, J.; Su, Y.; et al. Stoichiometry of carbon, nitrogen, and phosphorus in soil: Effects of agricultural land use and climate at a continental scale. Soil Tillage Res. 2021, 209, 104903. [Google Scholar] [CrossRef]
  37. Cleveland, C.C.; Liptzin, D. C:N:P. stoichiometry in soil: Is. there a “Redfield ratio” for the microbial biomass? Biogeochemistry 2007, 85, 235–252. [Google Scholar] [CrossRef]
  38. Xu, X.; Thornton, P.E.; Post, W.M. A global analysis of soil microbial biomass carbon, nitrogen and phosphorus in terrestrial ecosystems. Glob. Ecol. Biogeogr. 2013, 22, 737–749. [Google Scholar] [CrossRef]
  39. Niu, Z.; Zhang, Y.; Han, J.; Zhao, Y.; Zhu, X.; He, P. The soil ecological stoichiometry characteristics of the highest latitude areas in the main tea-producing regions of China. Agronomy 2024, 14, 1359. [Google Scholar] [CrossRef]
  40. Luo, Z.; Ju, Y.; Chen, L.; Yang, X.; Long, Y.; Liu, X. Fertility assessment and risk management in tea plantations: Role of p-promoted metals’ availability. Agriculture 2025, 15, 953. [Google Scholar] [CrossRef]
  41. Yang, X.; Ni, K.; Shi, Y.; Yi, X.; Zhang, Q.; Fang, L.; Ma, L.; Ruan, J. Effects of long-term nitrogen application on soil acidification and solution chemistry of a tea plantation in China. Agric. Ecosyst. Environ. 2018, 252, 74–82. [Google Scholar] [CrossRef]
  42. Wang, H.; Chen, X.; Ding, L.; Ye, J.; Jia, X.; Kong, X.; He, H. Effect of soil acidification on yield and quality of tea tree in tea plantations from Anxi County, Fujian Province. Chin. J. Appl. Environ. Biol. 2018, 24, 1398–1403. (In Chinese) [Google Scholar] [CrossRef]
  43. Bai, Y.; Zhang, S.; Mu, E.; Zhao, Y.; Cheng, L.; Zhu, Y.; Yuan, Y.; Wang, Y.; Ding, A. Characterizing the spatiotemporal distribution of dissolved organic matter (DOM) in the Yongding River basin: Insights from flow regulation. J. Environ. Manag. 2023, 325, 116476. [Google Scholar] [CrossRef]
  44. Wang, M.; Chen, Y. Generation and characterization of DOM in wastewater treatment processes. Chemosphere 2018, 201, 96–109. [Google Scholar] [CrossRef] [PubMed]
  45. Tang, W.; Xin, W.; Xu, T.; Yang, Z. Tea plant microorganisms in the improvement of tea quality. Trends Microbiol. 2025, 33, 11–14. [Google Scholar] [CrossRef] [PubMed]
  46. Al-Graiti, T.; Jakab, G.; Ujházy, N.; Vancsik, A.; Fodor, N.; Árendás, T.; Madarász, B.; Barcza, Z.; Márialigeti, K.; Szalai, Z. The composition of dissolved organic matter in arable lands: Does soil management practice matter? Agronomy 2022, 12, 2797. [Google Scholar] [CrossRef]
  47. Lajtha, K.; Bowden, R.D.; Crow, S.; Fekete, I.; Kotroczó, Z.; Plante, A.; Simpson, M.J.; Nadelhoffer, K.J. The detrital input and removal treatment (DIRT) network: Insights into soil carbon stabilization. Sci. Total Environ. 2018, 640–641, 1112–1120. [Google Scholar] [CrossRef] [PubMed]
  48. Morita, A.; Yanagisawa, O.; Maeda, S.; Takatsu, S.; Ikka, T. Tea plant (Camellia sinensis L.) roots secrete oxalic acid and caffeine into medium containing aluminum. Soil Sci. Plant Nutr. 2011, 57, 796–802. [Google Scholar] [CrossRef]
  49. Zhao, Y.; Lin, J.; Cheng, S.; Wang, K.; Kumar, A.; Yu, Z.; Zhu, B. Linking soil dissolved organic matter characteristics and the temperature sensitivity of soil organic carbon decomposition in the riparian zone of the Three Gorges Reservoir. Ecol. Indic. 2023, 154, 110768. [Google Scholar] [CrossRef]
  50. Chen, H.; Yang, Z.; Chu, R.; Toliċ, N.; Liang, L.; Graham, D.; Wullschleger, S.; Gu, B. Molecular insights into Arctic soil organic matter degradation under warming. Environ. Sci. Technol. 2018, 52, 4555–4564. [Google Scholar] [CrossRef]
  51. Toosi, E.R. Soluble Organic Matter, It Biodegradation, Dynamics and Abiotic Production. Ph.D. Thesis, University of Canterbury, Christchurch, New Zealand, 2010. [Google Scholar] [CrossRef]
  52. Aitkenhead, J.A.; McDowell, W.H. Soil C:N ratio as a predictor of annual riverine DOC flux at local and global scales. Global Biogeochem. Cycles. 2000, 14, 127–138. [Google Scholar] [CrossRef]
  53. Sardans, J.; Rivas-Ubach, A.; Peñuelas, J. The C:N:P stoichiometry of organisms and ecosystems in a changing world: A review and perspectives. Perspect. Plant Ecol. Evol. Syst. 2012, 14, 33–47. [Google Scholar] [CrossRef]
  54. Vance, E.D.; Brookes, P.C.; Jenkinson, D.S. An extraction method for measuring soil microbial biomass C. Soil Biol. Bicohe. 1987, 19, 703–707. [Google Scholar] [CrossRef]
  55. Zhu, X.; Schimel, J.S.; Liang, C. Quantifying asynchrony between microbial necromass and soil organic carbon for sustainable soil carbon management. Soil Biol. Bicohe. 2025, 211, 109950. [Google Scholar] [CrossRef]
  56. Freeman, E.C.; Emilson, E.J.S.; Dittmar, T.; Braga, L.P.P.; Emilson, C.E.; Goldhammer, T.; Martineau, C.; Singer, G.; Tanentzap, A.J. Universal microbial reworking of dissolved organic matter along environmental gradients. Nat. Commun. 2024, 15, 187. [Google Scholar] [CrossRef] [PubMed]
  57. Shi, J.; Zhang, Z.; Zhang, Z.; Fan, Z.; Wang, X. Erosion-induced low carbon availability exacerbates carbon loss: Insights from microbial carbon allocation and the chemo-diversity of carbon. Catena 2025, 252, 108894. [Google Scholar] [CrossRef]
  58. Ye, H.; Zhang, H.; Shi, A.; Nie, R.; Liang, Y.; Hong, Y.; Cheng, X.; Huang, L.; Zhang, J. “Acceptable limits” criteria of potentially toxic elements in ecological tea garden soil and priority control sources identification. Ecotoxicol. Environ. Saf. 2025, 303, 118986. [Google Scholar] [CrossRef]
  59. McDowell, W.H. DOM in the long arc of environmental science: Looking back and thinking ahead. Biogeochemistry 2022, 164, 15–27. [Google Scholar] [CrossRef]
  60. Yang, X.; Zhang, Y.; Liu, Q.; Guo, J.; Zhou, Q. Progress in the interaction of dissolved organic matter and microbes (1991–2020): A bibliometric review. Environ. Sci. Pollut. Res. 2022, 29, 16817–16829. [Google Scholar] [CrossRef] [PubMed]
  61. Fang, W.; Jiao, X.; He, Q.; Wang, F.; Xiang, L.; Zhang, Y. Insights into the complexity of dissolved organic matter in different soils using ultrahigh-resolution ESI-FT-ICR mass spectrometry. Appl. Soil Ecol. 2024, 202, 105575. [Google Scholar] [CrossRef]
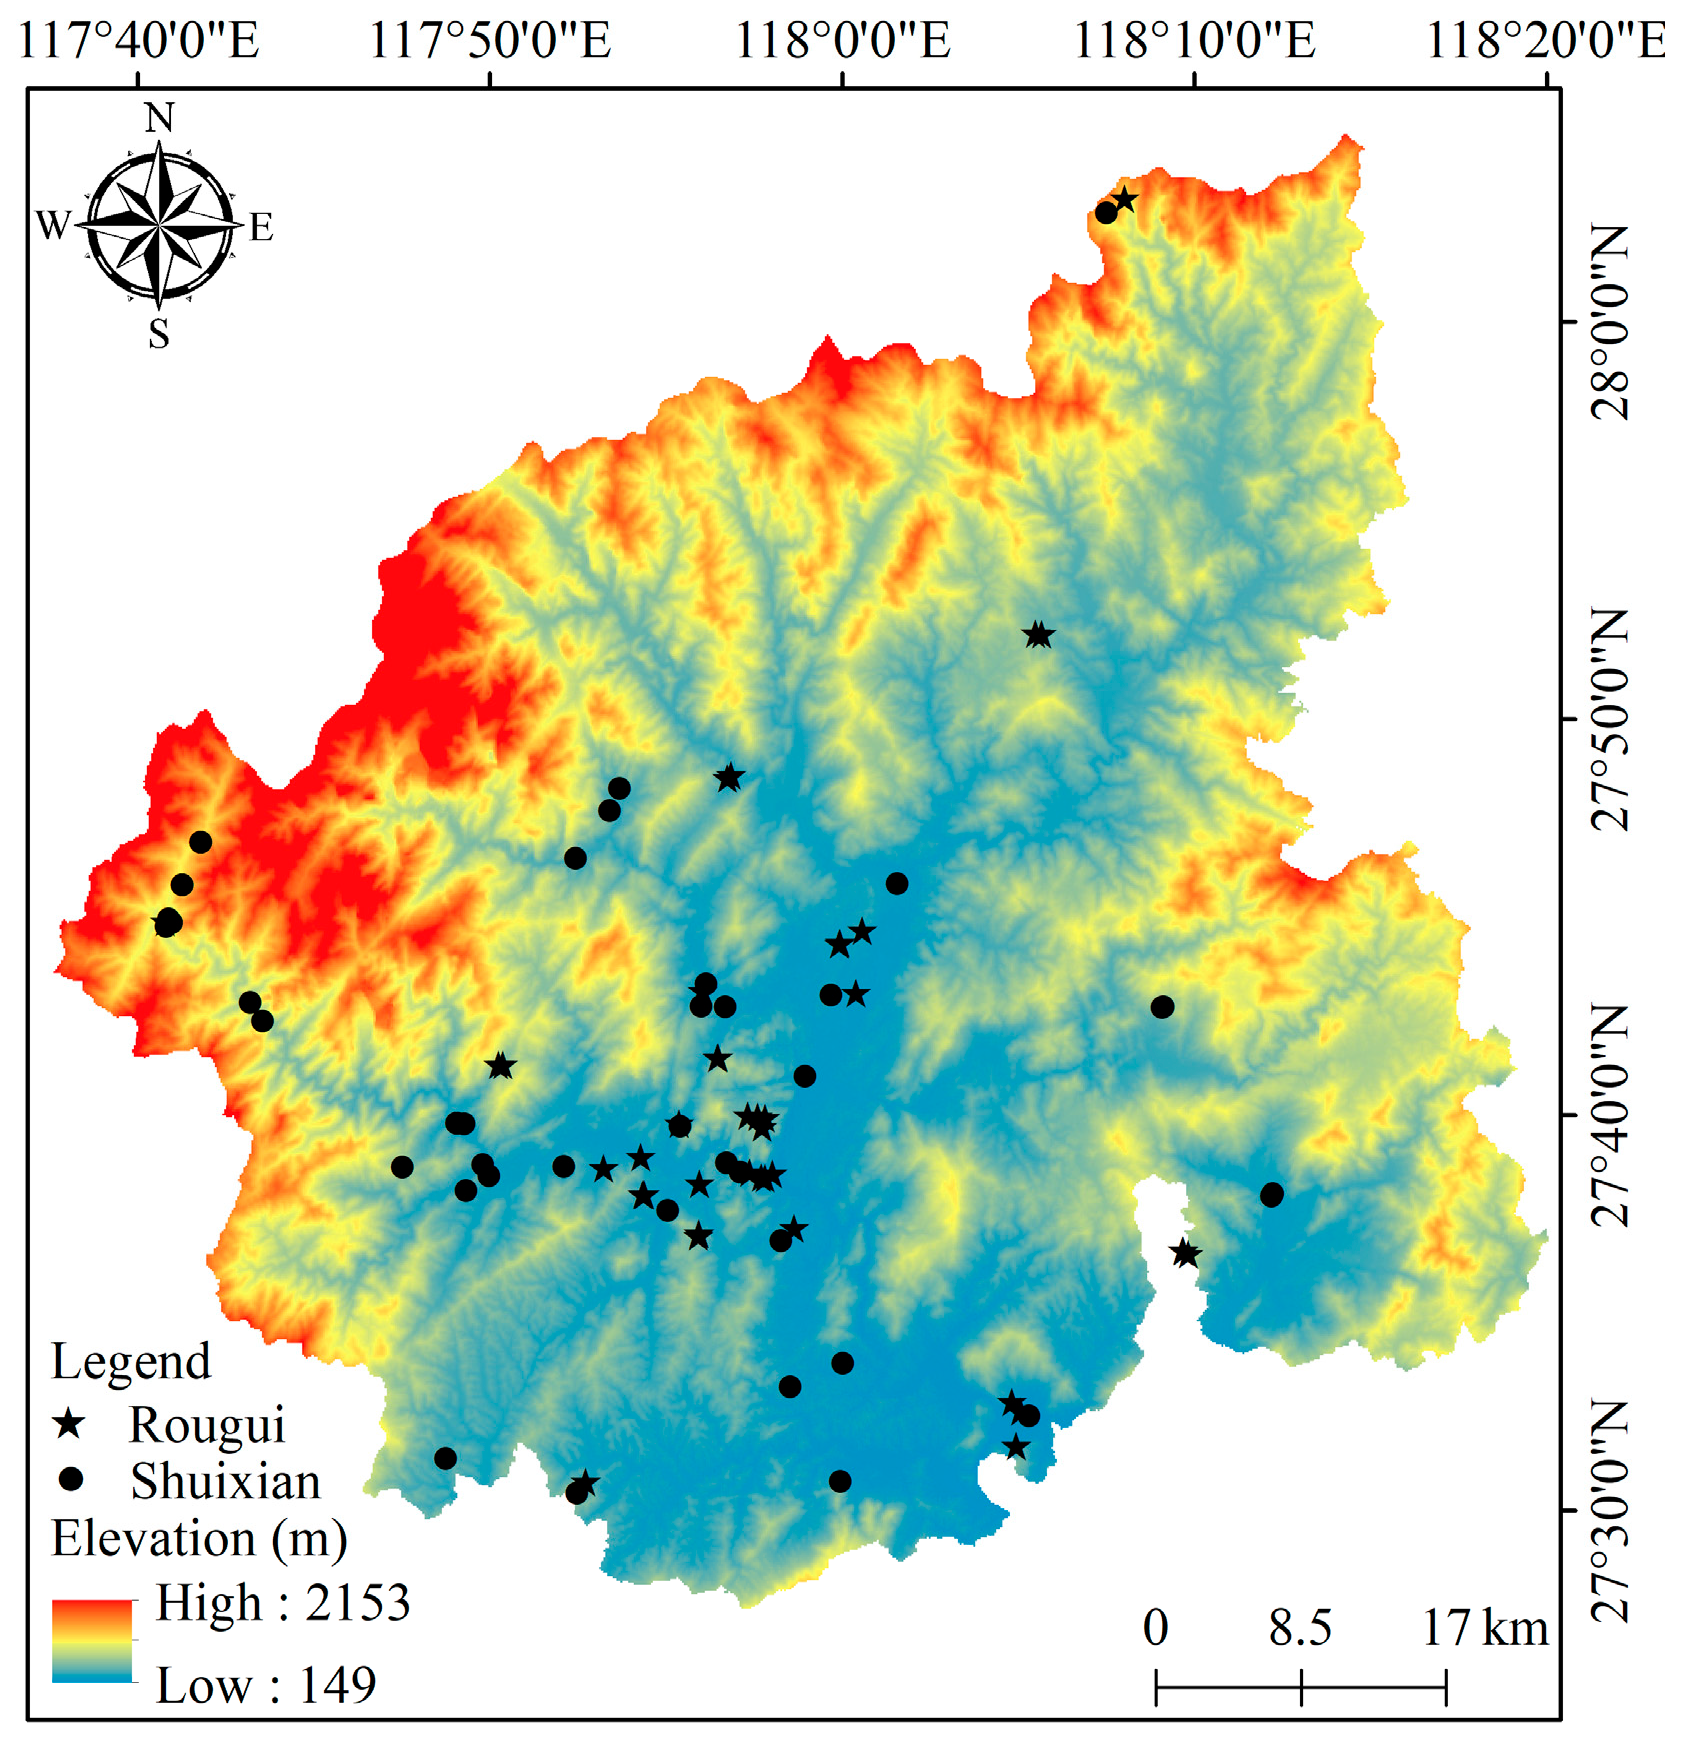
Figure 1. Location of Wuyi Rock tea garden sampling sites (n = 88) in Wuyishan City, north Fujian Province, China.
Agronomy 15 02449 g001
Figure 2. Spatial distributions of C/N (a), C/P (b), N/P (c), AN/TN (d), AP/TP (e), and DOC/TOC (f) in the soil of Wuyi Rock tea gardens (n = 88). AN and AP represent alkaline nitrogen and available phosphorus, respectively.
Agronomy 15 02449 g002
Figure 3. Spectral characteristic parameters of DOM in the soil of Wuyi Rock tea gardens (n = 88), including the ultraviolet–visible spectral parameters (SUVA254 (a), SUVA260 (b), E300/E400 (c)) and the fluorescence spectral parameters (FI (d), BIX (e), and HIX (f)). ns, *** and **** indicate the levels of significant differences with p > 0.05, p < 0.001, and p < 0.0001, respectively.
Agronomy 15 02449 g003
Figure 4. Fluorescence components (a), peak wavelengths (b), and component percentage values (c) of DOM in the soil of the Wuyi Rock tea gardens (n = 88).
Agronomy 15 02449 g004
Figure 5. Correlation analysis between soil nutrient indicators and DOM spectral parameters and components (C1–C4) in Wuyi Rock tea gardens (* p < 0.05; ** p < 0.01). (a) Rougui (n = 43), (b) Shuixian (n = 45). SOM, TN, TP, and DOC represent soil organic matter, total nitrogen, total phosphorus, and dissolved organic carbon, respectively; AN, AP, and AK represent alkaline nitrogen, available phosphorus, and available potassium, respectively. AL and Age indicate altitude and tree age, respectively.
Agronomy 15 02449 g005
Figure 6. Redundancy analysis of the impact of soil nutrient indicators on DOM spectral parameters and components (C1–C4) in Wuyi Rock tea gardens (* p < 0.05; ** p < 0.01). (a) Rougui (n = 43), (b) Shuixian (n = 45), where SOM, TN, TP, and DOC represent soil organic matter, total nitrogen, total phosphorus, and dissolved organic carbon, respectively; AN, AP, and AK represent alkaline nitrogen, available phosphorus, and available potassium, respectively; AL and Age indicate altitude and tree age, respectively.
Agronomy 15 02449 g006
Figure 7. Distribution map of the molar ratios of C/N/P in the soil of Wuyi Rock tea gardens. “Agronomy 15 02449 i001” indicates the corresponding C/N/P ratios of soil from tea gardens of different tea plant varieties, Rougui (n = 43); Shuixian (n = 45); “✩” indicates the average C/N/P ratios of soil across different land-use types or regional areas. The global and national-scale average soil C/N/P ratios were derived from [37] and [29], respectively. Average C/N/P values for global cropland and tropical/subtropical forest soils were taken from [38].
Agronomy 15 02449 g007
Disclaimer/Publisher’s Note: The statements, opinions and data contained in all publications are solely those of the individual author(s) and contributor(s) and not of MDPI and/or the editor(s). MDPI and/or the editor(s) disclaim responsibility for any injury to people or property resulting from any ideas, methods, instructions or products referred to in the content.