Article

The Optimal Cyanobacterial Sludge Incorporation Balances Nutrient Retention and NH3 Emission Reduction During Composting with Chicken Manure and Wheat Straw

1
Co-Innovation Center for Sustainable Forestry in Southern China, College of Forestry and Grassland, Nanjing Forestry University, Nanjing 210037, China
2
State Environmental Protection Key Laboratory of Soil Environmental Management and Pollution Control, Nanjing Institute of Environmental Sciences, Ministry of Ecology and Environment of China, Nanjing 210042, China
3
Key Laboratory of Agro-Environment in Downstream of Yangtze Plain, Institute of Agricultural Resources and Environment, Jiangsu Academy of Agricultural Sciences, Nanjing 210014, China
*
Authors to whom correspondence should be addressed.
Agronomy 2025, 15(10), 2429; https://doi.org/10.3390/agronomy15102429
Submission received: 25 August 2025 / Revised: 8 October 2025 / Accepted: 14 October 2025 / Published: 20 October 2025
(This article belongs to the Special Issue Organic Improvement in Agricultural Waste and Byproducts)

Abstract

Managing eutrophic waterbodies produced large quantity of cyanobacterial sludge (CS), a biomass rich in nitrogen (N) that can be recycled through composting. However, how this management affects the compost fertility and ammonia (NH3) volatilization is little known. This study used a chicken manure and wheat straw mixture with struvite, as the control composting treatment (CK). Subsequently, 10%, 20%, 30%, and 40% of the chicken manure was substituted with CS at the initiation of composting, which were named CS10%, CS20%, CS30%, and CS40%, respectively. The results showed that compost pH decreased by 0.2–0.5 units, while total N content significantly increased by 10.4–20.8% under all CS amended treatments compared to the CK. Furthermore, cumulative NH3 volatilization in the CS amended treatments increased with higher CS substitution rates, showing a significant increase of 21.3–110.0%. In CS amended treatments, the initial contents of microcystin–RR and –LR were 82.0–328.0 μg kg−1 and 48.0–192.0 μg kg−1, respectively, which were degraded by 35.7–79.5% and 30.2–77.8%, peaking at 30% CS substitution. Notably, the CS40% treatment showed degradation rates dropping to 62.3% and 60.7%, accompanied by a significant increase in microcystin content. Meanwhile, the heavy metals (total arsenic, cadmium, chromium, mercury, and lead) contents of all composts complied with organic fertilizer standard (NY/T 525–2021) of China. Interestingly, the CS10% had significantly lower heavy metal concentrations compared to the CK, thus enhancing compost safety. In conclusion, 10% was an optimal CS incorporating ratio to improve the quality of compost derived from chicken manure, wheat straw and struvite, while reducing NH3 emissions, which provided a feasible technical pathway for recycling the CS.

1. Introduction

Climate change and intensified human activities have led to eutrophication and cyanobacterial proliferation in lakes and rivers worldwide [1]. The Taihu Lake Basin in China has been particularly affected [2]. Mechanical salvage remains the most direct means to control widespread algal outbreaks [3]. For example, in Jiangsu province, China, approximately 740,000 tons of cyanobacterial sludge (CS) were generated through salvage operations in 2023 [4]. The urgent challenge lies in the safe and efficient disposal of this CS. If improperly managed, CS decomposes anaerobically, releasing unpleasant odors and toxic microcystins, thereby transforming an algal problem into a secondary environmental hazard [5]. However, CS is rich in organic matter and essential nutrients, including 8–10% nitrogen (N), indicating its fertilization potential [6]. Aerobic composting is a promising method to simultaneously stabilize CS, degrade microcystins, and produce organic fertilizer [7]. Therefore, developing a reliable composting strategy for CS is of critical importance for achieving synergistic benefits between waste management and agricultural sustainability.
In conventional composting of chicken manure and straw, chicken manure serves as the primary source of N [8]. However, improper management and inadequate recycling of chicken manure can exert considerable environmental pressure [9]. Concurrently, tighter environmental regulations have led to a year-on-year increase in treatment costs [10], consequently driving up compost prices. The CS, being rich in N and carbon (C), could serve as a cost-effective alternative to partially replace chicken manure. This substitution could mitigate the environmental burden of both wastes while reducing composting costs. However, the appropriate substitution ratio of CS for chicken manure remains unclear. CS generally has a low C/N ratio, excessive substitution for chicken manure may disturb the C/N balance for compost decomposition [11], inhibit microbial activity, and increase N losses [12]. Moreover, the safe degradation of inherent microcystins must be guaranteed. Thus, the core innovation of this study is to systematically identify the optimal CS substitution ratio that maximizes resource recovery while ensuring compost quality, safety, and minimal environmental impact.
Ammonia (NH3) volatilization is a primary pathway for N loss during composting, adversely affecting the fertility of the final compost product [13]. Released NH3 and its subsequent deposition can degrade both water and soil quality [14]. Additionally, it may indirectly contribute to increased N2O emissions [15]. In conventional chicken manure composting, N loss due to NH3 volatilization can reach 47–62% [16]. CS, with its high reactive N content, may further aggravate NH3 volatilization during composting [6]. Furthermore, in co–composting of CS and mushroom substrate, N loss due to NH3 volatilization increased by approximately 2–4% with every 10% increase in CS proportion [4]. To mitigate NH3 volatilization, struvite was incorporated into compost by promoting the precipitation of NH4+ [17]. By establishing a CS substitution gradient (10%, 20%, 30%, and 40%), this study aimed to identify a relative optimal ratio for balancing CS resource utilization with NH3 volatilization reduction, ultimately enhancing the compost quality.
To ensure the agricultural safety, organic fertilizers must meet the Chinese Organic Fertilizer Standard (NY/T 525–2021), which sets limits for heavy metal contents. However, heavy metals such as chromium (Cr) and lead (Pb) are commonly introduced through feed additives, with more than 95% retained in animal manure, this accumulation can result in elevated heavy metal levels in the compost products [18,19]. Numerous studies have shown that algae can effectively remove heavy metals through bio-sorption [20,21]. However, the presence of endogenous microcystin residues in algal biomass poses potential ecological risks [11]. Notably, microcystin degradation predominantly takes place during the thermophilic phase of composting [5], where heat-tolerant microorganisms metabolize microcystin as a C source, achieving degradation rates of 60–77% [7]. However, this efficiency tends to decline as the proportion of CS increases [4].
In this study, chicken manure, wheat straw and struvite were used as the primary composting substrates. Then, the effects of CS substitution at varied ratios (10%, 20%, 30%, 40%) of chicken manure on maturity indicators, nutrient dynamics, safety indicators, and NH3 volatilization of compost were evaluated. The study aimed to find an optimal substitution ratio that balances nutrient retention and NH3 emission reduction, offering theoretical insights and technical parameters for large scale CS composting and disposal.

2. Materials and Methods

2.1. Experimental Materials

The composting raw materials consisted of wheat straw sourced from Huifeng Straw Agricultural Products Deep Processing Co., Ltd., and chicken manure from Musen Fertilizer Co., Ltd., both located in Nanjing, China. CS collected from the Taihu Lake Basin. The struvite was synthesized using the aqueous phase (AP) derived from the hydrothermal carbonization process [22], which was obtained from the Jiangsu Academy of Agricultural Sciences [23]. Mg2+ and PO43− sources were added to the AP as precipitants, and the pH of the mixture was adjusted to 10 using a NaOH solution to promote struvite crystallization. After the precipitation reaction, the supernatant was collected, and its pH was adjusted to 7.0 with HCl to obtain the final struvite product used in this study. Prior to composting, chicken manure was crushed into 2–3 cm pieces, wheat straw cut into 1–2 cm segments, and struvite ground into powder. The basic properties of these materials are summarized in Table 1.

2.2. Experimental Design

The composting experiment began on 23 September 2022, at the greenhouse of the Jiangsu Academy of Agricultural Sciences and lasted for 43 days. Five treatments were evaluated: a chicken manure and wheat straw mixture with struvite as the control composting treatment (CK), and four treatments in which 10%, 20%, 30%, and 40% of the chicken manure was replaced by CS on a fresh weight basis (CS10%, CS20%, CS30%, and CS40%). The total initial mass for each composting pile was therefore 9.27 kg, comprising 9.0 kg of organic materials and a fixed addition of 0.27 kg of struvite. The struvite was added uniformly in all treatments at a rate of 3% of the organic material mass as a common conditioner to mitigate NH3 volatilization [24], ensuring that the CS substitution rate was the sole variable under investigation. The specific material proportions for each treatment are shown in Table 2. At the beginning, raw materials were thoroughly blended and loaded into customized insulated compost bins, with internal and external dimensions of 53 × 40 × 29 cm and 64 × 48 × 36 cm, respectively, and other parameters adapted from Sun et al. (2023) [23]. The moisture content was maintained at 55–60% throughout the process.

2.3. Sample Collection and Measurement

2.3.1. Sample Collection

The compost was turned, and samples were collected on days 0, 7, 17, 24, 32, 39, and 42. Each treatment was set up with three replicates (i.e., three independent piles). On each sampling day, approximately 100 g of sub-sample was collected from each replicate pile using the five-point sampling method (from the four corners and the center of the pile). These sub-samples were immediately thoroughly mixed to form a composite sample weighing approximately 500 g. Subsequently, about 100 g was taken from each composite sample for subsequent analysis, while the remaining material was returned to the original pile to maintain the total mass. The 100 g analytical sample was further processed: one fresh portion was stored at 4 °C for analysis of pH, electrical conductivity (EC), germination index (GI), ammonium N (NH4+-N), and nitrate N (NO3-N); the other was air–dried, ground, and sieved for determination of total N, total P, total K, and cation exchange capacity (CEC).

2.3.2. Composting Temperature, pH, EC, GI and CEC

During composting, an RC-4 temperature logger probe was inserted 30 cm into the compost heap to record temperatures every 30 min. The 24 h monitoring data were averaged to derive the daily temperature, while the ambient temperature was simultaneously logged using the same logger. Accumulated temperature is defined as the sum of the daily differences between the composting pile temperature and a benchmark temperature. This metric integrates both “temperature” and “time” into a single quantitative parameter, serving to measure the total thermal effect throughout the entire composting process. It is a crucial basis for assessing whether the compost has met the required sanitation standards. Accumulated temperature was calculated using the following Formula (1):
T = i = 1 n = 43   T i T 0
In the formula, T denotes the cumulative temperature; Tᵢ represents the daily average temperature, and T0 refers to the biological zero temperature (15 °C) [25].
Fresh compost (2 g) was extracted with deionized water at a 1:10 (w/v) ratio. The mixture was then stirred at 180 rpm for 30 min and allowed to stand for 10 min. The extract was filtered through a 0.45 µm membrane, and pH and EC were measured using a pH/EC analyzer (Sanxin, SX723, Shanghai, China). The GI was determined using radish seeds according to the method described by Wei et al. (2022) [26].
CEC was determined using air-dried compost (sieved to 0.25 mm). Samples were repeatedly extracted with sodium acetate and centrifuged, followed by ethanol washing and a final extraction with ammonium acetate. The supernatant was collected, and sodium (Na+) concentration was measured by flame photometry to calculate CEC.

2.3.3. Compost Nutrient Content

Approximately 0.1 g of air-dried compost was digested with a H2SO4-H2O2 mixture. Total N was determined by the Kjeldahl method [27], while total P and total K were measured by inductively coupled plasma optical emission spectrometry (ICP-OES) [28]. Total nutrient content was calculated as the sum of N, P, and K.
Fresh compost was extracted with KCl solution, followed by shaking, centrifugation, and filtration. NH4+-N was determined by indophenol blue colorimetry, and NO3-N was measured using UV–visible spectrophotometry.

2.3.4. Microcystin and Heavy Metal Content of Compost Products

Samples were extracted with methanol using ultrasonic treatment, followed by centrifugation and evaporation. microcystin content was determined by high-performance liquid chromatography (HPLC) [29].
Air–dried samples were digested with nitric acid and hydrogen peroxide. After filtration, heavy metal concentrations were determined using inductively coupled plasma mass spectrometry (ICP-MS) [30].

2.3.5. NH3 Volatilization from Composting

The continuous power pumping and confined chamber method was used, with a 2% boric acid solution as the NH3 absorbent and a methyl red-bromocresol green mixture as the indicator. Daily pumping occurred from 8:00 to 10:00 am and from 2:00 to 4:00 pm. After each pumping, the compost was titrated with 0.02 M H2SO4 to calculate daily NH3 volatilization. Cumulative NH3 volatilization was calculated by summing the daily values using the following Formula (2):
C n = i = 1 n   A i
In the formula, Cₙ represents the cumulative NH3 volatilization on day n, where Aᵢ denotes the daily NH3 volatilization on day i. The calculation is defined by the following equation.

2.4. Statistical Analysis

Data processing was performed using Microsoft Excel version 2021, and graphical outputs were generated in Origin version 2024. Significant differences among treatments (p < 0.05) were identified by one-way ANOVA in SPSS version 27. Results are expressed as mean ± SD (n = 3). Different letters denote statistically significant differences between treatments at p < 0.05.

3. Results

3.1. Dynamics in Maturation Parameters During Composting

The temperature in all treatments was with a typical composting trend, initially rising and then gradually declining (Figure 1a). By the 2nd day, temperatures increased rapidly, reaching the thermophilic phase, and peaked at 65.8–70.1 °C within the first week. Thereafter, temperatures gradually declined and began to stabilize on the 33rd day, maintaining a range of 22.0–27.0 °C. Compared with the CK treatment, the thermophilic phases in the CS amended treatments were shortened by approximately 1 day.
During the warming phase, the effective accumulated temperature in the CS amended treatments decreased with increasing CS substitution ratios, compared with the CK treatment, CS amended treatments showed a stepwise reduction of 12.7–18.2% in the thermophilic phase and an increase of 13.4–22.6% in the maturation phase (Figure 1b). By the end of composting, total effective accumulated temperatures ranged from 20,779.9 to 22,246.8 °C, while those in the CS amended treatments increased by 3.2–7.1% compared with the CK treatment.
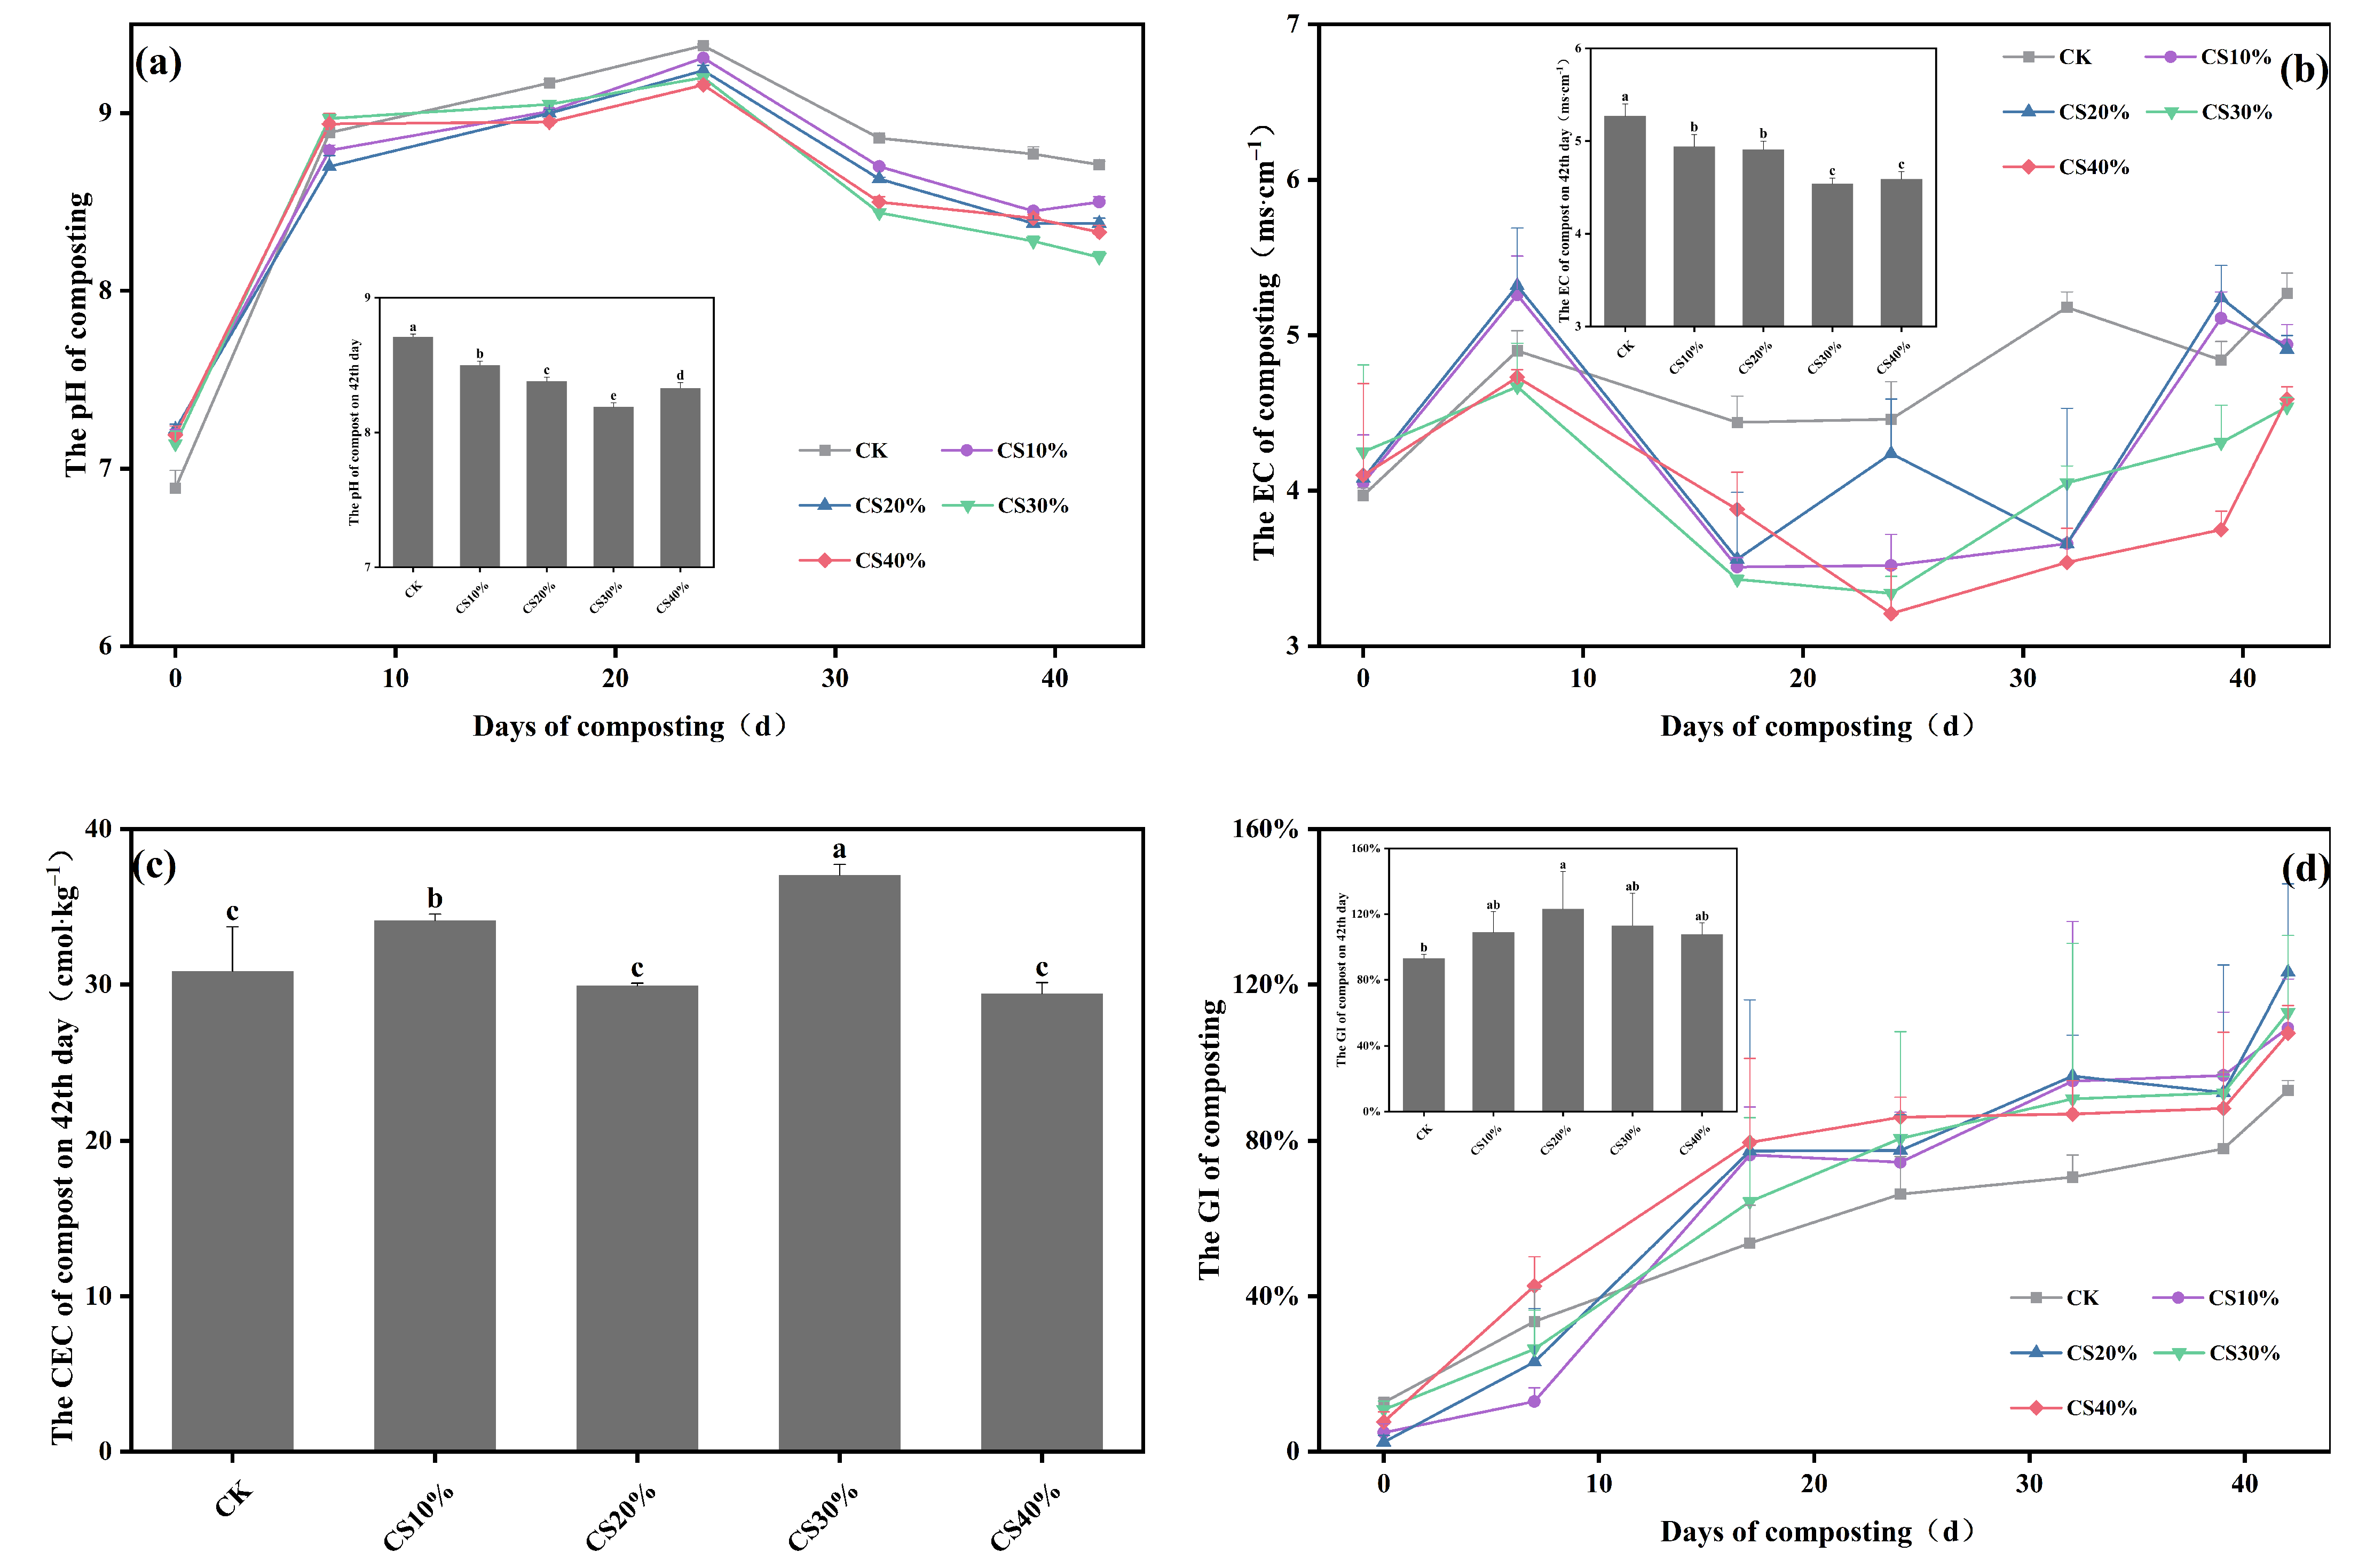
The initial pH of all compost treatments ranged from 6.5 to 7.2. During the first week of composting, the pH increased rapidly and then gradually reached peaks of 9.2–9.4 between the 7th and 24th days, followed by a decline between the 25th and 42nd days (Figure 2a). At the end of composting, the pH of all the CS amended treatments (8.2–8.5) remained below 8.5, meeting compost maturity standards, and was 0.2–0.5 units lower than that of the CK treatment.
During the first week of composting, the EC values of all treatments increased rapidly, then decreased and subsequently rose again (Figure 2b). By the end of composting, EC of each treatment ranged from 4.5 to 5.3 mS cm−1, with the CS30% treatment exhibiting the lowest value. Compared with the CK treatment, compost EC decreased significantly by 6.7–16.7% in the CS added treatments.
The CEC values at the end of composting ranged from 29.4–37.1 cmol kg−1 (Figure 2c), with the CS30% treatment exhibiting the highest value. The CEC values in the CS10% and CS30% treatments were 10.6% and 20.0% higher than those of the CK treatment, respectively.
GI increased gradually throughout composting in all compost treatments (Figure 2d). By the 24th day, GI exceeded 50% in all treatments. At the final stage, GI were 93.0–123.2%, with the CK treatment showing the lowest value.

3.2. Dynamics in N, P, and K Content During Composting

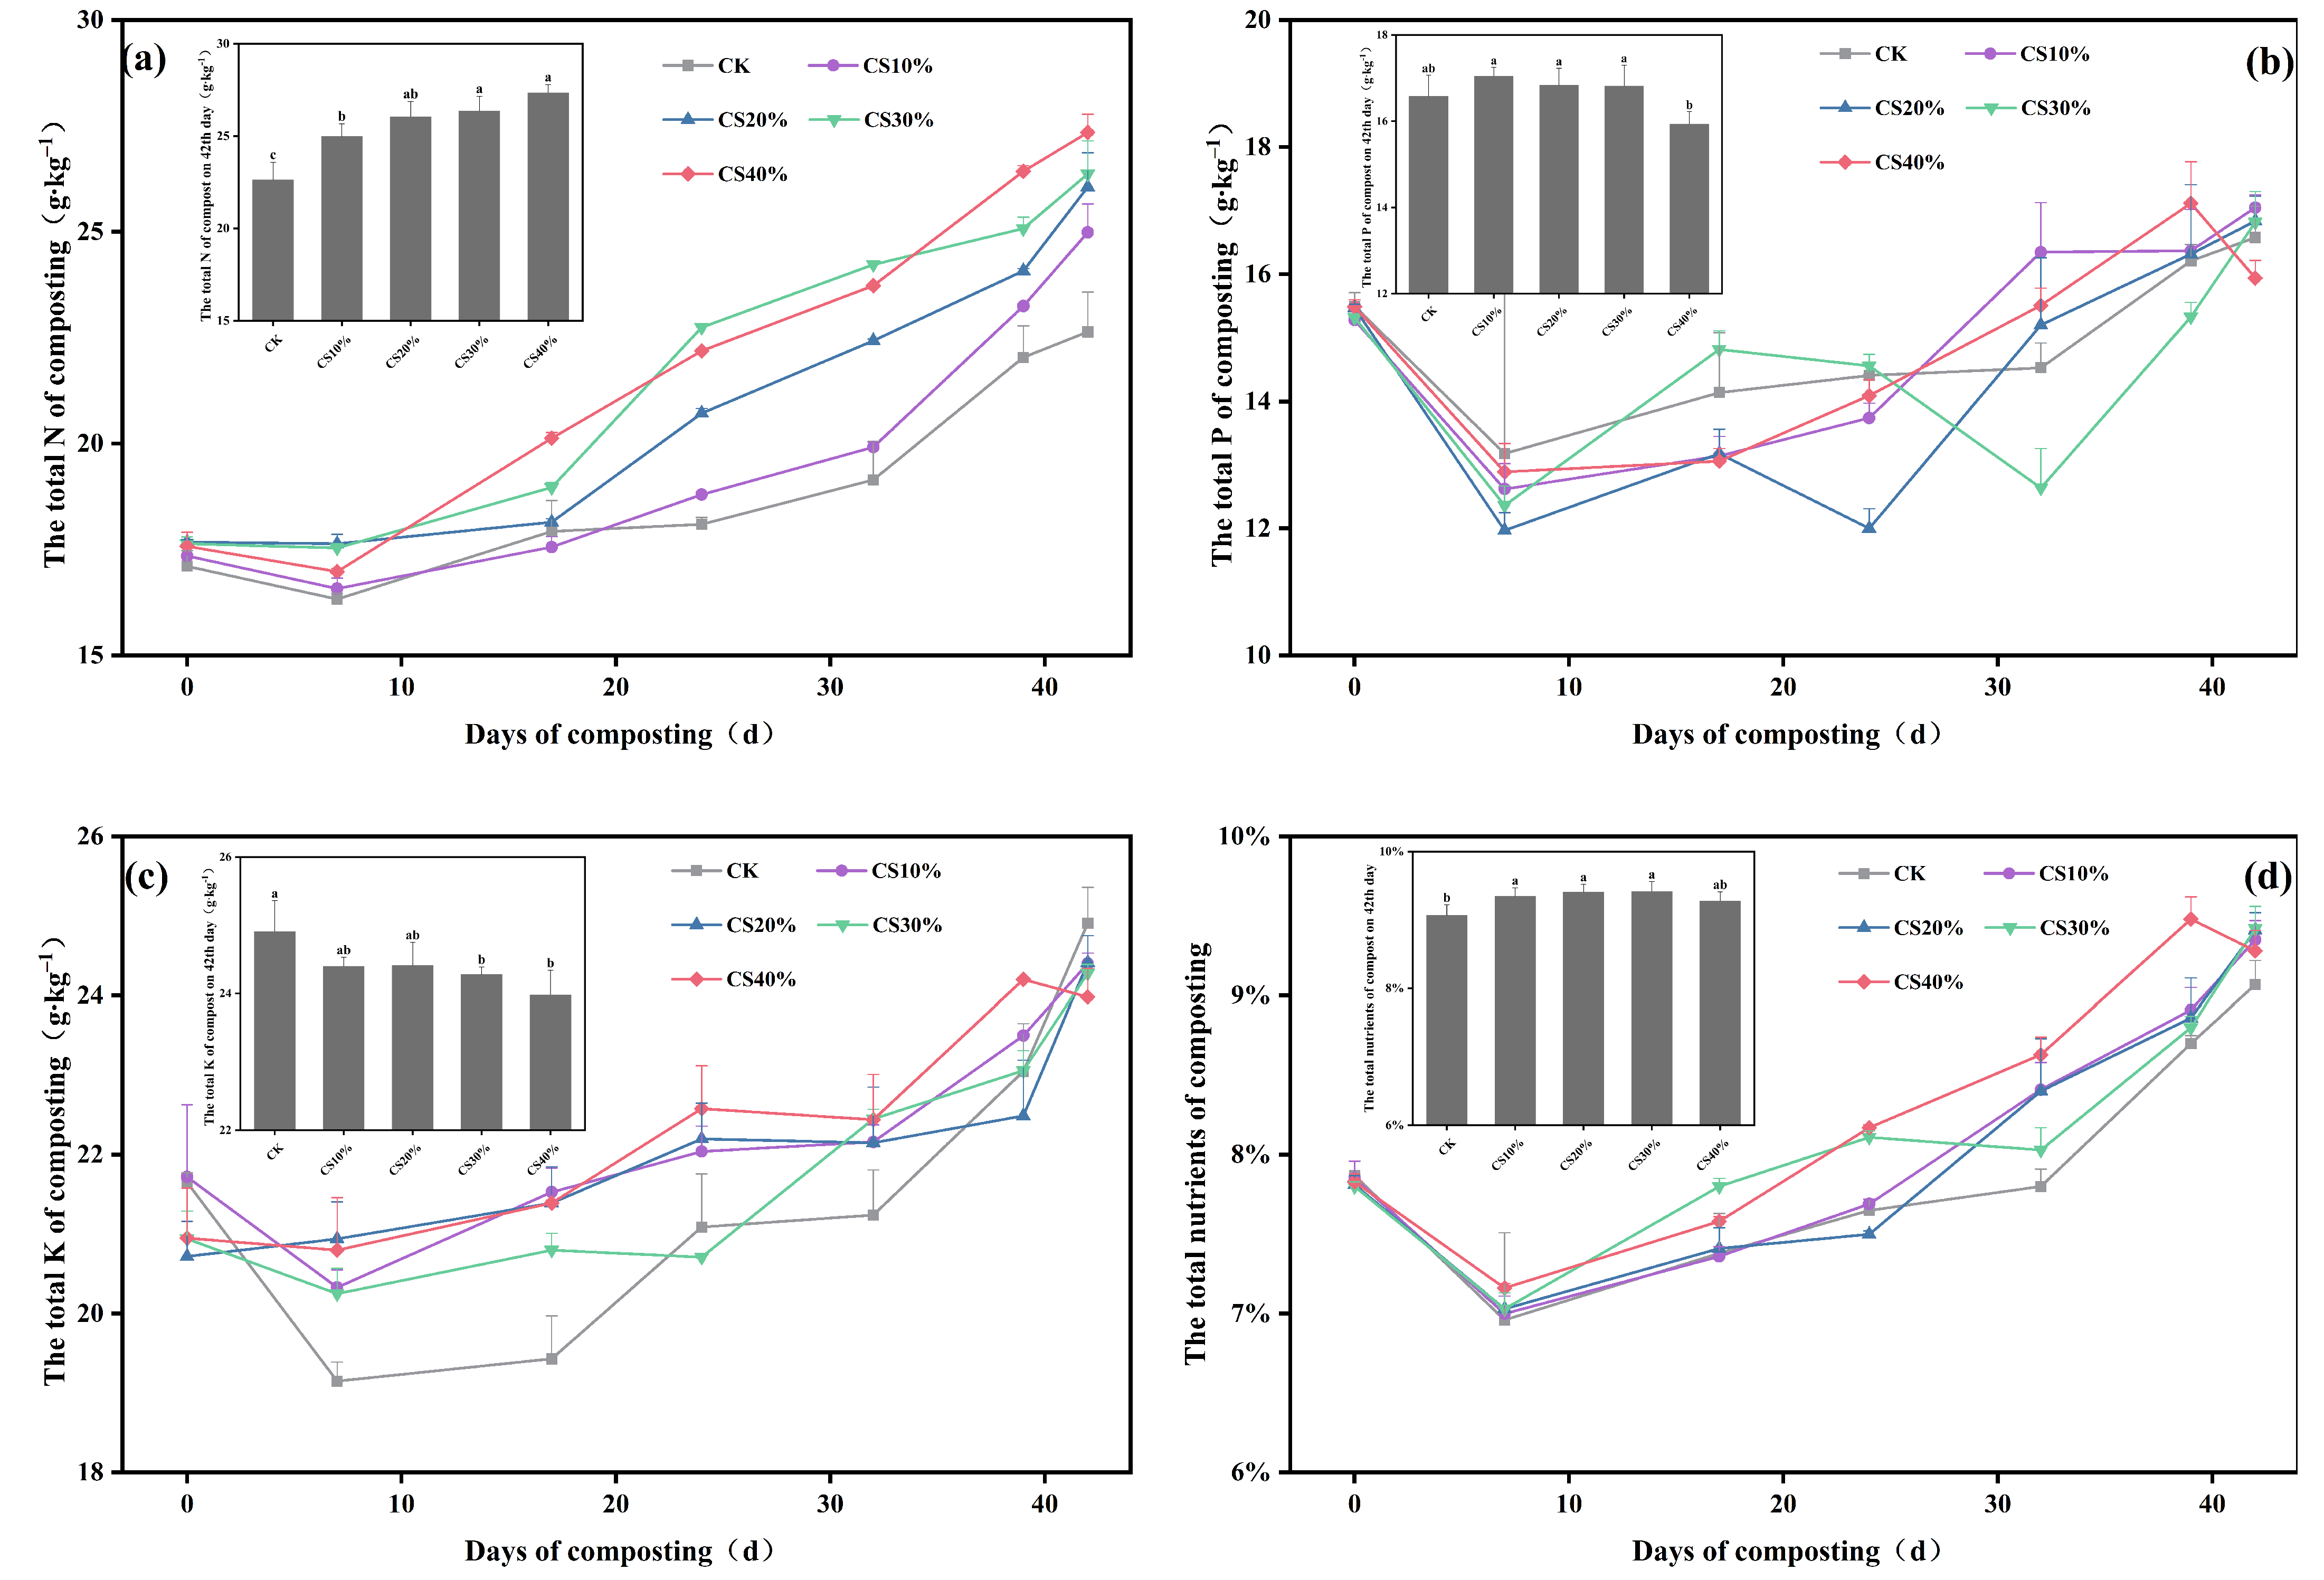
During composting, total N content in all treatments increased from 17.1–18.0 g kg−1 at the initial stage to 21.7–27.4 g kg−1 (Figure 3a). By the end of composting, total N content in the CS amended treatments was significantly 10.4–20.8% higher than that in the CK treatment, and increased with the CS substitution ratio.
All treatments exhibited an initial decline in total P content, followed by a gradual increase during composting (Figure 3b). By the end of composting, the total P contents were 15.3–17.1 g kg−1, with the highest value observed in the CS10% treatment. Furthermore, the total P content in the CS40% treatment was 5.2–6.5% lower than that in other CS amended treatments.
During composting, total K content in all treatments exhibited an overall increasing trend (Figure 3c), reaching 24.0–24.9 g kg−1 by the end. Although significant differences were observed among treatments, the overall variation in total K content remained relatively limited.
Total nutrient content in all treatments declined during the first week, followed by a gradual increase from 7.0–7.2% on the 7th day to 8.6–9.4% at the end of composting (Figure 3d). Compared with the CK treatment, total nutrient content in the CS amended treatments increased significantly by 9.1–9.4%.
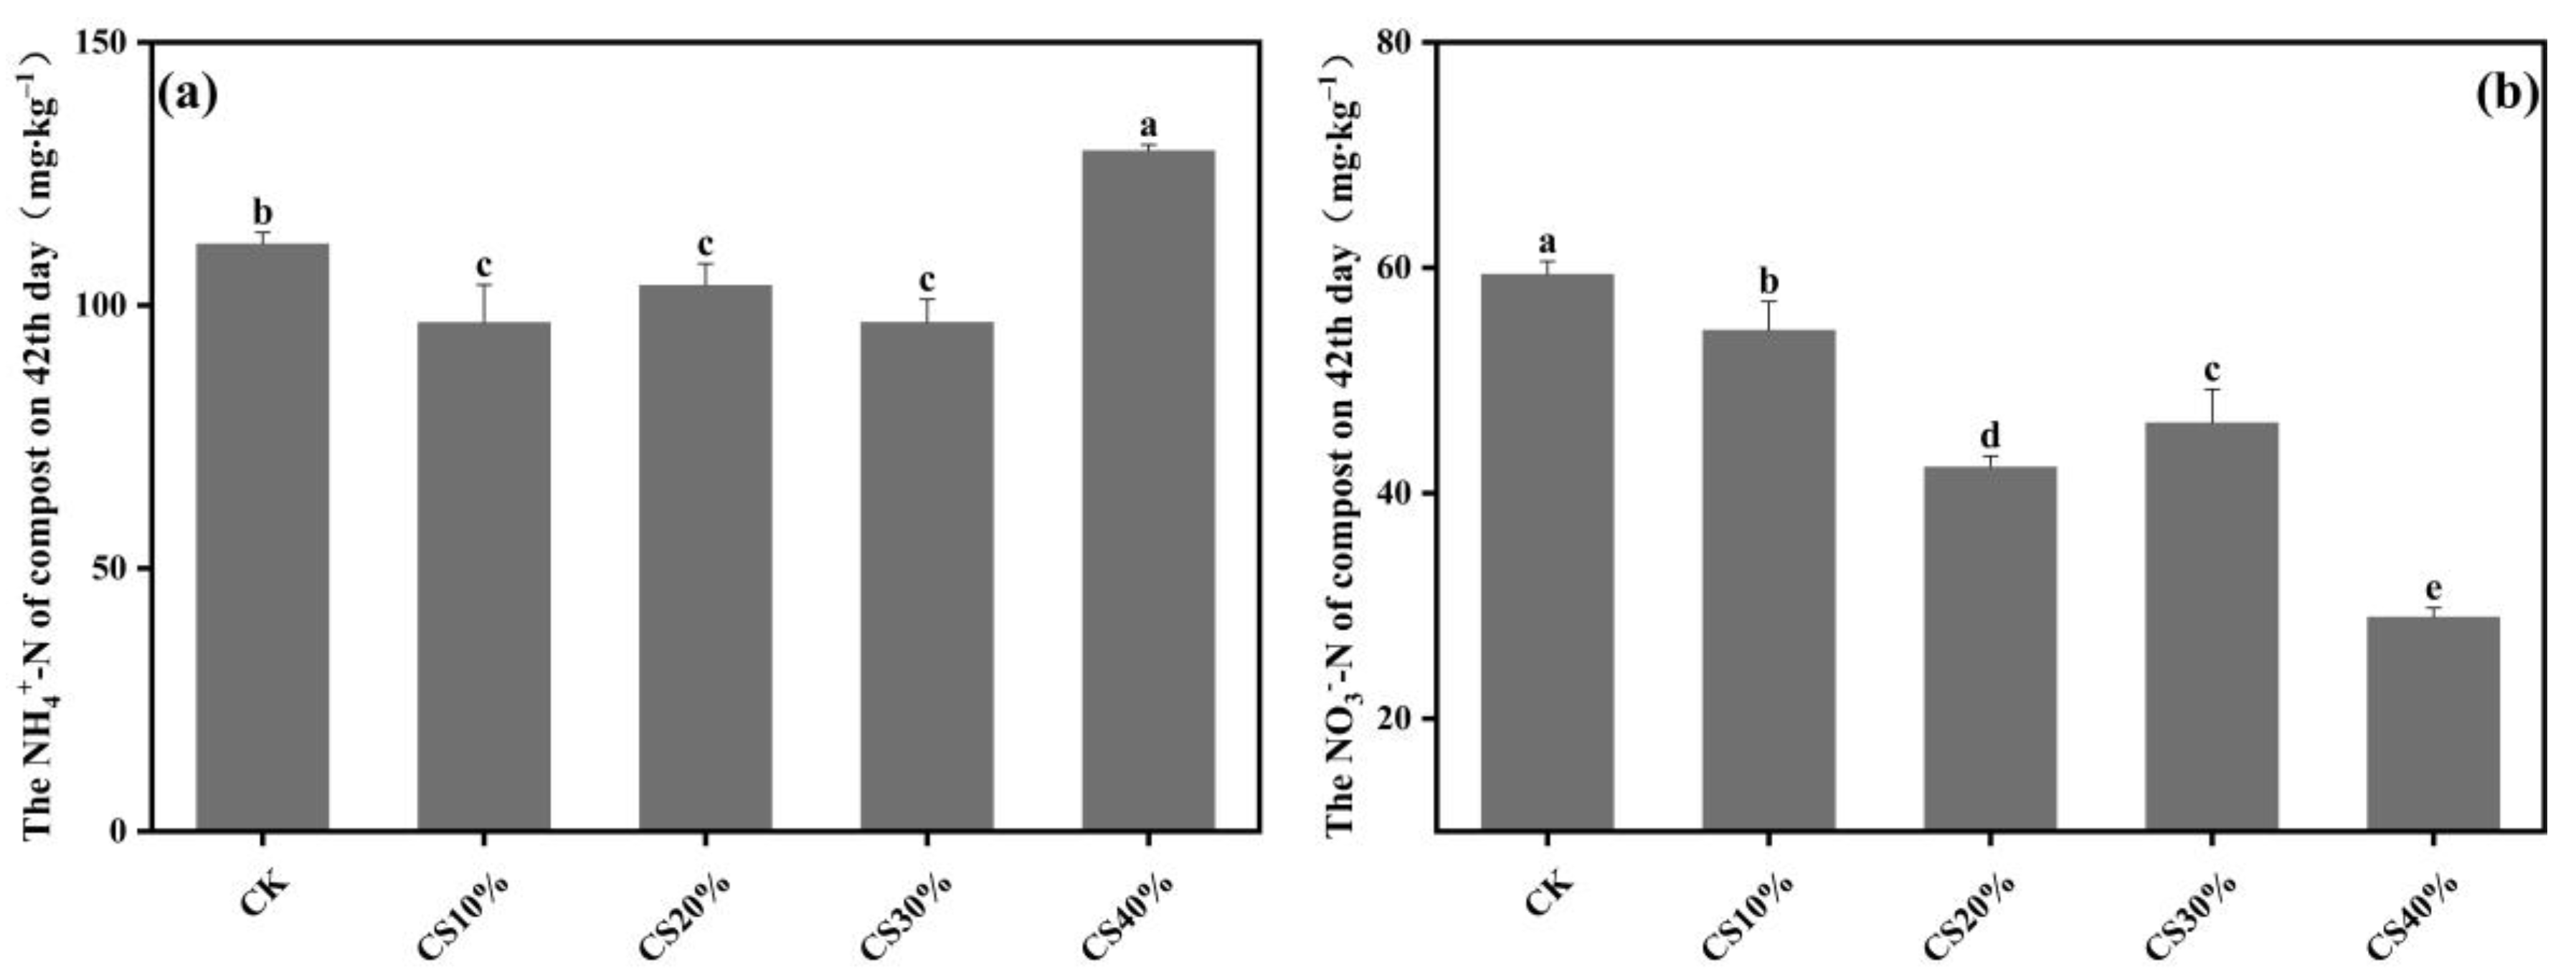
At the end of composting, NH4+-N content in all treatments ranged from 96.8–129.5 mg kg−1 (Figure 4a). Compared to the CK treatment, NH4+–N content in treatments with 10–30% CS substitution decreased significantly by 7.1–13.4%. Remarkable, the CS40% treatment exhibited a significant increase of 15.9%. Furthermore, NO3-N content ranged from 29.0–59.5 mg kg−1, with the CS amended treatments exhibiting a significant reduction of 8.3–51.1% compared to the CK treatment (Figure 4b).

3.3. NH3 Volatilization During Composting

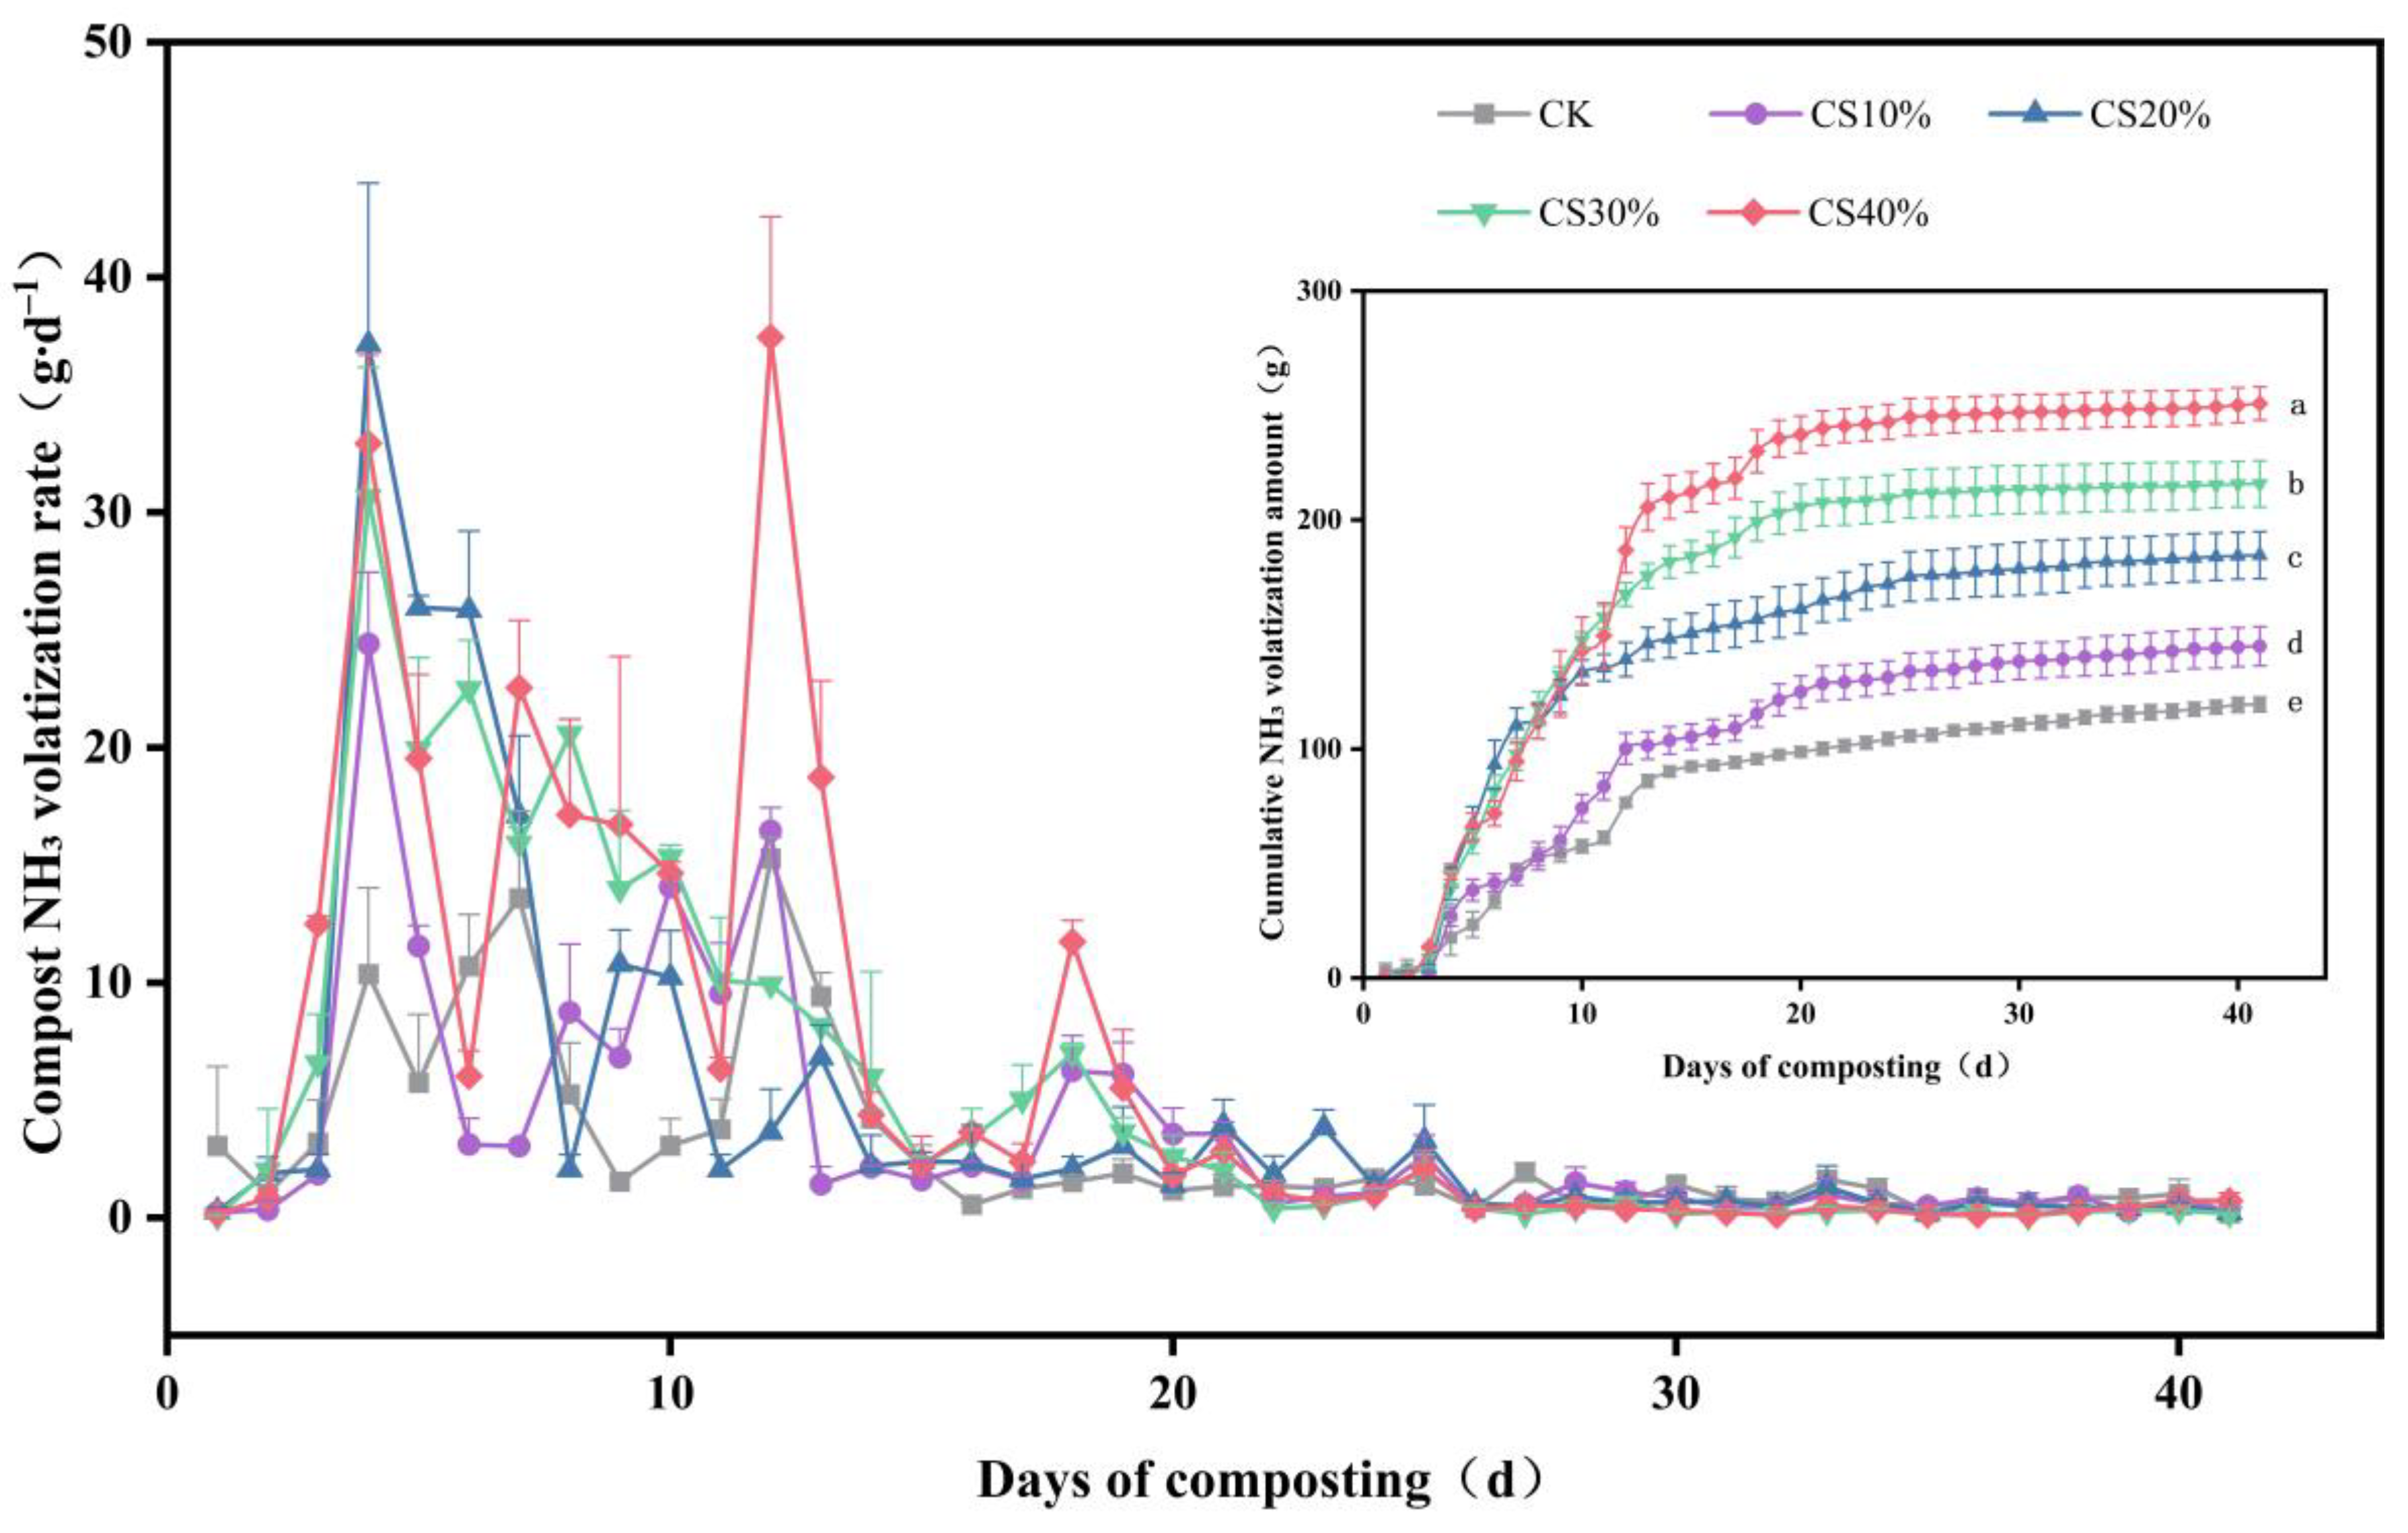
NH3 volatilization in all treatments initially increased during composting, followed by a gradual decline, and eventually approaching 0 g d−1 (Figure 5). Peak NH3 emissions occurred on the 12th day in the CK treatment and the CS40% treatment, and on the 8th day in the other CS amended treatments. Peak NH3 volatilization ranged from 15.3 g day−1 to 37.5 g day−1, with the CK treatment exhibiting the lowest value. Compared to the CK treatment, peak NH3 volatilization in the CS amended treatments increased significantly by 59.6–144.9%.
During composting, cumulative NH3 volatilization in all treatments increased continuously until stabilizing at a plateau (Figure 5). By the end of composting, cumulative NH3 losses were 119.5–250.8 g, with the CK treatment exhibiting the lowest value. Compared to the CK treatment, cumulative NH3 volatilization in the CS amended treatments increased significantly by 21.3–110.0% with rising CS substitution ratios.

3.4. Safety of Compost Products

In CS amended treatments, the initial contents of microcystin–RR and –LR were 82.0–328.0 μg kg−1 and 48.0–192.0 μg kg−1, respectively. By the end of composting, the degradation rates of microcystins exhibited a trend of first increasing and then decreasing with the increase in CS substitution ratio. The degradation rates of microcystin–RR and –LR were 35.7–79.5% and 30.2–77.8%, respectively, both peaking at a substitution ratio of 30% (Table 3). In the CS40% treatment, the degradation rates of microcystin–RR and –LR were 62.3% and 60.7%, respectively. Additionally, microcystin content increased significantly with the increase in CS substitution ratio. Compared with other CS amended treatments, the contents of microcystin–RR and –LR in the CS40% treatment group were 114.3–145.0% and 92.8–136.4% higher, respectively.
By the end of composting, the contents of heavy metals in all compost treatments comply with China’s organic fertilizer standard (NY/T 525–2021) for agricultural use safety (Table 4). The concentrations of total arsenic (As), cadmium (Cd), mercury (Hg), and Pb in all treatments generally exhibited a decreasing trend with increasing CS substitution rates. Compared with the CK treatment, the As, Cd, Hg, and Pb concentrations in the CS amended treatments were significantly 46.4–53.0%, 47.3–78.1%, 33.3%, and 29.3–36.4% lower in the CS amended composts. Notably, the CS10% treatment exhibited the lowest total Cr content (29.4 mg kg−1), representing a significant reduction of 10.5–25.2% compared with the other CS amended treatments.

4. Discussion

4.1. Effects of CS Addition on Maturation Parameters During Composting

Temperature is a key parameter for defining composting phases and assessing compost maturity [31]. In the present study, the rapid temperature increase observed on the 2nd day of composting may be attributed to the activity of thermophilic bacteria in the pile, which are associated with the accelerated breakdown of small molecules and soluble compounds in the compost material [32]. However, the low C/N ratio of the CS material likely constrained oxygen supply [33], which consequently suppressed microbial activity, leading to a shortened thermophilic phase in the CS amended treatments [34]. During composting, the temperature gradually declined and stabilized in the later stages, attributable to the depletion of readily degradable organic matter, consistent with previous studies [23]. Although the thermophilic phase in CS amended treatments was shortened to 7 days, this duration was still sufficient for effective aerobic composting. Moreover, the total effective accumulated temperature exceeded the spoilage–prevention threshold (≥10,000 °C) (Figure 1b). This threshold is widely recognized as a key indicator for effective sanitization, as it signifies that the composting material has absorbed sufficient thermal energy over time to ensure the inactivation of pathogenic microorganisms, parasite eggs, and weed seeds [35]. In addition, biodegradation is considered the most effective method for the transformation of microcystins [36], with thermophilic bacteria in the compost pile playing a crucial role in this degradation process. suggesting that CS addition enhanced composting efficiency without impairing thermophilic performance.
The initial pH of all compost treatments were 6.5–7.2, providing a near-neutral environment conducive to the initiation of microbial activity [37]. The rapid increase in pH during the first week (Figure 2a), reflects intensive mineralization of N-rich organic matter from both chicken manure and CS, which released substantial NH4+ and degraded organic acids, collectively elevating pH [38,39]. Simultaneously, EC increased sharply in the first week (Figure 2b), consistent with the accumulation of soluble ions from decomposition [40]. After reaching a peak of 9.2–9.4, pH gradually declined. The decrease can be attributed to NH3 volatilization and microbial nitrification, which consumes NH4+ and releases H+ ions [23,37]. Furthermore, after the initial rise in the first week, EC decreased rapidly. This decline was mainly attributed to the reduction in ammonium ion concentration due to enhanced NH3 volatilization under high temperature and alkaline conditions, as well as a further decrease in soluble ion content caused by the precipitation of mineral salts such as phosphates and carbonates [41]. Interestingly, during the phase of pH decline, EC exhibited a gradual increasing trend. This can be attributed to the stabilization of temperature in the later stage of composting, which enhanced nitrification activity, promoting the oxidation of NH4+ to NO3 and consequently increasing the concentration of soluble ions in the compost matrix [42]. At the end of composting, both pH and EC in the CS amended treatments were significantly lower than those in the CK treatment. The pH values in all CS treatments were ≤8.5, which can be attributed to enhanced NH3 volatilization coupled with nitrification dominated by ammonia-oxidizing bacteria (AOB) [43]. Notably, compost standards specify no absolute upper pH limit. However, this factor is highly correlated with the control of N loss through NH3 volatilization [44]. Furthermore, as an organic fertilizer, the compost product must comply with the Chinese agricultural industry standard NY/T 525-2021, which sets a pH requirement of 5.5–8.5 for mature compost [45]. At the end of composting, the EC values of all treatments remained above the ideal threshold of 4 mS cm−1 [44]. Elevated EC levels can inhibit plant growth by reducing seed germination rates, causing wilting, and even inducing phytotoxicity [46]. Nevertheless, all treatments achieved a GI of ≥80%, meeting the maturity standard for compost. It should be noted that high EC may also suppress microbial metabolic activity by altering cellular osmotic pressure [47]. Notably, the addition of CS significantly reduced EC, indicating mitigated salinity stress. This reduction may be attributed to the role of CS in facilitating the fixation or precipitation of mineral salts, thereby decreasing the soluble ion concentration in the final compost [48].
At the end of composting, although the differences in CEC among treatments were relatively minor (Figure 2c), the CS30% treatment exhibited the highest CEC value. The interrelationship between pH, EC, and CEC in this treatment provides important insights into the composting process. The lower pH value observed in CS30% was likely due to enhanced microbial activity, which promoted nitrification and the formation of organic acids, resulting in a milder alkaline environment (pH = 8.2). The decrease in pH further influenced EC by reducing the solubility and promoting the precipitation of certain mineral salts, thereby decreasing the ionic concentration in the compost. Simultaneously, the increase in CEC suggests greater formation of stable organic matter and humic substances, which provide additional cation exchange sites [49]. Although the buffering effect of the mildly alkaline environment may have reduced the overall differences in CEC among treatments, the higher CEC in CS30% nevertheless indicates a greater nutrient retention capacity, potentially reducing nutrient leaching and enhancing the agricultural value of the compost.
A GI exceeding 80% indicates that the compost meets the phytotoxicity threshold and is safe and suitable for use as a plant fertilizer [25]. This is consistent with the significantly lower EC values observed in these treatments compared to the control. The reduction in EC, indicating decreased salinity and lower concentration of soluble ions, likely contributed to the alleviation of salt stress on germinating seeds, thereby promoting higher germination rates and root elongation. Furthermore, the decomposition of organic matter and the formation of humic substances, accelerated by the elevated temperatures during composting, also played a crucial role in enhancing GI by providing beneficial compounds for root development [50], Although elevated pH levels can sometimes reduce nutrient availability and impair seed vigor [51], the lower pH in CS amended treatments compared to CK likely mitigated these adverse effects. The combined effects of reduced salinity (as reflected by lower EC) and the presence of growth-promoting humic substances ultimately led to the superior GI performance in CS treatments, demonstrating an improvement in overall compost quality.

4.2. Effect of CS Addition on Nutrient Retention During Composting

During composting, total N content in all treatments exhibited a gradual increase (Figure 3a). The increase was relatively slow in the first week, mainly due to microbial assimilation and NH3 volatilization [17,52]. Furthermore, as the rate of organic matter degradation exceeded the loss of N, the TN concentration increased slowly during this stage [53]. Throughout composting, the degradation of N–containing organic compounds reduced dry matter content, thereby increasing total N concentration [35,54]. Furthermore, in the later stages of composting, the decrease in pH facilitated the retention of NH4+-N through the formation of crystalline compounds such as struvite and calcite [17]. By the end of composting, the total N content in the CS-amended treatments significantly increased (p < 0.05) by 10.4–20.8% compared to the CK treatment, with the increase corresponding to higher substitution ratios. Additionally, the total N content in the CS30% and CS40% treatments was significantly higher (p < 0.05) by 5.5–9.4% compared to the CS10% treatment. This enhancement can be primarily attributed to the high intrinsic N content of CS, which served as an exogenous N source and improved the overall N balance in the composting system.
In the initial stage of composting, total P content decreased in all treatments (Figure 3b), likely due to enhanced microbial activity facilitating P uptake for cellular synthesis [55]. As the composting process progressed, the total P content gradually increased, likely due to the concentration effect resulting from the mass loss during organic matter decomposition and transformation [40]. It is noteworthy that although no significant differences were observed between the CS amended treatments and the CK, the TP content in the CS40% treatment was significantly lower (p < 0.05) than that in the other CS-treated groups. This phenomenon may be attributed to the combined effects of its elevated pH and higher CS incorporation ratio. The high CS substitution rate likely enhanced microbial assimilation and the retention of P within humic substances [56]. Furthermore, the relatively high pH in CS40% may have promoted the precipitation of P into sparingly soluble forms, such as struvite or calcium phosphates [57]. It is important to note that P retained in humic substances or as amorphous phosphate precipitates can be partially released through the action of low-molecular-weight organic acids exuded by plant roots, this slow-release mechanism of P availability may ultimately support plant growth [58].
The dynamics of total K content exhibited a distinct pattern compared to N and P. Since K is not subject to volatilization losses and no leachate was generated during composting, its concentration in all treatments showed a consistent increasing trend throughout the process (Figure 3c). At the end of composting, the TK contents in the CS30% and CS40% treatments were significantly lower (p < 0.05) than that in the CK. This phenomenon can be attributed to the temporary fixation of K into microbial biomass. Specifically, soluble K+ is widely utilized by microorganisms for cellular functions and growth [59]. In treatments with higher CS substitution, this K retention process may be more pronounced, leading to a further reduction in measurable TK content.
Total nutrient content (N + P2O5 + K2O) followed a decreasing trend followed by an increase (Figure 3d). According to the Chinese agricultural industry standard NY/T 525–2021, the total nutrient mass fraction should be ≥4.0%. All treatments had total nutrient contents significantly greater than 8.0%, meeting the requirements for organic fertilizer composting. Overall, the addition of CS has to some extent enhanced the retention of N, P, and K in the compost product. This has positive implications for improving the agronomic value of compost and reducing nutrient loss. However, practical application requires more detailed evaluation through subsequent field trials, soil quality assessments, and product analysis.
By the end of composting, NH4+-N (<0.4 g kg−1) and NO3-N (<0.16 g kg−1) contents in all treatments complied with the maturity standards for compost products [44]. Compared with the CK treatment, NH4+-N content was significantly higher in the CS40% treatment (Figure 4a), attributable to CS addition lowering the compost C/N ratio, which facilitated microbial degradation of organic N compounds such as proteins [11,13]. Furthermore, NO3-N content in the CS amended treatments exhibited a gradual decreasing trend with increasing CS substitution ratios (Figure 4b). Previous studies have demonstrated that cyanobacteria, the main component of CS, suppress the activity of nitrifying bacteria, consequently impacting NO3-N production [60].

4.3. Effects of CS Addition on NH3 Volatilization During Composting

NH3 volatilization is a major pathway of N loss during composting, which contributes to reduced compost quality and odor issues in the final product [13]. NH3 volatilization occurred predominantly during the thermophilic phase (Figure 5), and its dynamics were closely related to pile temperature, pH, and the transformation of N forms. In the initial stage of composting, the rapid temperature increase promoted the ammonification of nitrogenous organic matter, leading to a rise in NH4+-N concentration, which provided the substrate for NH3 volatilization [61]. Simultaneously, the increase in pH further drove the conversion of NH4+ to NH3 [62]. Subsequently, as the composting temperature declined, enhanced nitrification converted NH4+ into NO3, thereby reducing NH3 emissions [63]. Although all treatments exhibited this general trend, significant differences in volatilization intensity and temporal dynamics were observed among them, mainly reflected in the following aspects: The CK treatment exhibited the lowest peak and cumulative emissions of NH3. Notably, its emission peak occurred later, on the 12th day. This delayed peak is primarily linked to the treatment’s lower initial pH, which moderated the rate of ammonification [64], thereby limiting the rapid accumulation of NH4+-N and suppressing a concentrated release of NH3. In contrast, the NH3 emission peaks for the CS10% and CS20% treatments appeared earlier, on the 4th day; however, their peak intensities were lower than those in the high-CS treatments. The addition of an appropriate amount of CS slightly adjusted the C/N ratio of the composting mixture, leading to a shift in the microbial community that included a higher relative abundance of fungal biomass [65]. Consequently, this resulted in an earlier but less intense release of NH3. Conversely, the CS30% treatment demonstrated a characteristically high and early emission peak (on the 4th day), coupled with high cumulative emissions. The core reason for this pattern is that the CS addition significantly reduced the overall C/N ratio, creating a relative surplus of substrates for ammonification [13]. Furthermore, this treatment maintained a relatively higher pH level during the thermophilic phase, and these two factors synergistically promoted substantial NH3 generation and volatilization [66]. Finally, The CS40% treatment exhibited a delayed peak (on the 12th day) yet the highest cumulative emissions, which may have been caused by the low initial C/N ratio resulting from the high substitution ratio of CS. Initially, the ammonification process was potentially delayed due to factors such as carbon source structure or microbial inhibition [67]. However, as composting progressed, the excessive N substrates were continuously mineralized during the thermophilic phase and converted into NH3 under the prevailing high-pH conditions, leading to the highest N loss. Although NH3 emissions generally declined over time, certain treatments exhibited a transient increase followed by a subsequent decrease. This phenomenon may be attributed to increased oxygen availability during turning, which stimulated microbial activity and accelerated the decomposition process [62].
Based on previous reports, the addition of struvite can effectively reduce the cumulative NH3 volatilization during composting. This reduction is primarily attributed to the adsorption capacity and crystalline structure of struvite, which enables it to capture NH4+ generated in the compost, thereby mitigating NH3 emissions [57]. The formation of struvite crystals significantly minimizes gaseous N loss, leading to a substantial increase in N retention within the final compost product. Furthermore, the elevated pH associated with struvite addition can influence the microbial community structure and the abundance of functional genes involved in the N cycle [68]. In the present study, struvite was directly added to the composting mixture. Theoretically, struvite itself is a valuable compound fertilizer as it simultaneously supplies P, N, and magnesium. Future research should focus on optimizing the addition strategy of struvite (e.g., timing and rate) to maximize its benefits in N conservation and compost quality, and to further elucidate its long-term agronomic value.

4.4. Effects of CS Addition on the Safety of Compost Products

The degradation of microcystin primarily relies on microbial activity during the thermophilic phase. According to previous studies, most thermophilic microorganisms can utilize microcystin as a carbon source, thereby facilitating its effective degradation during composting [5]. However, when the CS substitution ratio exceeded 40%, microcystin concentrations increased significantly by the end of composting (Table 3), likely because higher initial concentrations reduce removal efficiency due to microbial inhibition or saturation [69]. Moreover, an excessively high CS substitution ratio lowers the compost C/N ratio, which markedly inhibits the degradation efficiency of microcystin [4].
The potential toxicity of compost for agricultural applications is typically assessed based on the total concentrations of heavy metals [70]. The transformation of heavy metal forms during composting primarily occurs alongside the degradation of organic matter [71]. First, organic matter is degraded by microorganisms and transformed into humic substances [72]. Subsequently, in an oxidative environment, metal ions react with these newly formed humic substances, leading to the formation of stable organic–metal complexes facilitated by microbial activity [73]. Although this complexation process is accompanied by a concentrating effect due to the reduction in compost mass from mineralization [41], it ultimately significantly reduces the solubility of heavy metals, resulting in a decrease in their detected concentration. Inter-group comparative analysis revealed that the concentrations of most heavy metals (e.g., As, Cd, Hg, and Pb) were significantly lower (p < 0.05) in CS-amended treatments compared to the CK treatment, showing a general declining trend with increasing CS substitution ratios (Table 4). This reduction can be attributed to the algal biomass in CS, which can immobilize heavy metals through cell wall adsorption and chelation, thereby contributing to their decreased concentrations [74]. This significant difference underscores the positive effect of CS addition on the immobilization of heavy metals. Notably, Cr concentrations did not consistently decrease, possibly because chromium primarily existed in a stable form that was resistant to degradation [75].

5. Conclusions

This study demonstrates that CS incorporation comprehensively enhanced the composting process across multiple quality dimensions. All CS-amended treatments successfully met maturity standards and agricultural safety requirements, confirming the feasibility of CS utilization. The principal finding identified 10% CS substitution as the optimal ratio, achieving the most favorable balance among key parameters: it significantly enhanced nutrient conservation (increasing TN by 10.4% and maintaining high TP content), effectively regulated pH dynamics, and minimized environmental impact through the lowest cumulative NH3 volatilization. Furthermore, CS addition consistently improved product safety by facilitating heavy metal immobilization and microcystin degradation. The 10% substitution ratio thus represents the optimal strategy for harmonizing nutrient enhancement, environmental protection, and product safety. These findings provide both theoretical insights and technical parameters for large-scale agricultural application of CS, offering a sustainable approach for agroforestry waste management while addressing eutrophication challenges through circular economy principles.

Author Contributions

Y.L.: Investigation, Data curation, Writing—original draft. Y.C. (Yudong Chen): Investigation, Writing—review and editing. Y.C. (Ying Chen): Investigation. Y.F.: Writing—review and editing, Conceptualization. H.S.: Writing—review and editing, Supervision, Funding acquisition, Conceptualization. All authors have read and agreed to the published version of the manuscript.

Funding

This work was financially supported by the Science and Technology Innovation Program of Jiangsu Province, China for “Carbon Dioxide Emission Peaking and Carbon Neutrality” (BE2022305), the Priority Academic Program Development of Jiangsu Higher Education Institutions (PAPD), and the National Key Research and Development Program of China (2017YFD0801300; 2016YFD0801100).

Institutional Review Board Statement

Not applicable.

Informed Consent Statement

Not applicable.

Data Availability Statement

Data supporting the findings of this study are available from the corresponding author upon reasonable request.

Acknowledgments

We would like to thank Wang Huang for helping us to produce the composting.

Conflicts of Interest

The authors declare no conflicts of interest.

References

  1. Zhang, M.; Duan, H.; Shi, X.; Yu, Y.; Kong, F. Contributions of Meteorology to the Phenology of Cyanobacterial Blooms: Implications for Future Climate Change. Water Res. 2012, 46, 442–452. [Google Scholar] [CrossRef] [PubMed]
  2. Wang, B.; Huang, T.; Zhu, L.; Hu, J.; Ma, S.; Sun, Q.; Chen, K. Effect of Cyanobacterial Bloom Proliferation on Antibiotic Resistance Genes in the Sediments of a Eutrophic Lake. Environ. Res. 2025, 278, 121717. [Google Scholar] [CrossRef] [PubMed]
  3. Yang, S.; Zuo, J.; Grossart, H.-P.; Dai, G.; Liu, J.; Song, L.; Gan, N. Evaluating Microcystinase A-Based Approach on Microcystins Degradation during Harvested Cyanobacterial Blooms. Environ. Pollut. 2024, 348, 123878. [Google Scholar] [CrossRef] [PubMed]
  4. Wu, H.; Wang, C.; Zhou, J.; Cong, H.; Gao, Y.; Cai, W.; Feng, S.; Zhang, C. Feedstock Optimization with Low Carbon to Nitrogen Ratio during Algal Sludge Aerobic Composting: Quality and Gaseous Emissions. Bioresour. Technol. 2025, 416, 131811. [Google Scholar] [CrossRef]
  5. Wu, H.; Zhou, J.; Zhang, S.; Gao, Y.; Wang, C.; Cong, H.; Feng, S. Contributions of the Bacterial Communities to the Microcystin Degradation and Nutrient Transformations during Aerobic Composting of Algal Sludge. J. Environ. Manag. 2024, 370, 122559. [Google Scholar] [CrossRef]
  6. Zhang, J.; Xu, X.; Lv, Y.; Zhu, W.; Zhang, H.; Ding, J.; Zhang, X.; Zhu, J.; Ding, Y. Research Progress on Influencing Factors on Compost Maturity and Cyanobacteria Toxin Degradation during Aerobic Cyanobacteria Composting: A Review. Environ. Sci. Pollut. Res. 2022, 29, 70635–70657. [Google Scholar] [CrossRef]
  7. Zhang, Z.; Hu, M.; Bian, B.; Yang, Z.; Yang, W.; Zhang, L. Full-Scale Thermophilic Aerobic Co-Composting of Blue-Green Algae Sludge with Livestock Faeces and Straw. Sci. Total Environ. 2021, 753, 142079. [Google Scholar] [CrossRef]
  8. Piash, M.I.; Itoh, T.; Abe, K.; Iwabuchi, K. Superior Nutrient Recovery and Release by Chicken Manure-Derived Biochar over Hydrochar and Compost for Soil Fertilization. Geoderma Reg. 2025, 40, e00906. [Google Scholar] [CrossRef]
  9. Mai, L.; Wang, D.; Lin, J.; Yan, Y.; Liu, H.; Cai, M.; Yang, X.; Li, Q. Role of Carbon Bioavailability in Enhancing Carbon Sequestration and Humification in Black Soldier Fly Larvae Body and Frass during Chicken Manure Composting. Environ. Technol. Innov. 2025, 37, 104036. [Google Scholar] [CrossRef]
  10. Hu, X.; Jing, Y.; Fu, N.; Wang, Y.; Qin, D.; Guo, X.; Wang, Y.; Wan, J. New Insight into Bacterial Communities of Chicken Manure Composting under Increased Carbon to Nitrogen Ratios: Spatial Heterogeneity in Diversity, Networks, and Assembly Processes. J. Environ. Chem. Eng. 2024, 12, 113624. [Google Scholar] [CrossRef]
  11. Han, W.; Clarke, W.; Pratt, S. Composting of Waste Algae: A Review. Waste Manag. 2014, 34, 1148–1155. [Google Scholar] [CrossRef] [PubMed]
  12. Ogunwande, G.A.; Osunade, J.A.; Adekalu, K.O.; Ogunjimi, L.A.O. Nitrogen Loss in Chicken Litter Compost as Affected by Carbon to Nitrogen Ratio and Turning Frequency. Bioresour. Technol. 2008, 99, 7495–7503. [Google Scholar] [CrossRef]
  13. Zhang, W.; Yu, C.; Wang, X.; Hai, L. Increased Abundance of Nitrogen Transforming Bacteria by Higher C/N Ratio Reduces the Total Losses of N and C in Chicken Manure and Corn Stover Mix Composting. Bioresour. Technol. 2020, 297, 122410. [Google Scholar] [CrossRef] [PubMed]
  14. Sun, H.; Zhang, H.; Powlson, D.; Min, J.; Shi, W. Rice Production, Nitrous Oxide Emission and Ammonia Volatilization as Impacted by the Nitrification Inhibitor 2-Chloro-6-(Trichloromethyl)-Pyridine. Field Crops Res. 2015, 173, 1–7. [Google Scholar] [CrossRef]
  15. Liu, X.; Zhang, Q.; Li, S.; Zhang, L.; Ren, J. Simulated NH4-N Deposition Inhibits CH4 Uptake and Promotes N2O Emission in the Meadow Steppe of Inner Mongolia, China. Pedosphere 2017, 27, 306–317. [Google Scholar] [CrossRef]
  16. Kithome, M.; Paul, J.W.; Bomke, A.A. Reducing Nitrogen Losses during Simulated Composting of Poultry Manure Using Adsorbents or Chemical Amendments. J. Environ. Qual. 1999, 28, 194–201. [Google Scholar] [CrossRef]
  17. Li, Y.; Luo, W.; Li, G.; Wang, K.; Gong, X. Performance of Phosphogypsum and Calcium Magnesium Phosphate Fertilizer for Nitrogen Conservation in Pig Manure Composting. Bioresour. Technol. 2018, 250, 53–59. [Google Scholar] [CrossRef]
  18. Luo, Q.; Wang, H.; Lu, X.; Wang, C.; Chen, R.; Cheng, J.; He, T.; Fu, T. Potential of Combined Reactor and Static Composting Applications for the Removal of Heavy Metals and Antibiotic Resistance Genes from Chicken Manure. J. Environ. Manag. 2024, 356, 120592. [Google Scholar] [CrossRef]
  19. Shan, G.; Wei, X.; Li, W.; Liu, J.; Bao, S.; Wang, S.; Zhu, L.; Xi, B.; Tan, W. Effect of Aqueous Phase from Hydrothermal Carbonization of Sewage Sludge on Heavy Metals and Heavy Metal Resistance Genes during Chicken Manure Composting. J. Hazard. Mater. 2024, 471, 134398. [Google Scholar] [CrossRef]
  20. Chugh, M.; Kumar, L.; Shah, M.P.; Bharadvaja, N. Algal Bioremediation of Heavy Metals: An Insight into Removal Mechanisms, Recovery of by-Products, Challenges, and Future Opportunities. Energy Nexus 2022, 7, 100129. [Google Scholar] [CrossRef]
  21. Muñoz, R.; Guieysse, B. Algal–Bacterial Processes for the Treatment of Hazardous Contaminants: A Review. Water Res. 2006, 40, 2799–2815. [Google Scholar] [CrossRef] [PubMed]
  22. Li, D.; Cheng, Y.; Li, T.; Sun, H.; Xue, L.; Cui, H.; Feng, Y.; Yang, L.; Chu, Q. Co-application of Biogas Slurry and Hydrothermal Carbonization Aqueous Phase Substitutes Urea as the Nitrogen Fertilizer and Mitigates Ammonia Volatilization from Paddy Soil. Environ. Pollut. 2021, 287, 117340. [Google Scholar] [CrossRef] [PubMed]
  23. Sun, H.; Chen, S.; Zhu, N.; Jeyakumar, P.; Wang, J.; Xie, W.; Feng, Y. Hydrothermal Carbonization Aqueous Phase Promotes Nutrient Retention and Humic Substance Formation during Aerobic Composting of Chicken Manure. Bioresour. Technol. 2023, 385, 129418. [Google Scholar] [CrossRef] [PubMed]
  24. Ren, L.; Schuchardt, F.; Shen, Y.; Li, G.; Li, C. Impact of Struvite Crystallization on Nitrogen Losses during Composting of Pig Manure and Cornstalk. Waste Manag. 2010, 30, 885–892. [Google Scholar] [CrossRef]
  25. Huang, W.; Sun, X.; Sun, H.; Feng, Y.; Gong, X.; Ma, Y.; Jiang, J.; Xue, L. Effects of Biochar and Wood Vinegar Co-application on Composting Ammonia and Nitrous Oxide Losses and Fertility. Bioresour. Technol. 2024, 412, 131388. [Google Scholar] [CrossRef]
  26. Wei, Y.; Liang, Z.; Zhang, Y. Evolution of Physicochemical Properties and Bacterial Community in Aerobic Composting of Swine Manure Based on a Patent Compost Tray. Bioresour. Technol. 2022, 343, 126136. [Google Scholar] [CrossRef]
  27. Bao, S. Soil Agrochemical Analysis; China Agriculture Press: Beijing, China, 2000. [Google Scholar]
  28. Bartos, J.M.; Boggs, B.L.; Falls, J.H.; Siegel, S.A. Determination of Phosphorus and Potassium in Commercial Inorganic Fertilizers by Inductively Coupled Plasma-Optical Emission Spectrometry: Single-Laboratory Validation. J. AOAC Int. 2014, 97, 687–699. [Google Scholar] [CrossRef]
  29. Xiang, L.; Li, Y.; Liu, B.; Zhao, H.; Li, H.; Cai, Q.; Mo, C.; Wong, M.; Li, Q. High Ecological and Human Health Risks from Microcystins in Vegetable Fields in Southern China. Environ. Int. 2019, 133, 105142. [Google Scholar] [CrossRef]
  30. HJ 1315-2023; Soil and Sediment—Determination of 19 Total Metal Elements—Inductively Coupled Plasma Mass Spectrometry. Ministry of Ecology and Environment of the People’s Republic of China: Beijing, China, 2023.
  31. Ren, X.; Wang, Q.; Awasthi, M.K.; Zhao, J.; Wang, J.; Liu, T.; Li, R.; Zhang, Z. Improvement of Cleaner Composting Production by Adding Diatomite: From the Nitrogen Conservation and Greenhouse Gas Emission. Bioresour. Technol. 2019, 286, 121377. [Google Scholar] [CrossRef]
  32. Ravindran, B.; Karmegam, N.; Awasthi, M.K.; Chang, S.W.; Selvi, P.K.; Balachandar, R.; Chinnappan, S.; Azelee, N.I.W.; Munuswamy-Ramanujam, G. Valorization of Food Waste and Poultry Manure through Co-composting Amending Saw Dust, Biochar and Mineral Salts for Value-Added Compost Production. Bioresour. Technol. 2022, 346, 126442. [Google Scholar] [CrossRef]
  33. Kumar, M.; Ou, Y.-L.; Lin, J.-G. Co-composting of Green Waste and Food Waste at Low C/N Ratio. Waste Manag. 2010, 30, 602–609. [Google Scholar] [CrossRef]
  34. Zhang, J.; Zhang, T.; Ying, Y.; Yao, X. Effects of Different Additives on the Chemical Composition and Microbial Diversity during Composting of Camellia Oleifera Shell. Bioresour. Technol. 2021, 330, 124990. [Google Scholar] [CrossRef]
  35. Li, R.; Wang, J.J.; Zhang, Z.; Shen, F.; Zhang, G.; Qin, R.; Li, X.; Xiao, R. Nutrient Transformations during Composting of Pig Manure with Bentonite. Bioresour. Technol. 2012, 121, 362–368. [Google Scholar] [CrossRef]
  36. Li, J.; Li, R.; Li, J. Current Research Scenario for Microcystins Biodegradation—A Review on Fundamental Knowledge, Application Prospects and Challenges. Sci. Total Environ. 2017, 595, 615–632. [Google Scholar] [CrossRef]
  37. Li, S.; Li, D.; Li, J.; Li, Y.; Li, G.; Zang, B.; Li, Y. Effect of Spent Mushroom Substrate as a Bulking Agent on Gaseous Emissions and Compost Quality during Pig Manure Composting. Environ. Sci. Pollut. Res. 2018, 25, 12398–12406. [Google Scholar] [CrossRef]
  38. Feng, D.; Cui, Y.; Zeng, Y.; Wang, D.; Zhang, H.; Zhang, Y.; Song, W. Enhancing Compost Quality through Biochar and Oyster Shell Amendments in the Co-composting of Seaweed and Sugar Residue. Chemosphere 2024, 366, 143500. [Google Scholar] [CrossRef]
  39. Sun, C.; Wei, Y.; Kou, J.; Han, Z.; Shi, Q.; Liu, L.; Sun, Z. Improve Spent Mushroom Substrate Decomposition, Bacterial Community and Mature Compost Quality by Adding Cellulase during Composting. J. Clean. Prod. 2021, 299, 126928. [Google Scholar] [CrossRef]
  40. Wang, Q.; Wang, Z.; Awasthi, M.K.; Jiang, Y.; Li, R.; Ren, X.; Zhao, J.; Shen, F.; Wang, M.; Zhang, Z. Evaluation of Medical Stone Amendment for the Reduction of Nitrogen Loss and Bioavailability of Heavy Metals during Pig Manure Composting. Bioresour. Technol. 2016, 220, 297–304. [Google Scholar] [CrossRef] [PubMed]
  41. Singh, J.; Kalamdhad, A.S. Assessment of Bioavailability and Leachability of Heavy Metals during Rotary Drum Composting of Green Waste (Water Hyacinth). Ecol. Eng. 2013, 52, 59–69. [Google Scholar] [CrossRef]
  42. Liu, C.; Li, H.; Ni, J.-Q.; Zhuo, G.; Chen, W.; Zheng, Y.; Zhen, G. Effect of Municipal Sludge-Based Biochar Produced at Different Pyrolysis Temperatures on Humification and Oxytetracycline Degradation of Pig Manure Composting. Sci. Total Environ. 2024, 906, 167816. [Google Scholar] [CrossRef] [PubMed]
  43. Li, H.; Zhang, T.; Tsang, D.C.W.; Li, G. Effects of External Additives: Biochar, Bentonite, Phosphate, on Co-composting for Swine Manure and Corn Straw. Chemosphere 2020, 248, 125927. [Google Scholar] [CrossRef] [PubMed]
  44. Bernal, M.P.; Alburquerque, J.A.; Moral, R. Composting of Animal Manures and Chemical Criteria for Compost Maturity Assessment. A Review. Bioresour. Technol. 2009, 100, 5444–5453. [Google Scholar] [CrossRef] [PubMed]
  45. Kong, Y.; Zhang, J.; Zhang, X.; Gao, X.; Yin, J.; Wang, G.; Li, J.; Li, G.; Cui, Z.; Yuan, J. Applicability and Limitation of Compost Maturity Evaluation Indicators: A Review. Chem. Eng. J. 2024, 489, 151386. [Google Scholar] [CrossRef]
  46. Li, L.; Guo, X.; Zhao, T.; Li, T. Green Waste Composting with Bean Dregs, Tea Residue, and Biochar: Effects on Organic Matter Degradation, Humification and Compost Maturity. Environ. Technol. Innov. 2021, 24, 101887. [Google Scholar] [CrossRef]
  47. Wu, J.; Zhang, A.; Li, G.; Wei, Y.; He, S.; Lin, Z.; Shen, X.; Wang, Q. Effect of Different Components of Single Superphosphate on Organic Matter Degradation and Maturity during Pig Manure Composting. Sci. Total Environ. 2019, 646, 587–594. [Google Scholar] [CrossRef]
  48. Sun, X.; Awasthi, M.K.; Syed, A.; Bahkali, A.H. Effect of Cyanobacteria Biochar Addition on Humification, Fungal Dynamics and Its Mechanism of Action in Pig Manure Composting. J. Environ. Chem. Eng. 2024, 12, 113755. [Google Scholar] [CrossRef]
  49. Karak, T.; Sonar, I.; Paul, R.K.; Das, S.; Boruah, R.K.; Dutta, A.K.; Das, D.K. Composting of Cow Dung and Crop Residues Using Termite Mounds as Bulking Agent. Bioresour. Technol. 2014, 169, 731–741. [Google Scholar] [CrossRef]
  50. Yang, Y.; Wang, G.; Li, G.; Ma, R.; Kong, Y.; Yuan, J. Selection of Sensitive Seeds for Evaluation of Compost Maturity with the Seed Germination Index. Waste Manag. 2021, 136, 238–243. [Google Scholar] [CrossRef]
  51. Liu, T.; Wang, M.; Awasthi, M.K.; Chen, H.; Awasthi, S.K.; Duan, Y.; Zhang, Z. Measurement of Cow Manure Compost Toxicity and Maturity Based on Weed Seed Germination. J. Clean. Prod. 2020, 245, 118894. [Google Scholar] [CrossRef]
  52. Awasthi, M.K.; Wang, Q.; Huang, H.; Li, R.; Shen, F.; Lahori, A.H.; Wang, P.; Guo, D.; Guo, Z.; Jiang, S.; et al. Effect of Biochar Amendment on Greenhouse Gas Emission and Bio-Availability of Heavy Metals during Sewage Sludge Co-Composting. J. Clean. Prod. 2016, 135, 829–835. [Google Scholar] [CrossRef]
  53. Shan, G.; Li, W.; Tan, W.; Bao, S.; Liu, J.; Wang, S.; Zhu, L.; Chen, L.; Xi, B. Effect of the Aqueous Phase from the Hydrothermal Carbonization of Sewage Sludge as a Moisture Regulator on Nitrogen Retention and Humification during Chicken Manure Composting. Chem. Eng. J. 2023, 470, 144398. [Google Scholar] [CrossRef]
  54. Wong, J.W.-C.; Fung, S.O.; Selvam, A. Coal Fly Ash and Lime Addition Enhances the Rate and Efficiency of Decomposition of Food Waste during Composting. Bioresour. Technol. 2009, 100, 3324–3331. [Google Scholar] [CrossRef]
  55. Meng, X.; Liu, B.; Zhang, H.; Wu, J.; Yuan, X.; Cui, Z. Co-Composting of the Biogas Residues and Spent Mushroom Substrate: Physicochemical Properties and Maturity Assessment. Bioresour. Technol. 2019, 276, 281–287. [Google Scholar] [CrossRef]
  56. Haouas, A.; El Modafar, C.; Douira, A.; Ibnsouda-Koraichi, S.; Filali-Maltouf, A.; Moukhli, A.; Amir, S. Evaluation of the Nutrients Cycle, Humification Process, and Agronomic Efficiency of Organic Wastes Composting Enriched with Phosphate Sludge. J. Clean. Prod. 2021, 302, 127051. [Google Scholar] [CrossRef]
  57. Fukumoto, Y.; Suzuki, K.; Kuroda, K.; Waki, M.; Yasuda, T. Effects of Struvite Formation and Nitratation Promotion on Nitrogenous Emissions Such as NH3, N2O and NO during Swine Manure Composting. Bioresour. Technol. 2011, 102, 1468–1474. [Google Scholar] [CrossRef] [PubMed]
  58. Zhang, J.; Wu, Z.; Huang, Y.; Zhan, X.; Zhang, Y.; Cai, C. Industrial-Scale Composting of Swine Manure with a Novel Additive-Yellow Phosphorus Slag: Variation in Maturity Indicators, Compost Quality and Phosphorus Speciation. Bioresour. Technol. 2023, 384, 129356. [Google Scholar] [CrossRef]
  59. Zhen, X.F.; Luo, M.; Dong, H.Y.; Li, S.B.; Li, M.C.; Kang, J. Variations of N-P-K Contents in Livestock and Livestock Manure Composting. Appl. Ecol. Environ. Res. 2021, 19, 249–261. [Google Scholar] [CrossRef]
  60. Choi, O.; Das, A.; Yu, C.; Hu, Z. Nitrifying Bacterial Growth Inhibition in the Presence of Algae and Cyanobacteria. Biotechnol. Bioeng. 2010, 107, 1004–1011. [Google Scholar] [CrossRef]
  61. Yuan, J.; Chadwick, D.; Zhang, D.; Li, G.; Chen, S.; Luo, W.; Du, L.; He, S.; Peng, S. Effects of Aeration Rate on Maturity and Gaseous Emissions during Sewage Sludge Composting. Waste Manag. 2016, 56, 403–410. [Google Scholar] [CrossRef]
  62. Huang, W.; Sun, H.; Sun, X.; Gong, X.; Bian, R.; Wang, Y.; Jiang, J.; Xue, L.; Feng, Y. Co-Amendment of Dicyandiamide with Waste Carbonization Products into Composting: Enhanced Fertility, Reduced Gas Emission and Increased Economic Benefits. J. Clean. Prod. 2024, 471, 143379. [Google Scholar] [CrossRef]
  63. Cui, Y.; Zeng, Y.; Hu, H.; Zhang, Y.; Wang, D.; Feng, D. Biochar, Phosphate, and Magnesium Oxide in Seaweed and Cornstarch Dregs Co-Composting: Enhancing Organic Matter Degradation, Humification, and Nitrogen Retention. Waste Manag. 2024, 187, 207–217. [Google Scholar] [CrossRef] [PubMed]
  64. Ma, F.; Chen, Q.; Quan, H.; Zhao, C.; Wang, Y.; Zhu, T. Combined Treatment for Chicken Manure and Kitchen Waste Enhances Composting Effect by Improving pH and C/N. Waste Biomass Valor 2025, 16, 613–625. [Google Scholar] [CrossRef]
  65. Eiland, F.; Klamer, M.; Lind, A.-M.; Leth, M.; Bååth, E. Influence of Initial C/N Ratio on Chemical and Microbial Composition during Long Term Composting of Straw. Microb. Ecol. 2001, 41, 272–280. [Google Scholar] [CrossRef] [PubMed]
  66. Jiang, J.; Huang, Y.; Liu, X.; Huang, H. The Effects of Apple Pomace, Bentonite and Calcium Superphosphate on Swine Manure Aerobic Composting. Waste Manag. 2014, 34, 1595–1602. [Google Scholar] [CrossRef]
  67. Haynes, R.J.; Zhou, Y.-F. Comparison of the Chemical, Physical and Microbial Properties of Composts Produced by Conventional Composting or Vermicomposting Using the Same Feedstocks. Environ. Sci. Pollut. Res. 2016, 23, 10763–10772. [Google Scholar] [CrossRef]
  68. Wang, L.; Ye, C.; Gao, B.; Wang, X.; Li, Y.; Ding, K.; Li, H.; Ren, K.; Chen, S.; Wang, W.; et al. Applying Struvite as a N-Fertilizer to Mitigate N2O Emissions in Agriculture: Feasibility and Mechanism. J. Environ. Manag. 2023, 330, 117143. [Google Scholar] [CrossRef]
  69. Wang, J.; Zhang, J.; Shangguan, Y.; Yang, G.; Liu, X. Degradation Performance and Mechanism of Microcystins in Aquaculture Water Using Low-Temperature Plasma Technology. Environ. Pollut. 2024, 347, 123744. [Google Scholar] [CrossRef]
  70. Chen, Y.; Liu, Y.; Li, Y.; Wu, Y.; Chen, Y.; Zeng, G.; Zhang, J.; Li, H. Influence of Biochar on Heavy Metals and Microbial Community during Composting of River Sediment with Agricultural Wastes. Bioresour. Technol. 2017, 243, 347–355. [Google Scholar] [CrossRef]
  71. Hazarika, J.; Ghosh, U.; Kalamdhad, A.S.; Khwairakpam, M.; Singh, J. Transformation of Elemental Toxic Metals into Immobile Fractions in Paper Mill Sludge through Rotary Drum Composting. Ecol. Eng. 2017, 101, 185–192. [Google Scholar] [CrossRef]
  72. Amir, S.; Hafidi, M.; Merlina, G.; Revel, J.-C. Sequential Extraction of Heavy Metals during Composting of Sewage Sludge. Chemosphere 2005, 59, 801–810. [Google Scholar] [CrossRef]
  73. Wei, Y.; Zhao, Y.; Zhao, X.; Gao, X.; Zheng, Y.; Zuo, H.; Wei, Z. Roles of Different Humin and Heavy-Metal Resistant Bacteria from Composting on Heavy Metal Removal. Bioresour. Technol. 2020, 296, 122375. [Google Scholar] [CrossRef]
  74. Kalita, N.; Baruah, P.P. Cyanobacteria as a Potent Platform for Heavy Metals Biosorption: Uptake, Responses and Removal Mechanisms. J. Hazard. Mater. Adv. 2023, 11, 100349. [Google Scholar] [CrossRef]
  75. Chen, L.; Yi, Z.; Chen, Y.; Li, Y.; Jiang, H.; Wang, J.; Chen, Y.; Nie, Y.; Luo, M.; Wang, Q.; et al. Improved Humification and Cr (VI) Immobilization by CaO2 and Fe3O4 during Composting. Bioresour. Technol. 2024, 413, 131479. [Google Scholar] [CrossRef]
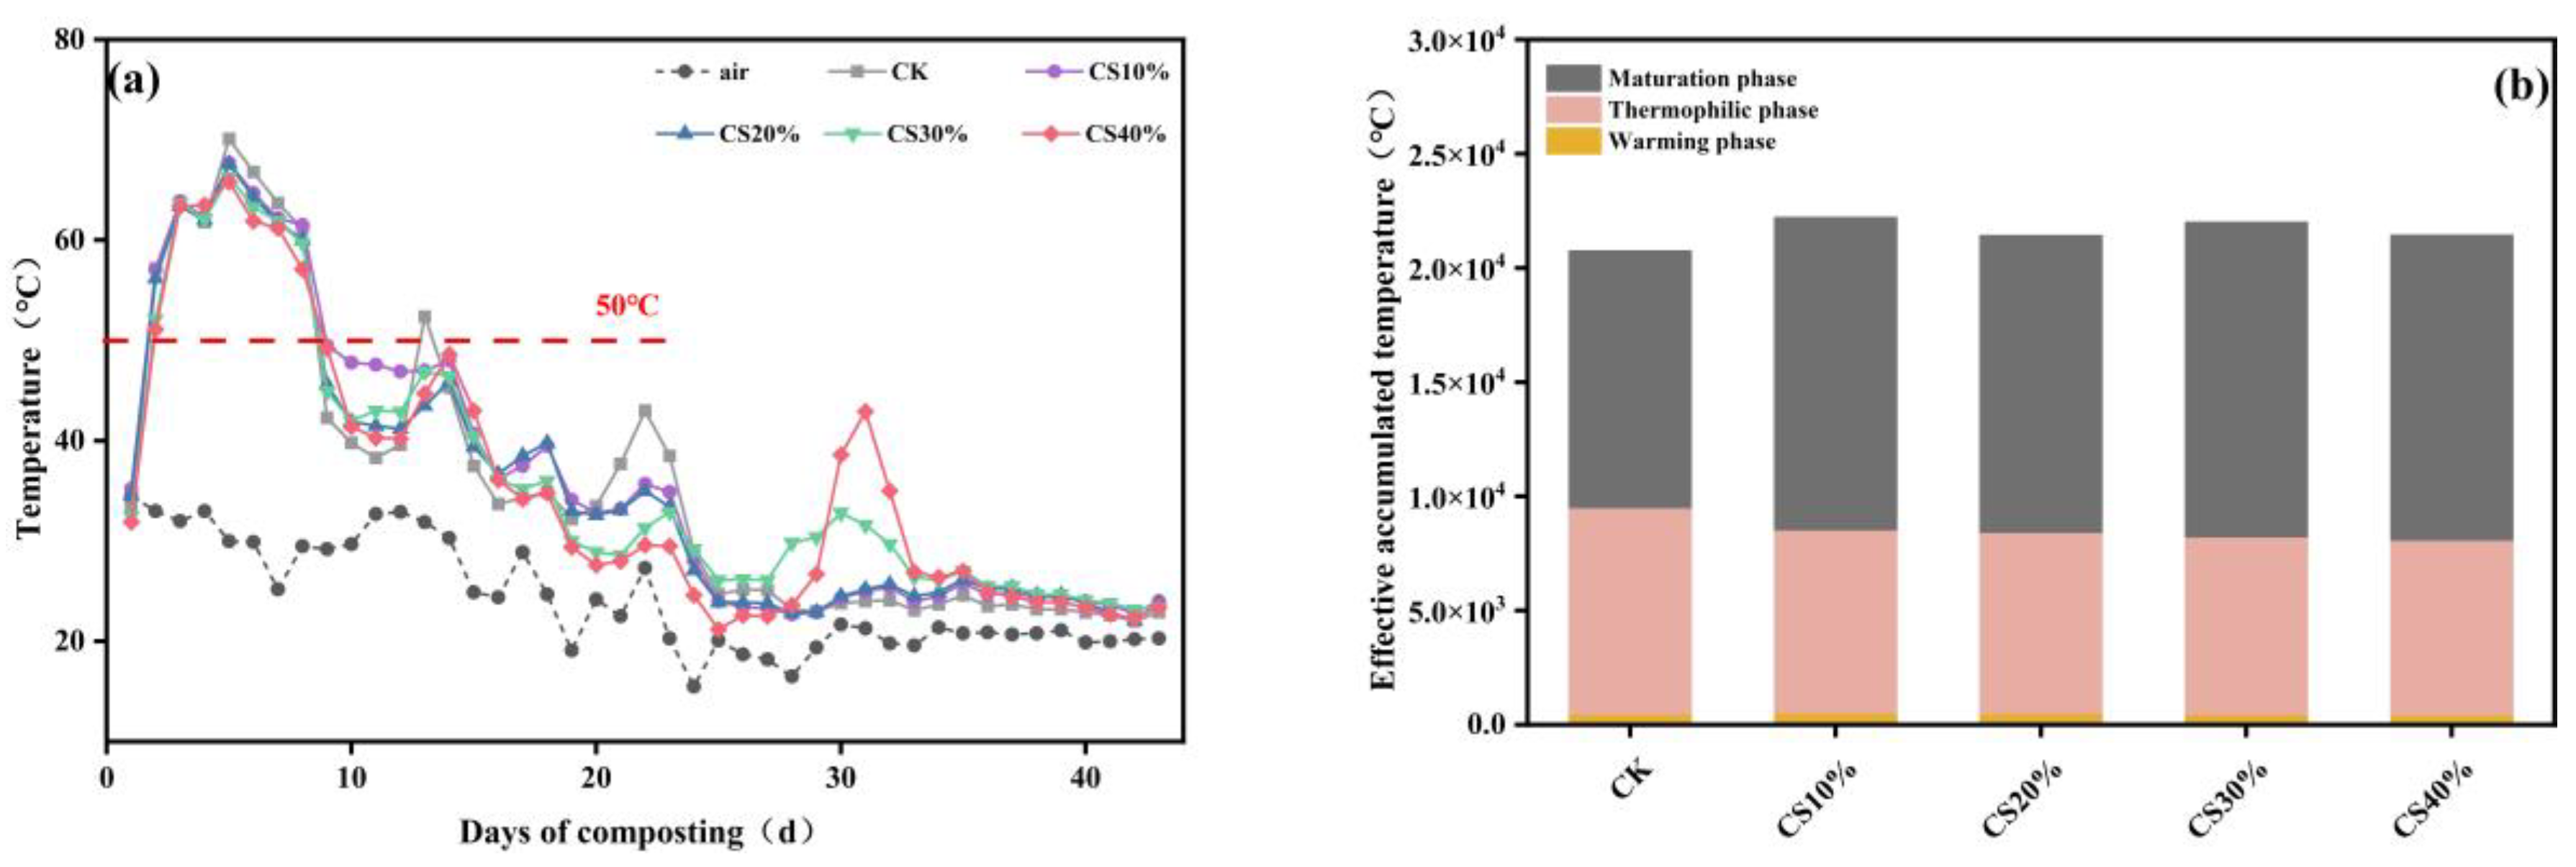
Figure 1. The dynamic changes in temperature (a) and effective accumulated temperature (b) during composting.
Agronomy 15 02429 g001
Figure 2. The dynamic changes in pH (a), EC (b), CEC (c), and GI (d) during composting. Data are expressed as mean ± SD (n = 3). Different letters denote statistically significant differences among treatments (p < 0.05).
Agronomy 15 02429 g002
Figure 3. The dynamic changes in the contents of total N (a), total P (b), total K (c), and total nutrients (N and P plus K, (d)) in the compost samples collected during the composting. Data are presented as mean ± SD (n = 3). Different letters indicate significant differences among treatments (p < 0.05).
Agronomy 15 02429 g003
Figure 4. The contents of NH4+-N (a) and NO3-N (b) in the compost samples collected after the composting. Data are presented as mean ± SD (n = 3). Different letters indicate significant differences among treatments (p < 0.05).
Agronomy 15 02429 g004
Figure 5. The dynamic changes in NH3 volatilization and the cumulative total during the composting. Data are presented as mean ± SD (n = 3). Different letters indicate significant differences among treatments (p < 0.05).
Agronomy 15 02429 g005
Table 1. Basic properties of composting materials.
Tested MaterialsMoistureOrganic MatterTotal NTotal PTotal K
% (g kg−1)
CS23.4410.274.1109.817.5
Chicken manure10.5345.976.032.78.8
Wheat Straw3.7647.77.28.7178.5
Note: Organic matter, Total N, Total phosphorus (P), and Total Potassium (K) are all expressed on a dry matter basis.
Table 2. Material Proportions of Different Composting Treatments (Unit: kg).
TreatmentsChicken ManureWheat StrawStruviteCS
CK5.43.60.27
CS10%4.863.60.270.54
CS20%4.323.60.271.08
CS30%3.783.60.271.62
CS40%3.243.60.272.16
Note: In the table, the “–” indicates that no CS was added to the corresponding treatment, respectively. The struvite was added at a rate of 3%, calculated based on the total mass of the organic materials (chicken manure + wheat straw).
Table 3. The content of microcystins and degradation rates in the final compost samples.
TreatmentsMicrocystins Content (μg kg−1)Degradation Rate (%)
Microcystin–RRMicrocystin–LRMicrocystin–RRMicrocystin–LR
CS10%52.7 ± 27.6 b33.5 ± 13.6 b35.7%30.2%
CS20%57.7 ± 13.2 b39.1 ± 0.2 b65.9%59.3%
CS30%50.5 ± 7.9 b31.9 ± 3.3 b79.5%77.9%
CS40%123.7 ± 2.4 a75.4 ± 2.9 a62.3%60.7%
Note: Data are presented as mean ± standard deviation (n = 3). Different lowercase letters indicate significant differences among treatments at p < 0.05.
Table 4. The content of selected heavy metals in the final compost samples.
TreatmentsAsCdCrHgPb
(mg kg−1)
NY/T≤15≤3≤150≤2≤50
CK1.53 ± 0.01 a1.14 ± 0.03 a35.00 ± 0.70 c0.03 ± 0.00 a6.48 ± 0.01 a
CS10%1.00 ± 0.02 b0.60 ± 0.02 b29.40 ± 0.30 e0.02 ± 0.00 b4.58 ± 0.04 b
CS20%1.09 ± 0.15 b0.41 ± 0.02 c39.30 ± 0.80 a0.02 ± 0.00 b4.26 ± 0.12 c
CS30%0.91 ± 0.07 cd0.24 ± 0.01 d37.85 ± 0.65 b0.02 ± 0.00 b4.12 ± 0.00 d
CS40%0.82 ± 0.04 d0.25 ± 0.00 d32.85 ± 0.35 d0.02 ± 0.00 b4.26 ± 0.12 c
Note: Data are presented as mean ± SD (n = 3). Different letters indicate significant differences among treatments (p < 0.05). Standard: Agricultural Industry Standard of the People’s Republic of China NY/T 525-2021.
Disclaimer/Publisher’s Note: The statements, opinions and data contained in all publications are solely those of the individual author(s) and contributor(s) and not of MDPI and/or the editor(s). MDPI and/or the editor(s) disclaim responsibility for any injury to people or property resulting from any ideas, methods, instructions or products referred to in the content.