Article

Responses of Soilless-Cultivated Golden Thistle to the Total Salt and Nitrogen Concentrations in the Nutrient Solution

by
Filippa Maniou
1,
Dimitrios M. Papadimitriou
2,
Evangelos Giannothanasis
1,
Theodora Ntanasi
1,
Panagiotis Kalozoumis
1,
Thrassyvoulos Manios
2,
Georgia Ntatsi
1 and
Dimitrios Savvas
1,*
1
Laboratory of Vegetable Production, Agricultural University of Athens, Iera Odos 75, 11855 Athens, Greece
2
Laboratory of Natural Resources Management & Agricultural Engineering, Department of Agriculture, Hellenic Mediterranean University, Estavromenos, 71410 Heraklion, Greece
*
Author to whom correspondence should be addressed.
Agronomy 2025, 15(10), 2287; https://doi.org/10.3390/agronomy15102287
Submission received: 21 August 2025 / Revised: 12 September 2025 / Accepted: 25 September 2025 / Published: 26 September 2025
(This article belongs to the Section Horticultural and Floricultural Crops)

Abstract

Golden thistle (Scolymus hispanicus L.) is a wild edible green of high nutritional value, used in the traditional Mediterranean diet. Nowadays, there is an increasing demand from consumers for golden thistle and concomitantly an increasing interest in integrating it into modern cultivation systems. Soilless culture is a promising cultivation option that can maximize yield and quality of golden thistle. The aim of this study was to examine the combined effect of electrical conductivity (EC) and nitrogen (N) supply level on growth and nutritional quality of golden thistle grown on a substrate in a soilless cropping system. The two experimental factors were examined in a 2-factorial experiment with two EC levels, a low (2.2 dS m−1) and high (2.8 dS m−1), combined with two total-N (NO3 + NH4+) supply levels, low (13.30 mmol L−1) and high (17.30 mmoL L−1), in the supplied nutrient solution. Root fresh and dry weight (commercial yield) were unaffected by treatments; however, high EC significantly reduced shoot fresh and dry biomass by 21 and 28% compared to low EC. High EC increased K+ concentrations in shoots and roots but decreased shoot Ca2+ level. Nitrate concentration in the drainage solution and plant tissues was primarily driven by N supply, with high N increasing leaf NO3 by up to 45% without surpassing the regulatory safety limit. Water productivity did not differ among treatments, but low EC improved agronomic efficiency of K+, Ca2+, Mg2+, and S, while low N enhanced N agronomic efficiency by 44%. Overall, low EC promoted vegetative growth and nutrient use efficiency, while increasing N above 13.3 mmol L−1 offered no yield benefit and raised tissue nitrate levels. For optimal yield and quality, a nutrient solution with low EC and N supply is recommended for the soilless cultivation of golden thistle.

1. Introduction

Golden thistle (Scolymus hispanicus L.) is a biennial wild edible green native to southern and western Europe that grows primarily in uncultivated fields, roadsides, and sandy soils [1]. According to the traditional Mediterranean cuisine, the petiole, midrib, and root cortex of the plant are usually consumed in raw, boiled, or fried form [1,2]. The petiole can be consumed from young plants before the formation of spines around the leaf blade, and only the leaf midrib and root cortex can be consumed from fully mature plants. Golden thistle undergoes an initial growth phase of approximately two months, during which leaf area development predominates. Concomitantly, after the first three months following transplanting, assimilates are increasingly allocated to the root system, leading to the cortical parenchyma expansion and the subsequent formation of edible root biomass [1,3,4]. Therefore, hydroponically grown plants are recommended to be harvested for edible leaves two months before transplanting, and after three months for root cortex production.
The edible wild vegetables, such as golden thistle, are recently receiving renewed attention from the consumers and farmers [5,6]. Furthermore, EU encourages the integration of alternative crops to promote biodiversity and improve the sustainability of the agriculture sector [7]. Consumer interest is mainly driven by their increased concentration of valuable nutrient elements such as K, Mg, Fe, Cu, Mn and Ca, vitamins C, B9, and K, and antioxidant bioactive compounds [1,8,9,10,11]. In particular, S. hispanicus L. is a rich source of vitamins (B9, K, A), minerals (K, Ca, Fe) and other bioactive compounds such as ω-3 fatty acid, β-carotene, phenolics and flavonoids with antioxidant activity [12,13,14]. Examining the special needs of wild edible species to be cultivated in modern production systems, such as soilless culture, can pave the way to increased product availability and meet the increasing consumer demand.
Integration in soilless cultivation systems has been proposed as an alternative approach to maximize yield and stabilize the product quality of wild edible vegetables, while reducing the pressure faced in their natural habitats [6,15,16]. Many studies investigated the nutrient requirements for soilless cultivation of different wild edible species suggesting different plant response to the nutrient supply, highlighting the need of focused research to develop a plant soilless cultivation protocol. In Portulaca oleracea cultivation, nitrogen (N) concentration in the nutrient solution can be reduced to 9.8 mM without yield restriction, under an EC of 2.6 dS m−1, while the ammonium to N ratio should be carefully adjusted even in the cultivation system (substrate or hydroponic) [17,18]. Furthermore, similar levels of N in the supplied nutrient solution are adequate for lettuce, spinach, and Sonchus oleraceus growth [11,19], while in the case of Cichorium spinosum, the N supply can be restricted up to 4 mM without negative impact on yield [20]. On the other hand, Mesembryanthemum crystallinum growth enhanced under high EC in the root environment, while it is sensitive plant to ammonia toxicity [21,22]. S. hispanicus had also been investigated previously for the response to different nutrient solution compositions revealing the plants preference in N fertilization, the moderate tolerant to moderate salinity levels of the nutrient solution and the needs in P and K supply [1,2,3]. However, there are still important scientific gaps about the species-specific nutritional requirements to effectively grow it in soilless systems.
Nitrogen (N) is the macronutrient required in the largest quantity by plants and is fundamental to plant growth and metabolism, serving as a key component of proteins, amino acids, chlorophyll, and nucleic acids, and supporting essential functions such as the synthesis of the secondary metabolites and enzyme activity [22]. Plants absorb N mainly in the mineral forms of nitrate (NO3) and ammonium (NH4+). In soilless systems, N is typically supplied predominantly as NO3, with smaller proportions of NH4+ to manage root-zone pH and reduce the risk of ammonium toxicity [23]. The reduction in pH is primarily determined by the NH4+/total-N ratio, due to the preferential uptake of NH4+ by roots, even though NO3 remains the major N form taken up by most [24]. Assimilation of these forms into amino acids occurs mainly via the glutamine synthetase/glutamate synthase pathway and is strongly influenced by photosynthetically active radiation, as higher light intensity promotes NO3 reduction and incorporation into organic compounds [25]. In hydroponic leafy vegetables such as lettuce, excessive NO3 in the root zone can increase uptake beyond plant needs, leading to NO3 accumulation in edible tissues [26]. This is a critical food safety concern, and the European Union has set strict limits of 3000–5000 mg NO3 kg−1 fresh weight, depending on the season and production system (Regulation No1258/2011). Balancing N supply to meet crop requirements while avoiding excess is therefore essential for achieving high yield, maintaining product quality, and ensuring compliance with safety regulations.
Electrical conductivity (EC) in soilless cultivation serves as a key indicator of the total salt concentration within a supplied nutrient solution, reflecting the ionic strength of the root environment [23]. Deviations from this range may have adverse effects. Low EC values often result in nutrient depletions in the root environment leading to deficiencies, while high EC in the root zone, depending on the plant species, imposes salinity stress and restrict plant growth [27,28,29,30]. Notably, the actual EC in the root zone may differ from the supplied nutrient solution due to plant uptake dynamics and environmental interactions. Therefore, regular monitoring of the EC in the drainage solution is essential for maintaining optimal root-zone conditions and adapting the EC in the supplied nutrient solution to avoid depletion or salt accumulation [31]. Consequently, as EC is a major parameter for nutrient solutions associated with both the supply levels of individual macronutrients and the total salt concentration, it is crucial to establish a target level in the supplied NS that maintains optimal EC and macronutrient levels in the root solution [32].
Taking the above into account, and the limited information on the nutrient requirements of golden thistle regarding EC and N level in the nutrient solution, the objective of the present study was to investigate the effect of different levels of both parameters on yield and nutritional quality of golden thistle grown in a substrate soilless cropping system. Concomitantly, here, a two–factorial experiment was designed by applying two EC levels, low (2.2 dS m−1) and high (2.8 dS m−1), combined with two N (NO3 + NH4+) concentrations levels, low (13.3 mmol L−1) and high, (17.30 mmol L−1) in the supplied nutrient solution.

2. Materials and Methods

2.1. The Cultivation Practices

Seeds of golden thistle were collected from local biotypes of Chantras region of Crete province (35°1′ N 25°15′ E, altitude of 560 m) in autumn 2023, as commercial seeds are not available. Seeds were kept at room temperature until the sowing date for seedling production. The experimental cultivation was carried out in a glasshouse of the Laboratory of Vegetables Production in Agricultural University of Athens (37°58′54.2″ N 23°42′22.0″ E, altitude 35 m), under natural lighting conditions. The glasshouse was equipped with a heating system with overhead hot water pipes, and it was passively ventilated through top and side windows to maintain the day and night temperature at 22 °C and 17 °C, respectively, and the relative humidity at 60–80%. The plants cultivated in an open soilless system consisted of 8 different gutters, with 6 perlite growing bags placed in each one. Sowing took place on 21 November 2023 in trays (30 × 50 cm) filled with a mixture of peat and perlite (3:1). Four weeks after sowing on 22 December 2023, seedlings at the two true leaf stage were transplanted into perlite bags of 33 L (100 × 20 × 16.5 cm), considered as 0 days after transplanting (DAT). Each substrate bag accommodated three plants. Before transplanting, the substrate was filled with starter nutrient solution and three holes at the bottom of each grow bag were opened after transplanting to allow for free drainage. The nutrient solutions were prepared manually by adding A and B concentrated fertilizer solution to raw water, aiming to target EC and subsequently the pH was adjusted by nitric acid addition [33]. The nutrient solution was delivered to the plants at a rate of 4 L h−1 via a drip irrigation system equipped with an individual emitter per plant, and the irrigation frequency was based on cumulative solar radiation measured using a pyranometer. The drainage solution from each gutter was collected and its volume was measured daily to calculate the plant water consumption and adjust the irrigation frequency aiming at a drainage fraction of 0.30. The experiment was terminated on 27 March 2024 (96 DAT), prioritizing root cortex production.

2.2. Experimental Setup

Different EC and N levels in the supplied nutrient solution were the two experimental factors. Four treatments, with low EC (LEC) and high EC (HEC) levels combined with low N (LN) and high N (HN) concentration, were tested. Each treatment had 4 replicates, each one consisting of 3 growing bags. In the supplied nutrient solution, the LEC and HEC levels were 2.2 and 2.8 dS m−1, respectively, while the LN concentration was set at 13.3 mmol L−1 of total N (NO3 + NH4+) and HN at 17.30 mmol L−1, respectively. The different nutrient solution compositions were designed according to recently published data of two studies that accessed wilder ranges of EC and N levels [1,4] using the Decision Support System NUTRISENSE [33] and presented in Table 1.

2.3. Sampling and Plant Growth Measurements

Two harvest cycles took place on 8 February (48 DAT) and on 27 March (96 DAT), respectively (Figure 1). At 48 DAT, 1 plant per replication was collected, with the objective to determine the plant nutrient status, while at 96 DAT, the rest of the crop were harvested to measure the yield. On each harvest day, the whole plant was uprooted, and the shoot was separated from the roots. In the present study, plants were harvested at 48 DAT, prior to two months after transplanting, and at 96 DAT, beyond the first three months of growth, to assess the nutrient concentrations of both the shoot and root tissues. The number of leaves, the shoot and the root fresh weight were measured immediately. Shoot and root tissues were dried separately in a forced-air oven at 65 °C to constant weight for shoot and root dry weight and nutrient content determination. The total volume of drainage solution was collected weekly and a sample was analyzed from each gutter on 13, 20, 27, 34, 41, 48, 55, 62, 69, 76, 83, 90 and 95 DAT. Water productivity (WP) was calculated as the weight of fruit produced per volume of water used (kg m−3) [34,35]. The agronomic efficiency (AE) of the N, P, K, Ca, Mg, and S (AEN, AEP, AEK, AECa, AEMg, and AES, respectively) were calculated as kg of fruit produced per kg of supplied nutrient (kg kg−1) in accordance with the suggestion of Ladha et al. [36] for AEN.

2.4. Laboratory Analysis

Tissue mineral concentrations were measured in samples of dry biomass collected on both harvest dates (48 and 96 DAT). The dried shoot and root tissues were ground using a blade mill and subjected to the dry ashing procedure to extract K, Ca, Mg, P, Fe, Mn, Zn, Cu, and B [37]. The tissue ashing was carried out by placing 0.5 g dried powdered tissue in crucibles in a chamber furnace LM-112 (Linn High Therm, Hirschbach, Germany), at 550 °C for 8 h. Thereafter, for the mineral extraction 10 mL of 1:50 hydrochloric acid (HCl) was added, and the extracts were filtered through Whatman No. 42. The concentrations of K, Ca, Mg, Fe, Mn, Zn and Cu in the obtained aqueous extracts and as well as in the drainage solutions sampled were determined using an atomic absorption spectrophotometer (AA-7000, Shimadzu, Kyoto, Japan), while the P concentration was quantified photometrically at 880 nm using a microplate spectrophotometer (Anthos Zenyth 200; Biochrom, Cambridge, UK), using the phosphomolybdenum blue method [38]. Total-N concentration in the plant tissues was determined using the Kjeldahl method using a Labtec DT 220 and a Tecator Kjeltec 8200 (FOSS A/S, Hillerod, Denmark). Nitrates (NO3) in plant tissue were determined by the salicylic acid method at 410 nm [39], while those in the drainage solution were determined photometrically through the vanadium chloride method at 540 nm [40]. The B concentration was determined by the Azomethine method in both drainage solution samples and plant tissue extracts [41].

2.5. Statistical Analysis

The experiment followed a completely randomized design with 4 replications per treatment (HEC-HN: high EC-high N concentration, HEC-LN: high EC-low N, LEC-HN: low EC-high N and LEC-LN: low EC-low N). Each replication (i.e., experimental plot) consisted of 9 plants (3 growing bags). Treatment effects were analyzed using two-way factorial ANOVA to evaluate (1) the main effects of EC and N level, and (2) their interaction effects. When ANOVA indicated significant differences (p < 0.05), post hoc comparisons were performed using Duncan’s multiple range test to identify specific treatment differences. The statistical analysis of the data, ANOVA and Duncan’s multiple range test were performed using STATISTICA 12.5 for Windows (StatSoft Inc., Tulsa, OK, USA). Graphical representation of data was performed using the GraphPad Prism 8 software (GraphPad Software, San Diego, CA, USA).

3. Results

3.1. Yield, Plant Growth and Water Uptake

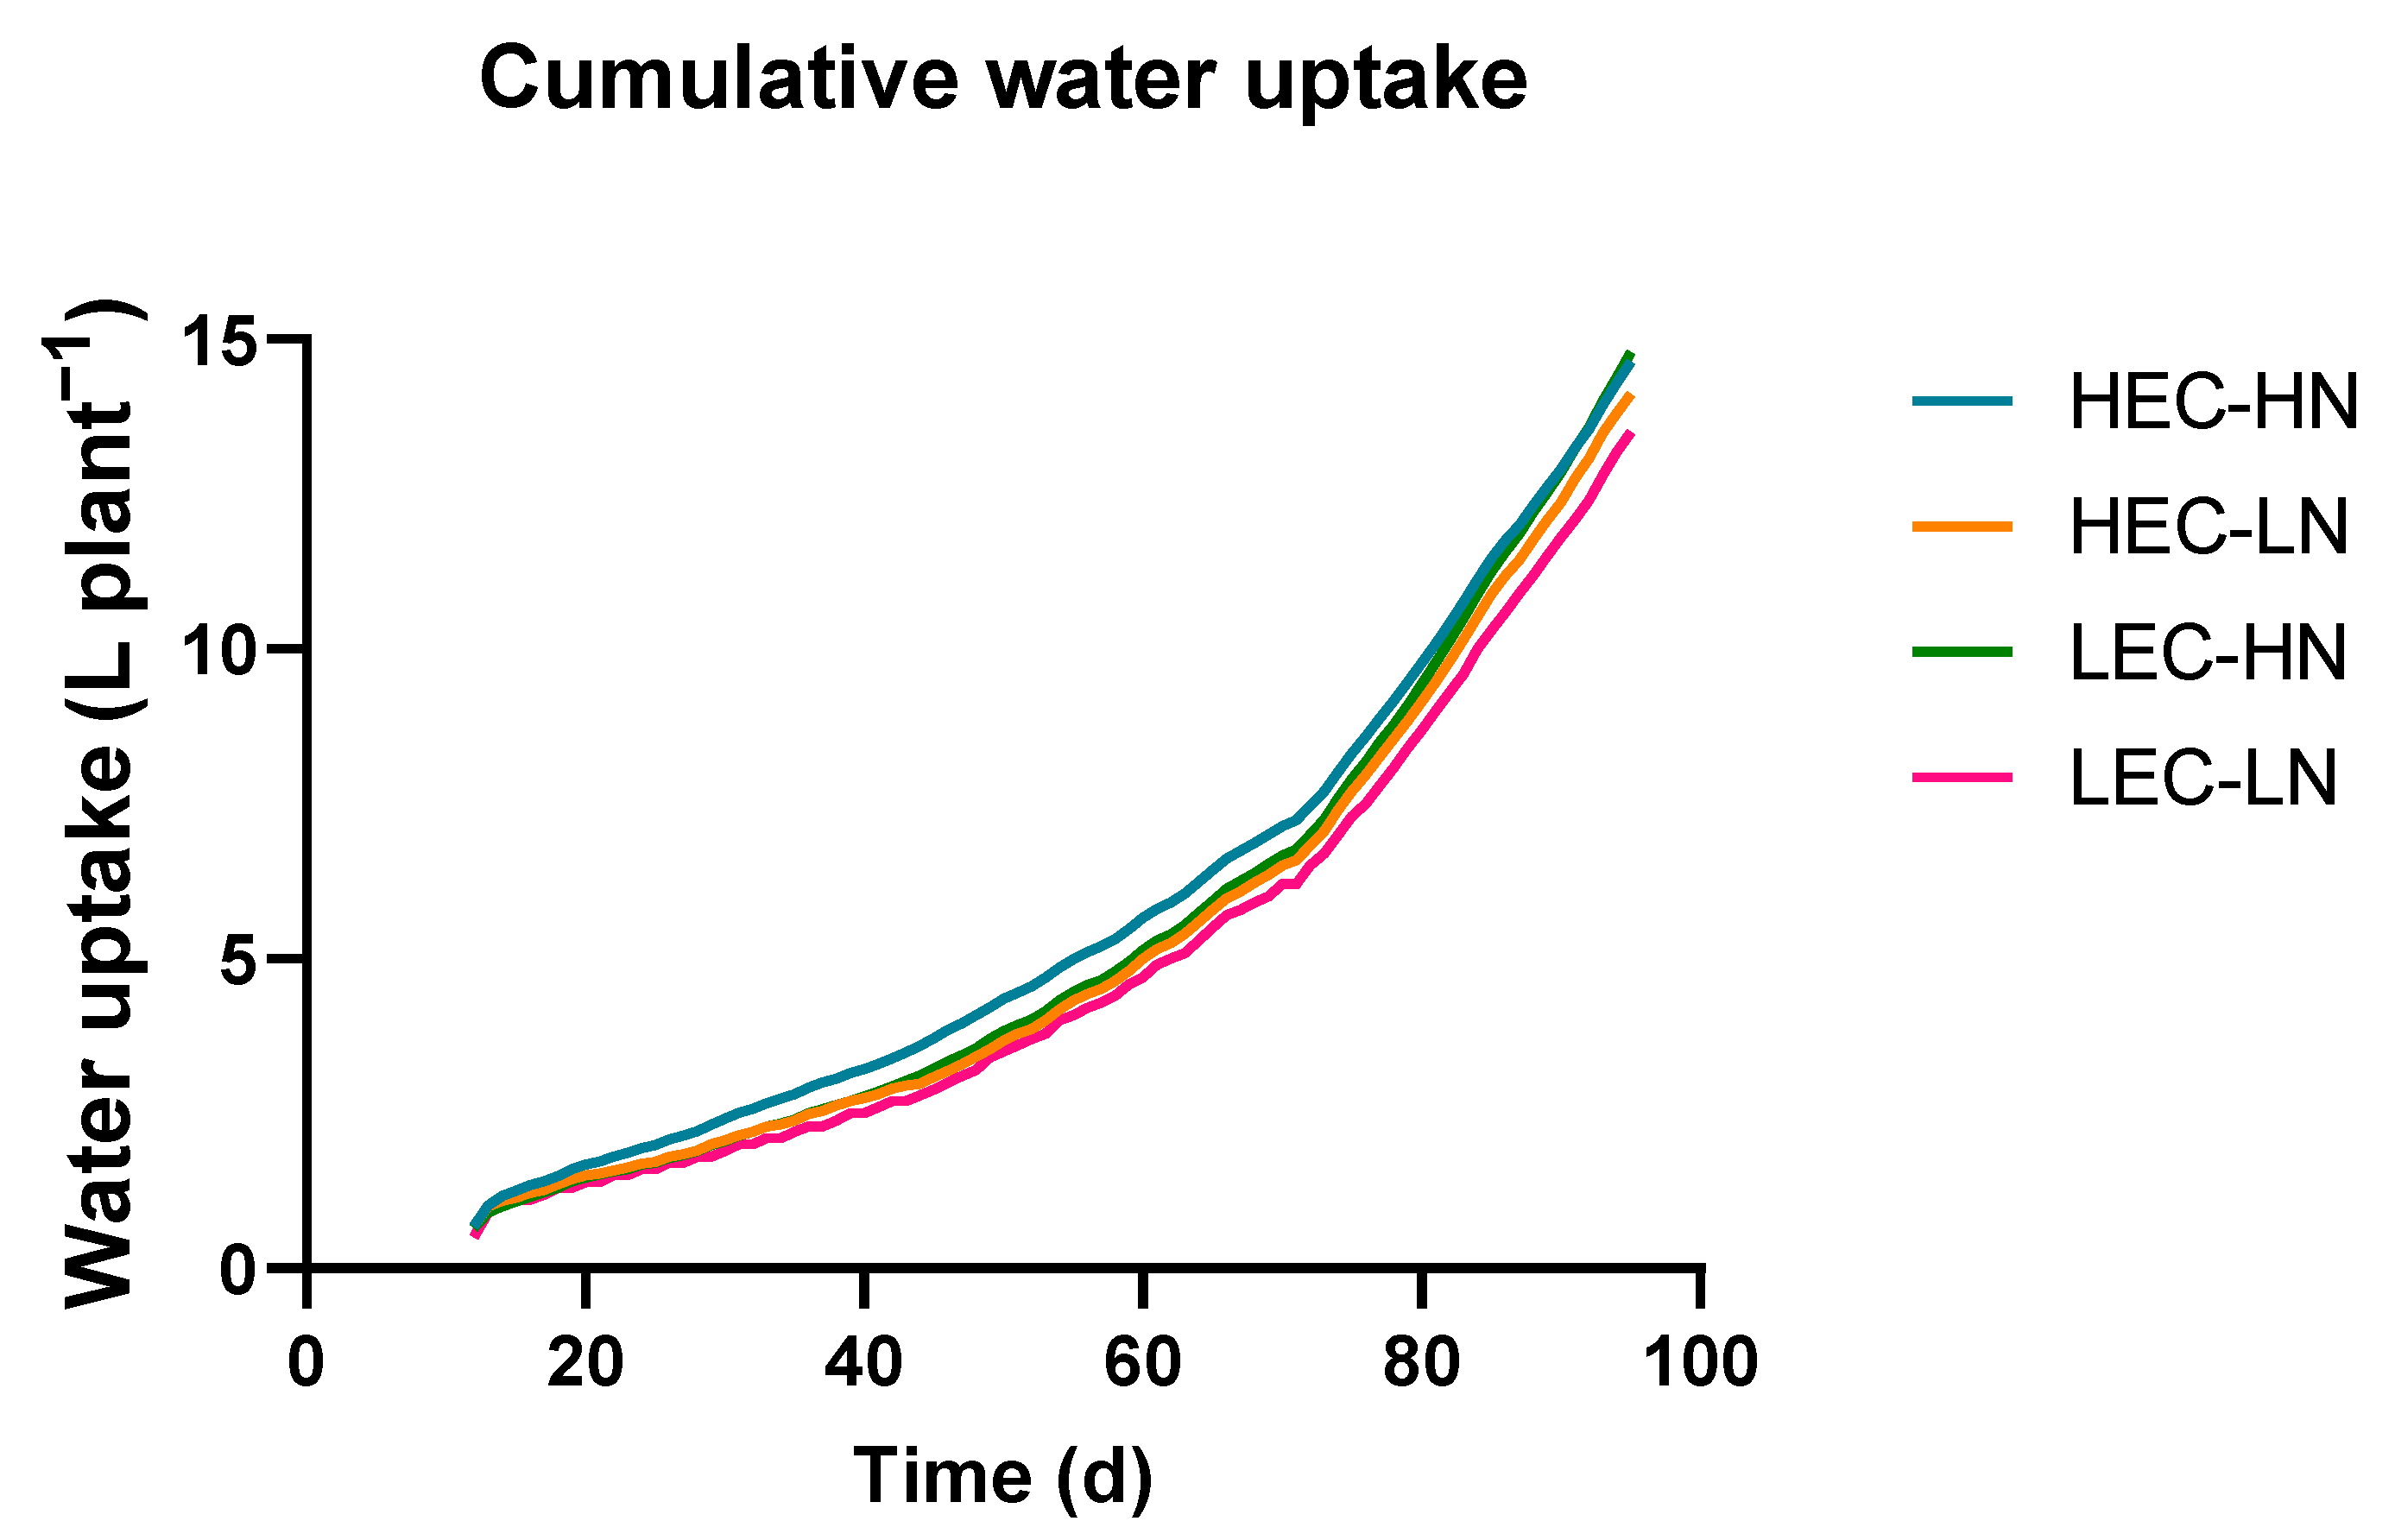
Root fresh and dry weight, which is the edible part of the plant at harvesting (96 DAT), were not significantly influenced by the EC and/or the N supply level (Table 2). However, HEC treatment significantly reduced the number of leaves per plant by 12.5% and the fresh and dry shoot weight by 21.4 and 27.9%, respectively. On the other hand, rosette diameter was not influenced by any of the experimental treatments. Regarding cumulative water uptake, the increase rate was similar without any significant differences observed in all four treatments until the end of the experiment (Figure 2).

3.2. Electrical Conductivity and Macronutrient Concentrations in the Drainage Solution

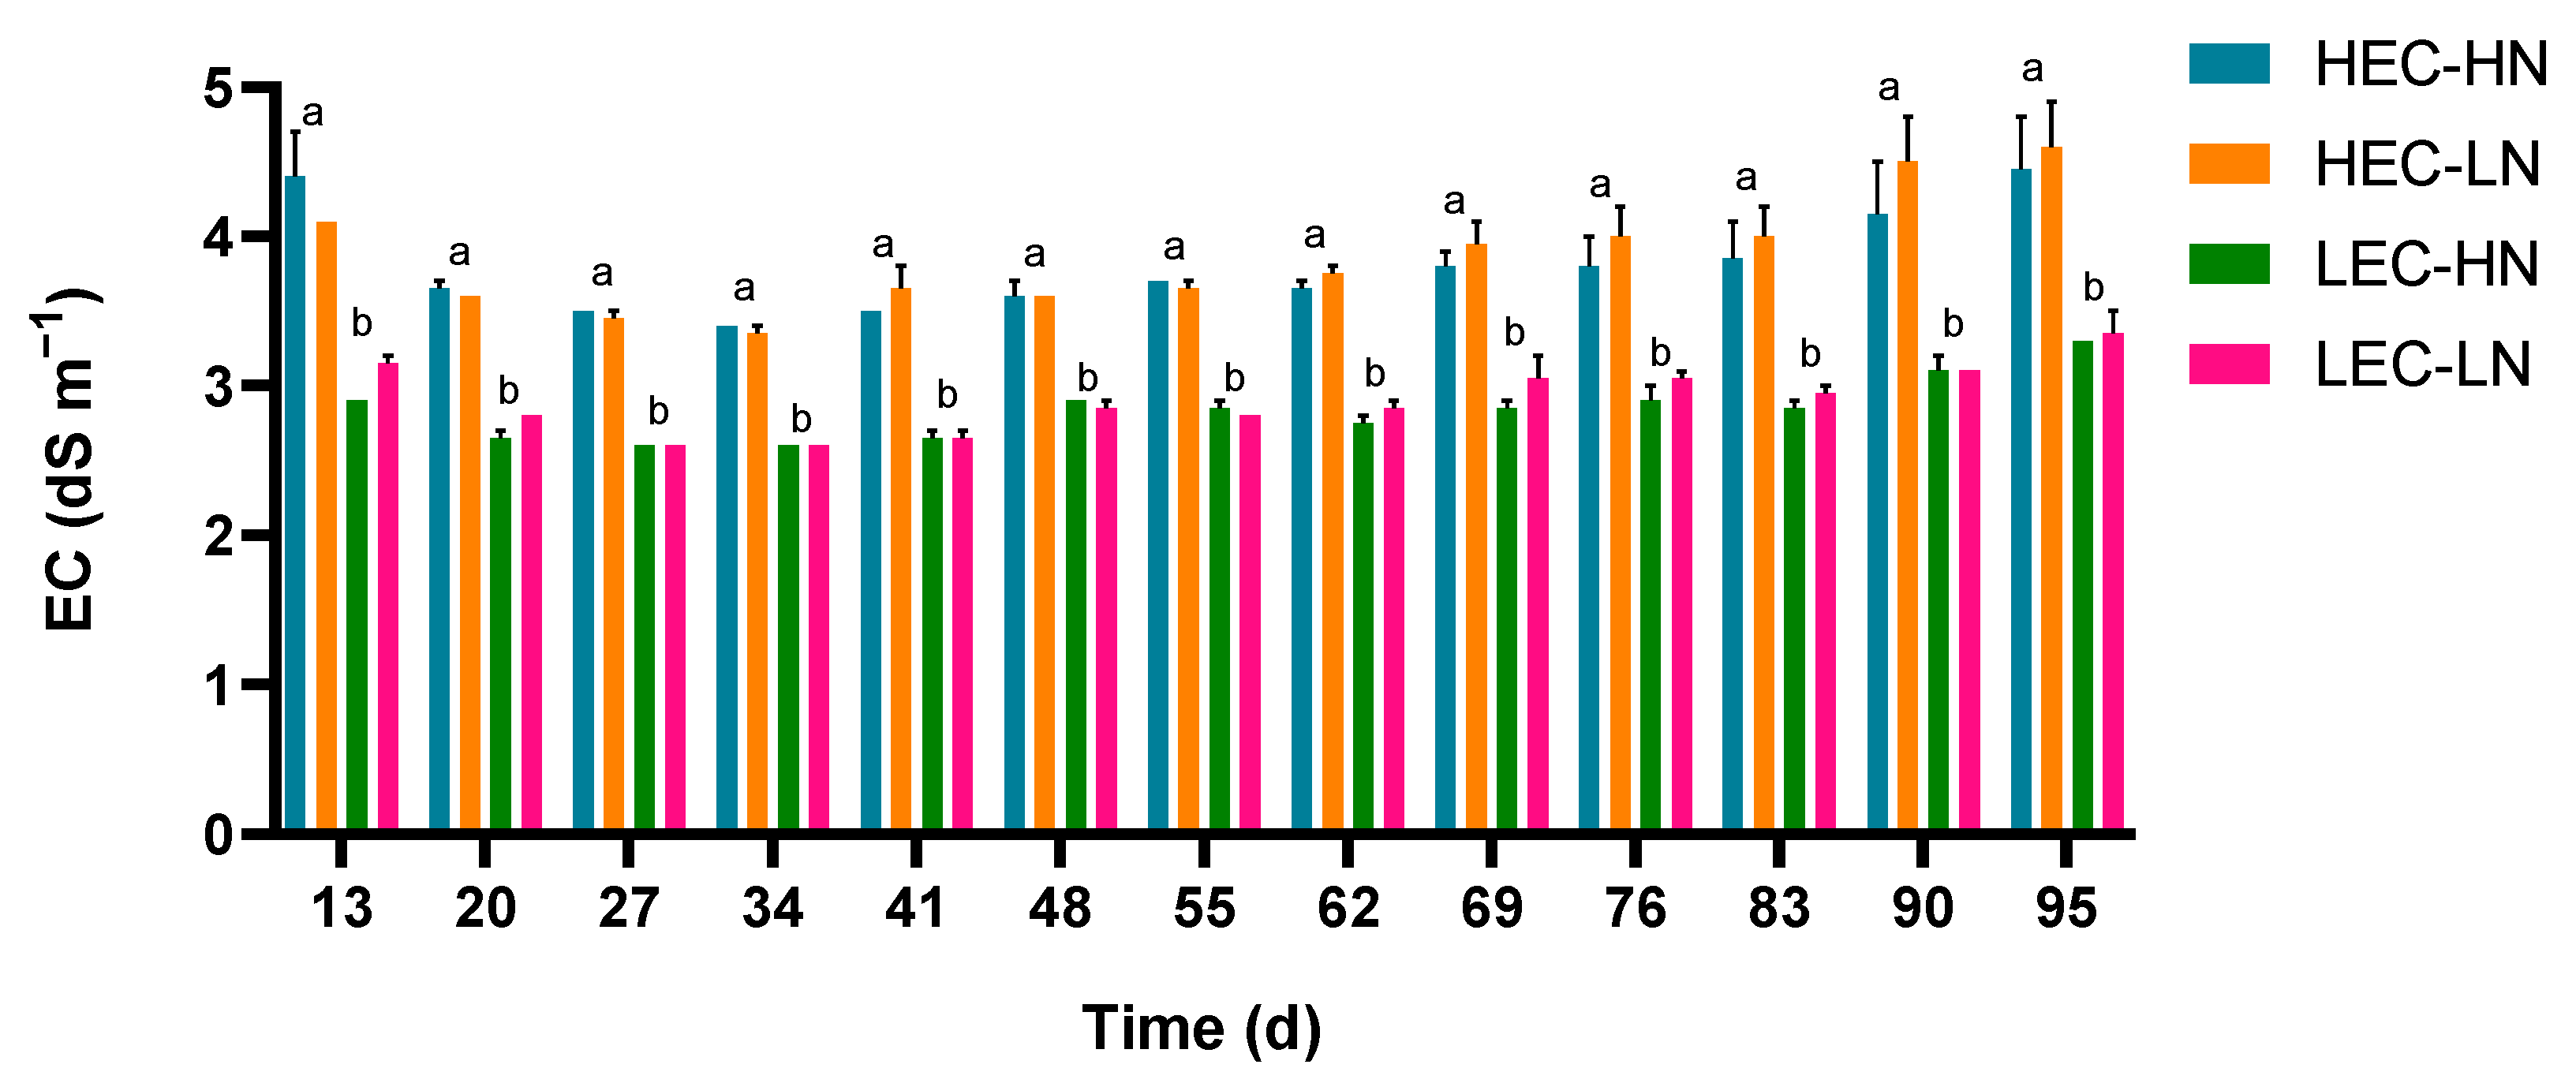
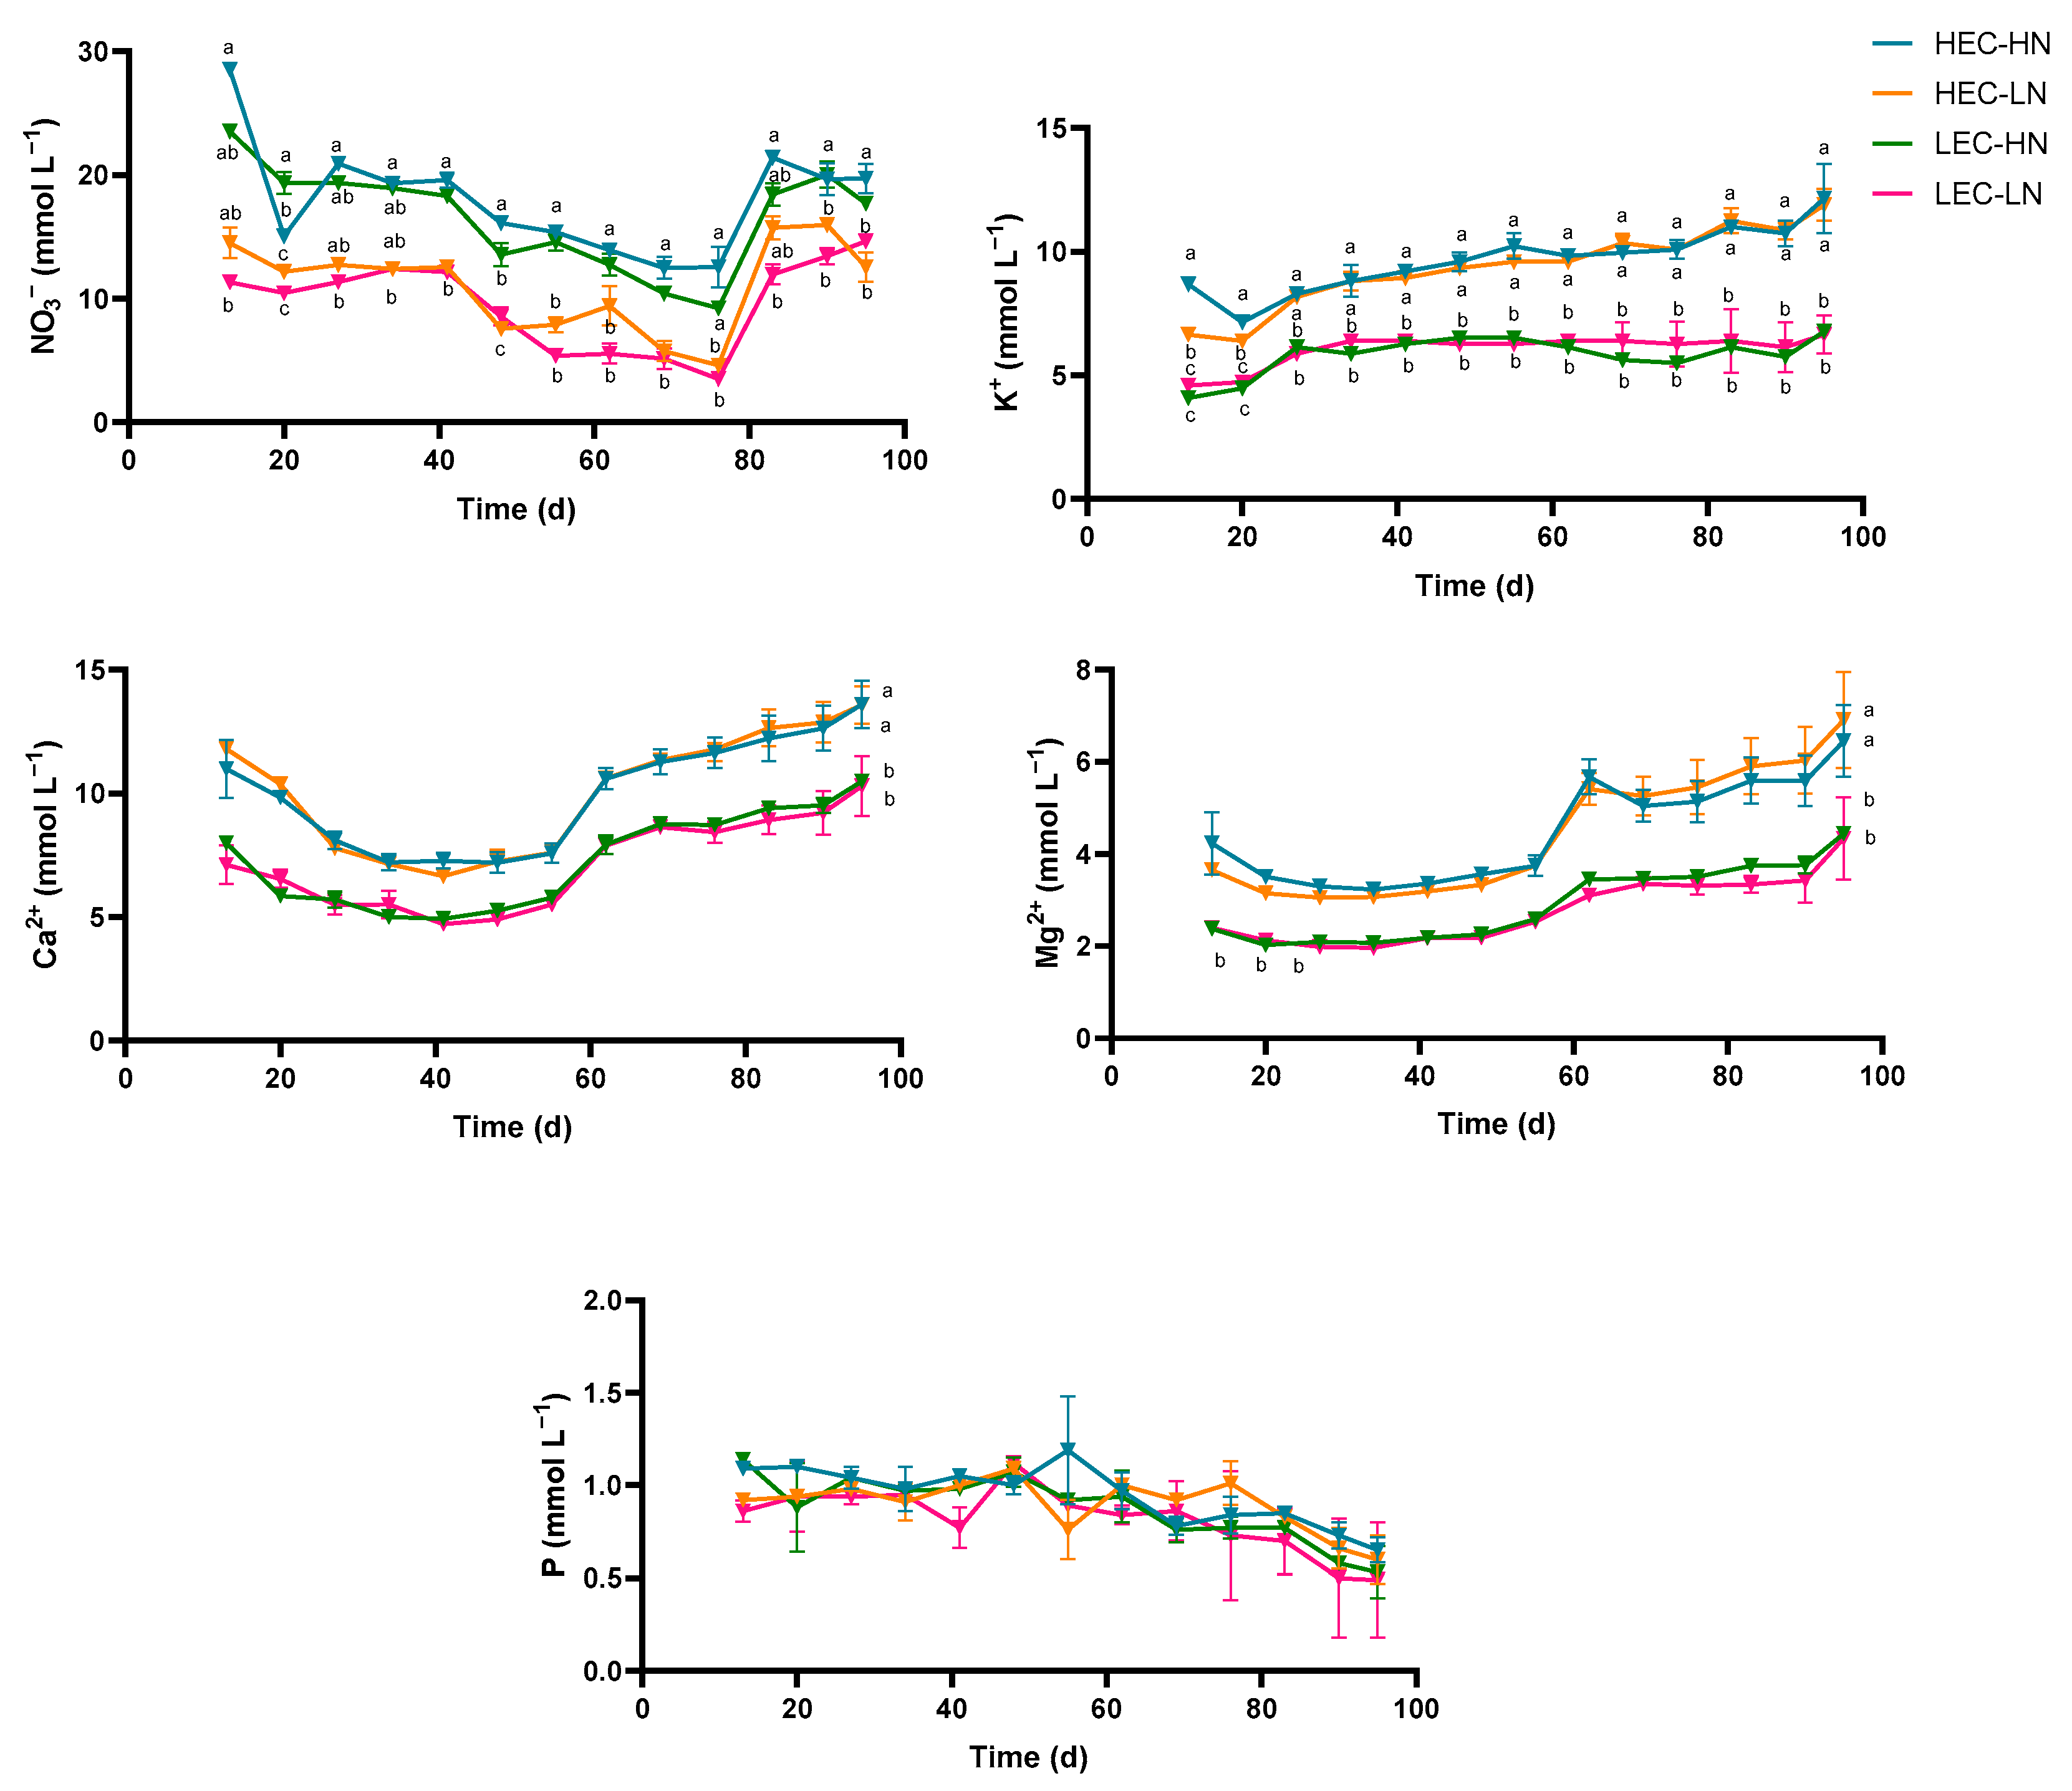
The EC of the drainage solution was consistently higher in the HEC treatments compared to the LEC treatments throughout the cropping period, reaching the level of 4.5 dS m−1 while on LEC treatments the EC remained close to 3.0 dS m−1, with significant differences detected on all sampling dates (Figure 3). Regarding macronutrient composition (Figure 4), drainage K+ concentration was significantly higher under HEC than LEC from the early sampling dates, reflecting the higher K+ concentration in the supplied nutrient solution of the HEC treatments. Similarly, Ca2+ and Mg2+ concentrations were also significantly higher in the HEC treatments, while after 60 DAT, the concentrations of both ions followed an increasing trend in both treatments. In contrast, NO3 concentration in the drainage solution was primarily affected by N level, with HN treatments maintaining significantly higher values across most sampling dates, regardless the EC level. After 76 DAT, NO3 concentration in all treatments had an increasing trend indicating the lower plant uptake.

3.3. Micronutrient Concentrations in the Drainage Solution

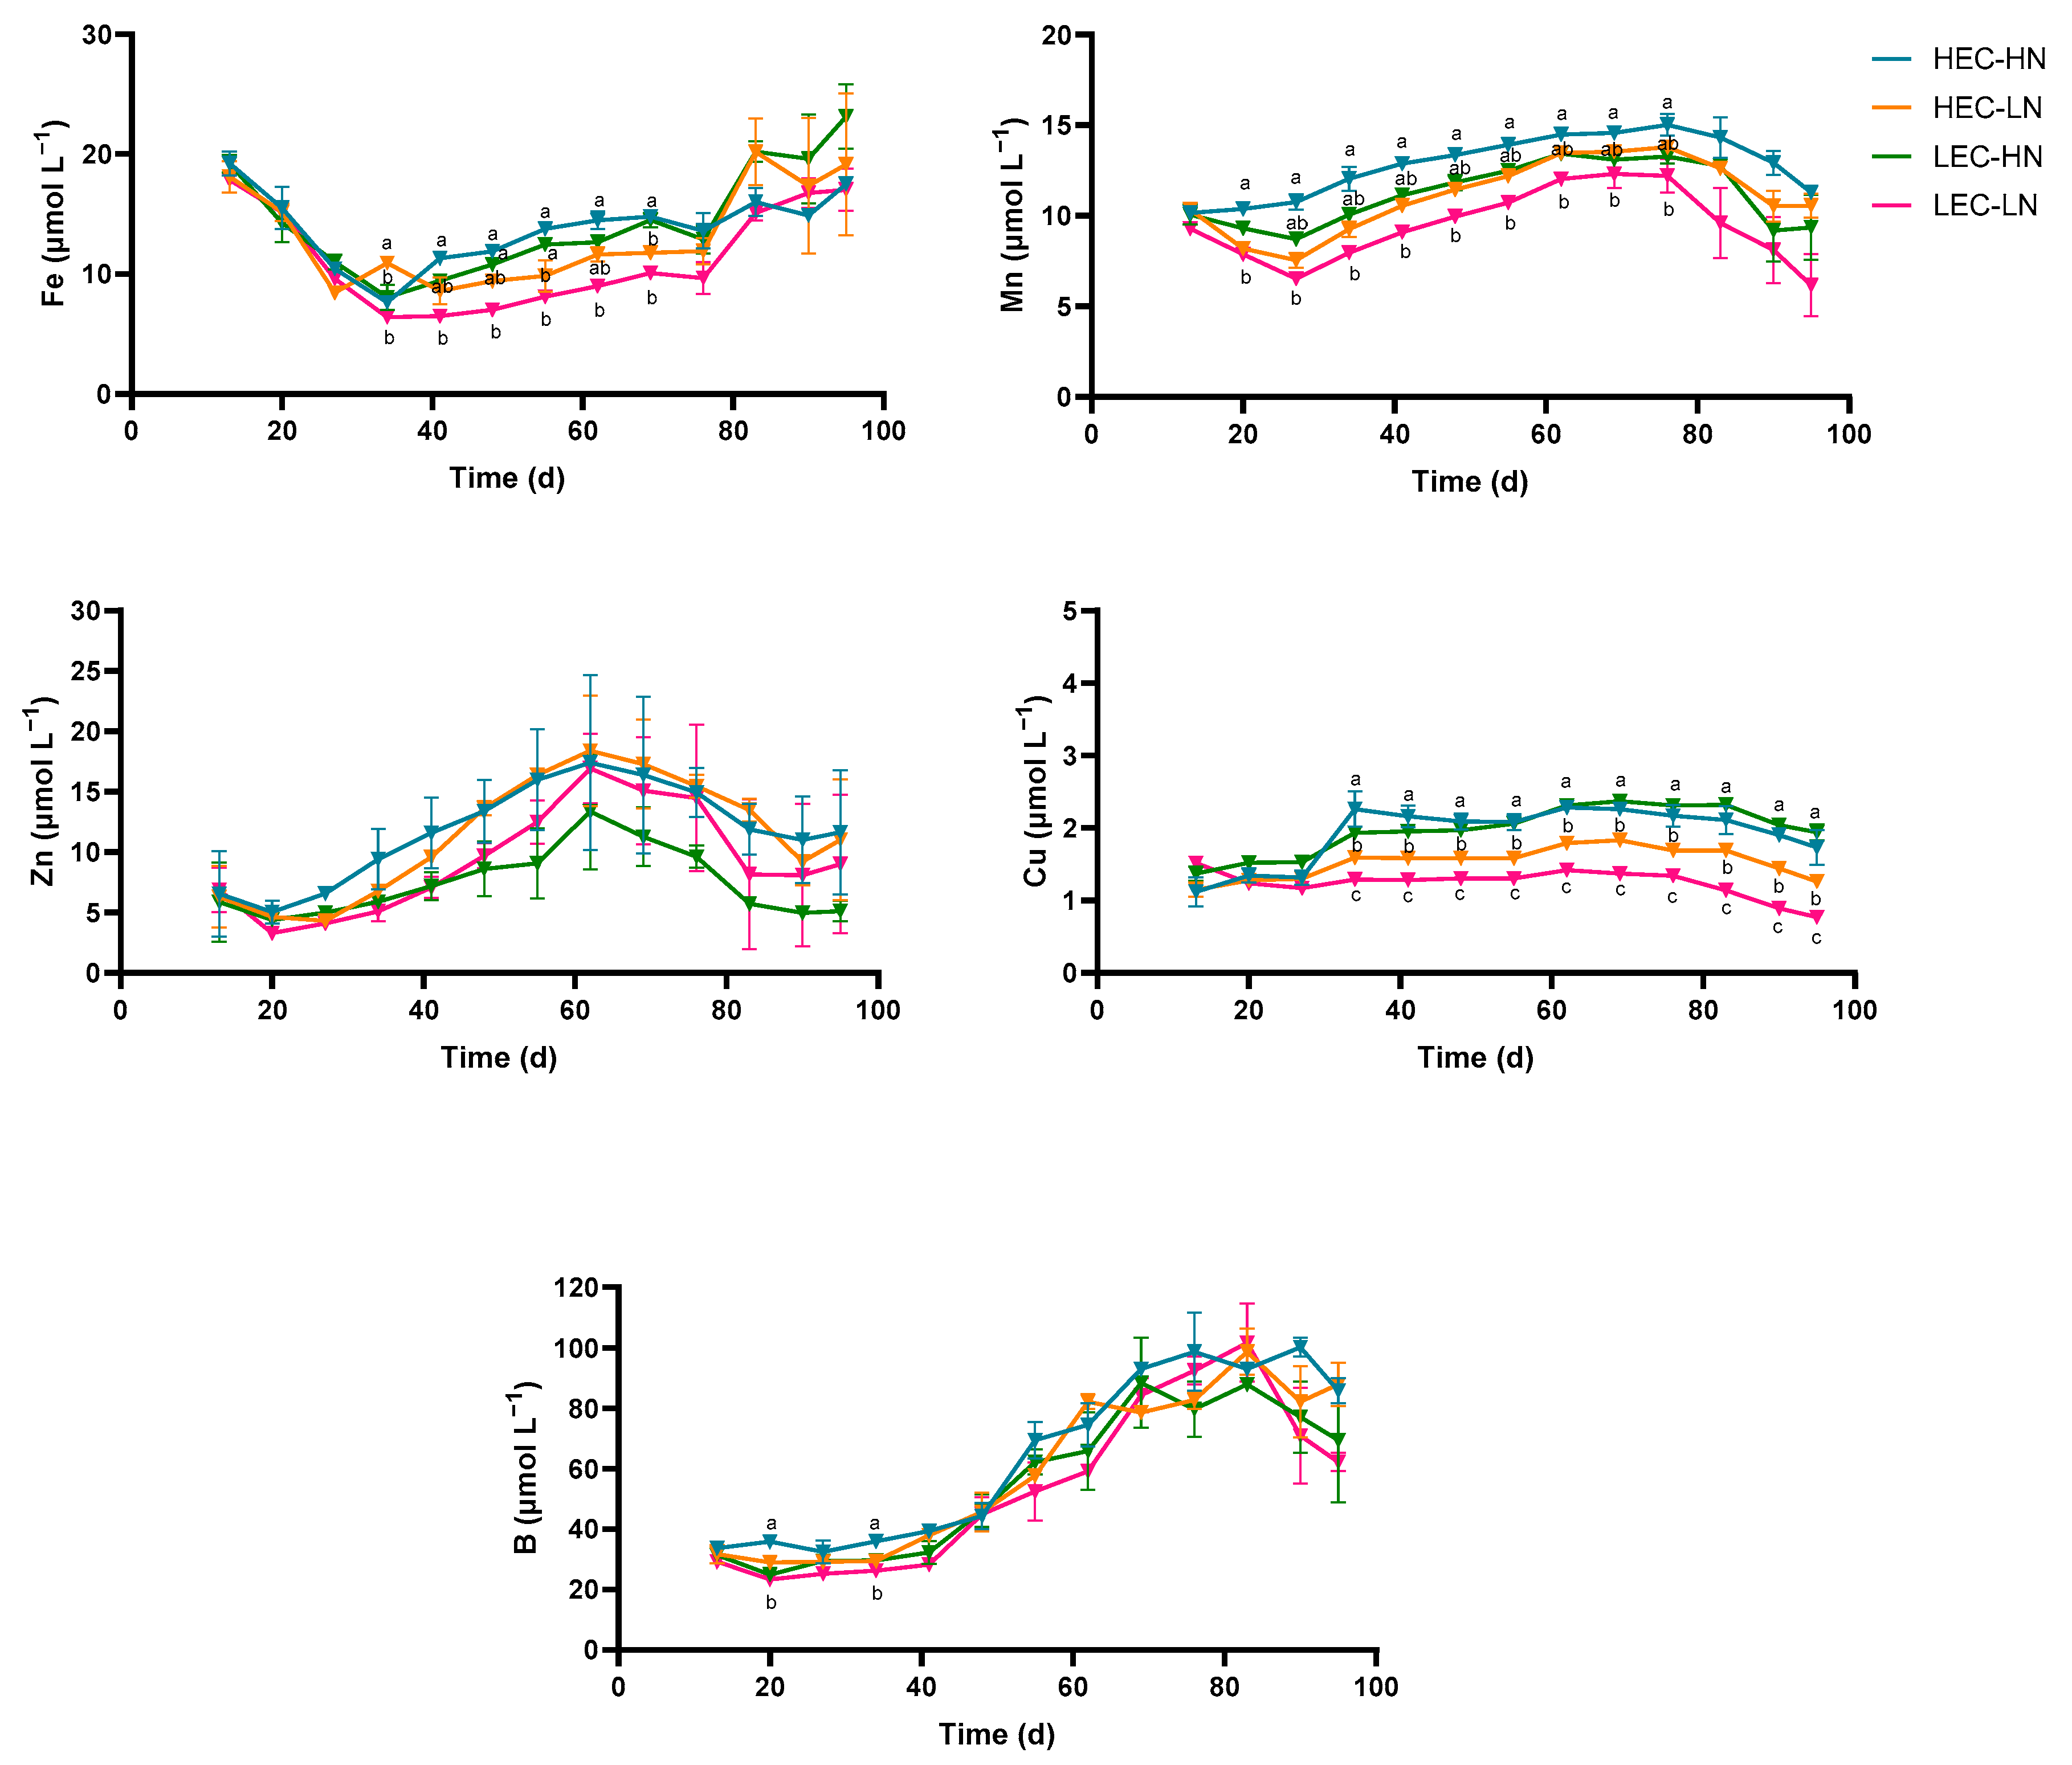
Micronutrient concentrations in the drainage solution were significantly influenced by both EC and N supply, with distinct patterns for each element throughout the cropping period (Figure 5). Fe and Mn concentrations in HEC-HN were significantly higher than LEC-LN from the early sampling dates, a trend that became more pronounced between 34 and 76 DAT. At the end of the cropping period, i.e., after 76 DAT, no significant differences were observed between the treatments. Zn levels showed no significant differences mainly due to high standard errors. Cu concentrations were generally increased in the HN treatments after 34 DAT, while the concentration in LEC-LN was significantly lower compared to HEC-LN treatment. In contrast, B concentrations displayed an increasing trend from the level of 30 μmol L−1 up to 80–100 μmol L−1, in all four treatments, without any differences observed for most of the sampling days.

3.4. Plant Tissue Nutrient Status

Macronutrient Concentrations

Total N concentration in the shoot of S. hispanicus was not influenced by any of the treatments at 48 DAT, while at 96 DAT, total N significantly increased (Table 3) under both HN and HEC treatments. The root total-N concentration at 48 DAT was significantly higher when the LEC was combined with the HN supply level, followed by HEC treatments. At the end of the experiment, at 96 DAT, the root total-N concentration was notably higher in the HN compared to the LN treatment, regardless of the EC levels (Table 4). Shoot and root P concentration of the golden thistle was not influenced by any of the treatments on both 48 and 96 DAT. On the contrary, HEC treatment increased K+ concentration by 14% in the shoot and by 33% in the roots compared to the LEC treatment, 48 DAT. At 96 DAT, the shoot K+ concentration was significantly increased by 8% under HEC while the root K+ concentration was influenced by both EC and the N levels. In more detail, the K+ concentration in the HEC and the HN treatments was increased by 18% and 21%, respectively, compared to LEC treatments. At 96 DAT, the shoot Ca2+ concentration was significantly reduced, by 28%, under the HEC. On the contrary, the root Ca2+ concentration was not influenced by any of the treatments at 48 and 96 DAT. The shoot NO3 concentration was significantly reduced in the LN treatments by 45% and 34% at 48 and 96 DAT, respectively (Table 3).

3.5. Micronutrient Concentrations

At 48 DAT, the shoot Fe concentration was significantly increased by the HEC compared to the LEC treatments while at 96 DAT, the Fe concentration was significantly higher when the HEC was combined with the LN supply, compared to the other three treatments (Table 5). The root Fe concentration at 48 DAT was not influenced by any of the treatments, whereas at day 96, Fe concentration was significantly higher in the HEC, by 62%, compared to the LEC treatments (Table 6). HEC increased the shoot Mn concentration by 25% at 48 DAT, while it increased by 15% at 96 DAT under LN treatment (Table 5). The root Mn concentration was not influenced by any of the treatments at 48 DAT, while at 96 DAT both LEC and LN increased it by 17% (Table 6). Furthermore, the shoot root Zn concentration remained unaffected by both the experimental treatments. The HEC significantly raised the Cu shoot concentration compared to the LEC on day 48, whereas the LN increased the Cu concentration compared to the HN on day 96, regardless of the EC level (Table 5). The root Cu concentration was not influenced by any of the treatments on both sampling days. Shoot B concentration was influenced by the interaction between the EC and the total N level at 48 DAT. In particular, the shoot B concentration was reduced not only by the HN but also by the LN when the EC was high. Moreover, at 96 DAT, the shoot B concentration was significantly increased when the HEC was combined with the LN treatment compared to the other three treatments (Table 5). In the roots, at 48 DAT, the LEC increased the B concentration compared to the HEC treatments, while at 96 DAT, the HN increased the B concentration compared to the LN treatments (Table 6).

3.6. Water Productivity and Agronomic Efficiency of Nutrients

WP was not significantly influenced by EC or N supply, following the no significant results of cumulative plant water consumption and root fresh weight. In contrast, in LEC the AE of several nutrients, improved substantially under LEC (Table 7). Specifically, AEK, AECa, AEMg, and AES were increased by 40%, 40%, 38%, and over fourfold, respectively, compared with HEC, while AEP showed a non-significant difference. Regarding N supply, LN enhanced AEN by 44% compared with HN, without affecting the AE of other nutrients. No significant interactions were observed, indicating that the beneficial effects of LEC and LN on nutrient use efficiencies were independent of each other.

4. Discussion

In the present study, the impact of the EC level (2.2 and 2.8 dS m−1) and N (NO3 + NH4+) concentration (13.30 and 17.30 mmol L−1) in the supplied nutrient solution on plant growth and nutrient status were examined on soilless-cultivated S. hispanicus. The findings showed that at 96 DAT, the HEC supplied nutrient solution led to an increase in EC in the root zone up to 4.5 dS m−1, imposing moderate salinity stress, which led to a decreased number of leaves and thus shoot fresh and dry weight. However, the root fresh and dry weight remained unaffected, and thus the crop’s marketable yield was not compromised. A recent study indicates that S. hispanicus growth remained unaffected under EC levels of 3.8 dS m−1 in the root environment up to 90 DAT [3]. However, at 120 DAT, salinity levels of 3.8 and 4.51 dS m−1 in the root zone imposed a significant yield reduction. Consequently, the main factor leading to reduced aboveground biomass is the loss of senescent plant leaves. Papadimitriou et al. [1], reported a similar decrease in S. hispanicus plant biomass between 90 and 120 DAT under moderate salinity stress. In lettuce, salinity stress can also lead to the senescence of plant leaves and finally to the abscission of these leaves [42]. This conclusion can explain the lack of significant differences in cumulative plant water consumption. Despite the lower number of leaves and aboveground biomass, the leaf abscission during the last few days of the cropping period had a low impact on the cumulative water consumption, and thus no significant differences were found between the treatments.
Comparable results were also obtained from similar wild leafy vegetables, such as wild rocket, T. officinale, Urospermum picroides and Reichardia picroides [15,43,44,45]. These results, in conjunction with the previous research, suggest the supplementation of a nutrient solution with lower than 2.80 dS m−1 EC on long-period cultivated golden thistle crops for root cortex production. Early harvest of the plants (prior to 120 DAT) is another option if the EC level of the nutrient solution exceeds 2.80 dS m−1, such as in case of high Na+ concentration of the irrigated water [1,3]. The reduction in plant growth at elevated EC is attributed to osmotic constraints that limit water uptake and impair cell expansion. In addition, high salt levels disrupt nutrient balance, increase oxidative stress, and reduce stomatal conductance, which together compromise photosynthetic efficiency and biomass accumulation [45].
Regarding the N supply, no differences in plant growth were observed under both levels, suggesting that even the LN treatment of 13.3 mmol L−1 N in the supplied nutrient solution can cover the plant daily nitrogen supply requirements. In line with our results, a total N supply of 14.2 mmol L−1 in the nutrient solution significantly increased the number of leaves and shoot fresh and dry weight in soilless cultivation of S. hispanicus compared to the lower N supply level of 7.2 mmol L−1 [4]. However, the current findings emphasize that an increase in N supply from 13.3 to 17.3 mM did not have any profound impact on yield characteristics and vegetative traits. Concentrations of N around 9–10 mM are sufficient to sustain yields in lettuce, spinach, P. oleracea, and S. oleraceus [11,18,19,46], while C. spinosum can grow well with only 4 mM of N [20]. indicating that a total N supply level at a magnitude of 13.0–14.0 mmol L−1 is sufficient for plants’ growth which is considered standard recommendation for modern commercial soilless cultivation of most greenhouse vegetables [46,47,48].
In the drainage solution, NO3 concentrations showed a decreasing trend in both HN and LN treatments up to 76 DAT, and after that day an accumulation was observed. Consequently, the N uptake in both treatments was not covered by the N supply up to 76 DAT, while in the final 20 days of the experiment the plant showed a substantial decrease in the uptake rate as a result of the restricted growth rate. Higher N concentration in the root environment stimulates the absorption of N by the plant [49], explaining why the NO3 concentration also decreased up to 76 DAT under HN treatment. Furthermore, after 60 DAT, a relative increase in the rest of the macronutrient concentrations can be ascribed to the partial leaf senescence of the plant after two months of cultivation. Concomitantly, the restricted nutrient uptake due to constrained mineral assimilation rate after 60 DAT probably led to the relative accumulation of bivalent macronutrients such as Ca2+, Mg2+, and SO42− in the root zone [50]. Additionally, bivalent macronutrients often exhibit reduced bioavailability compared to monovalent ions such as K+ in the root zone. The reason for this is that bivalent macronutrients display higher electrostatic affinity for negatively charged soil or substrate colloids resulting in restricted mobility of these macronutrients [28,49]. However, their mobility is limited primarily to diffusion, rather the mass flow-driven transport of more mobile nutrients, thereby restricting root uptake rates leading to concentration buildup of these macronutrients in the rhizosphere. Similar results were obtained by Papadimitriou et al. [4], demonstrating that S. hispanicus plant rate of vegetative growth, after 60 DAT, was relatively suspended, leading to ion accumulation and thus an EC increasing in the drainage solution.
The increased N concentration (17.3 mmol L−1) in the supplied nutrient solution of the two HN treatments (HEC-HN and LEC-HN) induced a corresponding increase in shoot and root total-N concentration in both sampling days (48 and 96 DAT). N constitutes a fundamental element for plant nutrition, not only promoting leaf area growth, but also tuberous root development, particularly critical for the commercial cultivation of tuberous root plants such as beetroot and carrot, where maximized edible root growth is highly desirable [50]. Similarly, Papadimitriou et al. [4], reported a corresponding increase in total-N content recovered from shoot and root dry tissue of S. hispanicus L. plants supplied with increased NO3 concentration of the nutrient solution (14.2 mM) compared to the control treatment (7.0 mM), 60 and 90 DAT. However, in the same study, reducing the N concentration in the nutrient solution to 7.2 mM decreased the level of organically bound NO3 in both leaves and tuberous roots of S. hispanicus, which likely contributed to reduced shoot growth under low-N treatments.
The NO3 concentration in the shoot increased significantly in the HN treatments, irrespective of the EC. According to literature reports, the NO3 content in plant tissue is largely influenced by the imbalance between the rates of NO3 uptake and its subsequent assimilation [9,25,51,52]. Although the mechanisms governing nitrate uptake and assimilation are genetically regulated, nitrate absorption is primarily determined by its concentration in the root zone [26]. In contrast, nitrate assimilation is predominantly dependent on light availability, as the energy required for the enzymatic reduction in nitrate is closely linked to photosynthetic activity [25]. In the current experiment, the increased nitrate content in leaf tissue can be ascribed to the increased nitrate uptake rate of high nitrogen supply treatments and the subsequent decreased NO3 assimilation rate due to light-limited conditions of the cultivation period (winter cropping period). Previous studies have further emphasized that nitrate accumulation in leafy vegetables during low light periods, such as winter, is a common physiological response resulting from reduced reductase activity [52]. This enzyme, which catalyzes the first step of nitrate assimilation, is light induced and closely linked to the plants’ photosynthetic rate. When nitrogen supply is abundant, nitrate uptake by the roots often exceeds the plant’s capacity for reduction and incorporation into amino acids, particularly under light-limited conditions [53]. Consequently, nitrate is stored in vacuoles of leaf cells, leading to elevated tissue concentrations which serve as a temporary nitrogen reserve [22]. From a food safety perspective, managing nitrate levels is critical, as excessive NO3 in edible tissues may exceed regulatory limits established to minimize dietary health risks. Strategies to mitigate excessive accumulation include optimizing fertilizer application schedules to better synchronize nitrogen supply with periods of higher light availability, employing supplemental lighting in controlled environment, or selecting cultivars with inherent higher nitrate reductase activity [54]. Nevertheless, the present results indicate that maximum S. hispanicus leaf NO3 content does not exceed maximum levels of acceptable daily intakes (regulated under Commission Regulation 2023/915) for leafy vegetables grown under cover, such as iceberg and greenhouse rucola (i.e., 3500 and 4500 g kg−1, respectively). The findings of the current study indicate that N fertilization must be closely monitored especially when golden thistle grows as a leafy green.
Plant tissue mineral recovery revealed that the HEC treatments increased the shoot and root K+ concentration, 48 and 96 DAT, while shoot Ca2+ concentration appeared reduced, 96 DAT. This increase in K+ concentration can be ascribed to the increased K+ concentration of the supplied nutrient solution (9.3 mM). However, K+ and Ca2+are both cations absorbed by plant roots and their uptake had an antagonistic relationship [48]. Furthermore, high K+ concentrations may alter the electrochemical gradients across root cells, indirectly reducing Ca2+ influx. Thus, excessive K+ can suppress Ca2+ uptake due to competition at the root membrane or within transport channels, probably contributing to the decreased Ca2+ absorption, 96 DAT [55,56].
The micronutrient concentration determined in dry biomass of S. hispanicus shoot and root tissue revealed no significant differences in trace-element status among the tested nutrient solution treatments, except for shoot Fe, Mn, and Cu concentrations, which appeared significantly decreased in LEC treatments at 48 DAT, and shoot Cu and B which were significantly decreased in HN treatments at 96 DAT. According to Pyun [57] an increased EC (ionic strength) level, of the supplied nutrient solution, compresses the electrical double layer surrounding negatively charged root surfaces (‘Gibbs-Donnan’ potential” potential compression). This reduces electrostatic repulsion and facilitates the diffusion of cationic micronutrients such as Fe2+, Mn2+, and Cu2+ toward uptake sites [58]. Consequently, elevated EC can enhance the root absorption and shoot accumulation of these elements. For the deviation in Fe leaf concentration no satisfactory explanation could be found for the appreciable increase in the leaf Fe concentrations when a high EC in the supplied NS was combined with a low N supply level. The differences in the leaf Mn, Cu, and B concentrations between the tested treatments were not consistent in the two sampling dates and thus they probably indicate temporal changes in their concentrations in the root zone rather than standard physiological effects of the EC and/or the N supply levels.
The results on AE of nutrients underline the advantage of combining low EC (2.2 dS m−1) with low N (13.3 mmol L−1) supply (LEC–LN), which consistently provided the same root yield together with superior AE values, particularly for N, K, Ca, Mg, and S. While WP was not significantly influenced by the tested treatments, the improved nutrient use efficiency under LEC–LN demonstrates that optimal root cortex production of golden thistle can be achieved with reduced nutrient inputs, thereby enhancing both sustainability and cost-effectiveness of cultivation. From a practical perspective, growers aiming at commercial production of golden thistle roots are recommended to adopt nutrient solutions with an EC around 2.2 dS m−1 and N concentration in the supplied nutrient solution of about 13–14 mmol L−1. Following this recommendation of low EC or N levels in the NS, it can sustain yield, increase AE of nutrients, while NO3 accumulation in tissues can be minimized providing higher product quality for human health.

5. Conclusions

The present study demonstrates that golden thistle (Scolymus hispanicus L.) can be successfully cultivated in a soilless culture system for root cortex production. Among the tested treatments, the combination of low EC (2.2 dS m−1) and low N (13.3 mmol L−1) (LEC–LN) proved to be the most effective, resulting in the same root yield, higher aboveground biomass and increased agronomic efficiency of nutrients. From practical perspective, adopting the lower input fertigation strategies is recommended for sustainable commercial production of golden thistle roots, as this approach not only reduces production costs but also aligns with environmental goals of minimizing nutrient losses. Overall, the results provide valuable insights into nutrient management strategies for S. hispanicus cultivation in soilless systems and offer a basis for optimizing its cultivation as a novel root vegetable with potential commercial value.

Author Contributions

Conceptualization, D.M.P., T.M., G.N. and D.S.; methodology, F.M., D.M.P., E.G., T.N. and D.S.; software, D.M.P. and E.G.; validation, F.M., D.M.P. and D.S.; formal analysis, F.M.; investigation, F.M., D.M.P., E.G., P.K. and D.S.; resources, T.M. and D.S.; data curation, F.M.; writing—original draft preparation, F.M., D.M.P. and E.G.; writing—review and editing, F.M., D.M.P., E.G., T.N., P.K., T.M., G.N. and D.S.; visualization, F.M., D.M.P., E.G. and. T.N.; supervision, T.M., G.N. and D.S.; project administration, T.M. and D.S.; funding acquisition, T.M., G.N. and D.S. All authors have read and agreed to the published version of the manuscript.

Funding

This research was financed by OPTIMUS project (Grant Agreement No. AΤΤΡ4-0356837) with the co-funding of Greece and the European Union.

Data Availability Statement

The original contributions presented in this study are included in the article.

Conflicts of Interest

The authors declare that they have no known competing financial interests or personal relationships that could have appeared to influence the work reported in this paper.

References

  1. Papadimitriou, D.M.; Daliakopoulos, I.N.; Kontaxakis, E.; Sabathianakis, M.; Manios, T.; Savvas, D. Effect of Moderate Salinity on Golden Thistle (Scolymus hispanicus L.) Grown in a Soilless Cropping System. Sci. Hortic. 2022, 303, 111182. [Google Scholar] [CrossRef]
  2. Paschoalinotto, B.H.; Polyzos, N.; Compocholi, M.; Rouphael, Y.; Alexopoulos, A.; Dias, M.I.; Barros, L.; Petropoulos, S.A. Domestication of Wild Edible Species: The Response of Scolymus Hispanicus Plants to Different Fertigation Regimes. Horticulturae 2023, 9, 103. [Google Scholar] [CrossRef]
  3. Papadimitriou, D.; Kontaxakis, E.; Daliakopoulos, I.; Manios, T.; Savvas, D. Effect of N:K Ratio and Electrical Conductivity of Nutrient Solution on Growth and Yield of Hydroponically Grown Golden Thistle (Scolymus hispanicus L.). In Proceedings of the TERRAenVISION 2019, Barcelona, Spain, 2–7 September 2019; MDPI: Basel, Switzerland, 2020; p. 87. [Google Scholar]
  4. Papadimitriou, D.M.; Daliakopoulos, I.N.; Lydakis-Simantiris, N.; Cheiladaki, I.; Manios, T.; Savvas, D. Nitrogen Source and Supply Level Impact Water Uptake, Yield, and Nutrient Status of Golden Thistle in a Soilless Culture. Sci. Hortic. 2024, 336, 113384. [Google Scholar] [CrossRef]
  5. Pardo-de-Santayana, M.; Pieroni, A.; Puri, R.K. Ethnobotany in the New Europe: People, Health and Wild Plant Resources; Berghahn Books: New York, NY, USA, 2010; ISBN 9781845454562. [Google Scholar]
  6. Peduruhewa, P.S.; Jayathunge, K.G.L.R.; Liyanage, R. Potential of Underutilized Wild Edible Plants as the Food for the Future—A Review. J. Food Sec. 2021, 9, 136–147. [Google Scholar] [CrossRef]
  7. European Commission. EU Agricultural Outlook for Markets and Income, 2019–2030; European Commission: Brussels, Belgium, 2019. [Google Scholar]
  8. Romojaro, A.; Botella, M.Á.; Obón, C.; Pretel, M.T. Nutritional and Antioxidant Properties of Wild Edible Plants and Their Use as Potential Ingredients in the Modern Diet. Int. J. Food Sci. Nutr. 2013, 64, 944–952. [Google Scholar] [CrossRef]
  9. Sánchez-Mata, M.C.; Cabrera Loera, R.D.; Morales, P.; Fernández-Ruiz, V.; Cámara, M.; Díez Marqués, C.; Pardo-de-Santayana, M.; Tardío, J. Wild Vegetables of the Mediterranean Area as Valuable Sources of Bioactive Compounds. Genet. Resour. Crop Evol. 2012, 59, 431–443. [Google Scholar] [CrossRef]
  10. Carocho, M.; Ferreira, I.C.F.R. A Review on Antioxidants, Prooxidants and Related Controversy: Natural and Synthetic Compounds, Screening and Analysis Methodologies and Future Perspectives. Food Chem. Toxicol. 2013, 51, 15–25. [Google Scholar] [CrossRef]
  11. Chrysargyris, A.; Tzortzakis, N. Optimising Fertigation of Hydroponically Grown Sowthistle (Sonchus oleraceus L.): The Impact of the Nitrogen Source and Supply Concentration. Agric. Water Manag. 2023, 289, 108528. [Google Scholar] [CrossRef]
  12. García-Herrera, P.; Sánchez-Mata, M.C.; Cámara, M.; Fernández-Ruiz, V.; Díez-Marqués, C.; Molina, M.; Tardío, J. Nutrient Composition of Six Wild Edible Mediterranean Asteraceae Plants of Dietary Interest. J. Food Comp. Anal. 2014, 34, 163–170. [Google Scholar] [CrossRef]
  13. Vardavas, C.I.; Majchrzak, D.; Wagner, K.-H.; Elmadfa, I.; Kafatos, A. The Antioxidant and Phylloquinone Content of Wildly Grown Greens in Crete. Food Chem. 2006, 99, 813–821. [Google Scholar] [CrossRef]
  14. Vardavas, C.I.; Majchrzak, D.; Wagner, K.H.; Elmadfa, I.; Kafatos, A. Lipid Concentrations of Wild Edible Greens in Crete. Food Chem. 2006, 99, 822–834. [Google Scholar] [CrossRef]
  15. Bonasia, A.; Lazzizera, C.; Elia, A.; Conversa, G. Nutritional, Biophysical and Physiological Characteristics of Wild Rocket Genotypes As Affected by Soilless Cultivation System, Salinity Level of Nutrient Solution and Growing Period. Front. Plant Sci. 2017, 8, 300. [Google Scholar] [CrossRef]
  16. Sarrou, E.; Siomos, A.S.; Riccadona, S.; Aktsoglou, D.-C.; Tsouvaltzis, P.; Angeli, A.; Franceschi, P.; Chatzopoulou, P.; Vrhovsek, U.; Martens, S. Improvement of Sea Fennel (Crithmum maritimum L.) Nutritional Value through Iodine Biofortification in a Hydroponic Floating System. Food Chem. 2019, 296, 150–159. [Google Scholar] [CrossRef] [PubMed]
  17. Zhu, Z.; Gerendas, J.; Sattelmacher, B. Effects of replacing of nitrate with urea or chloride on the growth and nitrate accumulation in pak-choi in the hydroponics. In Plant Nutrition for Sustainable Food Production and Environment; Developments in Plant and Soil Sciences, Ando, T., Fujita, K., Mae, T., Matsumoto, H., Mori, S., Sekiya, J., Eds.; Springer: Dordrecht, The Netherlands, 1997; Volume 78. [Google Scholar] [CrossRef]
  18. Chrysargyris, A.; Hajisolomou, E.; Xylia, P.; Tzortzakis, N. Ammonium to Total Nitrogen Ratio Affects the Purslane (Portulaca oleracea L.) Growth, Nutritional, and Antioxidant Status. Heliyon 2023, 9, 11. [Google Scholar] [CrossRef]
  19. Ferrarezi, R.S.; Qin, K.; Hazard, C.; Gatard, E.; Gastaldo, T.B.; Housley, M.J.; Nieters, C.E.; Mesquita, M. Airflow, Fertilizer Solution Recipes, and Calcium Concentrations Influence Lettuce and Spinach Growth in an Indoor Vertical Farm. Sci. Hortic. 2024, 328, 112948. [Google Scholar] [CrossRef]
  20. Voutsinos-Frantzis, O.; Karavidas, I.; Savvas, D.; Ntanasi, T.; Kaimpalis, V.; Consentino, B.B.; Aliferis, K.A.; Karkanis, A.; Sabatino, L.; Ntatsi, G. Impact of Nitrogen Limitation, Irrigation Levels, and Nitrogen-Rich Biostimulant Application on Agronomical and Chemical Traits of Hydroponically Grown Cichorium spinosum L. Horticulturae 2024, 10, 1063. [Google Scholar] [CrossRef]
  21. Mndi, O.; Sogoni, A.; Jimoh, M.O.; Wilmot, C.M.; Rautenbach, F.; Laubscher, C.P. Interactive Effects of Salinity Stress and Irrigation Intervals on Plant Growth, Nutritional Value, and Phytochemical Content in Mesembryanthemum crystallinum L. Agriculture 2023, 13, 1026. [Google Scholar] [CrossRef]
  22. Hawkesford, M.; Horst, W.; Kichey, T.; Lambers, H.; Schjoerring, J.; Møller, I.S.; White, P. Functions of Macronutrients. In Marschner’s Mineral Nutrition of Higher Plants; Marschner, P., Ed.; Academic Press: London, UK, 2012; pp. 135–189. [Google Scholar]
  23. Voogt, W.; Bar-Yosef, B. Water and Nutrient Management and Crops Response to Nutrient Solution Recycling in Soilless Growing Systems in Greenhouses. In Soilless Culture: Theory and Practice; Elsevier: Amsterdam, The Netherlands, 2019; pp. 425–507. ISBN 9780444636966. [Google Scholar]
  24. Boschiero, B.N.; Mariano, E.; Azevedo, R.A.; Ocheuze Trivelin, P.C. Influence of Nitrate—Ammonium Ratio on the Growth, Nutrition, and Metabolism of Sugarcane. Plant Physiol. Biochem. 2019, 139, 246–255. [Google Scholar] [CrossRef]
  25. Liu, X.; Hu, B.; Chu, C. Nitrogen Assimilation in Plants: Current Status and Future Prospects. J. Genet. Genom. 2022, 49, 394–404. [Google Scholar] [CrossRef]
  26. Taiz, L.; Zeiger, E. Plant Physiology, 3rd ed.; Sinauer Associates: Sunderland, MA, USA, 2002; ISBN 0878938230. [Google Scholar]
  27. Sonneveld, C.; Voogt, W. Plant Nutrition of Greenhouse Crops; Springer: Dordrecht, The Netherlands, 2009; ISBN 9789048125326. [Google Scholar]
  28. Rouphael, Y.; Kyriacou, M.C. Enhancing Quality of Fresh Vegetables through Salinity Eustress and Biofortification Applications Facilitated by Soilless Cultivation. Front. Plant Sci. 2018, 9, 1254. [Google Scholar] [CrossRef] [PubMed]
  29. Cela, F.; Carmassi, G.; Najar, B.; Taglieri, I.; Sanmartin, C.; Cialli, S.; Ceccanti, C.; Guidi, L.; Venturi, F.; Incrocci, L. Salinity Impact on Yield, Quality and Sensory Profile of ‘Pisanello’ Tuscan Local Tomato (Solanum lycopersicum L.) in Closed Soilless Cultivation. Horticulturae 2024, 10, 570. [Google Scholar] [CrossRef]
  30. Giannothanasis, E.; Spanoudaki, E.; Kinnas, S.; Ntatsi, G.; Voogt, W.; Savvas, D. Development and Validation of an Innovative Algorithm for Sodium Accumulation Management in Closed-Loop Soilless Culture Systems. Agric. Water Manag. 2024, 301, 108968. [Google Scholar] [CrossRef]
  31. Blok, C.; Voogt, W.; Barbagli, T. Reducing Nutrient Imbalance in Recirculating Drainage Solution of Stone Wool Grown Tomato. Agric. Water Manag. 2023, 285, 108360. [Google Scholar] [CrossRef]
  32. Savvas, D.; Giannothanasis, E.; Ntanasi, T.; Karavidas, I.; Ntatsi, G. State of the Art and New Technologies to Recycle the Fertigation Effluents in Closed Soilless Cropping Systems Aiming to Maximise Water and Nutrient Use Efficiency in Greenhouse Crops. Agronomy 2024, 14, 61. [Google Scholar] [CrossRef]
  33. Savvas, D.; Giannothanasis, E.; Ntanasi, T.; Karavidas, I.; Drakatos, S.; Panagiotakis, I.; Neocleous, D.; Ntatsi, G. Improvement and Validation of a Decision Support System to Maintain Optimal Nutrient Levels in Crops Grown in Closed-Loop Soilless Systems. Agric. Water Manag. 2023, 285, 108373. [Google Scholar] [CrossRef]
  34. Fernández, J.E.; Alcon, F.; Diaz-Espejo, A.; Hernandez-Santana, V.; Cuevas, M.V. Water Use Indicators and Economic Analysis for On-Farm Irrigation Decision: A Case Study of a Super High Density Olive Tree Orchard. Agric. Water Manag. 2020, 237, 106074. [Google Scholar] [CrossRef]
  35. Pereira, L.S.; Cordery, I.; Iacovides, I. Improved Indicators of Water Use Performance and Productivity for Sustainable Water Conservation and Saving. Agric. Water Manag. 2012, 108, 39–51. [Google Scholar] [CrossRef]
  36. Ladha, J.K.; Pathak, H.; Krupnik, T.J.; Six, J.; van Kessel, C. Efficiency of Fertilizer Nitrogen in Cereal Production: Retrospects and Prospects. Adv. Agron. 2005, 87, 85–156. [Google Scholar]
  37. Campbell, C.R.; Plank, C.O. Preparation of Plant Tissue for Laboratory Analysis. In Handbook of Reference Methods for Plant Analysis; Kalra, Y., Ed.; CRC Press: Boca Raton, FL, USA, 1997; p. 320. ISBN 9780367802233. [Google Scholar]
  38. Murphy, J.; Riley, J.P. A Modified Single Solution Method for the Determination of phosphate in Natural Waters. Anal. Chem. Acta 1962, 27, 31–36. [Google Scholar] [CrossRef]
  39. Cataldo, D.A.; Maroon, M.; Schrader, L.E.; Youngs, V.L. Rapid Colorimetric Determination of Nitrate in Plant Tissue by Nitration of Salicylic Acid. Soil Sci. Plant Anal. 1975, 6, 71–80. [Google Scholar] [CrossRef]
  40. Schnetger, B.; Lehners, C. Determination of Nitrate plus Nitrite in Small Volume Marine Water Samples Using Vanadium(III)Chloride as a Reduction Agent. Mar. Chem. 2014, 160, 91–98. [Google Scholar] [CrossRef]
  41. Zenki, M.; Nose, K.; Tôei, K. Spectrophotometric Determination of Boron with an Azomethine H Derivative Spektralphotometrische Borbestimmung Mit Einem Azomethin H-Derivat. Anal. Bioanal. Chem. 1989, 334, 238–241. [Google Scholar] [CrossRef]
  42. Adhikari, N.D.; Simko, I.; Mou, B. Phenomic and Physiological Analysis of Salinity Effects on Lettuce. Sensors 2019, 19, 4814. [Google Scholar] [CrossRef]
  43. Alexopoulos, A.A.; Assimakopoulou, A.; Panagopoulos, P.; Bakea, M.; Vidalis, N.; Karapanos, I.C.; Petropoulos, S.A. Impact of Salinity on the Growth and Chemical Composition of Two Underutilized Wild Edible Greens: Taraxacum Officinale and Reichardia Picroides. Horticulturae 2021, 7, 160. [Google Scholar] [CrossRef]
  44. Vidalis, N.; Kourkouvela, M.; Argyris, D.-C.; Liakopoulos, G.; Alexopoulos, A.; Petropoulos, S.A.; Karapanos, I. The Impact of Salinity on Growth, Physio-Biochemical Characteristics, and Quality of Urospermum Picroides and Reichardia Picroides Plants in Varied Cultivation Regimes. Agriculture 2023, 13, 1852. [Google Scholar] [CrossRef]
  45. Ntanasi, T.; Karavidas, I.; Consentino, B.B.; Spyrou, G.P.; Giannothanasis, E.; Marka, S.; Gerakari, M.; Passa, K.; Gohari, G.; Bebeli, P.J.; et al. Innovative and Sustainable Management Practices and Tools for Enhanced Salinity Tolerance of Vegetable Crops. Horticulturae 2025, 11, 1004. [Google Scholar] [CrossRef]
  46. Neocleous, D.; Savvas, D.; Giannothanasis, E.; Ntatsi, G. Partial Substitution of Nitrate by Chloride in Fertigation Recipes Allows for Lower Nitrate Input in Hydroponic Lettuce Crops. Front. Plant Sci. 2024, 15, 1411572. [Google Scholar] [CrossRef] [PubMed]
  47. Cedeño, J.; Magán, J.J.; Thompson, R.B.; Fernández, M.D.; Gallardo, M. Reducing Nutrient Loss in Drainage from Tomato Grown in Free-Draining Substrate in Greenhouses Using Dynamic Nutrient Management. Agric. Water Manag. 2023, 287, 108418. [Google Scholar] [CrossRef]
  48. White, P.J. Ion Uptake Mechanisms of Individual Cells and Roots: Short-Distance Transport. In Marschner’s Mineral Nutrition of Higher Plants; Marschner, P., Ed.; Academic Press: London, UK, 2012; pp. 7–48. [Google Scholar]
  49. Kathpalia, R.; Bhatla, S.C. Plant Mineral Nutrition. In Plant Physiology, Development and Metabolism; Springer Nature: Singapore, 2018; pp. 37–81. [Google Scholar]
  50. Chang, D.C.; Park, C.S.; Kim, S.Y.; Lee, Y.B. Growth and Tuberization of Hydroponically Grown Potatoes. Potato Res. 2012, 55, 69–81. [Google Scholar] [CrossRef]
  51. Manzocco, L.; Foschia, M.; Tomasi, N.; Maifreni, M.; Dalla Costa, L.; Marino, M.; Cortella, G.; Cesco, S. Influence of Hydroponic and Soil Cultivation on Quality and Shelf Life of Ready-to-Eat Lamb’s Lettuce (Valerianella locusta L. Laterr). J. Sci. Food Agric. 2011, 91, 1373–1380. [Google Scholar] [CrossRef] [PubMed]
  52. Bian, Z.; Wang, Y.; Zhang, X.; Li, T.; Grundy, S.; Yang, Q.; Cheng, R. A Review of Environment Effects on Nitrate Accumulation in Leafy Vegetables Grown in Controlled Environments. Foods 2020, 9, 732. [Google Scholar] [CrossRef] [PubMed]
  53. Chen, B.M.; Wang, Z.H.; Li, S.X.; Wang, G.X.; Song, H.X.; Wang, X.N. Effects of Nitrate Supply on Plant Growth, Nitrate Accumulation, Metabolic Nitrate Concentration and Nitrate Reductase Activity in Three Leafy Vegetables. Plant Sci. 2004, 167, 635–643. [Google Scholar] [CrossRef]
  54. Anjana; Umar, S.; Iqbal, M. Factors Responsible for Nitrate Accumulation: A Review. In Sustainable Agriculture; Springer: Dordrecht, The Netherlands, 2009; pp. 533–549. [Google Scholar]
  55. Jakobsen, S.T. Interaction between Plant Nutrients: III. Antagonism between Potassium, Magnesium and Calcium. Acta Agric. Scand. B Soil Plant Sci. 1993, 43, 1–5. [Google Scholar] [CrossRef]
  56. Vanitha, P.; Indirani, R. Synergistic and Antagonistic Interactions of Calcium with Other Nutrients in Soil and Plants. SSRN Electron. J. 2019. Available online: https://ssrn.com/abstract=3503225 (accessed on 20 August 2025).
  57. Pyun, S.-I. Thermodynamic Aspects of Energy Conversion Systems with Focus on Osmotic Membrane and Selectively Permeable Membrane (Donnan) Systems Including Two Applications of the Donnan Potential. ChemTexts 2021, 7, 20. [Google Scholar] [CrossRef]
  58. Kochian, L.V. Mechanisms of micronutrient uptake and translocation in plants. In Micronutrients in Agriculture; Mortvedt, J.J., Cox, F.R., Shuman, L.M., Welch, R.M., Eds.; Soil Science Society of America: Madison, WI, USA, 1991; pp. 229–296. [Google Scholar] [CrossRef]
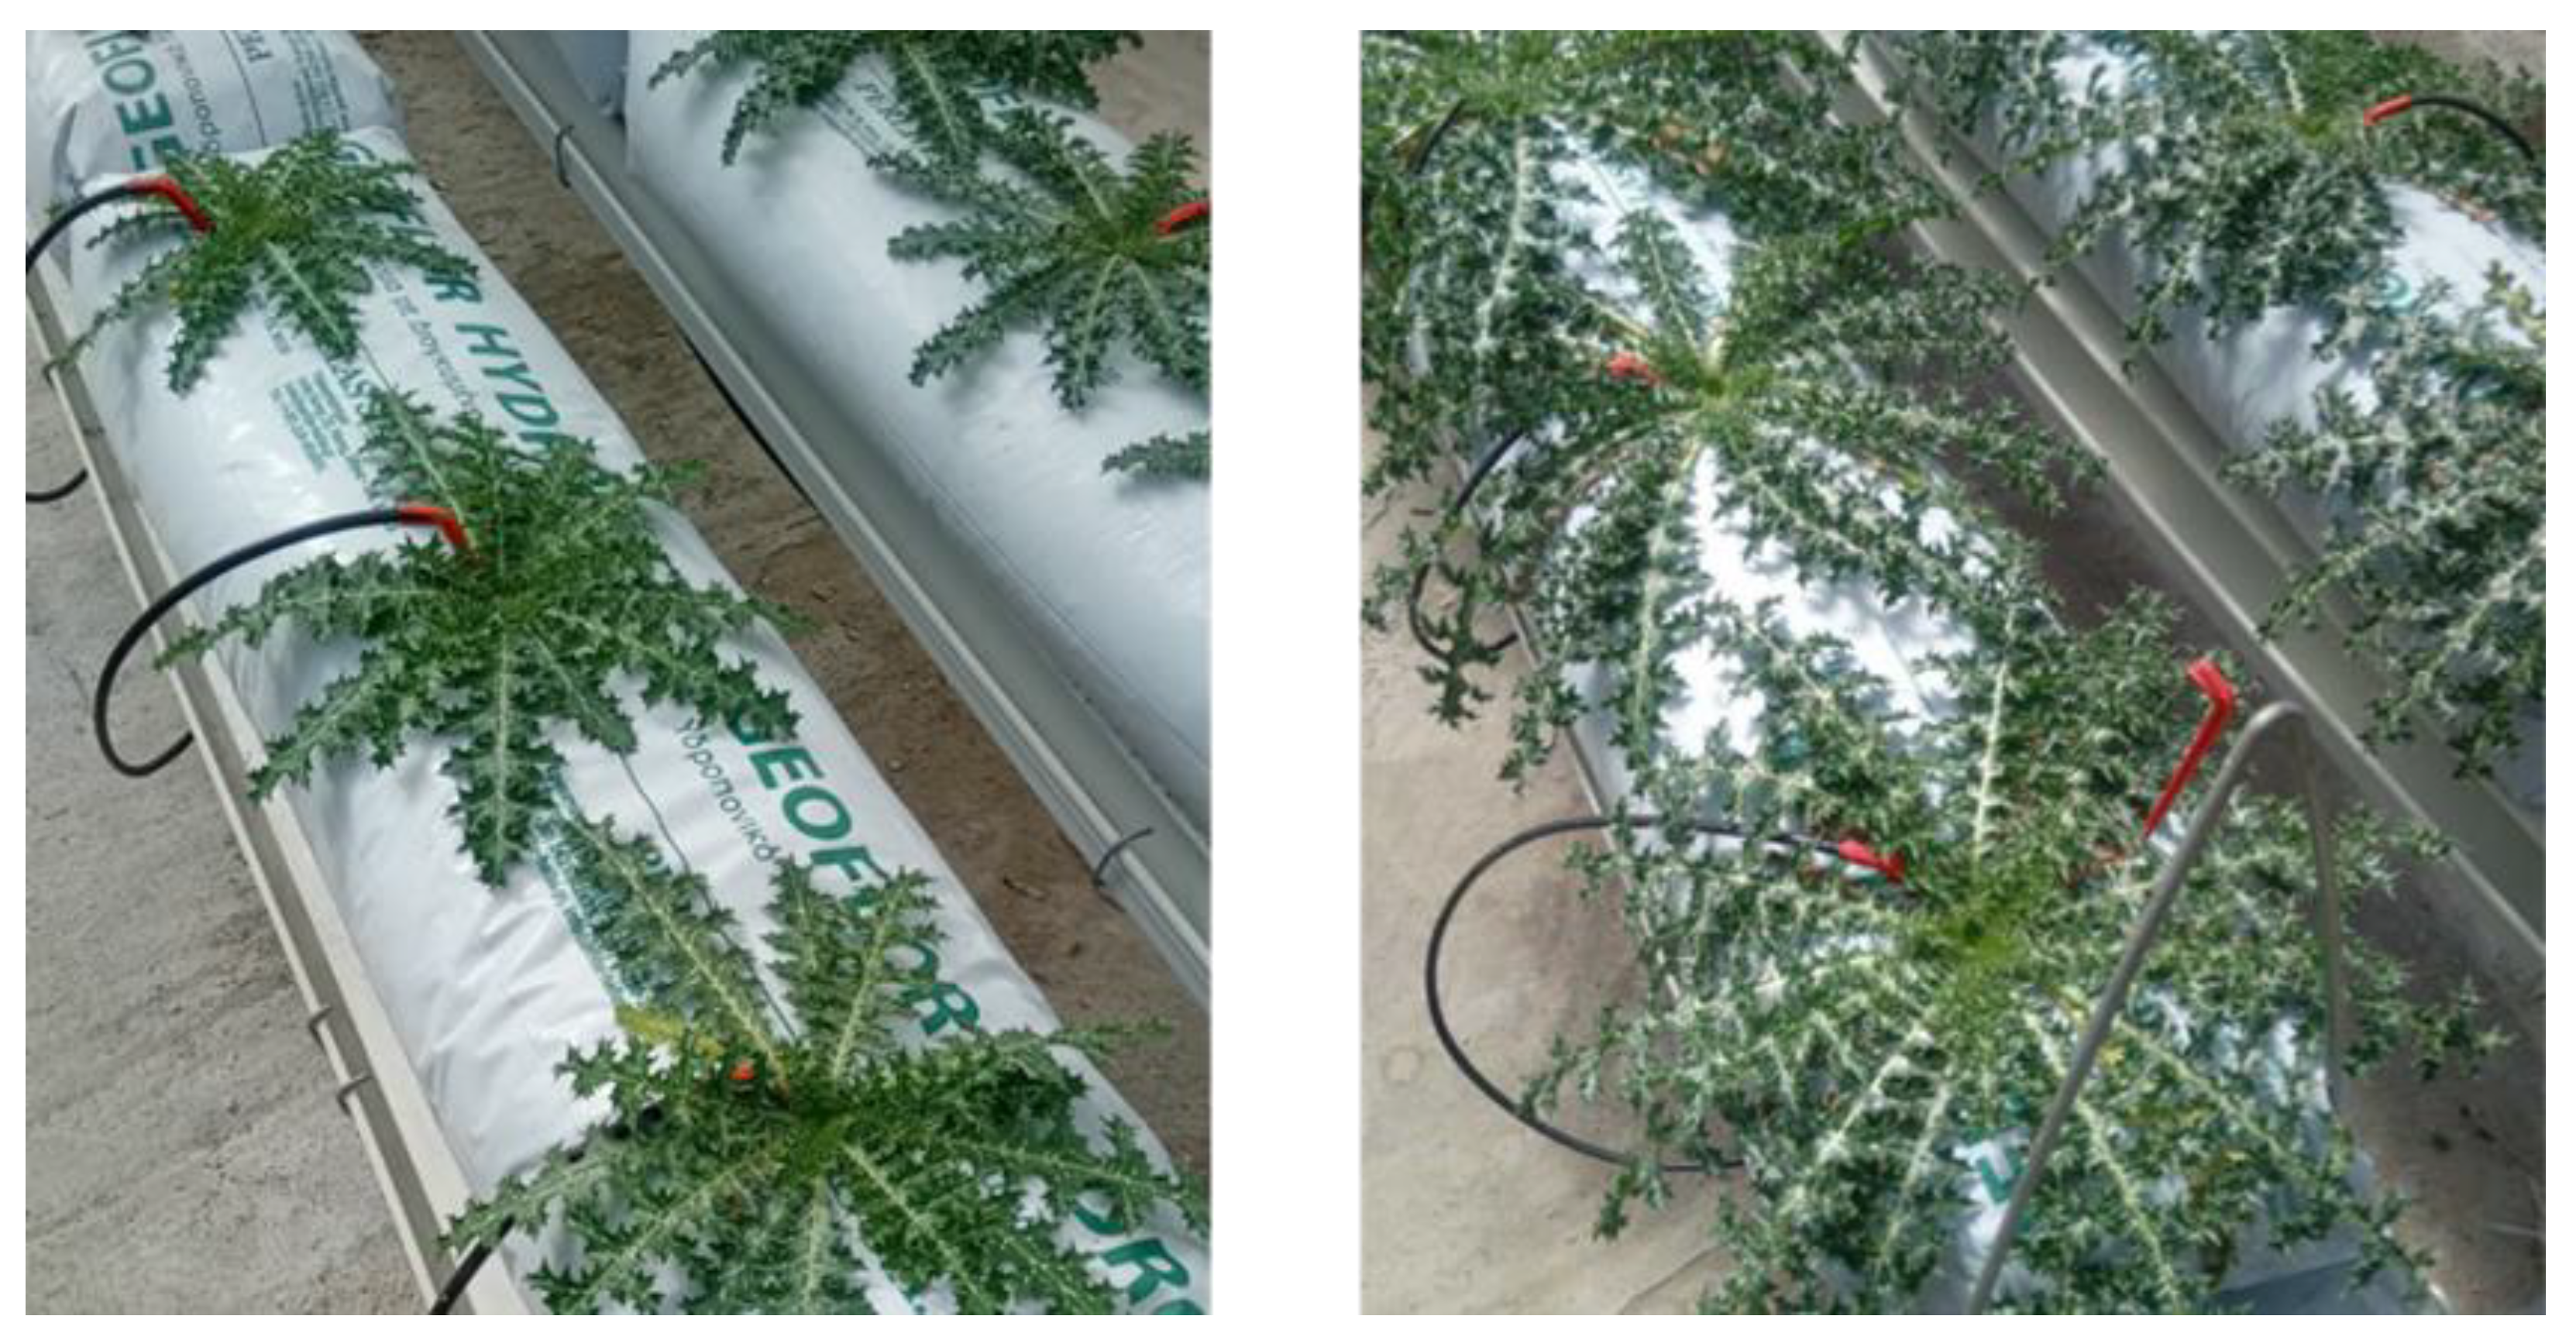
Figure 1. Golden thistle plants 48 (left) and 96 (right) days after transplanting.
Agronomy 15 02287 g001
Figure 2. Cumulative water uptake (L plant−1) by golden thistle plants as influenced by combining low (LEC) or high (HEC) EC (2.2 and 2.8 dS m−1) with low (LN) or high (HN) N levels (13.3 and 17.3 mmol L−1) in the supplied nutrient solution.
Agronomy 15 02287 g002
Figure 3. Electrical conductivity of the drainage solution on the sampling days from a golden thistle L. crop grown on perlite as influenced by combining low (LEC) or high (HEC) electrical conductivity (2.2 or 2.8 dS m−1) with low (LN) or high (HN) nitrogen levels (13.3 or 17.3 mmol L−1) in the supplied nutrient solution. Mean values with different lower-case letters differ significantly according to the ANOVA and the Duncan’s Multiple-Range test (p ≤ 0.05). Vertical bars indicate standard errors of means, point colors indicate treatments.
Agronomy 15 02287 g003
Figure 4. Macronutrient concentrations in the drainage solution sampled from a golden thistle crop grown on perlite as influenced by combining low (LEC) or high (HEC) electrical conductivity (2.2 or 2.8 dS m−1) with low (LN) or high (HN) nitrogen levels (13.3 or 17.3 mmol L−1) in the supplied nutrient solution. Mean values with different lower-case letters differ significantly according to the ANOVA and the Duncan’s Multiple-Range test (p ≤ 0.05). Vertical bars indicate standard errors of means, point colors indicate treatments.
Agronomy 15 02287 g004
Figure 5. Micronutrient concentrations in the drainage solution sampled from a golden thistle crop grown on perlite as influenced by combining low (LEC) or high (HEC) electrical conductivity (2.2 or 2.8 dS m−1) with low (LN) or high (HN) nitrogen levels (13.3 or 17.3 mmol L−1) in the supplied nutrient solution. Mean values with different lower-case letters differ significantly according to ANOVA and the Duncan’s Multiple-Range test (p ≤ 0.05). Vertical bars indicate standard errors of means, point colors indicate treatments.
Agronomy 15 02287 g005
Table 1. Nutrient concentration of the four experimental treatments.
ParameterHEC-HNHEC-LNLEC-HNLEC-LN
EC (dS m−1)2.802.802.202.20
pH5.605.605.605.60
K+ (mmol L−1)9.309.307.007.00
Ca2+ (mmol L−1)5.005.003.753.75
Mg2+ (mmol L−1)2.502.501.901.90
NH4+ (mmol L−1)1.301.301.301.30
SO42− (mmol L−1)4.014.011.011.01
NO3 (mmol L−1)16.0012.0016.0012.00
P (mmol L−1)1.201.201.201.20
Fe (μmol L−1)20.0020.0020.0020.00
Mn (μmol L−1)10.0010.0010.0010.00
Zn (μmol L−1)6.006.006.006.00
Cu (μmol L−1)0.800.800.800.80
B (μmol L−1)30.0030.0030.0030.00
Mo (μmol L−1)0.500.500.500.50
Si (mmol L−1) 0.000.000.000.00
Cl (mmol L−1)0.404.400.404.40
Na+ (mmol L−1)0.400.400.400.40
HCO3 (mmol L−1)0.390.390.390.39
K:(K + Ca + Mg) mol:mol0.550.550.550.55
Ca:(K + Ca + Mg) mol:mol0.300.300.300.30
Mg:(K + Ca + Mg) mol:mol0.150.150.150.15
NH4: Total-N mol:mol0.080.100.080.10
Note: HEC-HN: high EC–high N concentration, HEC-LN: high EC–low N, LEC-HN: low EC–high N and LEC-LN: low EC–low N.
Table 2. Effect of the electrical conductivity (LEC: 2.2 dS m−1; HEC: 2.8 dS m−1) and the N supply level (LN: 13.30 mmol L−1; HN: 17.30 mmol L−1) in the supplied nutrient solution on plant growth parameters at 96 days after transplanting.
TreatmentNumber of Leaves Rosette
Diameter (cm)
Shoot Fresh Weight (g)Roots Fresh Weight (g)Shoot Dry Weight (g)Roots Dry Weight (g)
HEC-HN4350.8177.9117.018.917.8
HEC-LN4151.7193.9132.114.817.0
LEC-HN4852.6231.8125.124.621.4
LEC-LN4749.8241.5122.522.121.6
Main effects
LEC48 a51.2236.6 a123.823.3 a21.5
HEC42 b51.2185.9 b124.516.8 b17.4
LN4450.7217.7127.318.419.3
HN4651.7204.8121.021.719.6
Statistical significance
EC*NS**NS**NS
NNSNSNSNSNSNS
EC × NNSNSNSNSNSNS
Note: In each row, means (n = 4) of the two treatments are presented. Statistical differences according to ANOVA test are denoted by NS for not significant, while *, and **, indicate significance at p ≤ 0.05, p ≤ 0.01, and p ≤ 0.001, respectively. Mean values with different lower-case letters differ significantly (p ≤ 0.05) according to the Duncan’s Multiple-Range test.
Table 3. Macronutrient concentrations in the shoot dry mass and NO3 concentration in the fresh weight (FW) of golden thistle plants at 48 and 96 days after transplanting as influenced by combining low (LEC) or high (HEC) electrical conductivity (2.2 or 2.8 dS m−1) with low (LN) or high (HN) nitrogen levels (13.3 or 17.3 mmol L−1) in the supplied nutrient solution.
TreatmentTotal-N (mg g−1)P (mg g−1)K (mg g−1)Ca (mg g−1)Mg (mg g−1)NO3
(mg Kg−1 FW)
48 DAT
Main effects
LEC46.29.4165.6 b2.62 4.092450
HEC44.69.2474.8 a2.043.712664
LN44.58.6971.42.58 4.031821 b
HN46.39.9669.02.083.773293 a
Statistical significance
ECNSNS*NSNSNS
NNSNSNSNSNS***
EC × NNSNSNSNSNSNS
96 DAT
Main effects
LEC32.3 b9.0174.4 b6.44 a5.362711
HEC37.2 a8.6481.1 a4.64 b5.643081
LN32.9 b 8.8478.85.205.552391 b
HN36.6 a8.8276.85.885.453601 a
Statistical significance
EC*NS**NSNS
N*NSNSNSNS*
EC × NNSNSNSNSNSNS
Note: In each row, means (n = 4) of the two treatments are presented. Statistical differences according to ANOVA test are denoted by NS for not significant, while * and *** indicate significance at p ≤ 0.05 and p ≤ 0.001, respectively. Mean values with different lower-case letters within each sampling date differ significantly (p ≤ 0.05) according to the Duncan’s Multiple-Range test.
Table 4. Macronutrient concentrations in the root dry mass of golden thistle plants at 48 and 96 days after transplanting as influenced by combining low (LEC) or high (HEC) electrical conductivity (2.2 or 2.8 dS m−1) with low (LN) or high (HN) nitrogen levels (13.3 or 17.3 mmol L−1) in the supplied nutrient solution.
TreatmentTotal-N (mg g−1)P (mg g−1)K (mg g−1)Ca (mg g−1)Mg (mg g−1)
48 DAT
HEC-HN24.9 b8.6032.50.331.09
HEC-LN24.4 b8.0738.00.341.00
LEC-HN29.3 a8.2929.50.321.10
LEC-LN22.1 c9.9323.50.341.38
Main effects
LEC25.7 9.1126.5 b0.331.24
HEC24.68.3335.3 a0.341.04
LN23.2 b9.0030.80.341.19
HN27.1 a8.4431.00.331.09
Statistical significance
ECNSNS*NSNS
N**NSNSNSNS
EC × N**NSNSNSNS
96 DAT
29.38.2124.250.341.17
HEC-LN25.88.6420.000.280.98
LEC-HN26.98.6020.630.311.10
LEC-LN25.19.3717.00 0.291.00
Main effects
LEC26.08.9918.8 b0.301.05
HEC27.68.4222.1 a0.311.08
LN25.5 b9.0018.5 b0.280.99
HN28.1 a8.4122.4 a0.321.13
Statistical significance
ECNSNS*NSNS
N**NS*NSNS
EC × NNSNSNSNSNS
Note: In each row, means (n = 4) of the two treatments are presented. Statistical differences according to ANOVA test are denoted by NS for not significant, while * and ** indicate significance at p ≤ 0.05 and p ≤ 0.01, respectively. Mean values with different lower-case letters within each sampling date differ significantly (p ≤ 0.05) according to the Duncan’s Multiple-Range test.
Table 5. Micronutrient concentrations in the shoot dry mass of golden thistle plants grown on perlite at 48 and 96 days after transplanting as influenced by combining low (LEC) or high (HEC) electrical conductivity (2.2 or 2.8 dS m−1) with low (LN) or high (HN) nitrogen levels (13.3 or 17.3 mmol L−1) in the supplied nutrient solution. Mean values with different lower-case letters within each sampling date differ significantly (p ≤ 0.05) according to the Duncan’s Multiple-Range test.
TreatmentFe (mg Kg−1)Mn (mg Kg−1)Zn (mg Kg−1)Cu (mg Kg−1)B (mg Kg−1)
48 DAT
HEC-HN92.555.937.88.3235.9 b
HEC-LN75.554.040.78.2041.0 ab
LEC-HN63.447.540.46.8231.5 b
LEC-LN58.540.336.25.2659.6 a
Main effects
LEC60.9 b43.9 b38.36.04 b45.6
HEC84.0 a55.0 a39.28.26 a38.4
LN67.047.138.56.7350.3 a
HN77.951.739.17.5733.7 b
Statistical significance
EC****NS*NS
NNSNSNSNS**
EC × NNSNSNSNS*
96 DAT
HEC-HN43.0 b100.137.57.0862.0
HEC-LN163.1 a125.344.08.2784.4
LEC-HN38.1 b103.832.87.6349.2
LEC-LN47.4 b108.745.69.0554.1
Main effects
LEC42.7106.339.28.3451.6 b
HEC103.1112.740.77.6773.2 a
LN105.2117.0 a44.88.66 a69.2 a
HN40.6101.9 b35.17.36 b55.6 b
Statistical significance
EC**NSNSNS***
N****NS*****
EC × N**NSNSNSNS
Note: In each row, means (n = 4) of the two treatments are presented. Statistical differences according to ANOVA test are denoted by NS for not significant, while *, **, and *** indicate significance at p ≤ 0.05, p ≤ 0.01, and p ≤ 0.001, respectively.
Table 6. Micronutrient concentrations in the root dry mass of golden thistle plants grown on perlite at 48 and 96 days after transplanting as influenced by combining low (LEC) or high (HEC) electrical conductivity (2.2 or 2.8 dS m−1) with low (LN) or high (HN) nitrogen levels (13.3 or 17.3 mmol L−1) in the supplied nutrient solution. Mean values with different lower-case letters within each sampling date differ significantly (p ≤ 0.05) according to the Duncan’s Multiple-Range test.
TreatmentFe (mg Kg−1)Mn (mg Kg−1)Zn (mg Kg−1)Cu (mg Kg−1)B (mg Kg−1)
48 DAT
LEC41.620.361.87.2734.2 a
HEC53.117.567.08.7117.8 b
LN49.318.866.07.7424.0
HN45.418.962.88.2528.1
Statistical significance
ECNSNSNSNS*
NNSNSNSNSNS
EC × NNSNSNSNSNS
96 DAT
LEC30.0 b23.0 a64.88.6718.7
HEC48.7 a19.6 b73.48.1821.1
LN40.723.0 a66.87.8015.3 b
HN38.119.7 b71.39.0424.5 a
Statistical significance
EC**NSNSNS
NNS*NSNS*
EC × NNSNSNSNSNS
Note: In each row, means (n = 4) of the two treatments are presented. Statistical differences according to ANOVA test are denoted by NS for not significant, while * indicate significance at p ≤ 0.05).
Table 7. Water productivity (WP) and agronomic efficiency (AE) of N, K, Ca, Mg, S, and P of S. hispanicus crops grown on perlite at 48 and 96 days after transplanting as influenced by combining low (LEC) or high (HEC) electrical conductivity (2.2 or 2.8 dS m−1) with low (LN) or high (HN) nitrogen levels (13.3 or 17.3 mmol L−1) in the supplied nutrient solution. Mean values with different lower-case letters within each sampling date differ significantly (p ≤ 0.05) according to the Duncan’s Multiple-Range test.
TreatmentWPAENAEKAECaAEMgAESAEP
HEC-HN3.9216.2010.8219.6264.5930.58105.48
HEC-LN4.7325.4313.0523.6777.9436.90127.28
LEC-HN4.5118.6016.5030.0497.59139.41121.12
LEC-LN4.6024.6816.8430.6499.55142.21123.55
Main effects
HEC4.3320.8211.94 b21.65 b71.27 b33.74 b116.38
LEC4.5521.6416.67 a30.34 a98.57 a140.81 a122.34
HN4.2117.40 b13.6624.8381.0984.99113.30
LN4.6725.06 a14.9527.1688.7589.55125.42
Statistical significance
ECNSNS************NS
NNS***NSNSNSNSNS
EC × NNSNSNSNSNSNSNS
Note: In each row, means (n = 4) of the two treatments are presented. Statistical differences according to ANOVA test are denoted by NS for not significant, while *** indicate significance at p ≤ 0.001).
Disclaimer/Publisher’s Note: The statements, opinions and data contained in all publications are solely those of the individual author(s) and contributor(s) and not of MDPI and/or the editor(s). MDPI and/or the editor(s) disclaim responsibility for any injury to people or property resulting from any ideas, methods, instructions or products referred to in the content.