Abstract
Efficient water management is critical for sustainable crop production in arid and semi-arid regions. This study investigated the effects of two irrigation regimes—25% and 50% Management Allowable Depletion (MAD) and two planting patterns (single-row and double-row) on evapotranspiration (ET) partitioning, water use efficiency (WUE), and water footprint (WF) in drip-irrigated faba bean (Vicia faba L.). Field data were combined with a leaf area index (LAI)-based model to estimate the relative contributions of transpiration (T) and evaporation (E) to total ET. The highest grain yield (6171 kg ha−1) and the lowest blue (570 m3 ton−1) and green (68 m3 ton−1) water footprints were recorded under the 25% MAD with double-row planting. This treatment also achieved the highest proportion of transpiration in ET (70%), indicating a shift toward productive water use. In contrast, the lowest-performing treatment (50% MAD, single-row) had the highest total water footprint (792 m3 ton−1) and the lowest transpiration share (44%). Although high-density planting slightly reduced WUE based on transpiration, it improved overall water efficiency when total input (ETc) was considered (1.57 kg m−3 for total input WUE, 4.17 kg/m−3 for T-based WUE). These findings highlight the importance of integrating irrigation scheduling and planting pattern to improve both physiological and agronomic water productivity. The approach offers a practical strategy for sustainable faba bean production in water-scarce environments and supports climate-resilient irrigation planning aligned with Iraq’s National Water Strategy.
1. Introduction
Water scarcity is an escalating global concern driven by population growth, urbanization, and the accelerating impacts of climate change [1]. Climate-induced shifts in weather patterns, intensified droughts, and rising evaporation rates are diminishing global freshwater availability. Bates et al. [2] reported that approximately 50% of the world’s population will live in areas experiencing severe water stress.
In Iraq, the challenge of water scarcity is particularly acute due to its semi-arid climate and high dependency on the Tigris and Euphrates rivers. These vital water sources are increasingly compromised by pollution, sedimentation, and upstream withdrawals [3]. Groundwater resources, though used extensively, are limited, often overexploited, and of marginal quality. Rising temperatures and declining precipitation, driven by climate change, are expected to exacerbate these issues—posing serious threats to national water security and the agricultural sector, which remains a cornerstone of Iraq’s economy and rural livelihoods [4].
Against water scarcity challenges, the concept of the water footprint (WF) has emerged as a powerful framework for quantifying water use and guiding sustainable management. Introduced by Hoekstra in 2002 [5,6], the WF assesses the total volume of freshwater consumed or polluted across the lifecycle of a product or service. In agriculture, the plant water footprint refers to the water consumed throughout a crop’s growth cycle and is a valuable tool for identifying water-intensive practices and promoting efficiency [7].
The water footprint has emerged as a powerful framework for assessing freshwater use across agricultural systems, dividing water consumption into green (rainwater), blue (irrigation), and gray (pollution assimilation) components [5,6,7,8]. In crop production, optimizing the WF requires a deep understanding of evapotranspiration (ET)—the sum of evaporation (E) and transpiration (T)—which represents the major water loss pathway and is closely linked to irrigation demand [9,10]. Partitioning ET into its components is essential, as transpiration is the productive flux contributing to biomass, while evaporation is non-beneficial. Leaf area index (LAI), a proxy for canopy development, plays a key role in determining ET partitioning. As LAI increases, transpiration typically rises due to greater stomatal area, while soil evaporation decreases due to shading [11,12,13,14]. Integrating ET partitioning with WF analysis therefore offers a more comprehensive view of water use efficiency (WUE) in crop systems and informs more sustainable irrigation strategies. Recent studies confirm that LAI strongly governs T/ET ratios across ecosystems, including semi-arid cropping systems, reinforcing its role in water use modeling [15,16]. A 2024 field study on lentil further demonstrated how conservation tillage and mulching influence the partitioning of ET and crop coefficients under rainfed conditions [17].
Belmans et al. [18] proposed a model linking LAI and ET components:
where E (mm/day) is the potential soil evaporation, LAI is the leaf area index, and ET (mm/day) is the potential evapotranspiration. The coefficient 0.6 is an empirically derived extinction parameter (k) that represents the reduction in soil evaporation due to canopy shading. While it does not vary significantly across crop types, it reflects a general canopy light interception behavior and is commonly used in soil–plant–atmosphere transfer models [18,19]. However, this constant value is a simplification, as the extinction coefficient can vary with solar zenith angle, canopy architecture, and leaf orientation, particularly in heliotropic species such as Vicia faba. Diurnal changes in leaf position may cause k to temporarily deviate from 0.6, although the specific impact of heliotropism in this species on leaf area index remains uncertain. Nevertheless, the value of 0.6 has been widely adopted following its empirical derivation for cotton (k = 0.623) [20], its generalization in the SWATRE framework by Belmans et al. [18], and subsequent validation for wheat and barley [21], soybean [22], and other crops in multi-year datasets [12,23,24]. These studies support its use as a robust average extinction coefficient across crop types and environmental conditions when applied at seasonal or growth-stage time steps However, excessively high LAI, often resulting from dense planting, can increase water demand and potentially reduce yield due to competition for light, nutrients, and moisture [25].
Faba bean (Vicia faba L.), a widely grown cool-season legume, offers considerable agronomic and nutritional benefits. It is rich in protein, amino acids, and minerals, making it valuable for both food and fodder [26]. Due to its frost and drought tolerance and relatively low water footprint, it is considered a water-efficient crop suitable for sustainable production in water-scarce environments [27]. In Iraq, faba bean plays a vital role in food security and soil fertility through its nitrogen-fixing capacity, and is widely cultivated in the northern and western regions [28]. Recent reviews emphasize the role of legumes, including faba bean, in improving soil fertility, enhancing plant resilience to salinity and drought, and rehabilitating arid lands through plant growth-promoting rhizobacteria (PGPR) and rhizobium symbiosis [29]. In the Mediterranean and semi-arid regions, faba bean is identified as a strategic crop with economic significance, adaptability to marginal soils, and potential for sustainable intensification [30].
Drip irrigation, by delivering water directly to the plant root zone, has been shown to significantly improve irrigation efficiency [31] and reduce the WF compared to traditional surface irrigation methods, who demonstrated substantial water savings and yield benefits in arid regions, this builds on early evaluations of trickle irrigation systems by Keller and Bliesner [32]. Studies indicate potential water savings of 20% through drip systems, with further gains achievable via regulated deficit irrigation and precise scheduling [33].
Despite the growing attention to crop water footprints, relatively few field studies have explored the interactions between WF components, ET partitioning, and crop physiological responses under real-world conditions. Even fewer have focused on legumes like faba bean, particularly in semi-arid environments such as Iraq, where maximizing water productivity is essential. Integrating WF assessment with ET dynamics provides a valuable approach to identifying sustainable irrigation strategies that balance water use efficiency with crop performance [34,35]. Optimized irrigation strategies not only enhance soil moisture conditions but also play a critical role in managing soil salinity, thereby supporting improved crop yield [36,37].
Recent research on evapotranspiration partitioning increasingly relies on advanced and data-intensive approaches such as flux tower measurements, micro-lysimeters, and machine learning techniques. For example, Bao et al. [24] used an improved stomatal conductance model coupled with eddy covariance and lysimeter data to estimate ET in semi-arid maize systems, while Kar et al. [16] applied a machine learning framework to partition ET using flux tower data and hydrometeorological drivers. Although these methods offer high accuracy, they are often impractical in resource-limited settings due to their infrastructural and computational demands. In contrast, the current study employs a simplified LAI-based partitioning approach that is more accessible for on-the-ground irrigation decision-making and applicable to legume crops like faba bean under drip irrigation.
This study examines how planting patterns, affecting LAI, and Management Allowable Depletion (MAD) thresholds influence the WF and ET partitioning in drip-irrigated faba bean. Special emphasis is placed on the role of transpiration as the productive component of ET, directly contributing to biomass accumulation. The specific objectives are to:
- (i)
- assess the effects of planting pattern and MAD levels on blue and green WF;
- (ii)
- quantify the partitioning of ET into evaporation and transpiration under different crop and irrigation management scenarios.
The study combines field-based measurements with WF analysis and Model-based partitioning of ET components, offering a multi-dimensional perspective on WUE under practical agricultural conditions. It aligns with broader efforts in climate-smart agriculture and supports the goals outlined in Iraq’s National Water Resources Strategy, which emphasizes efficient irrigation and sustainable cropping systems. By addressing WUE and irrigation optimization, the study contributes to the development of evidence-based policies for agricultural water management in water-stressed regions and promotes more sustainable resource use in semi-arid farming systems.
2. Materials and Methods
2.1. Experimental Site and Design
A field experiment was conducted during the winter season at the experimental farm of the College of Agriculture, University of Anbar, Iraq (33.42° N, 43.33° E), to investigate the effects of planting pattern (which influences LAI) and MAD levels on the WF and ET partitioning in drip-irrigated faba bean (Vicia faba L.). The experimental design was a factorial arrangement in a randomized complete block design (RCBD) with three replications. Treatments included:
- Two irrigation regimes based on MAD:
- ○
- M1: 25% depletion of plant-available water
- ○
- M2: 50% depletion of plant-available water
- Two planting patterns:
- ○
- L1: Single-row planting (plants spaced 25 cm apart along one side of the drip line)
- ○
- L2: Double-row planting (plants placed on both sides of the drip line)
Each plot measured 2 × 20 m, with a 1 m buffer between plots and 1.5 m between sectors. A drip irrigation system of the GR type was used, equipped with emitters discharging at a rate of 4 L h−1. Seeds of the ‘Veto’ variety were sown on 29 October at a depth of 10 cm, using 25 cm intra-row spacing. Standard crop management practices—including manual weeding, pest and disease control, and fertilization—were applied according to national recommendations.
2.2. Soil Properties
A representative soil material sample from the root zone (0–30 cm) was collected before planting for laboratory analysis. Table 1 summarizes the key physicochemical properties of the soil.

Table 1.
Basic soil properties of the experimental site.
2.3. Irrigation Scheduling and Soil Moisture Monitoring
Irrigation was scheduled based on soil water depletion, monitored daily. Undisturbed soil samples were taken from the root zone and analyzed using a moisture analyzer balance. The current depletion was calculated by comparing measured water content to field capacity and wilting point. Irrigation was applied once the predefined MAD threshold (25% or 50% of plant-available water) was reached, and water was added to restore soil moisture to field capacity.
2.4. Crop Measurements
At physiological maturity, the following parameters were measured from a central area in each plot:
- Dry biomass yield (g plant−1).
- Plant height (cm).
- Root depth (cm).
- Yield (kg ha−1).
- LAI
Leaf area index was estimated at four key growth stages: vegetative, flowering, pod development, and maturity (LAI development throughout the season is shown in Supplementary Material Table S1). In each treatment plot, five representative plants were randomly selected from the central area to avoid edge effects. All leaves from these plants were detached, flattened, and measured individually. Leaf area (LA) was estimated using the model developed by [38], based on linear leaf dimensions (length and width), according to the equation:
where L is leaf length (cm) and W is leaf width (cm), yielding leaf area (LA) in cm2 per leaf. This value was converted to m2 per leaf (by dividing by 10,000) prior to calculating LAI, ensuring LAI is expressed as m2 m−2.
LAI was then calculated as:
2.5. Estimation of Evapotranspiration and Its Components
Total crop evapotranspiration (ETc) was estimated using the soil water balance method [14], as follows:
where
- I = irrigation (mm).
- P = effective precipitation (mm).
- D = deep percolation (assumed negligible).
- R = runoff (assumed negligible due to drip irrigation).
- ΔS = change in soil moisture storage (mm).
The change in soil moisture storage (ΔS) was calculated by subtracting the volumetric water content before irrigation from that after irrigation, using undisturbed soil core samples. The samples were collected using metal cylinders, weighed, and oven-dried at 105 °C for 24 h. Volumetric water content was derived from the gravimetric water content and bulk density. These values were then converted to millimeters of stored water over the root zone depth and used in the soil water balance model. Soil samples were collected periodically (every 2–3 days depending on soil moisture conditions) throughout the season from all treatments to determine irrigation timing and amount according to the respective MAD treatments.
Evaporation was estimated following the LAI approach [12] using the model (SWATRE) proposed by Belmans et al. [18], as previously shown in Equation (1). And the transpiration was then calculated as:
In this formulation, the extinction coefficient (k) was fixed at 0.6, following the empirical value adopted in the SWATRE framework (see Section 1 for detailed justification and references). While k can vary diurnally with solar angle and leaf orientation in heliotropic crops such as Vicia faba, using a fixed value may introduce some error in estimating instantaneous evaporation and transpiration rates, as periods of higher or lower light interception could be over- or underestimated. However, our analysis was conducted at seasonal scales, which smooths short-term variability. Moreover, as all treatments experienced identical climatic conditions, any such variation would have affected them systematically, thereby not influencing the relative comparisons among treatments.
2.6. Water Footprint Calculations
The WF was calculated following the methodology of [7], with a focus on blue and green components:
- Blue WF (m3 ton−1) = Volume of irrigation water used/Yield
- Green WF (m3 ton−1) = Volume of effective rainfall used/Yield
Irrigation amounts and effective rainfall were determined via field data and standard climatic records. The gray WF was excluded from this study due to the minimal use of agrochemicals.
2.7. Crop Water Productivity
Crop water productivity was evaluated using two complementary approaches to reflect both system-level and physiological efficiency:
Crop evapotranspiration-based WUE. This metric expresses the yield produced per unit of total water input, accounting by the ETc.
Transpiration-Based Water Use Efficiency. This metric reflects the physiological efficiency of water use by quantifying the yield (kg ha−1) produced per unit of transpired water:
where T is the transpiration component (mm), calculated by partitioning total ET using the LAI-based model (Equation (1)).
2.8. Statistical Analysis
Crop data (yield, plant height, root depth, and dry biomass yield) were subjected to analysis of variance (ANOVA), and means were compared using LSD at the 5% significance level. Statistical analyses were performed using GenStat (Version 19.1; VSN International, Hemel Hempstead, UK).
3. Results
3.1. Crop Physiological Responses
The effects of irrigation regime and planting pattern on dry biomass, plant height, root depth, and grain yield of faba bean are presented in Table 2a,b. While numerical differences were observed across treatments for all parameters, statistically significant effects and interactions were primarily detected for grain yield.
Table 2.
(a) Effects of irrigation regime (M1, M2) and planting pattern (L1, L2) on dry biomass, plant height, and root depth of faba bean. (b) Effects of irrigation regime (M1, M2) and planting pattern (L1, L2) on grain yield of faba bean.
Statistical differences among treatments were confirmed by analysis of variance (ANOVA), followed by Tukey’s HSD test for multiple comparisons. The full ANOVA results, including F-values, degrees of freedom, and significance levels for all measured traits, are presented in Supplementary Material Tables S2–S4.
For dry biomass, values ranged from 24.67 ± 4.93 g plant−1 under M2L2 (50% MAD, double row) to 34.67 ± 7.23 g plant−1 under M1L1 (25% MAD, single row). Although M1L1 showed the numerically highest biomass, statistical comparisons indicated no significant differences among treatments (full ANOVA results are provided in Supplementary Material Table S6). Similarly, no statistically significant effects were observed for plant height (ranging from 68.73 ± 7.09 cm in M2L2 to 74.87 ± 6.47 cm in M1L1, see Supplementary Material Table S8 for full ANOVA results) or for root depth (from 22.42 ± 1.30 cm in M1L2 to 24.33 ± 1.38 cm in M2L1), as all treatments belonged to the same statistical group (see Supplementary Material Table S7). These results suggest that under the conditions studied, belowground development and plant stature remained relatively stable across irrigation regimes and planting configurations.
In contrast, grain yield was significantly affected by both irrigation regime and planting pattern, as well as by their interaction (Table 2b). The highest yield was recorded in the M1L2 treatment (25% MAD, double row), with 6171.48 ± 165.51 kg ha−1, while the lowest yield was observed in M2L1 (50% MAD, single row), at 4971.47 ± 161.19 kg ha−1. Tukey’s HSD test confirmed that these two treatments were significantly different, with a yield gap of approximately 1200 kg ha−1. Treatments M1L1 and M2L2 had intermediate yields (5485.76 ± 160.39 kg ha−1 and 5657.19 ± 162.51 kg ha−1, respectively), both of which belonged to the same statistical group (“b”) as shown in Table 2b.
Grain yield was significantly affected by both irrigation regime and planting pattern (full ANOVA results in Supplementary Material Table S9), as well as by their interaction (Table 2b). The highest yield was recorded in the M1L2 treatment (25% MAD, double row), with 6171.48 ± 165.51 kg ha−1, while the lowest was in M2L1 (50% MAD, single row), at 4971.47 ± 161.19 kg ha−1. Tukey’s HSD test confirmed that M1L2 produced significantly higher yields than both M1L1 (p = 0.0038) and M2L1 (p < 0.0001). M2L2 yielded significantly more than M2L1 (p = 0.0038), but was not statistically different from M1L1 reflecting their shared group assignment. These findings indicate that both more frequent irrigation and double-row planting contribute positively to yield, with M1L2 emerging as the most productive treatment in this study.
Figure 1 shows the effect of different irrigation and planting treatments on total yield of faba bean. Different letters above boxplots indicate statistically significant differences at p < 0.05 according to Tukey’s HSD test. For full statistical details, including the ANOVA table, pairwise Tukey comparisons, and treatment means with standard deviations, See Supplementary Materials Tables S2–S4.
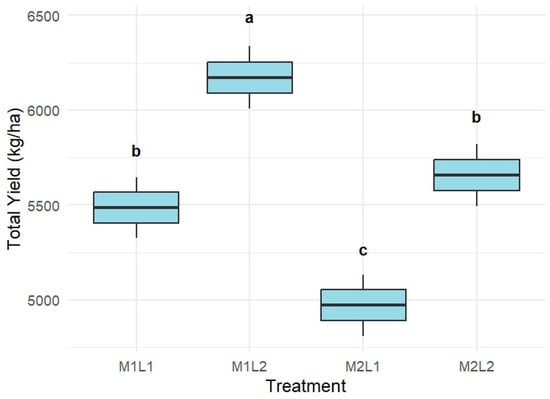
Figure 1.
Effect of different irrigation and planting treatments on total yield of faba bean. Different letters above boxplots indicate statistically significant differences at p < 0.05 according to Tukey’s HSD test. treatment combinations: M1L1 = 25% MAD, single-row, M1L2 = 25% MAD, double-row, M2L1 = 50% MAD, single-row and M2L2 = 50% MAD, double-row.
3.2. Evapotranspiration Partitioning
Figure 2 illustrates the percentage of T in total ET for the four treatment combinations, as estimated using the LAI-based model. The proportion of transpiration varied across the growing period, reflecting the effects of canopy development on water use dynamics. Absolute accumulated values of E and T at different growth stages are provided in Supplementary Material Table S5. For example, at day 135, M2L1 recorded 5.49 cm of E and only 4.36 cm of T, whereas M1L2 recorded 2.96 cm of E and 6.89 cm of T, reflecting the contrasting canopy development and shading effects.
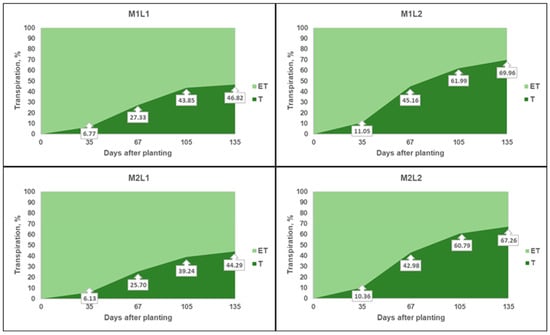
Figure 2.
Temporal dynamics of transpiration (T) and evapotranspiration (ET) as percentages of seasonal ET under different treatment combinations. The dark green area represents cumulative transpiration, while the light green area indicates cumulative evapotranspiration. Labels show transpiration values (% of seasonal ET) at key growth stages.
At day 135, when the crop reached the end of the season, the lowest transpiration fraction was recorded in the M2L1 treatment (44.29%), which combined wider irrigation intervals (50% MAD) with lower planting density (single-row pattern). This treatment had minimal canopy cover, leading to a dominance of evaporation losses. In contrast, the highest transpiration contribution at maturity was observed in M1L2 (69.96%), where frequent irrigation (25% MAD) and higher planting density (double-row) produced a dense canopy that shaded the soil surface, increased stomatal area, and enhanced water use through transpiration.
Intermediate values at maturity were recorded for M2L2 (67.26%) and M1L1 (46.82%), confirming the strong role of LAI in modulating ET partitioning and the relatively lower influence of irrigation regime alone. The data clearly indicate that planting pattern producing a higher LAI increased the share of transpiration by reducing the proportion of evaporation.
These results emphasize the importance of optimizing canopy structure to enhance the contribution of T to total ET, thereby improving physiological water productivity under semi-arid conditions. Additionally, reducing the evaporative component may enhance both water and energy efficiency in irrigation systems and help mitigate salt accumulation on the soil surface—a well-known challenge in salt-affected soils of arid regions, where evaporation drives the upward movement and accumulation of salts [39].
3.3. Water Use Efficiency
Figure 3 presents water use efficiency for the different treatment combinations, calculated based on both transpiration WUE (T) and total water input WUE (ETc), including irrigation and effective rainfall. It is worth noting that WUE is directly derived from crop yield; therefore, its statistical significance follows the same trend as that of yield. The results reveal that irrigation regime and planting pattern affected water productivity in different ways depending on the efficiency metric used.
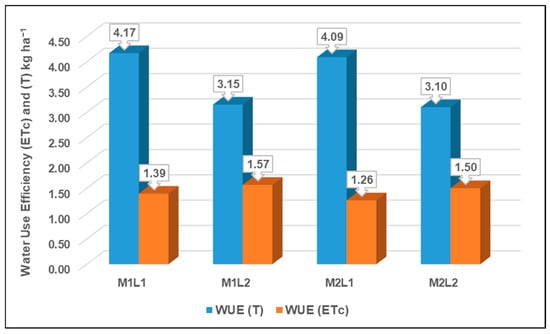
Figure 3.
Water use efficiency based on transpiration (WUE_T) and total crop evapotranspiration (WUE_ETc) for four treatment combinations of irrigation regime and planting pattern. Treatments: M1L1 = 25% MAD, single-row; M1L2 = 25% MAD, double-row; M2L1 = 50% MAD, single-row; M2L2 = 50% MAD, double-row. The value in the labels present the WUE. Bars represent mean values ± standard error (n = 3). Different colors correspond to the two WUE calculation methods.
The highest WUE (T) was observed in M1L1 (4.17 kg m−3), followed closely by M2L1 (4.09 kg m−3). These treatments combined single-row planting with contrasting irrigation regimes, yet both achieved relatively high efficiency based on transpiration. In contrast, the lowest WUE (T) values were found in the double-row planting treatments—M1L2 (3.15 kg m−3) and M2L2 (3.10 kg m−3)—indicating that increased canopy density may have increased transpiration in absolute terms but resulted in lower yield per unit of transpired water.
When considering WUE (ETc), which includes the entire crop water supply, the ranking of treatments differed. The highest system-level WUE (ETc) was recorded in M1L2 (1.57 kg m−3), followed by M2L2 (1.50 kg m−3). These double-row treatments, especially under the more frequent irrigation regime, showed better conversion of total water input into yield. In contrast, M2L1 had the lowest WUE (ETc) (1.26 kg m−3), suggesting that while it was physiologically efficient (high WUE (T)), it was less efficient when total water inputs were considered.
These contrasting patterns between WUE (T) and WUE (ETc) highlight the importance of evaluating both physiological and system-level water productivity. While single-row treatments performed better in terms of transpiration efficiency, double-row planting—particularly M1L2—proved superior in overall water use efficiency when accounting for all applied water.
The reduced transpiration-based water use efficiency observed in the double-row planting treatments (M1L2 and M2L2), despite higher LAI and transpiration, may be attributed to increased intra-specific competition. Higher planting density likely intensified competition for nutrients and light, which can limit individual plant productivity even as overall water use increases. Consequently, the yield per unit of transpired water decreased, reflecting lower physiological efficiency under denser canopy conditions. This finding is consistent with studies showing that excessive competition in dense plantings can reduce crop performance per unit resource consumed, especially when inputs like nutrients are not adjusted proportionally [40].
3.4. Water Footprint Analysis
Figure 4 shows the blue and green water footprint (BWF and GWF) of faba bean production under the four treatment combinations. Both components varied notably among treatments, reflecting the combined influence of irrigation regime and planting pattern on water source utilization and yield productivity.
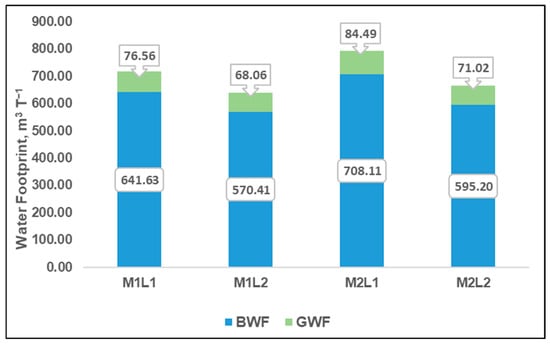
Figure 4.
Blue and Green Water Footprint.
The lowest BWF was observed in M1L2 (570.41 m3 ton−1), followed closely by M2L2 (595.20 m3 ton−1), while the highest was recorded under M2L1 (708.11 m3 ton−1). These results indicate that double-row planting was generally more efficient in converting irrigation water into yield, especially under the more frequent irrigation regime. The combination of frequent irrigation and denser canopy (M1L2) optimized transpiration and reduced evaporative losses, contributing to a lower BWF.
The green water footprint, derived from effective rainfall use, followed a similar pattern but with lower absolute values. GWF ranged from 68.06 m3 ton−1 (M1L2) to 84.49 m3 ton−1 (M2L1). As with BWF, the lowest GWF was observed in the treatment with better canopy cover and higher yield, suggesting more efficient rainfall utilization.
Among all treatments, M1L2 consistently had the lowest total water footprint (BWF + GWF = 638.47 m3 ton−1), indicating superior overall water productivity. In contrast, M2L1 had the highest combined footprint (792.60 m3 ton−1), reflecting both lower yield and higher evaporative losses due to sparse canopy and less frequent irrigation.
These results reinforce the value of integrating frequent irrigation with optimal planting density to reduce both blue and green water footprints in semi-arid environments. Lower water footprints not only signal higher water productivity but also contribute to more sustainable and climate-resilient agricultural practices in regions where water is scarce.
Given that the water footprint is directly derived from crop yield, the statistical significance between treatments aligns with the significance patterns observed for yield.
4. Discussion
This study demonstrated that both irrigation regime and planting pattern significantly influenced faba bean productivity, water use dynamics, and WF under drip irrigation in a semi-arid environment. The treatment that combined frequent irrigation with double-row planting consistently outperformed others in terms of grain yield, indicating that maintaining good soil moisture condition and optimizing canopy structure promotes more effective resource use. In contrast, the combination of wider irrigation intervals and lower planting density limited canopy development and crop performance, underscoring the importance of integrating water and crop management strategies.
Partitioning of evapotranspiration, modeled via LAI, highlighted the pivotal role of canopy architecture in shaping water use pathways. Treatments with greater LAI allocated a higher proportion of ET to transpiration, reducing non-productive evaporation losses. These findings support earlier research that emphasizes LAI as a key determinant of ET partitioning and water productivity [41]. However, denser canopies also introduced inter-plant competition for light and nutrients, which may have diminished the physiological efficiency of water use, as reflected in the lower transpiration-based WUE values observed under double-row planting [40]. In addition to these structural effects, variations in yield and water-use efficiency may also reflect underlying nutrient dynamics, particularly nitrogen fixation in faba beans. Given that planting density and irrigation practices can modulate nutrient availability, such interactions likely contributed to treatment-specific responses.
System-level water use efficiency (based on total water input) revealed a different pattern, favoring treatments with improved canopy cover and frequent irrigation. This metric integrated both water supply and yield, providing a broader perspective on resource efficiency. The contrasting trends between T-based and ETc-based WUE highlight the value of examining water use from multiple angles. While physiological indicators are useful for understanding internal crop responses, system-level metrics are more relevant for practical irrigation planning.
Water footprint analysis further reinforced these insights. Treatments with improved canopy cover and adequate moisture supply achieved the better BWF and GWF, suggesting more sustainable use of both irrigation and rainfall resources. These outcomes demonstrate that managing crop geometry and irrigation frequency not only improves yield but also reduces environmental water costs [42]. Moreover, reducing soil evaporation can lead to improved energy efficiency in irrigation systems [43] and help mitigate salt accumulation at the soil surface—a persistent challenge in arid and semi-arid agriculture.
Overall, this study confirms that enhancing physiological and agronomic water productivity in faba bean requires a coordinated approach to irrigation scheduling and planting pattern. The use of an LAI-based ET partitioning model provided a valuable tool for interpreting water use dynamics, especially under field conditions. Future work should consider integrating nutrient management, crop quality, and long-term field variability to develop more comprehensive recommendations for sustainable legume production in water-scarce environments.
Despite the promising results, this study has certain limitations. First, the field experiment was conducted over a single growing season and site, which may limit the generalizability of the findings across different agro-climatic conditions. Seasonal variability in temperature, rainfall patterns, and atmospheric demand could influence the water footprint components and evapotranspiration dynamics observed here. Additionally, soil characteristics and salinity levels, which were relatively stable in this study, may interact differently with irrigation regimes and canopy structure under more variable field conditions. While the LAI-based partitioning model offers a practical approach for estimating ET components, it does not capture short-term fluctuations in stomatal behavior, wind speed, or radiation, which can affect the E/T balance. It should also be noted here that the selected empirical coefficient in Equation 1 may be a source of uncertainty, as the extinction coefficient for Vicia faba can vary due to changes in canopy architecture, crop density, and leaf orientation in response to solar trajectory. However, we selected the value k = 0.6 based on the widely accepted Belmans model, which has been implemented in numerous studies across different crops and canopy structures. Additionally, this value is very close to the average extinction coefficient of 0.59 reported by [22] for soybean under different row spacings (0.35 and 0.66 m), a species from the Fabaceae family with a comparable broadleaf canopy. While this source of uncertainty may influence the absolute magnitudes of the estimated fluxes, it will not affect the direction or comparative trends in the results, as it would influence all treatments systematically. We applied this literature-based coefficient because model validation or calibration for Vicia faba was beyond the objectives of the present study, and investigating how this coefficient changes in response to leaf movement throughout the season would require a dedicated study. Future research should include multi-season trials and consider regional climate variability to refine recommendations and validate model performance under broader conditions.
5. Conclusions
This study demonstrated that integrating irrigation scheduling with planting pattern optimization can significantly enhance water productivity in drip-irrigated faba bean under semi-arid conditions. The use of an LAI-based model provided meaningful insights into ET partitioning, highlighting the role of canopy structure in increasing the proportion of productive transpiration relative to non-beneficial evaporation. Notably, denser planting improved yield and reduced both blue and green water footprints, despite a slight decline in transpiration-based water use efficiency due to intra-specific competition.
Quantitatively, the optimized regime (25% MAD with double-row planting) required more frequent irrigation events than the 50% MAD regime, but achieved the highest yield (6171 ± 165.51 kg ha−1). This represented a yield advantage of about 1200 kg ha−1 over the lowest-yielding treatment, and translated into the lowest total water footprint (~638 m3 ton−1), underscoring the water-productivity benefits of optimized irrigation measures. These findings underscore the importance of balancing physiological and agronomic efficiency when designing water management strategies for legume systems. More importantly, the results offer actionable guidance for agricultural policy in arid regions. Specifically, they support the integration of crop-specific irrigation thresholds and canopy-based planting recommendations into Iraq’s National Water Strategy. Promoting such context-specific irrigation protocols can improve water allocation efficiency and contribute to long-term food and water security in water-scarce environments. Practical implementation could involve deficit irrigation scheduling supported by soil-moisture sensing, farmer training on double-row planting systems, and the inclusion of optimized irrigation thresholds into regional water allocation frameworks
The study also highlights the potential of accessible modeling tools, such as LAI-based ET partitioning, to inform irrigation decisions where high-resolution sensing infrastructure is limited. Future research should extend these findings across multiple seasons and agro-ecological zones, and explore the interactions between irrigation, planting density, and nutrient availability to strengthen regionally tailored water-saving strategies. Future research should also investigate the modulation of the canopy light extinction coefficient for Vicia faba under different planting densities, canopy architectures, and environmental conditions, as well as its diurnal and seasonal dynamics. Such studies would improve the accuracy of LAI-based evapotranspiration partitioning models and strengthen their applicability across diverse legume production systems.
Supplementary Materials
The following supporting information can be downloaded at: https://www.mdpi.com/article/10.3390/agronomy15102282/s1, Table S1: LAI measurements across growth stages; Table S2: Full ANOVA Table; Table S3: Tukey HSD Comparison Table; Table S4: Summary; Table S5: Absolute accumulated values of E and T at different growth stages under the studied treatments; Table S6: Dry Biomass (g plant−1); Table S7: Root Depth (cm); Table S8: Plant Height (cm); Table S9: Grain Yield (kg ha−1).
Author Contributions
Conceptualization, A.K.S., S.E.A. and H.J.M.; methodology A.K.S., S.E.A., H.J.M. and B.A.; investigation, S.E.A. and H.J.M.; resources, S.E.A. and H.J.M.; data curation, S.E.A. and H.J.M.; A.K.S. and B.A.; writing—original draft preparation, A.K.S. and B.A.; writing—review and editing, A.K.S. and B.A.; visualization, A.K.S. and B.A.; supervision, A.K.S. All authors have read and agreed to the published version of the manuscript.
Funding
This research received no external funding.
Data Availability Statement
All key data supporting the findings of this study are presented within the article itself, including tables and figures. Additional details or materials are available from the corresponding author upon reasonable request.
Acknowledgments
We acknowledge support by the Open Access Publication Fund of TU Berlin.
Conflicts of Interest
The authors declare no conflicts of interest.
References
- Shemer, H.; Wald, S.; Semiat, R. Challenges and Solutions for Global Water Scarcity. Membranes 2023, 13, 612. [Google Scholar] [CrossRef] [PubMed]
- Bates, B.C.; Kundzewicz, Z.W.; Wu, S.; Palutikof, J.P. (Eds.) Climate Change and Water. In Technical Paper of the Intergov-ernmental Panel on Climate Change; IPCC Secretariat: Geneva, Switzerland, 2008; p. 210. [Google Scholar]
- Eltaif, N.I.; Gharaibeh, M.A.; Al-Quraishi, A.M.F. Impact of Climate Change on Iraq: Severe Water Scarcity and Desertification. In Climate Change and Environmental Degradation in the MENA Region; Al-Quraishi, A., Negm, A., Ben-zougagh, B., Eds.; Springer Nature: Cham, Switzerland, 2024; pp. 279–303. [Google Scholar] [CrossRef]
- Al-Ansari, N. Hydro Geopolitics of the Tigris and Euphrates. In Recent Researches in Earth and Environmental Sciences; Mustafa, Y., Sadkhan, S., Zebari, S., Jacksi, K., Eds.; Springer Proceedings in Earth and Environmental Sciences; Springer: Cham, Switzerland, 2019. [Google Scholar] [CrossRef]
- Hoekstra, A.Y. Virtual water trade: Proceedings of the international expert meeting on virtual water trade. In Value of Water Research Report Series; IHE: Delft, The Netherlands, 2003; Available online: https://www.worldwatercouncil.org/fileadmin/wwc/Programs/Virtual_Water/VirtualWater_Proceedings_IHE.pdf (accessed on 30 June 2025).
- Chapagain, A.K.; Hoekstra, A.Y. Water Footprints of Nations. In Value of Water Research Report Series; Unesco-IHE: Delft, The Netherlands, 2004. [Google Scholar]
- Mekonnen, M.M.; Hoekstra, A.Y. The green, blue and grey water footprint of crops and derived crop products. Hydrol. Earth Syst. Sci. 2011, 15, 1577–1600. [Google Scholar] [CrossRef]
- Hoekstra, A.Y.; Chapagain, A.K. How Much Water is Used for Producing Our Goods and Services? In Globalization of Water; Hoekstra, A.Y., Ed.; John Wiley & Sons, Ltd.: Chichester, UK, 2007; Chapter 2; pp. 7–17. [Google Scholar] [CrossRef]
- Doorenbos, J.; Kassam, A.H.; Branscheid, V.; Bentvelsen, C.L.M. Yield Response to Water; FAO: Rome, Italy, 1986; Volume 192, Available online: https://agris.fao.org/search/en/providers/122621/records/64724f9353aa8c896305d1b7 (accessed on 22 June 2025).
- Allen, R.G.; Pereira, L.S.; Raes, D.; Smith, M. Crop Evapotranspiration—Guidelines for Computing Crop Water Requirements—FAO Irrigation and Drainage Paper 56; FAO: Rome, Italy, 1998; Volume 300, p. D05109. [Google Scholar]
- Liu, Y.; Qiao, C. Partitioning Evapotranspiration in a Cotton Field under Mulched Drip Irrigation Based on the Water-Carbon Fluxes Coupling in an Arid Region in Northwestern China. Agriculture 2023, 13, 1219. [Google Scholar] [CrossRef]
- Salman, A.K.; Durner, W.; Naseri, M.; Joshi, D.C. The Influence of the Osmotic Potential on Evapotranspiration. Water 2023, 15, 2031. [Google Scholar] [CrossRef]
- Strachan, I.B.; Stewart, D.W.; Pattey, E. Determination of Leaf Area Index in Agricultural Systems. In Micrometeorology in Agricultural Systems; John Wiley & Sons Ltd.: Hoboken, NJ, USA, 2005; pp. 179–198. [Google Scholar] [CrossRef]
- Huang, D.; Wang, J.; Khayatnezhad, M. Estimation of Actual Evapotranspiration Using Soil Moisture Balance and Remote Sensing. Iran. J. Sci. Technol. Trans. Civ. Eng. 2021, 45, 2779–2786. [Google Scholar] [CrossRef]
- Bao, Y.; Duan, L.; Tong, X.; Hao, L.; Liu, T.; Wang, G.; Singh, V.P. Diversity of evapotranspiration and water use efficiency for complex ecosystems in the Horqin Sandy Land. CATENA 2025, 252, 108890. [Google Scholar] [CrossRef]
- Kar, K.K.; Haggerty, R.; Sharma, H.; Dwivedi, D.; Roy, T. Evapotranspiration Partitioning Using Flux Tower Data in a Semi-Arid Ecosystem. Hydrol. Process. 2025, 39, e70083. [Google Scholar] [CrossRef]
- Nandi, R.; Mudi, D.K.; Singh, K.C.; Saha, M.; Bandyopadhyay, P.K. Partitioning of Evapotranspiration and Crop Coef-ficients of Lentil Under Conserved Soil Moisture Conditions. J. Soil Sci. Plant Nutr. 2024, 24, 435–450. [Google Scholar] [CrossRef]
- Belmans, C.; Wesseling, J.G.; Feddes, R.A. Simulation model of the water balance of a cropped soil: SWATRE. J. Hydrol. 1983, 63, 271–286. [Google Scholar] [CrossRef]
- Feddes, R.A.; Kowalik, P.J.; Zaradny, H. Simulation of field water use and crop yield. In Simulation Monographs; Pudoc: Wageningen, The Netherlands, 1978; pp. 9–30. [Google Scholar] [CrossRef]
- Al-Khafaf, S.; Wierenga, P.J.; Williams, B.C. Evaporative Flux from Irrigated Cotton as Related to Leaf Area Index, Soil Water, and Evaporative Demand. Agron. J. 1978, 70, 912–917. [Google Scholar] [CrossRef]
- Sammis, T.W.; Williams, S.; Smeal, D.; Kallsen, C.E. Effect of Soil Moisture Stress on Leaf Area Index, Evapotranspiration and Modeled Soil Evaporation and Transpiration. Trans. ASAE 1986, 29, 956–961. [Google Scholar] [CrossRef]
- Flénet, F.; Kiniry, J.R.; Board, J.E.; Westgate, M.E.; Reicosky, D.C. Row Spacing Effects on Light Extinction Coefficients of Corn, Sorghum, Soybean, and Sunflower. Agron. J. 1996, 88, 185–190. [Google Scholar] [CrossRef]
- Hu, Z.; Yu, G.; Zhou, Y.; Sun, X.; Li, Y.; Shi, P.; Wang, Y.; Song, X.; Zheng, Z.; Zhang, L.; et al. Partitioning of evapotranspiration and its controls in four grassland ecosystems: Application of a two-source model. Agric. For. Meteorol. 2009, 149, 1410–1420. [Google Scholar] [CrossRef]
- Bao, Y.; Liu, T.; Duan, L.; Tong, X.; Wang, Y.; Hao, L.; Hua, R.; Singh, V.P. Partitioning of Evapotranspiration in Semi-Arid Rain-Fed Farmland Using an Improved Stomatal Conductance Model. Irrig. Sci. 2025, 43, 773–788. [Google Scholar] [CrossRef]
- Zhang, Y.; Xu, Z.; Li, J.; Wang, R. Optimum Planting Density Improves Resource Use Efficiency and Yield Stability of Rainfed Maize in Semiarid Climate. Front. Plant Sci. 2021, 12, 752606. [Google Scholar] [CrossRef]
- Labba, I.-C.M.; Frøkiær, H.; Sandberg, A.-S. Nutritional and antinutritional composition of fava bean (Vicia faba L., var. minor) cultivars. Food Res. Int. 2021, 140, 110038. [Google Scholar] [CrossRef]
- Kijne, J.W.; Barker, R.; Molden, D. (Eds.) Water Productivity in Agriculture: Limits and Opportunities for Improvement, 1st ed.; CABI: Wallingford, UK, 2003. [Google Scholar] [CrossRef]
- Al-Enezy, A.F.M.; Zaidan, B.A.; Almehemdi, A.F.; Hussein, A.A.; Salih, M.A.A.-J. Tillage systems affect soil nitrogen availability and interact growth parameters of different faba bean cultivars. Biodiversitas J. Biol. Divers. 2023, 24, 5558–5564. [Google Scholar] [CrossRef]
- Gaied, R.B.; Brígido, C.; Sbissi, I.; Tarhouni, M. Sustainable Strategy to Boost Legumes Growth under Salinity and Drought Stress in Semi-Arid and Arid Regions. Soil Syst. 2024, 8, 84. [Google Scholar] [CrossRef]
- Nawaz, T.; Fahad, S.; Joshi, N.; Rahman, T.U.; Khan, M.N.R.; Hassan, S.; Saud, S. Legume Production and Problems in the Mediterranean Region. In Marker-Assisted Breeding in Legumes for Drought Tolerance; Nadeem, M.A., Baloch, F.S., Bantis, F., Fiaz, S., Aasim, M., Eds.; Springer Nature: Singapore, 2025; pp. 41–75. [Google Scholar] [CrossRef]
- Aldulaimy, S.E.H.; Almehmdy, S.M.H.; Abood, M.A. Evaluation of Used Exudative Irrigation Tubes and Drip Irrigation for Some Soil Water Parameters and Consumptive Use of Cucumber. Iraqi J. Agric. Sci 2018, 49, 1099–1109. [Google Scholar] [CrossRef]
- Keller, J.; Bliesner, R.D. Bliesner, Sprinkle and Trickle Irrigation. 1990. Available online: https://agris.fao.org/search/en/providers/122621/records/647761e15eb437ddff7835c1 (accessed on 22 July 2025).
- Yang, B.; Fu, P.; Lu, J.; Ma, F.; Sun, X.; Fang, Y. Regulated deficit irrigation: An effective way to solve the shortage of agri-cultural water for horticulture. Stress Biol. 2022, 2, 28. [Google Scholar] [CrossRef]
- Egea, G.; Castro-Valdecantos, P.; Gómez-Durán, E.; Munuera, T.; Domínguez-Niño, J.M.; Nortes, P.A. Impact of Irriga-tion Management Decisions on the Water Footprint of Processing Tomatoes in Southern Spain. Agronomy 2024, 14, 1863. [Google Scholar] [CrossRef]
- Zhang, S.; Rasool, G.; Wang, S.; Guo, X.; Zhao, Z.; Zhang, Y.; Wei, Z.; Xia, Q. Effect of Irrigation and Cultivation Modes on Growth, Physiology, Rice Yield Parameters and Water Foot-prints. Agronomy 2024, 14, 1747. [Google Scholar] [CrossRef]
- Aljoumani, B.; Sànchez-Espigares, J.A.; Cañameras, N.; Josa, R.; Monserrat, J. Time series outlier and intervention analysis: Irrigation management influences on soil water content in silty loam soil. Agric. Water Manag. 2012, 111, 105–114. [Google Scholar] [CrossRef]
- Aljoumani, B.; Sànchez-Espigares, J.A.; Cañameras, N.; Wessolek, G.; Josa, R. Transfer Function and Time Series Outlier Analysis: Modelling Soil Salinity in Loamy Sand Soil by Including the Influences of Irrigation Management and Soil Temperature. Irrig. Drain. 2018, 67, 282–294. [Google Scholar] [CrossRef]
- Peksen, E. Non-Destructive Leaf Area Estimation Model for Faba Bean (Vicia faba L.). Cientia Hortic. 2007, 113, 322–328. [Google Scholar] [CrossRef]
- Salman, A.K.; Al-Jumaili, M.; Sut-Lohmann, M.; Durner, W. Wi-Fi signal for soil moisture sensing. Environ. Monit. Assess. 2024, 197, 109. [Google Scholar] [CrossRef]
- Villalobos, F.J.; Sadras, V.O.; Fereres, E. Plant Population Density and Competition. In Principles of Agronomy for Sustainable Agriculture; Villalobos, F.J., Fereres, E., Eds.; Springer International Publishing: Cham, Switzerland, 2024; pp. 165–176. [Google Scholar] [CrossRef]
- Wei, Z.; Yoshimura, K.; Wang, L.; Miralles, D.G.; Jasechko, S.; Lee, X. Revisiting the contribution of transpiration to global terrestrial evapotranspiration. Geophys. Res. Lett. 2017, 44, 2792–2801. [Google Scholar] [CrossRef]
- Alshami, A.K.; El-Shafei, A.; Al-Omran, A.M.; Alghamdi, A.G.; Louki, I.; Alkhasha, A. Responses of Tomato Crop and Water Productivity to Deficit Irrigation Strategies and Salinity Stress in Greenhouse. Agronomy 2023, 13, 3016. [Google Scholar] [CrossRef]
- Salman, A.K.; Alhadeethi, I.K.; Mohammed, A.M.; Sut-Lohmann, M. Assessing Irrigation System Efficiency within the Water-Energy-Food Nexus: Introducing Energy Performance Metrics. Agric. Water Manag. 2025, 317, 109665. [Google Scholar] [CrossRef]
Disclaimer/Publisher’s Note: The statements, opinions and data contained in all publications are solely those of the individual author(s) and contributor(s) and not of MDPI and/or the editor(s). MDPI and/or the editor(s) disclaim responsibility for any injury to people or property resulting from any ideas, methods, instructions or products referred to in the content. |
© 2025 by the authors. Licensee MDPI, Basel, Switzerland. This article is an open access article distributed under the terms and conditions of the Creative Commons Attribution (CC BY) license (https://creativecommons.org/licenses/by/4.0/).