Abstract
Biochar is gaining recognition as a sustainable material, with several applications in soil amendment, carbon sequestration, nutrient dynamics, the remediation of organic contaminants from soil, and water filtration. However, understanding its characteristics is limited due to its intricate structure. This study used response surface methodology (RSM) and artificial neural networks (ANNs) to optimize and predict the production of biochar from the pyrolysis of palm kernel shells. To determine how residence time, nitrogen flow rate, and pyrolysis temperature affected biochar production, a Box–Behnken experimental design was employed. The prediction of the biochar yield was modeled using four different models of ANNs: narrow, medium, wide, and optimum. The physicochemical properties of the biochar produced at pyrolysis temperatures ranging from 400 to 800 °C were determined using X-ray diffraction (XRD), energy dispersive X-ray spectroscopy (EDX), nitrogen (N2) physisorption analysis, and field emission scanning electron microscopy (FESEM). With a p-value significantly lower than 0.05, the response surface quadratic model was found to be the most suitable to optimize the biochar yield obtained from the PKS pyrolysis. Biochar production was very sensitive to the three operating parameters: pyrolysis temperature, nitrogen flow rate, and pyrolysis time. With a coefficient of determination (R2) of 0.900, root mean square error (RMSE) of 0.936, and mean absolute error (MAE) of 0.743, the optimized ANN outperformed the other three ANN models tested. When compared to the optimized ANN, the response surface quadratic model with an R2 of 0.989 had better prediction of biochar yield. At optimized experimental conditions for nitrogen flow rate (150.01 mL/min), temperature (799.71 °C), and pyrolysis time (107.61 min), a biochar yield of 37.87% was obtained at a desirability function of 1.
1. Introduction
The processing of agricultural products often leads to the generation of huge amounts of waste, which, if not properly handled, could result in environmental menace [1]. Due to their low cost and abundant availability, agricultural waste materials are receiving a lot of interest as adsorbents for the removal of colors, metals, and other contaminants from wastewater [2,3,4,5]. One of the most common types of agricultural waste is palm kernel shell (PKS), which is obtained as a by-product of the processing of palm kernels [6]. PKS, a very important resource, is typically disposed of by combustion, which leads to the emission of greenhouse gases that have other detrimental effects on the environment [7,8]. Several studies have delved into the sustainable utilization of PKS as an alternative to the open burning of agricultural waste, which has harmful effects on the environment and contributes to the depletion of the ozone layer [9,10,11]. The use of PKS as a biochar for the biosorption of aqueous Pb (II) was reported by Dechapanya and Khamwichit [12]. The physicochemical properties of the biochar produced were characterized using different instrument techniques. A maximum adsorption capacity of 171.1 μg/g was reported for the biochar produced from the PKS. Baby et al. [13] employed bio-adsorbents prepared from PKS for the treatment of heavy metal-contaminated wastewater. The batch studies showed that the bio-adsorbent displayed good performance in the removal of dye from contaminated water. Hazman et al. [14] employed catalysts prepared from PKS for methane cracking to hydrogen and carbon black.
The preparation of biochar from PKS entails different conditions that have an impact on its physicochemical properties and subsequent applications as a biosorbent. As a result of this, several studies have focused on optimizing the different conditions. Hossain et al. [15] employed analysis of variance (ANOVA) to determine the impact of microwave power, temperature, and N2 flow rate on biochar yield. The analysis revealed that all three factors significantly influenced the biochar yield since the p-value was less than 0.05. Okokpujie et al. [16] investigated the impact of temperature, reaction time, heating rate, nitrogen flow rate, and particle size on the pyrolysis of PKS. The ANOVA results showed that all three factors had a significant influence on the PKS pyrolysis. Siddiqui et al. [17] explored the impact of reaction time, reaction temperature, and particle size on the biochar yield obtained from the slow pyrolysis of agricultural waste. A maximum biochar production of 54.9% was achieved at a reaction temperature of 300 °C, reaction duration of 20 min, and particle size of 3 mm. The ANOVA results revealed that the biochar production from the slow pyrolysis process was significantly influenced by the reaction temperature and particle size.
Besides the application of response surface methodology (RSM), the predictive modeling of biochar production from various feedstocks has also been investigated using artificial neural networks (ANNs). Arumugasamy and Selvarajoo [18] employed an ANN to model the production of biochar from the pyrolysis of biomass. The developed model, which had operating temperature, heating rate, solid residence time, and particle size as the input parameters and biochar yield as the targeted output, displayed robust performance, as shown by the R2 of 0.999. Khan et al. [19] also employed an ANN to model the production of biochar using nine different features. The findings revealed that the ANN was robust in predicting the yield of biochar, as indicated by an R2 of 0.93. Tee et al. [20] utilized an ANN to model the production of biochar from the slow pyrolysis of different biomasses obtained from agricultural waste. With an R2 greater than 0.92 and few predictive errors, the ANN model demonstrated high performance, showing strong agreement between the predicted and actual biochar output. To the best of the authors’ knowledge, the hybrid analysis of biochar production from the pyrolysis of agricultural waste using statistical and artificial intelligent-based modeling techniques has not been reported in the literature. Therefore, the main objectives of this study were to employ RSM and BBD to determine the effect of parameters such as pyrolysis temperature, N2 flowrate, and pyrolysis time on biochar yield; determine the optimum conditions of the experimental parameters using desirability functions; model the prediction of biochar yield using an ANN; and perform a comparative analysis of the performance of the RSM and ANN in modeling biochar production from the pyrolysis of PKS.
2. Materials and Methods
2.1. Materials
The PKS was sourced locally from palm oil processing whereby the kernel was fed into a crusher to extract the nut and the PKS was either discarded or used as fuel for the boiler. Prior to being used, the PKS was washed thoroughly with tap water to remove any forms of impurities. Subsequently, it was air-dried for about 3 days and then oven-dried at 80 °C for 24 h to remove water. The dried PKS was crushed to a powdery form before being subjected to the pyrolysis procedure. The powder was then sieved through 180- and 200-mesh screens to lessen the impression of particle size on the PKS’s overall properties.
2.2. Pyrolysis of Palm Kernel Shell
A stipulated amount of PKS sample was put on a metal plate and placed at the center of a furnace for slow pyrolysis under a nitrogen environment to prevent oxidation. For each experiment run, a constant flow rate of 30 mL/min of nitrogen was employed. The gaseous products from the slow pyrolysis were obtained from the outlet of the furnace through a conical flask that was left open. The biochar yield was determined with the use of Equation (1).
The optimization of the biochar yield from the slow pyrolysis was performed using RSM and executed with the aid of Design Expert Version 11. The experimental design was performed using the Box–Behnken design (BBD). The BBD is an independent quadratic design due to the absence of an embedded factorial or fractional factorial design. The treatment combinations in this design are positioned centrally, at the peripheries, and at the precise midpoint of the process area. These designs need three layers of each component and are rotatable. In comparison to the central composite design (CCD), the designs have less capacity for orthogonal obstruction. The main benefit of the BBD is in preventing overly restrictive experimental conditions and, more specifically, excessive permutations of treatments. Unlike the CCD, there are no corner and star points in BBD. To investigate the relationship between responses and the quantitative experimental parameters, a total of 17 runs were performed. The three factors’ coded variables are listed in Table 1. Table 1 also displays the model’s maximum and minimum input values.

Table 1.
Experimental design using BBD to optimize the biochar yield.
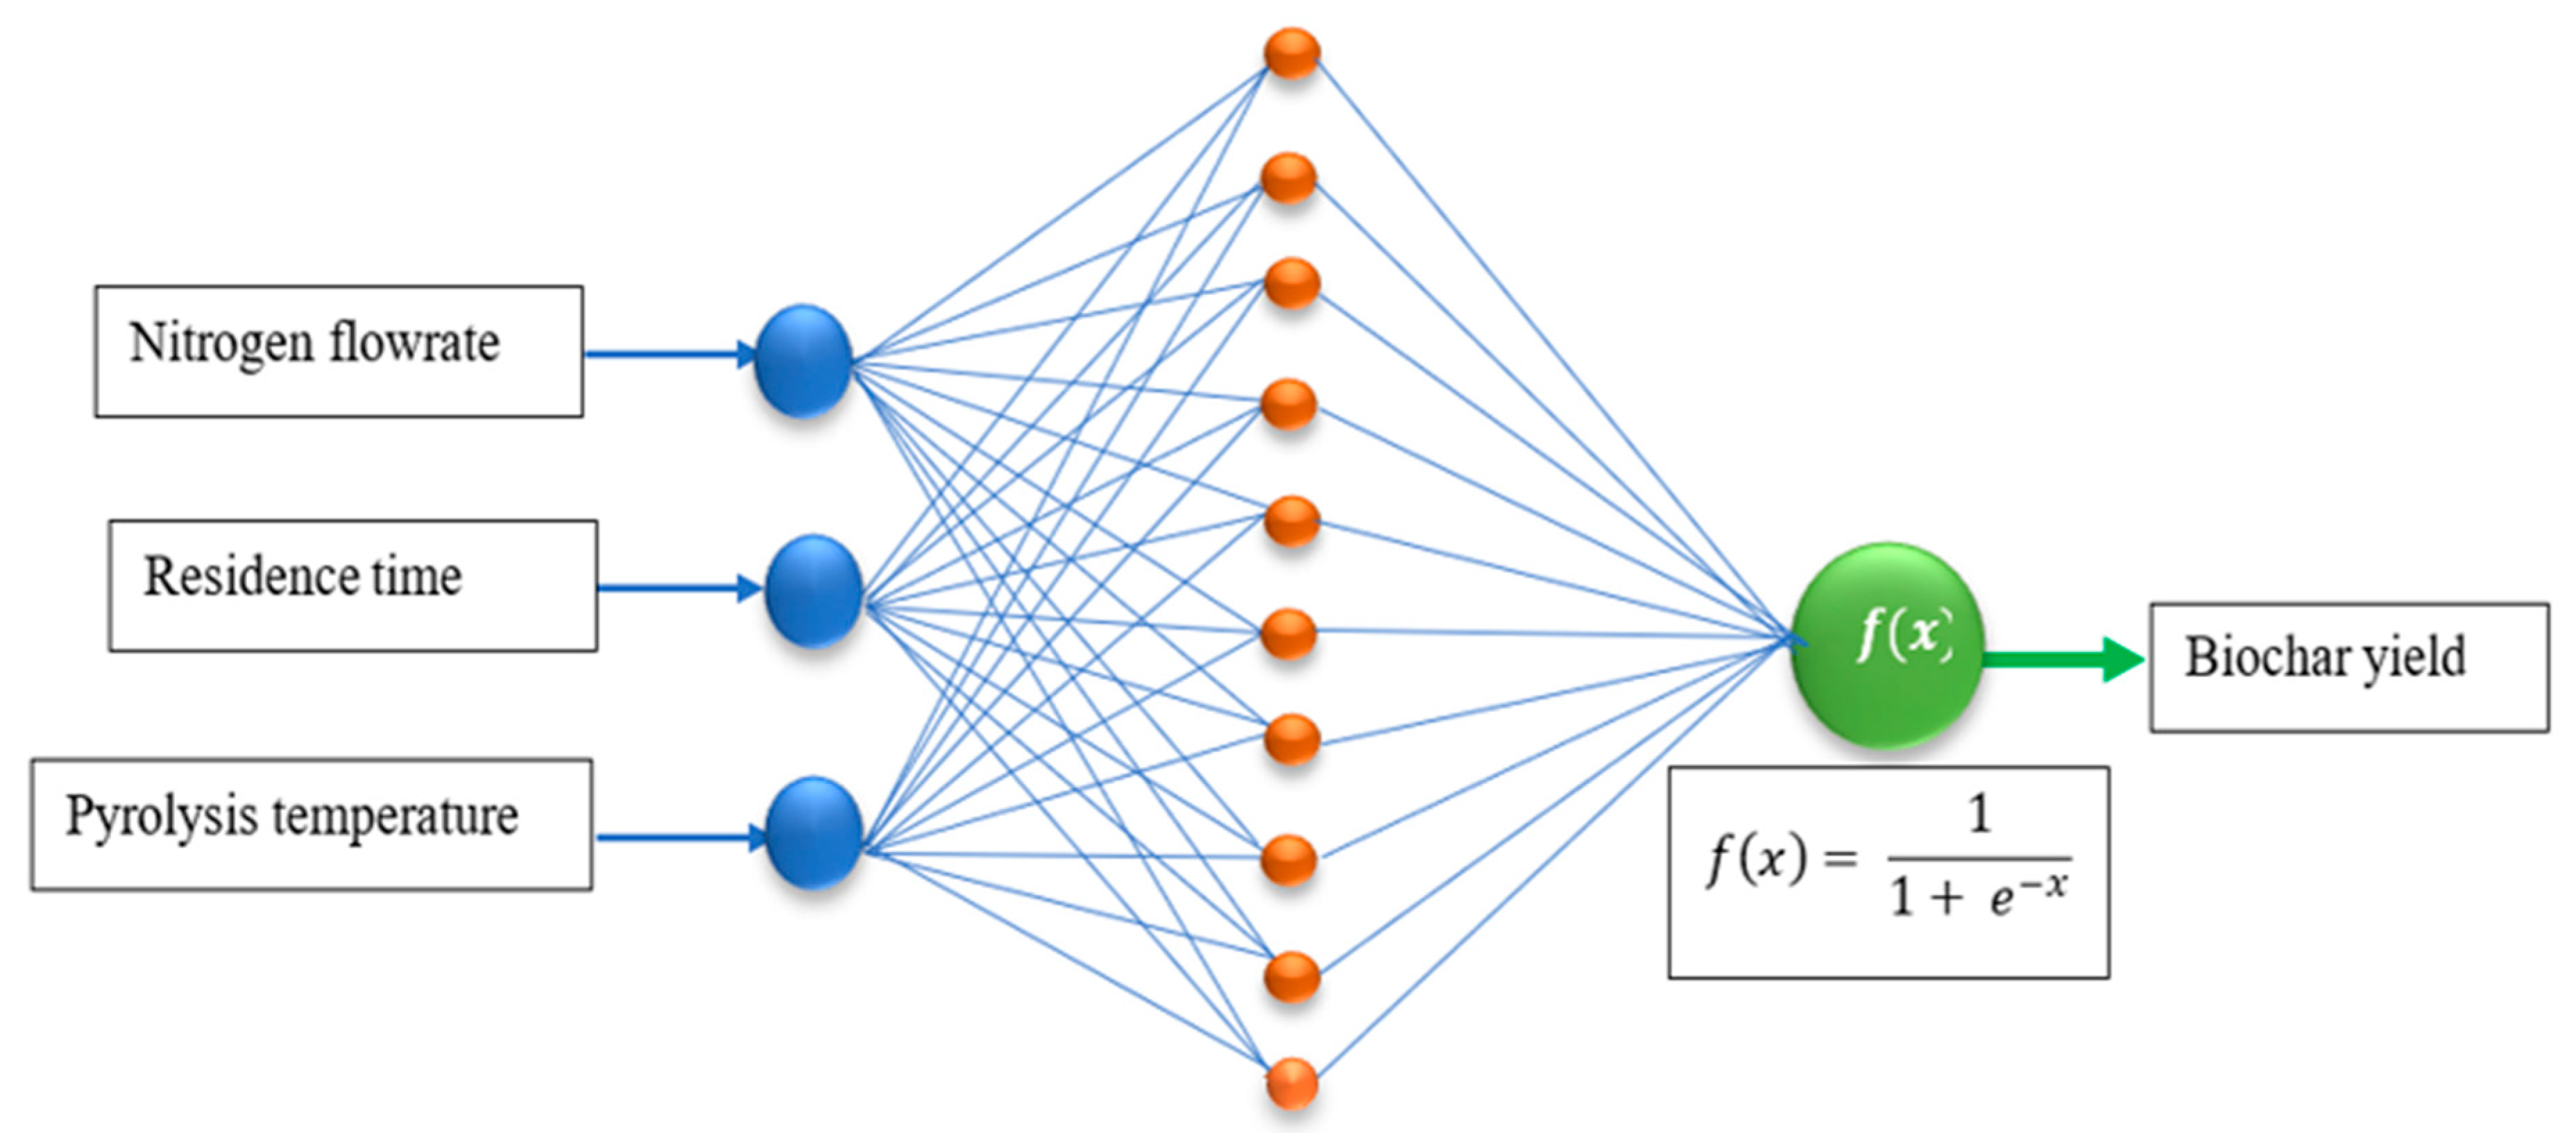
An ANN was used to model the prediction of the biochar yield from the slow pyrolysis process by employing the dataset obtained from the BBD. The ANN configurations consisted of the input, hidden, and output layers, as shown in Figure 1. The input variables consisted of the pyrolysis temperature, the residence time, and the nitrogen flow rate. The response was the biochar yield obtained from the slow pyrolysis of the PKS. The configuration of the model was accomplished using the Neural Network toolbox in MATLAB version 2023b. The data were divided into 70% for training, 15% for validation, and 15% for testing. The Levenberg–Marquardt algorithm was used for training the model. The predictive errors were measured using root mean squared error (RMSE) and mean absolute error (MAE). The extent of predictability was determined using coefficients of determination (R2). Four ANN models, namely, narrow, medium, wide, and optimized, were tested for their potential in predicting the biochar yield. Narrow ANNs represent an ANN architecture with a small number of artificial neurons in the hidden layers. Narrow ANNs require few computational resources, making them faster to train and evaluate. Medium ANNs have a network architecture with a moderate number of artificial neurons in the hidden layers. Compared to narrow ANNs, the training of this model requires more resources. Wide ANNs have a substantial number of artificial neurons in the hidden layers, making them highly complex compared to narrow and medium ANNs. Wide ANNs have the capability to learn intricate patterns from datasets. Optimized ANNs are ANNs whose network architecture, parameters, and training process have been optimized to achieve the best performance. The optimization process includes tuning the network’s structure, adjusting hyperparameters, and improving training techniques.
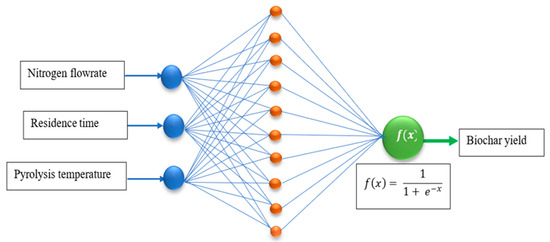
Figure 1.
Schematic representation of the ANN architecture.
The characterization of the biochar’s morphology, elemental composition, crystallinity, Brunauer–Emmett–Teller (BET)-specific surface area, and pore distribution obtained at 400 °C, 600 °C, and 800 °C was performed using field emission scanning electron microscopy (FESEM), energy dispersive X-ray analysis (EDX), X-ray powder diffraction analysis (XRD), and N2 physisorption analysis. The FESEM was conducted under a high-energy electron beam using Supra 55 VP (Zeiss, Oberkochen, Germany). The images at different magnifications were acquired using a Philips XL30/FEI ESEM (Philips, Eindhoven, The Netherlands) at an accelerating voltage of 5–10 kV. The XRD was performed using a Philips X’Pert MPD (3 kW) diffractometer (Philips, Eindhoven, The Netherlands) with a wavelength of λ = 1.5405 nm. The N2 physisorption analysis was performed using a surface area analyzer and a Porosimeter System (Micromeritics ASAP 2020) (Micromeritics Corp., Norcross, GA, USA). The ASAP 2020 Plus is a high-performance adsorption analyzer for evaluating powder and porous material surface area, pore size, and pore volume. Using a vacuum, heat, and nitrogen, the sample was first degassed at 350 °C to eliminate surface contaminants and adsorbed species. Nitrogen at −96 °C was introduced, with the known aliquots dosed up to saturation pressure, and then a vacuum was applied, and the gas was removed. The device monitored the pressure, temperature, and volume of N2 adsorption by the sample. The acquired data were used to calculate the BET-specific surface area, pore diameter, and pore volume.
3. Results and Discussion
3.1. Response Surface Analysis
The treatment combinations of the three factors investigated (Table 1) were employed in the slow pyrolysis of the PKS to obtain the corresponding biochar yield, as defined in Equation (1) and summarized in Table 2. Analysis of variance (ANOVA) was performed on the dataset summarized in Table 2 to determine the significance of the model, individual factors, their interaction effect, the quadratic effect, and the cubic effect. The significance of the model and the effects were evaluated using probability (p-value) and Fischer variation (F-value). The details of the ANOVA analysis are presented in Table 3, Table 4, Table 5, Table 6 and Table 7. The values in Table 2 are presented in coded form, which refers to how the experimental variables (factors) were represented during the design and analysis process. The coded values −1, 0, and +1 are standardized values of the variables representing the low level, center point, and high level, respectively.

Table 2.
The coded factors and corresponding responses from the BBD.

Table 3.
ANOVA for response surface linear model.

Table 4.
ANOVA for response surface 2FI model.

Table 5.
ANOVA for response surface mean model.

Table 6.
ANOVA for response surface quadratic model.

Table 7.
ANOVA for response surface cubic model.
In order to determine the best model that fit the experimental data obtained from the BBD, five response models, namely, linear, two-factor-interaction (2FI), mean, quadratic, and cubic, were evaluated using ANOVA, as summarized in Table 3, Table 4, Table 5, Table 6 and Table 7. In Table 3, Table 4, Table 5, Table 6 and Table 7, the source of variation refers to the different components or factors that contributed to the total variability observed in the data. It identified where the variation came from in the dataset, allowing for the assessment of the impact of different factors on the dependent variables. The sum of squares is a term used to quantify the total variation in data, which it partitions into components attributed to different sources of variation. It measures how much variation exists due to specific factors or residual variability. The df, which stands for degree of freedom, denotes the number of independent values that can vary in the computation of a statistic estimate. In the context of ANOVA, it helps to partition the total variability into components attributed to a specific source. The mean square (MS) measures the average variation for a given source of variation. It is often employed to compare the variability explained by factors to the unexplained variability in the data. F-value is a test statistical parameter used to determine whether factors have a significant effect on the response. The p-value denotes the probability of observing an F-statistic as extreme as the calculated F-value, assuming a null hypothesis is true. It is a measure of statistical significance for the factor being tested.
Table 3 summarizes the ANOVA results for the response surface linear model. It can be seen that the response surface linear model was significant, as indicated by the p-values (<0.05). However, only the pyrolysis temperature was significant among the three factors. The significance of the lack of fit shows that the response surface linear model was not suitable for analyzing the dataset. The ANOVA result in Table 4 indicates that the response surface 2FI model was also significant since the p-value value was less than 0.05. The ANOVA also revealed that only the pyrolysis temperature was significant, while the flow rate of N2 and the time on stream were not significant. The p-value for the lack of fit of the response surface 2FI model was >0.05, which signifies that the model did not fit the dataset. The ANOVA result of the response surface mean model in Table 5 shows that the model could not fit the dataset as there were no values obtained for the p-value, which is also supported by the significant p-value obtained for the lack of fit. In Table 6, the ANOVA result of the response surface quadratic model shows that the model was significant since the p-value was less than 0.05. Moreover, the three factors were statistically significant. The lack of fit was not significant; hence, the model was appropriate in explaining the effects of the factors on the biochar yield. Similarly, the ANOVA results of the response surface cubic model in Table 7 show that the model was suitable for fitting the dataset.
The comparison between the five models based on the coefficient of determination (R2), adjusted R2, predicted R2, adequate precision, and p-value is summarized in Table 8. The R2 measured how well the statistical model explained the variation in the dependent variable. It helped to quantify the total variability in the response variable that was explained by the independent variable in the model. A value of R2 close to 1 implied that the model explained a large proportion of the variability in the response variable. An R2 close to 0 indicated that the model explained very little of the variability. The adjusted R2 is a statistical parameter that helps to refine the R2 metrics that adjust the number of predictors in a model. The adjusted R2 accounted for the number of predictors and only increased if a new predictor improved the model significantly. The predicted R2 measured how well the model predicted unseen data. The predicted R2 focused on the model’s performance on validation or test data, providing an estimate of its predictive accuracy. Adequate precision helped to evaluate the quality of the model’s predictions relative to the noise in the data. It provided a signal-to-noise ratio, helping assess whether the model was sufficiently precise to navigate the design space. The comparison of the different models based on the values of the statistical parameters revealed that the response surface quadratic model was the best in modeling the datasets as indicated by bold text in Table 8.

Table 8.
Summary of model performance.
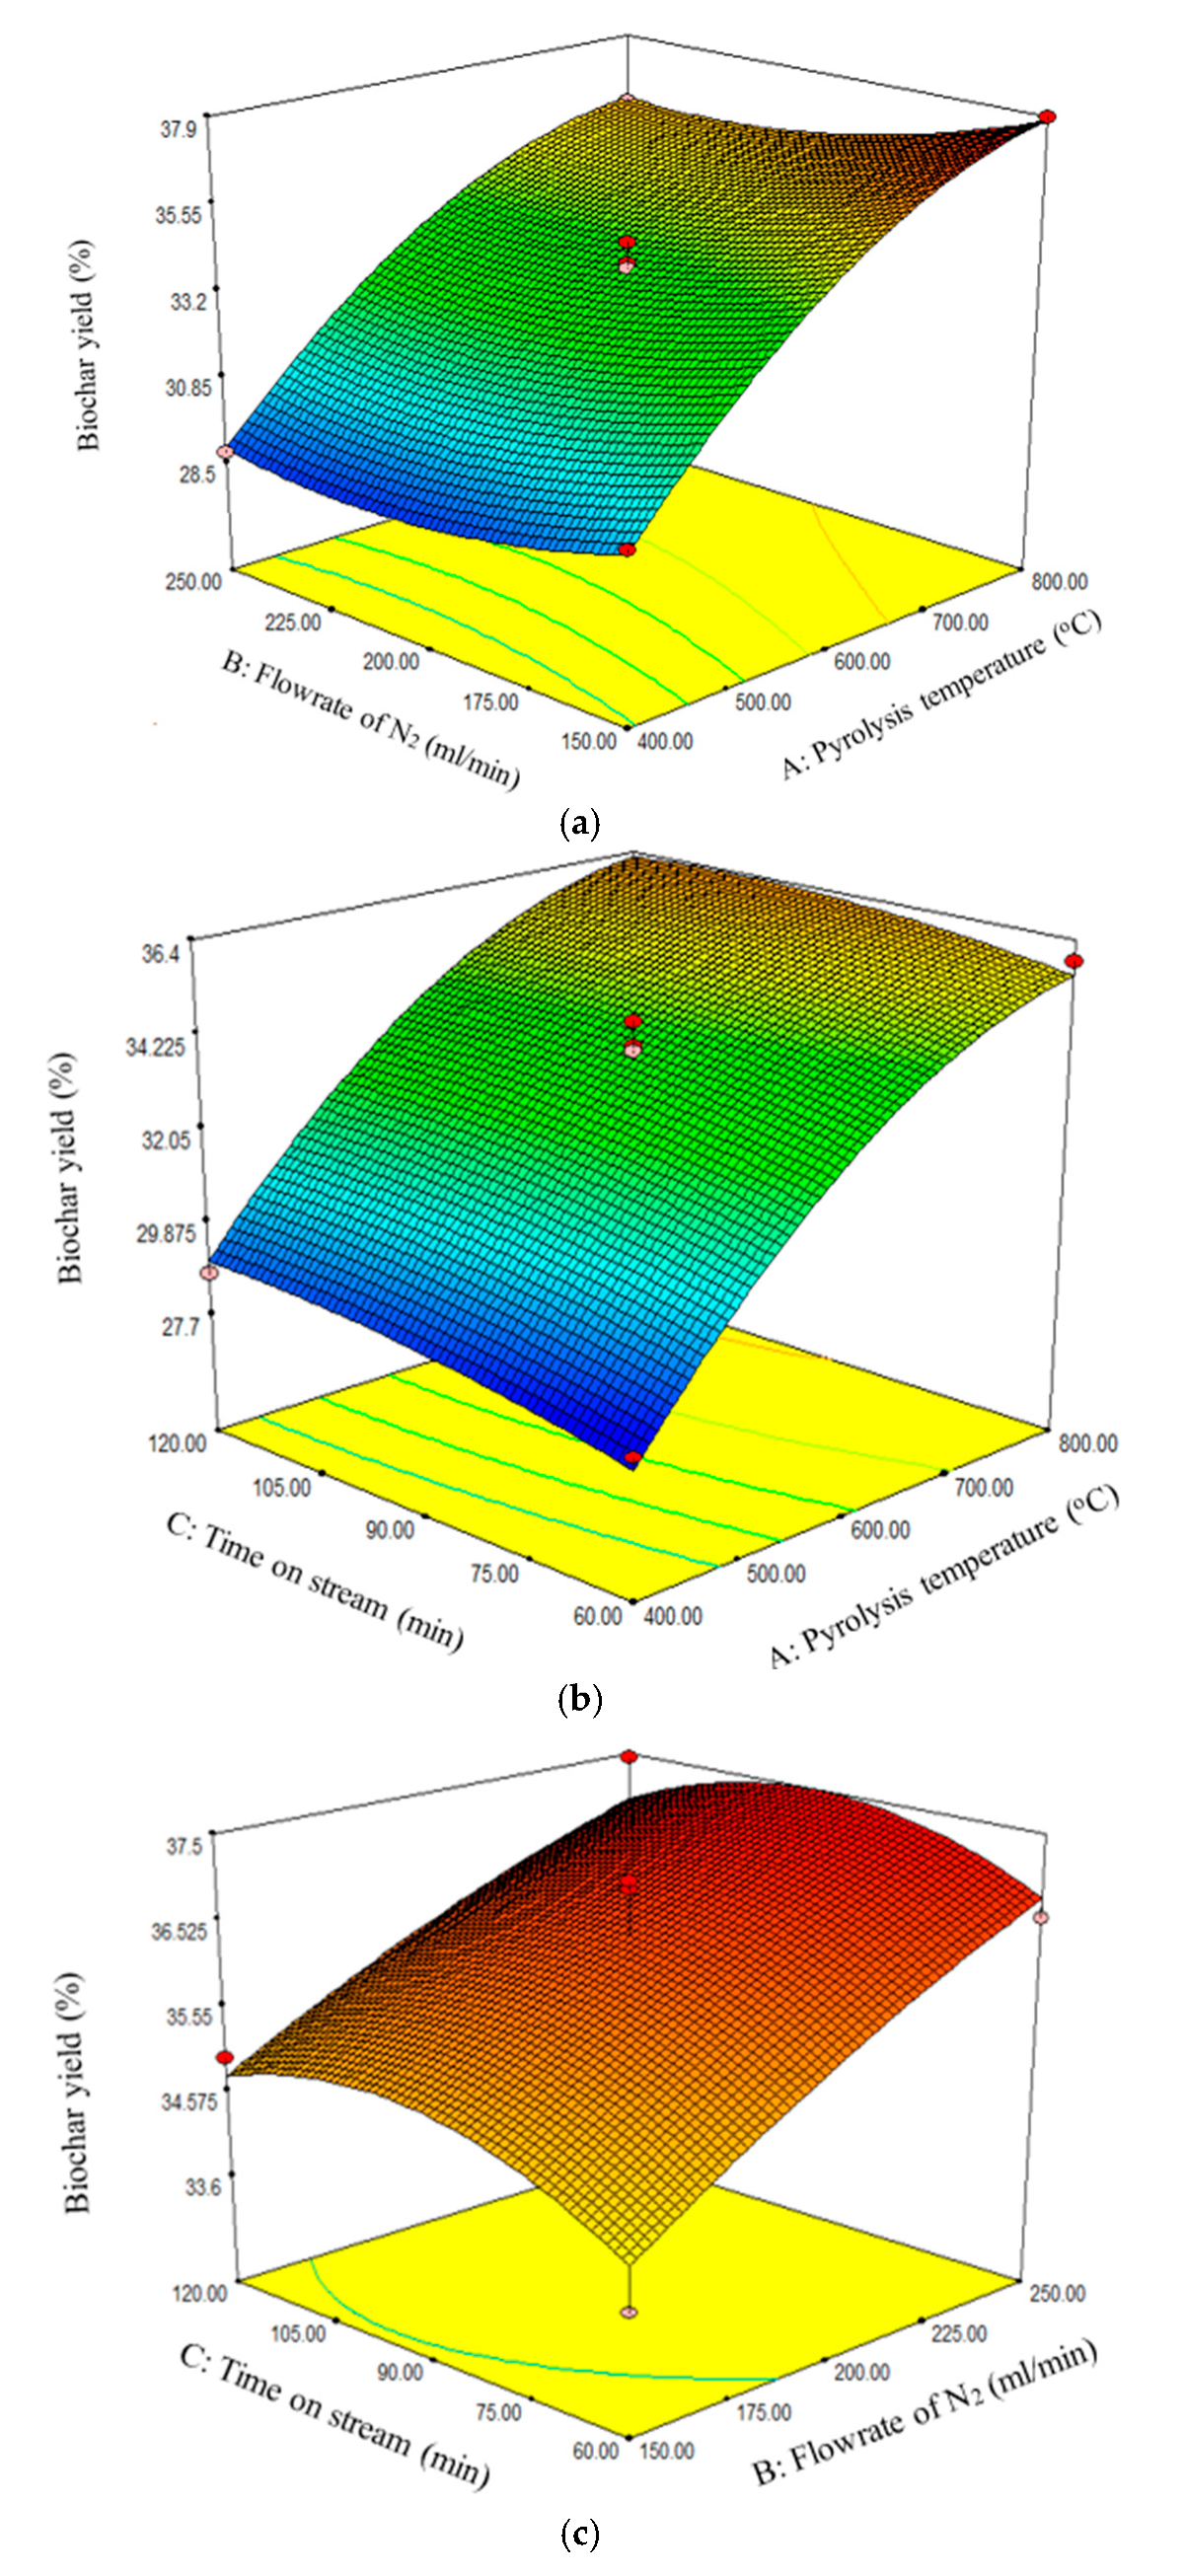
The response surface quadratic model, being the best, was further analyzed to determine the effect of interaction between the three factors, namely, pyrolysis temperature, flow rate of N2, and time on stream. From the ANOVA analysis for the response surface quadratic model, it can be seen that the interaction effect between pyrolysis temperature and flow rate of N2, pyrolysis temperature and time on stream, and flow rate of N2 and time on stream were not significant since the p-values were greater than 0.05. This implied that each of the factors had standalone effects on the biochar yield. Figure 2a–c reveal that the biochar yield increased with increasing pyrolysis temperature and N2 flow rate. However, Figure 2c reveals that the biochar yield attained maximum value at 90 min.
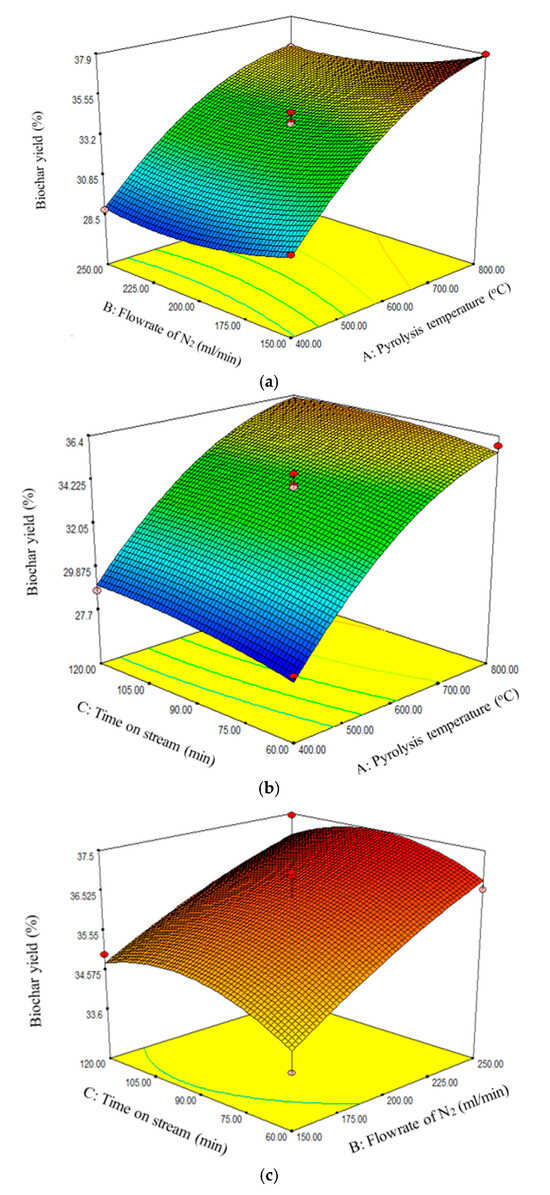
Figure 2.
Effect of (a) pyrolysis temperature and flow rate of N2, (b) pyrolysis temperature and time on stream, and (c) flow rate of N2 and time on stream on biochar yield.
3.2. Optimum Conditions
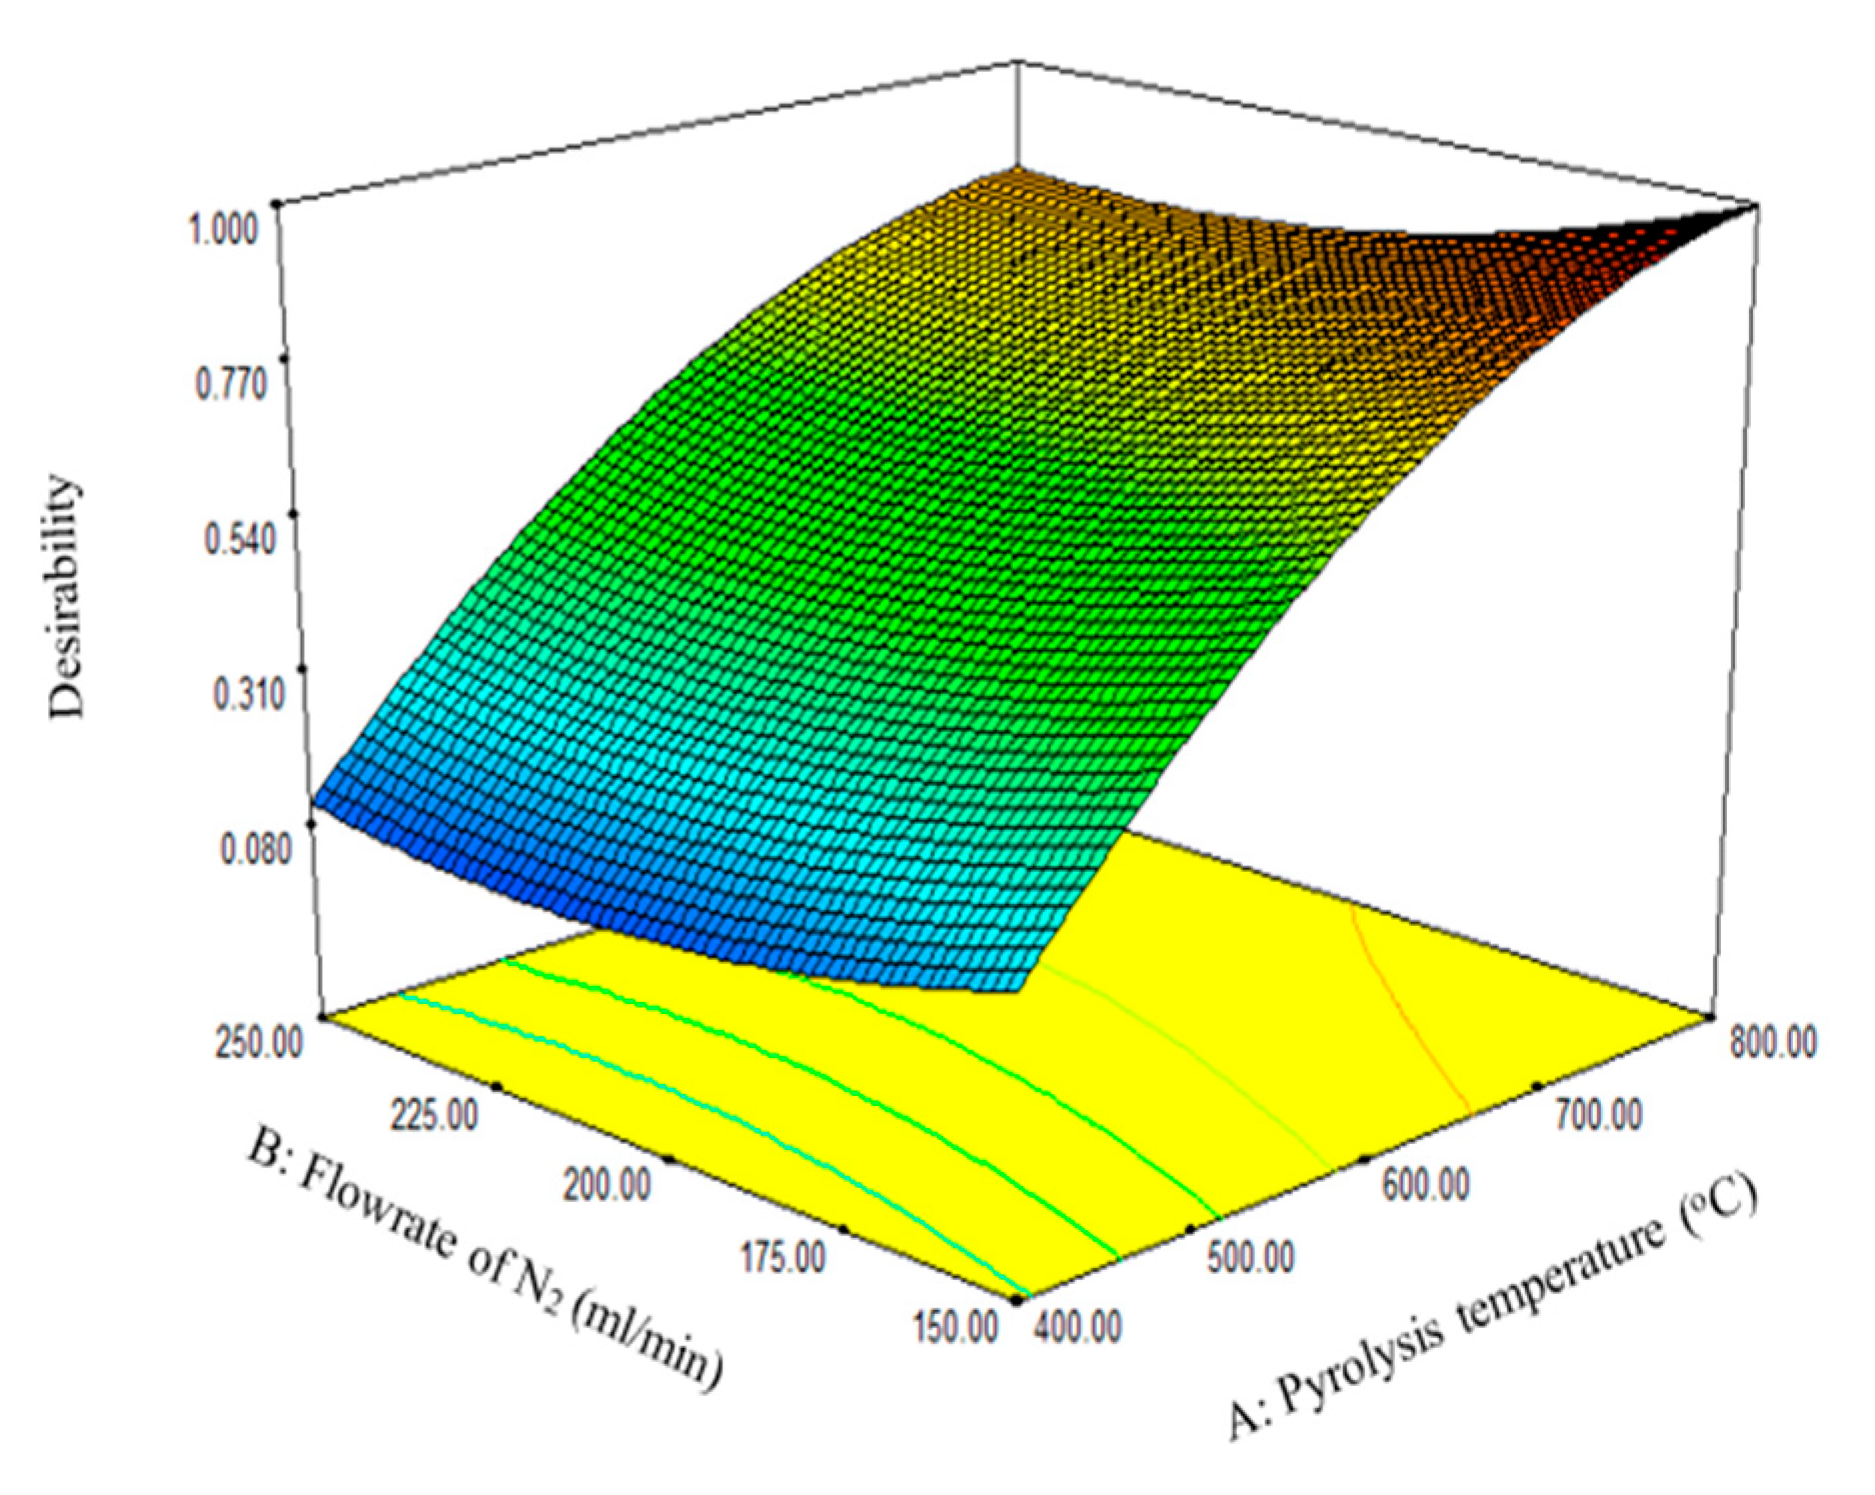
An optimization strategy to maximize the biochar yield was set using the RSM desirability function. A desirability function assigns integers between 0 and 1 to the various values for each response to determine the set of conditions that can best maximize the response (Figure 3). As shown in Table 9, the five sets of suggested solutions were ranked based on the desirability function. Based on desirability values, number 1 in Table 9 had the best conditions to maximize the biochar yield. At a desirability value of 1, a biochar yield of 37.87% was obtained at 799.71 °C with a nitrogen flow rate of 150 mL/min and residence time of 107.61 min. The biochar yield of 37.87% obtained at the optimum experimental conditions in this study is lower compared to the 54.9% obtained for biochar derived from the pyrolysis of waste pomegranate peel, as reported by Siddiqui et al. [17]. The difference in the biochar yield could be attributed to the type of biomass, composition of the PKS and waste pomegranate, and the optimum conditions of the experimental parameters.
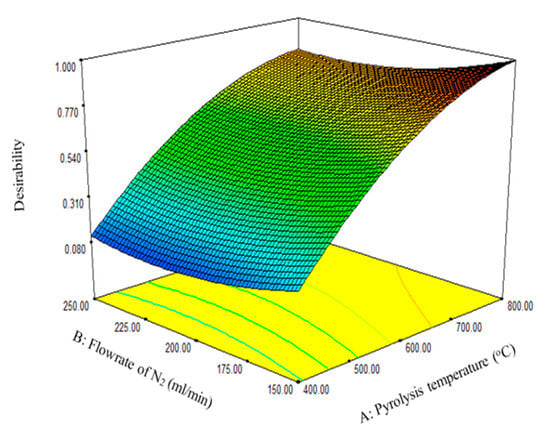
Figure 3.
The two most significant factors as a function of the desirability function.

Table 9.
Ranking of the optimum conditions based on the desirability function.
3.3. Predictive Modeling
As shown in Table 10, four ANN algorithms, namely, narrow, medium, wide, and optimized ANNs, were configured and employed to model biochar yield prediction from the pyrolysis process. The number of fully connected layers, iteration limit, regularization strength, standardized data, activation function, and size of the layers were considered the hyperparameters. The narrow ANN consisted of one fully connected layer with 10 hidden neurons. It can be seen that the biochar yield predicted, and the actual value were strongly correlated, as revealed by the R2 of 0.900 and RMSE and MAE of 0.941 and 0.775, respectively. Both the medium ANN and the wide ANN, which consisted of 25 and 100 hidden neurons, respectively, also had robust but lower performance compared with the narrow and optimized ANNs. Amongst the four ANN models, the optimized architecture displayed the best performance, as indicated by the R2, RMSE, and MAE values indicated by bold text in Table 10. The predictive errors of the optimized ANN were slightly minimized, as indicated by the RMSE and MAE of 0.936 and 0.743, respectively. The performance of the optimized ANN can be attributed to a well-finetuned network architecture, the hyperparameters, and the training process resulting in higher accuracy on both training and unseen data.

Table 10.
Performance of the ANN models.
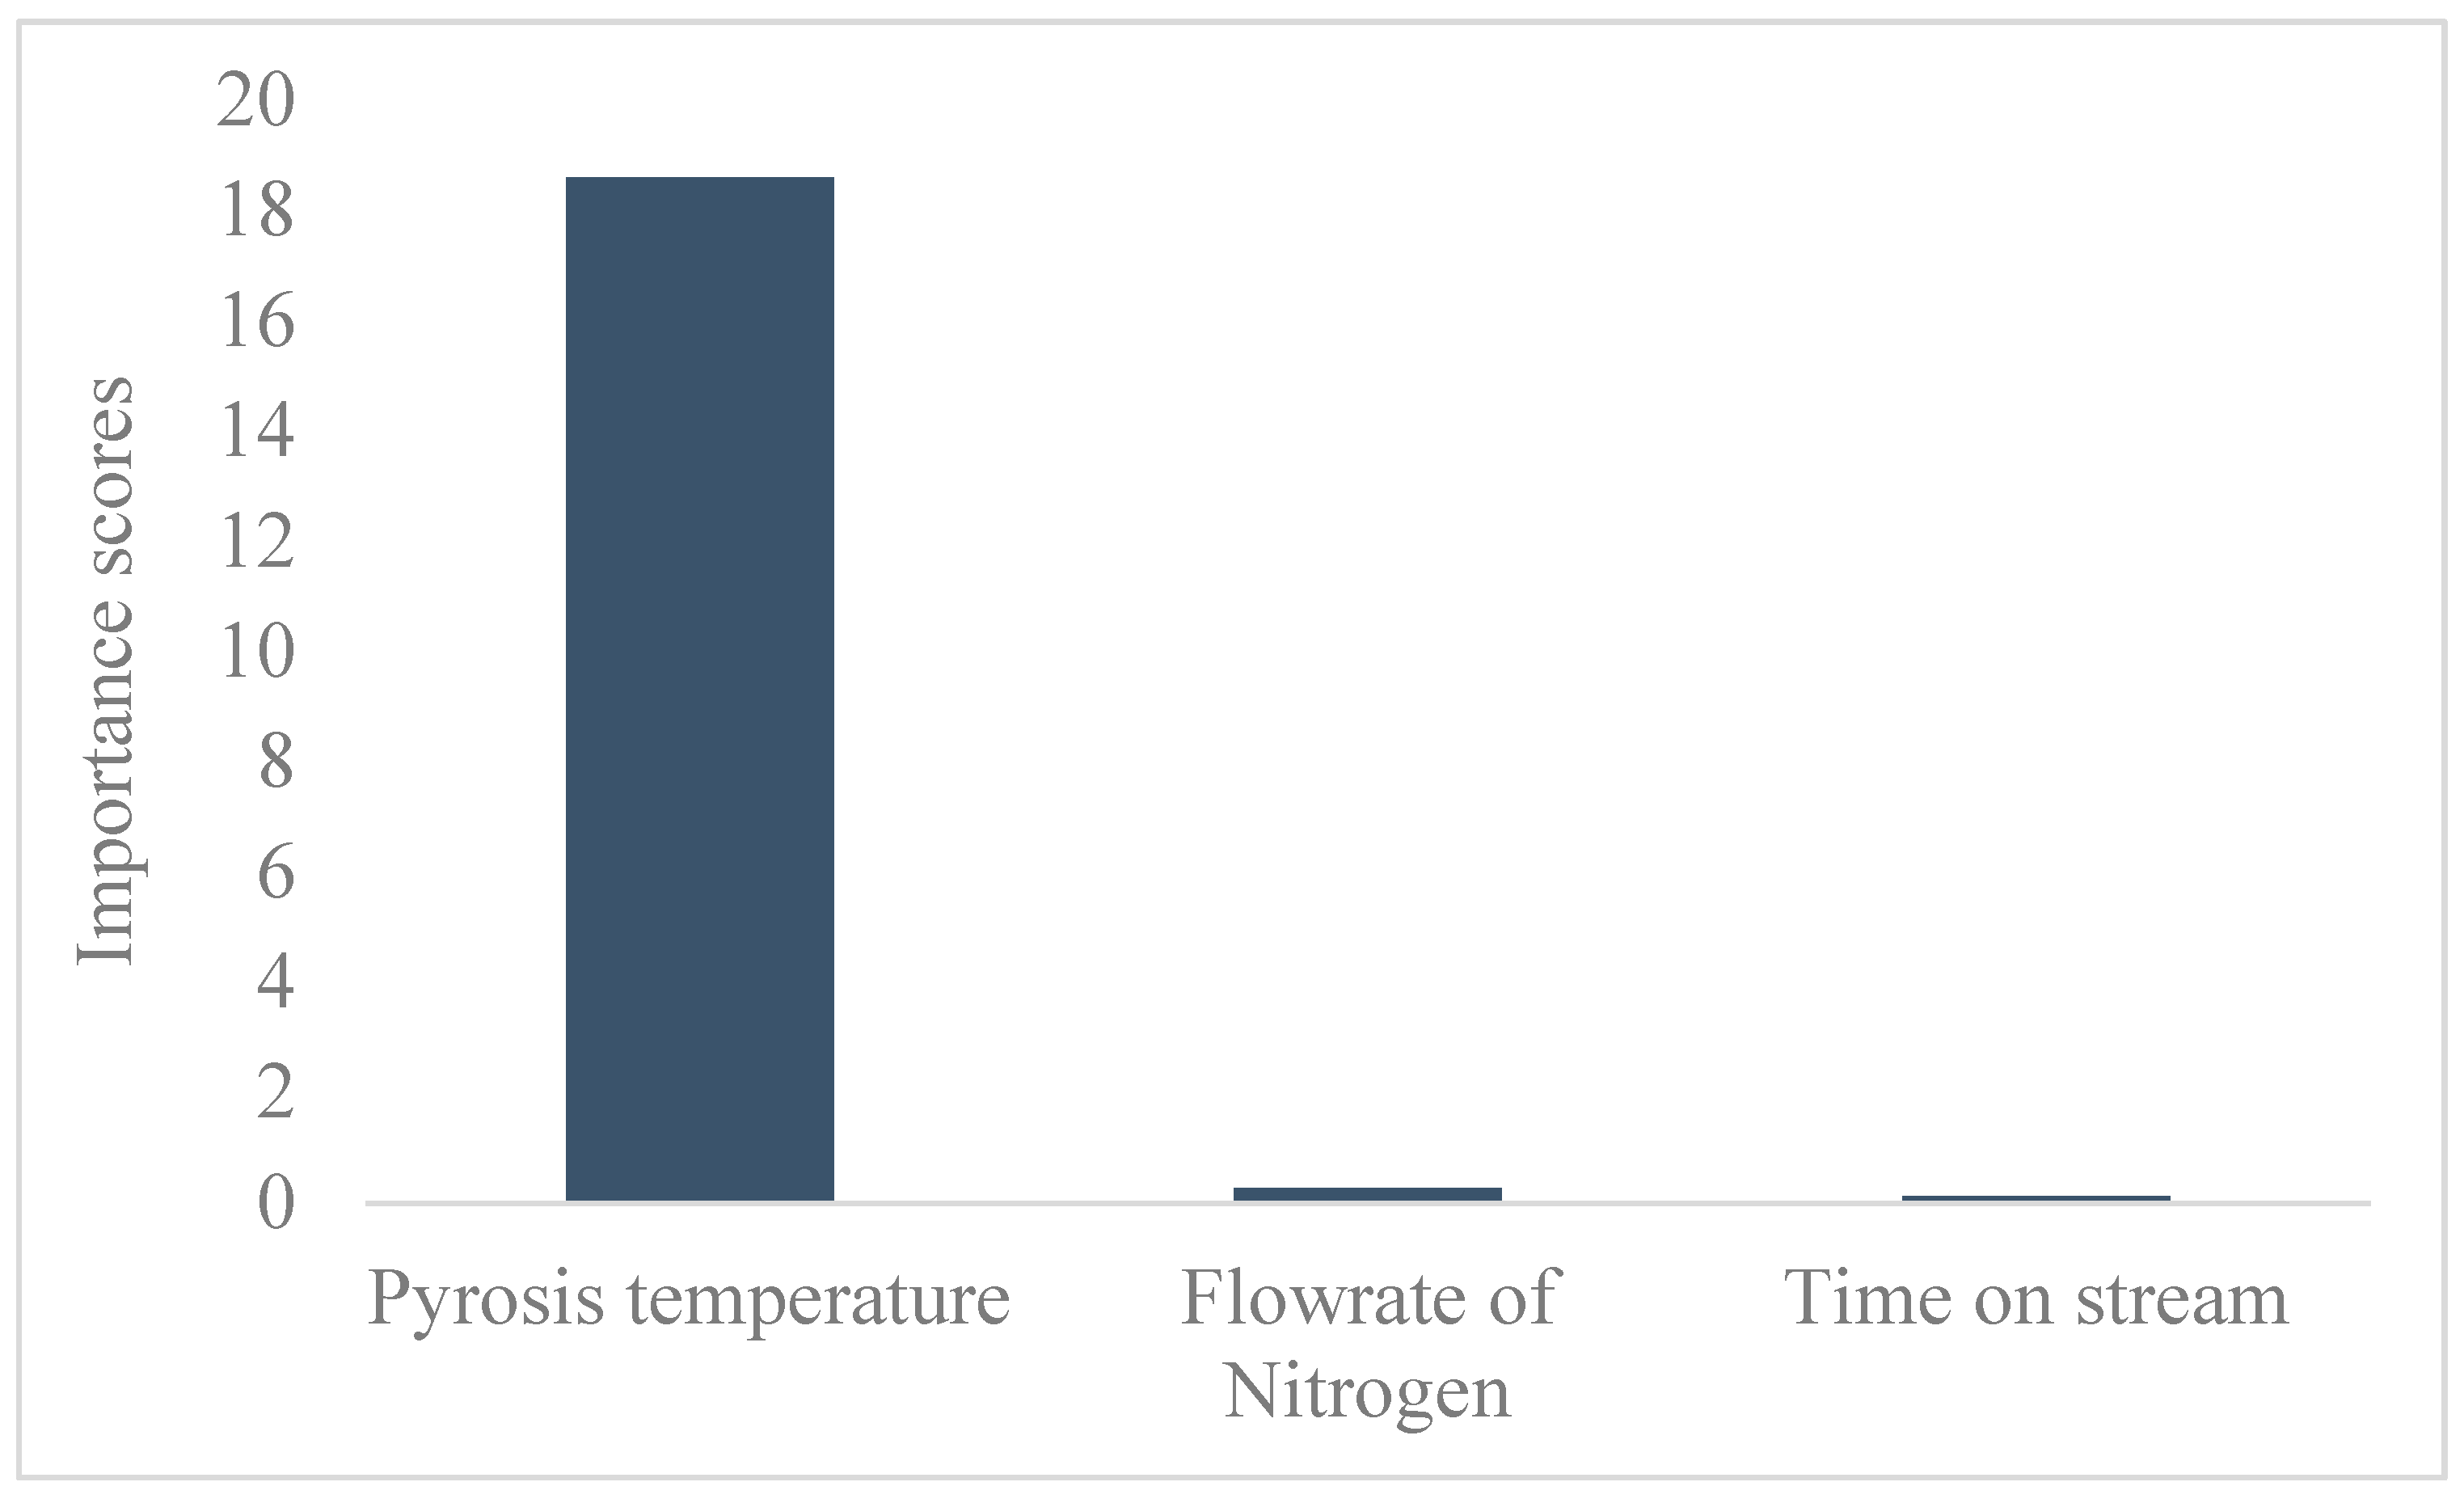
The feature analysis shown in Figure 4 revealed that the pyrolysis temperature significantly influenced the biochar yield. This was consistent with the ANOVA analysis for the response surface quadratic model, which had a p-value far less than 0.05. The comparative analysis showed that the response surface quadratic model with an R2 of 0.989 outperformed the optimized ANN, as indicated by the R2 of 0.900.
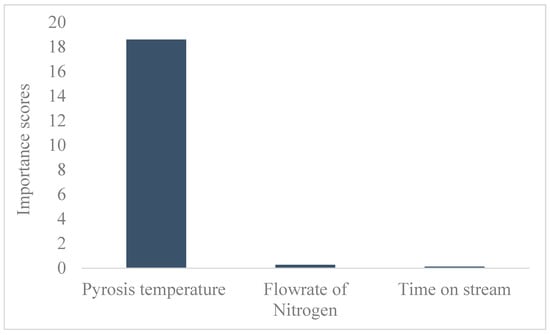
Figure 4.
Feature analysis.
3.4. Characterization of the Biochar
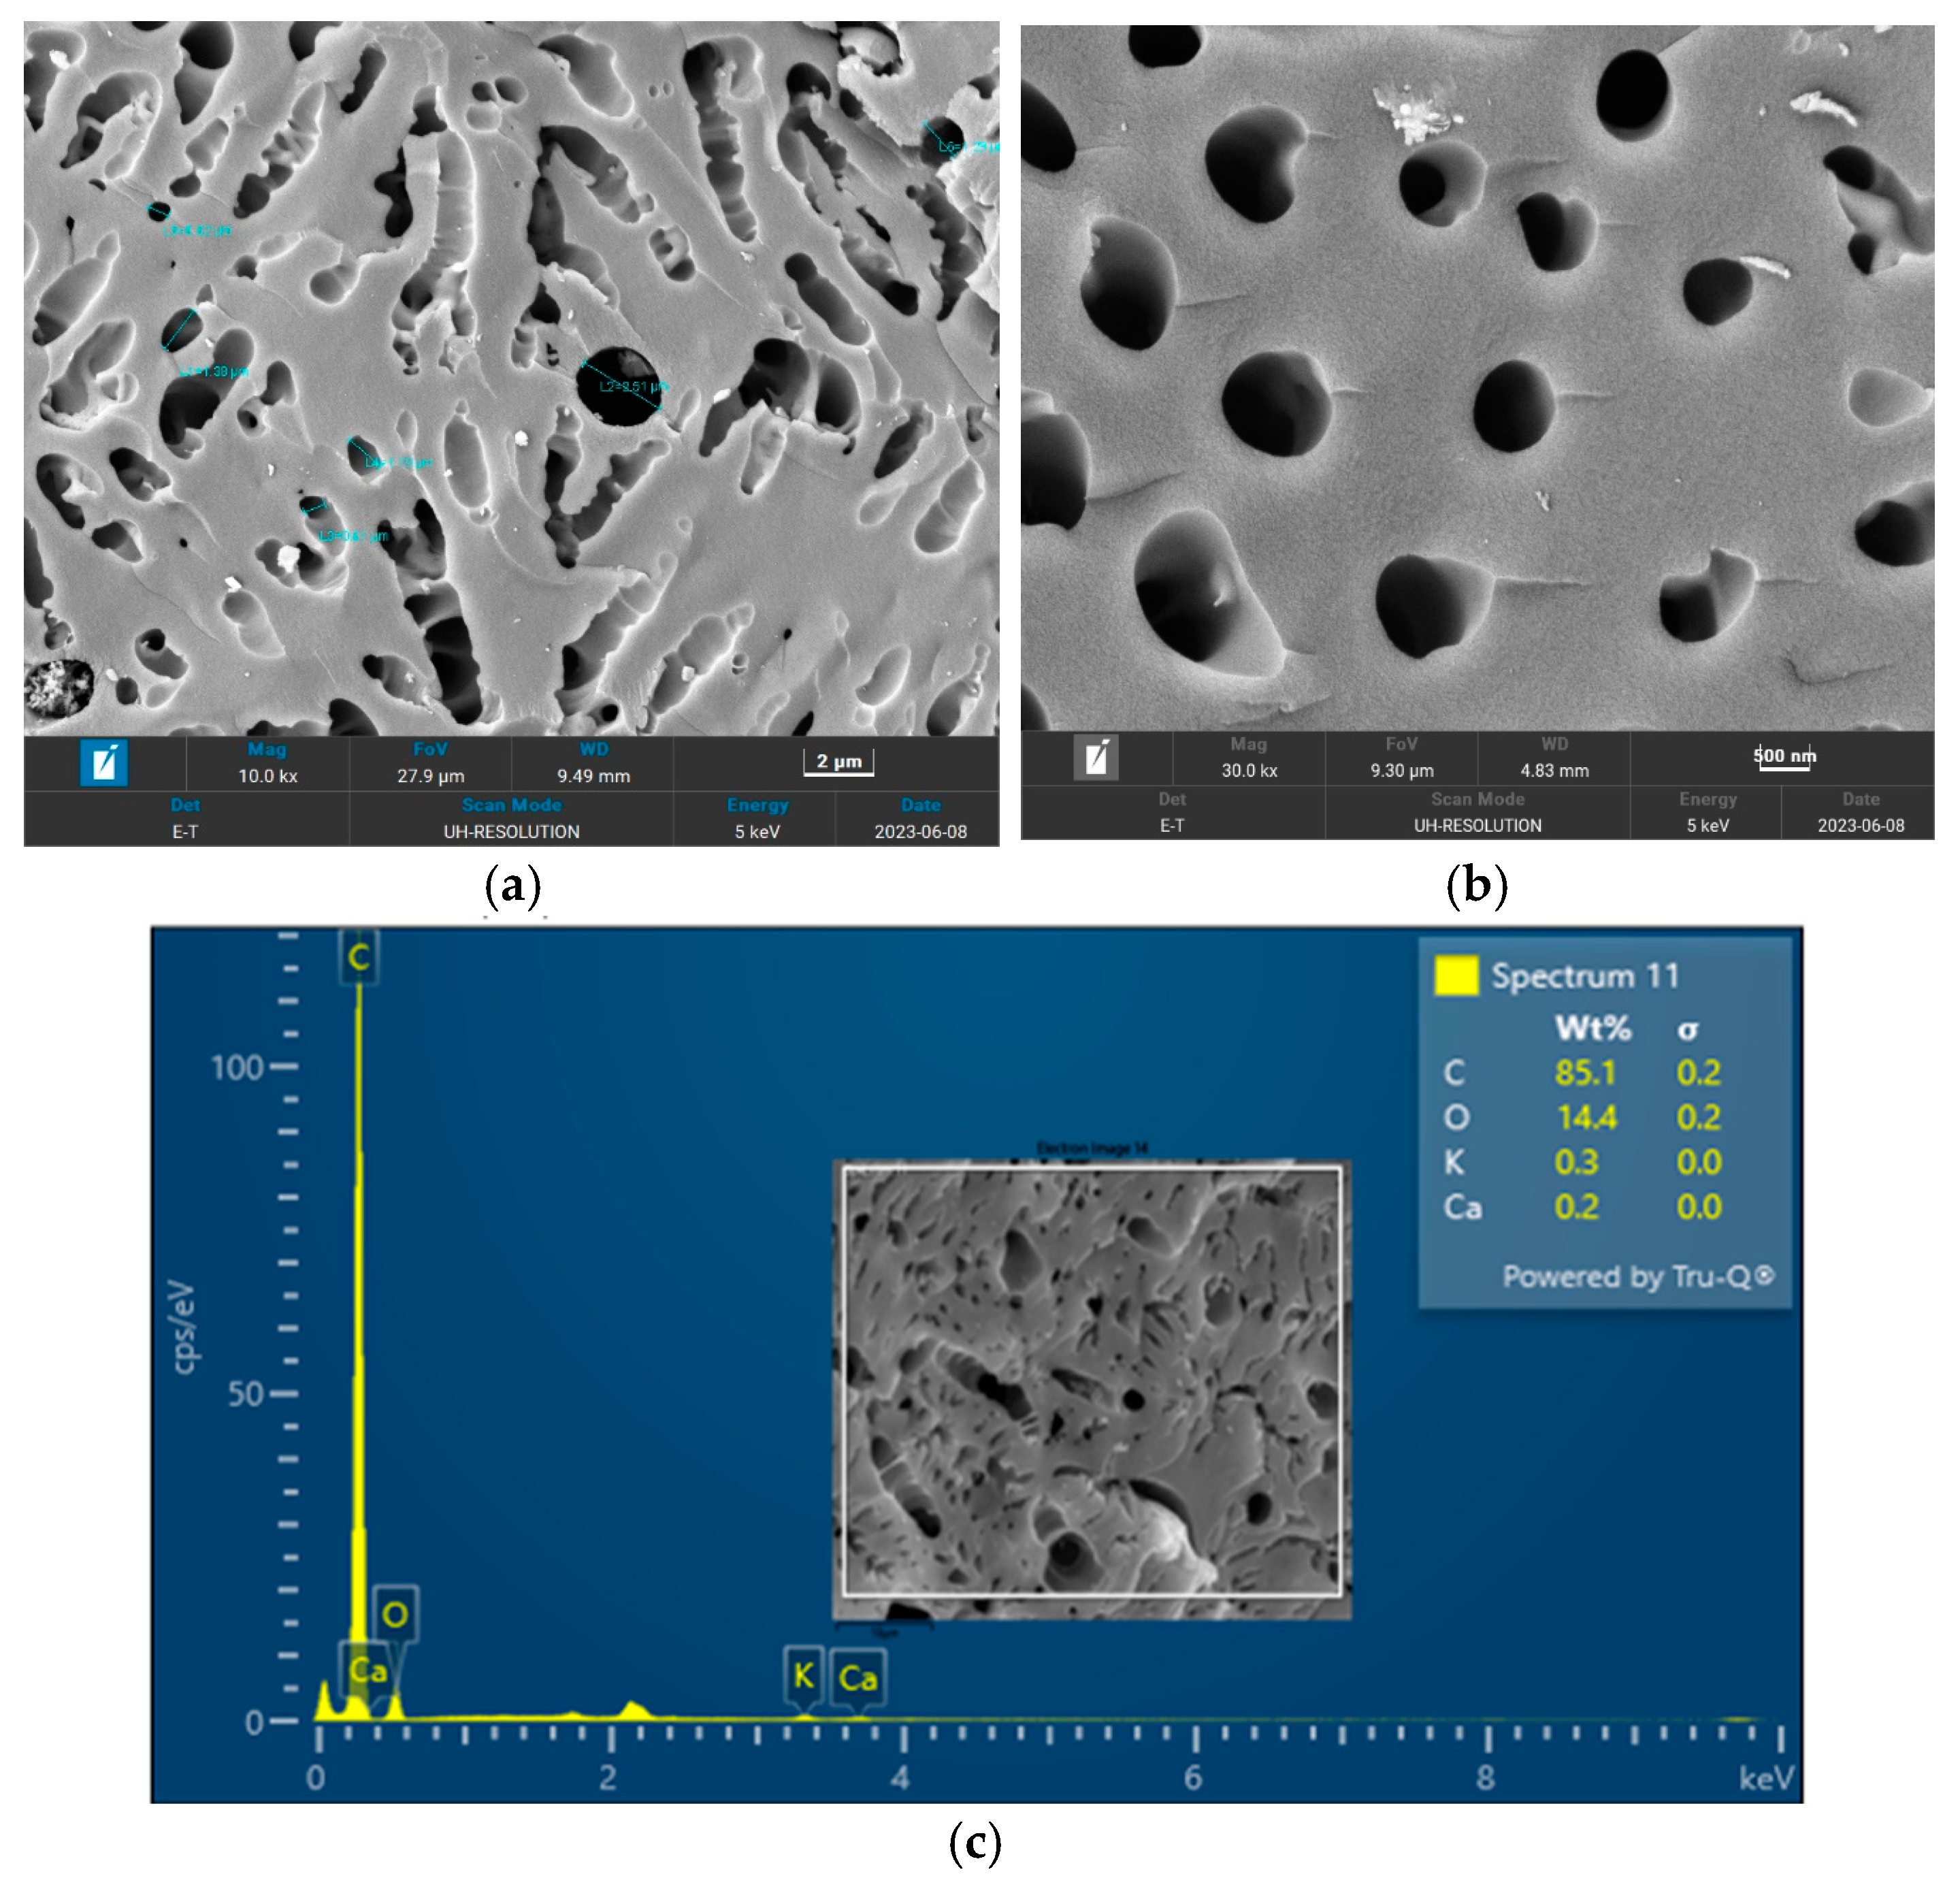
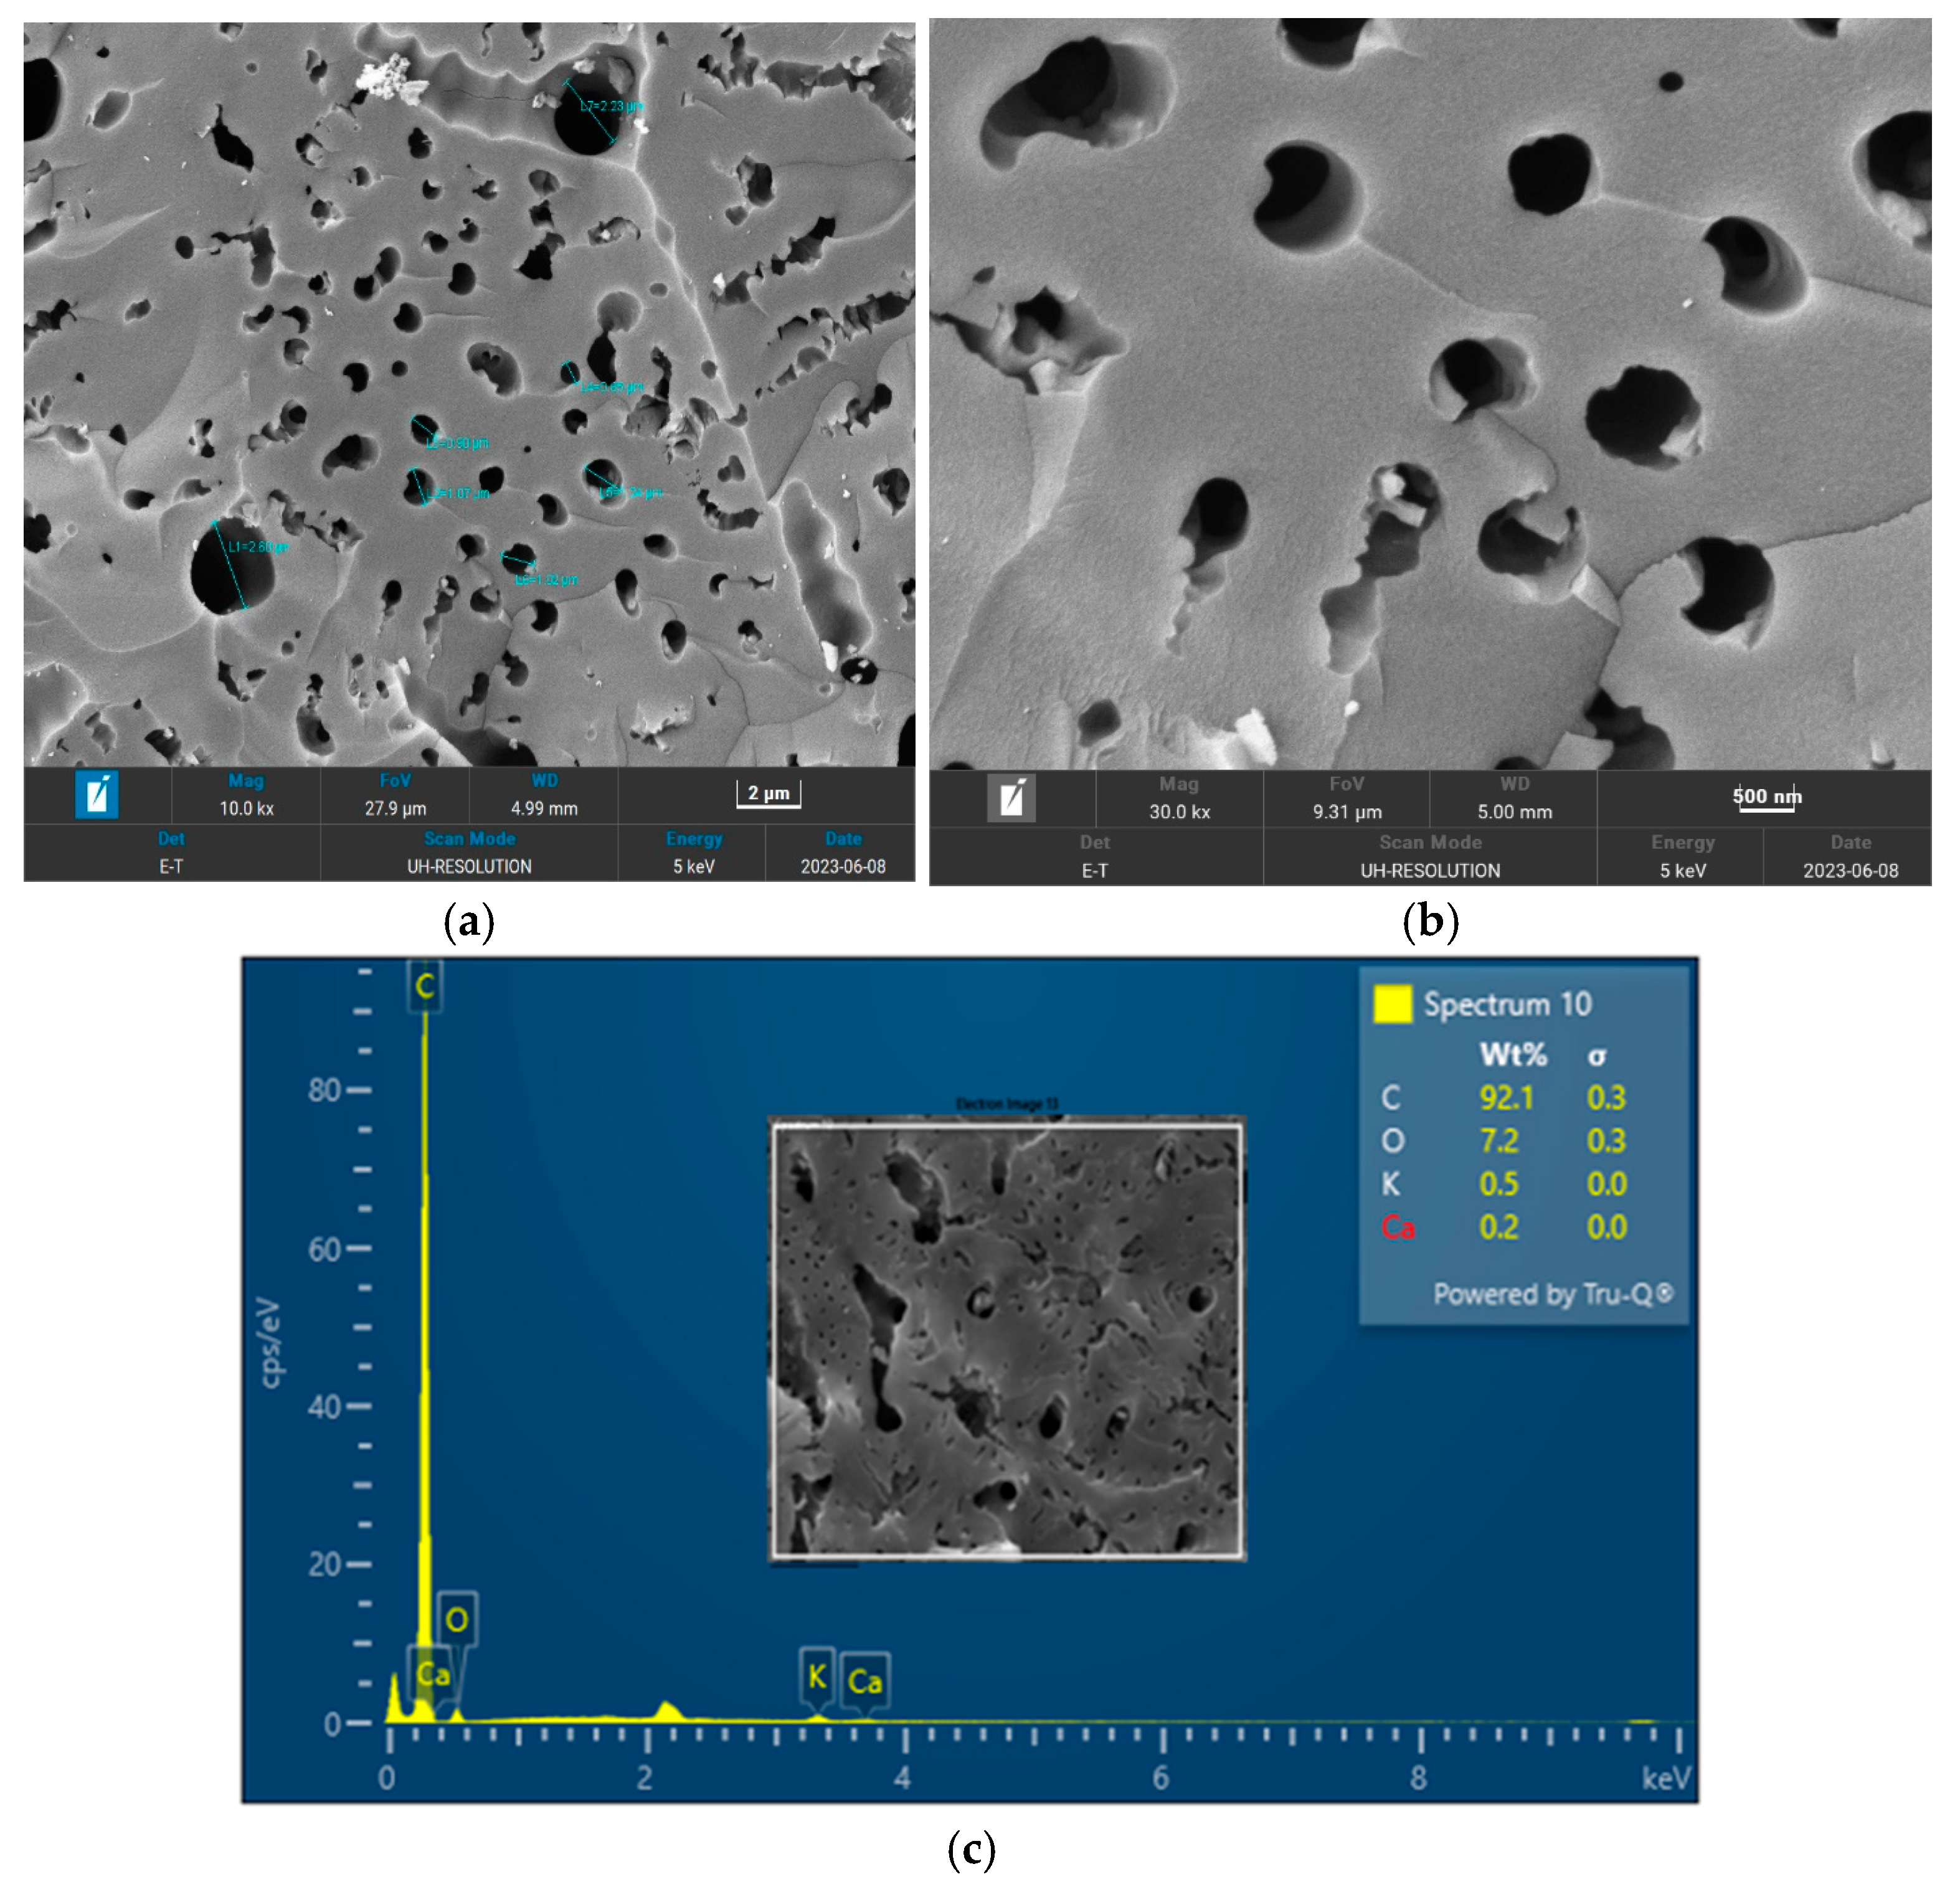
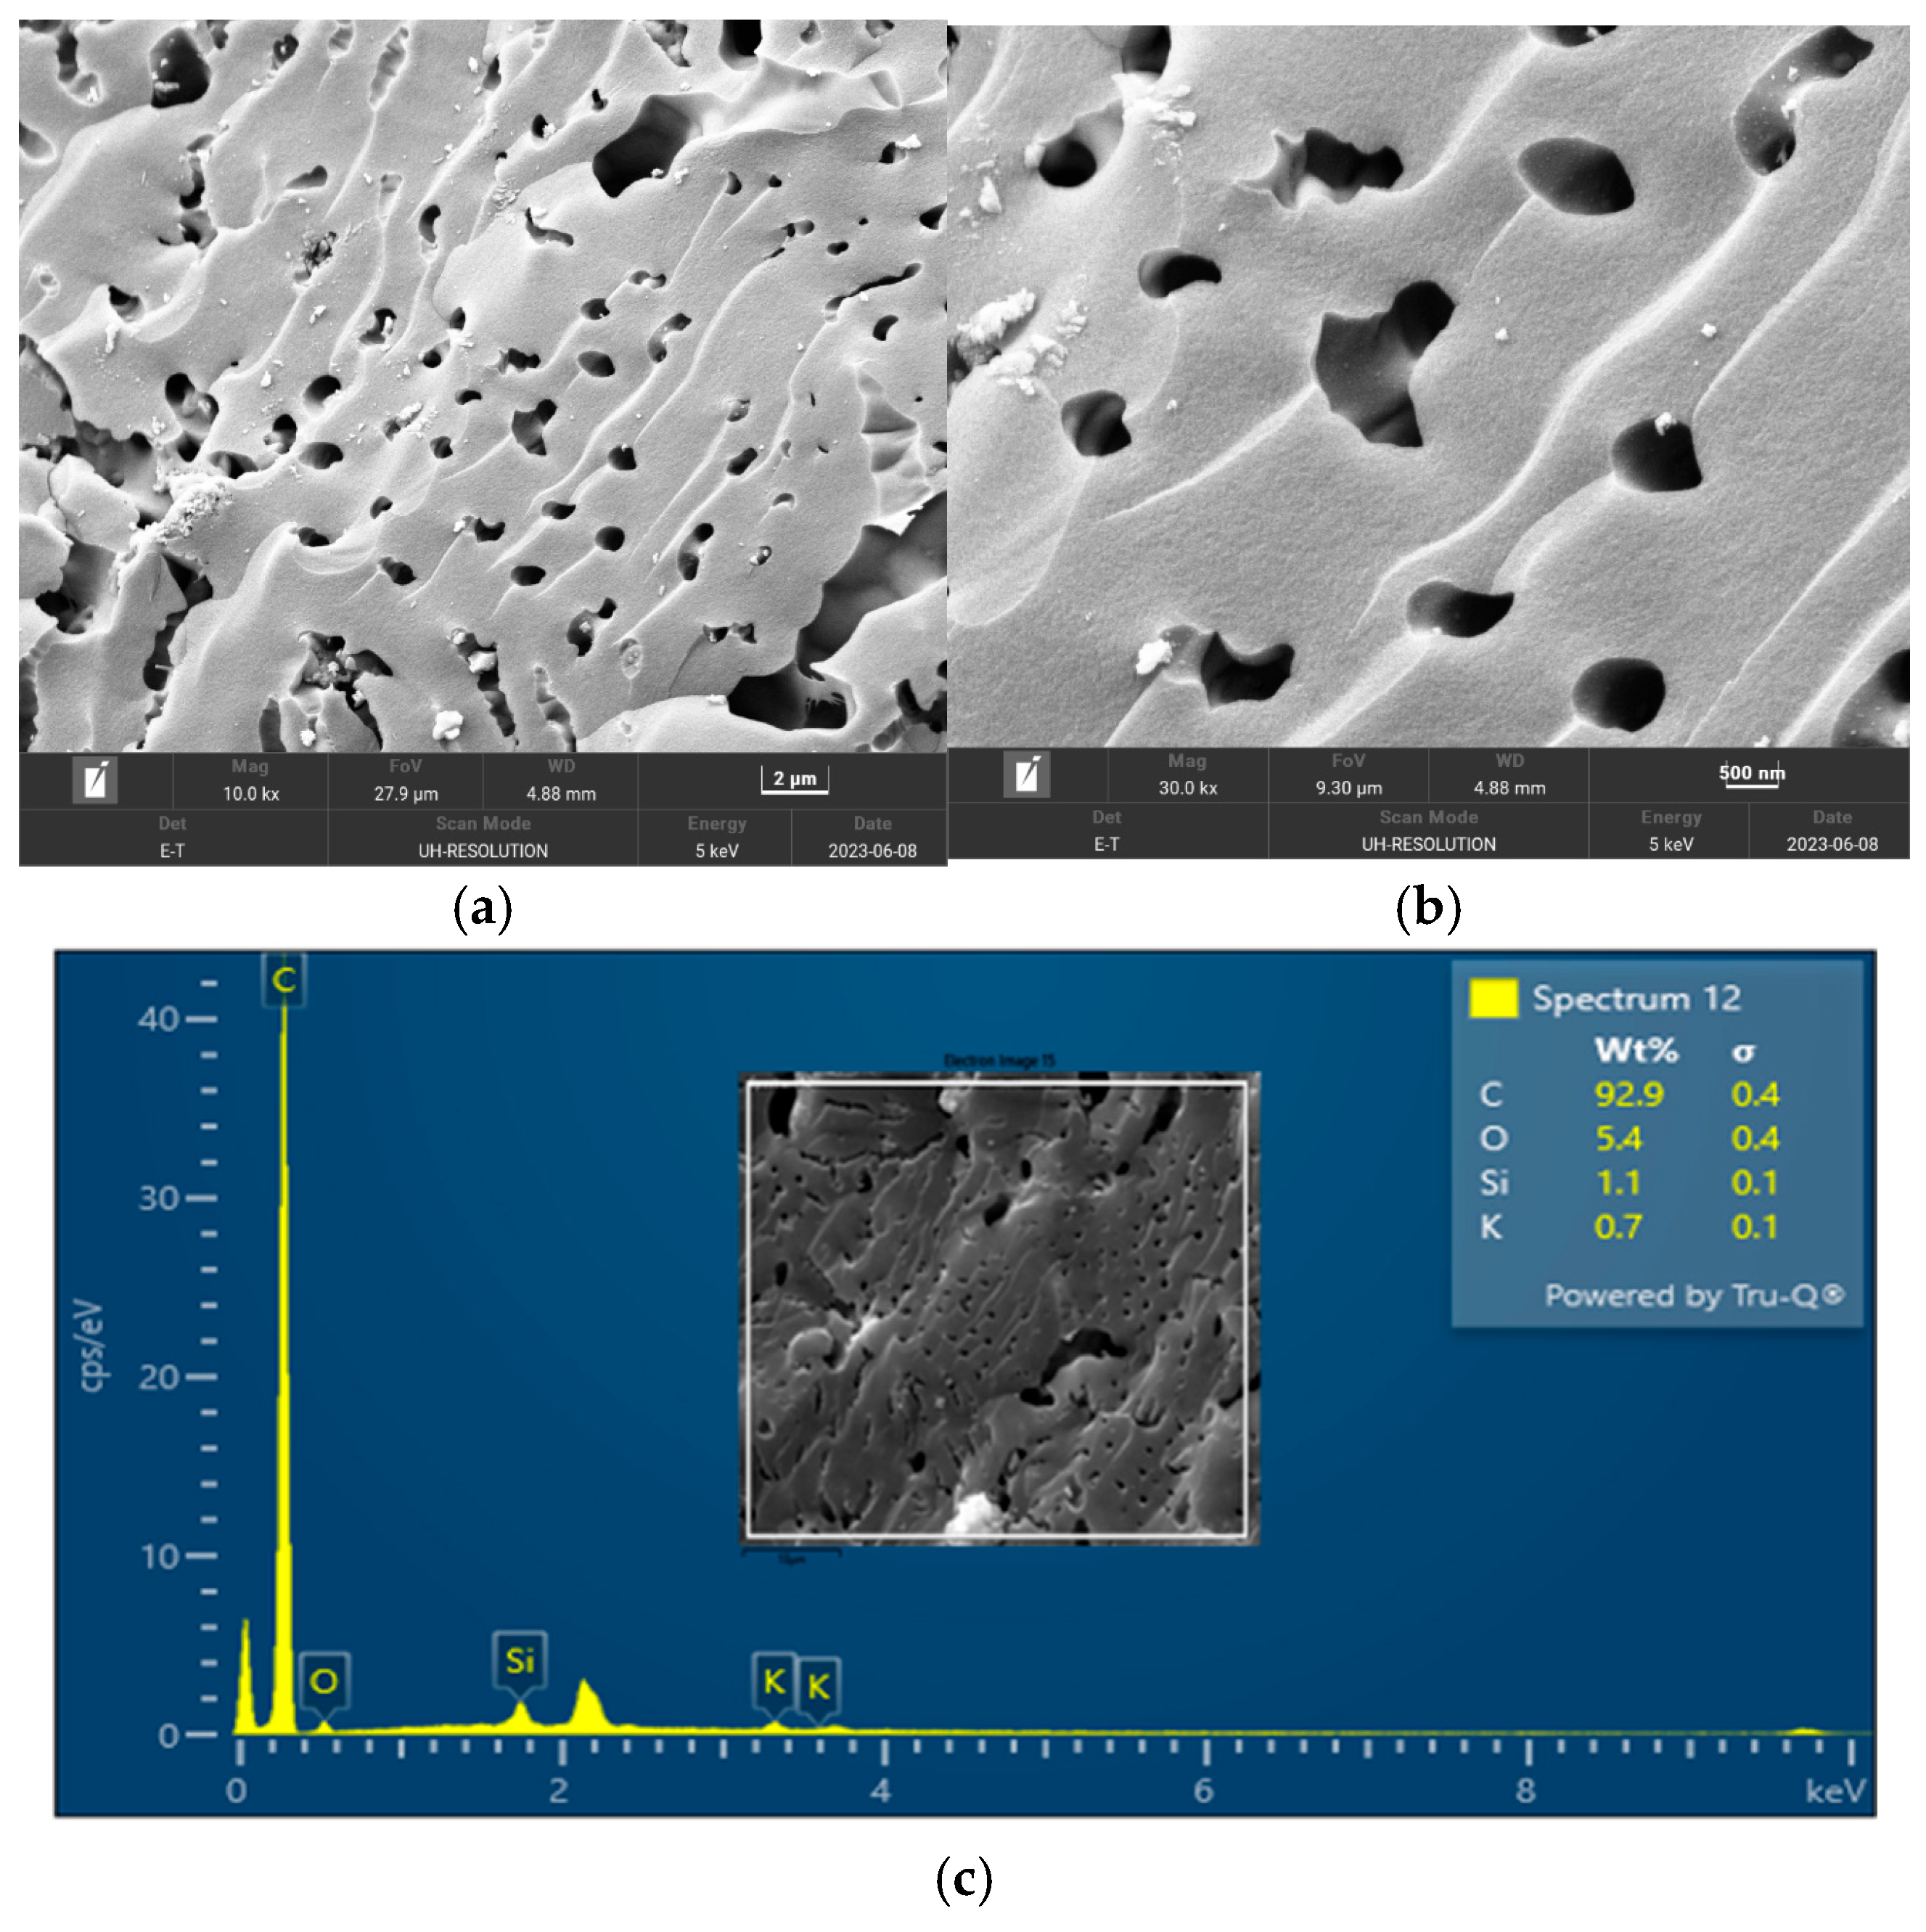
The surface morphology of biochar is an important characteristic that can be used to measure its adsorptive properties for onward applications as an adsorbent in wastewater treatment. The morphology of the biochar pyrolyzed at 400 °C, 600 °C, and 800 °C obtained from FESEM analysis are depicted in Figure 5, Figure 6 and Figure 7, respectively. The biochar morphology pyrolyzed at a temperature range of 400–600 visibly showed the presence of pores with different dimensions. Studies have shown that the morphology of biochar is greatly influenced by the type of agricultural waste utilized for the slow pyrolysis process. Amongst the different biochars that have been produced from agricultural waste, biochar from PKS has demonstrated a high cavity or pore. The pyrolysis temperature can be seen to influence the pore distribution of the biochar as well as the elemental composition. The morphology of the biochar obtained in this study is consistent with that reported by Kassim et al. [21] for a biochar nanocomposite prepared for the adsorptive removal of fluoroquinolones from an aqueous solution. At a pyrolysis temperature of 400 °C, the composition of carbon (C), oxygen, (O) potassium, and calcium (Ca) was obtained as 85.1%, 14.4%, 0.3%, and 0.3%, respectively. Also, at a pyrolysis temperature of 600 °C, the composition of C, O, K, and Ca was obtained as 92.1%, 7.2%, 0.5%, and 0.2%, respectively. At a pyrolysis temperature of 800 °C, the composition of C, O, K, and Ca were obtained as 92.9%, 5.4%, 1.1%, and 0.4%, respectively. It can be seen that the carbon content of the biochar from the pyrolysis increased with an increase in the pyrolysis temperature from 85.1% at 400 °C to 92.9% at 800 °C. Similarly, the composition of the K increased from 0.3% at 400 °C to 1.1% at 800 °C. The O composition in the biochar decreased from 14.4% at 400 °C to 5.4% at 600 °C. Studies have shown that elements such as C, O, K, and Ca have been detected in varying compositions in biochar produced from different agricultural wastes using EDX. Kong et al. [22] reported compositions of approximately 88%, 17%, and 8% for biochar produced from PKS at 500 °C. Moreover, the elemental composition of the biochar obtained in this study is consistent with that reported by Giorcelli et al. [23], who investigated biochar obtained from different pyrolysis temperatures and used as filler in epoxy resin composites.
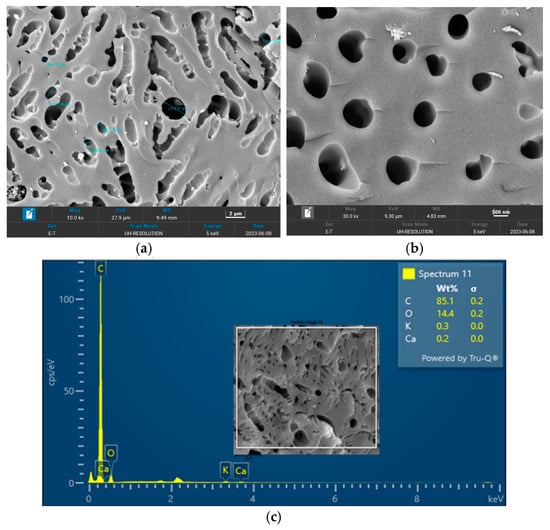
Figure 5.
Morphology of the biochar pyrolyzed at 400 °C: (a) 10 K and (b) 30 K magnifications; (c) EDX micrograph of the biochar pyrolyzed at 400 °C.
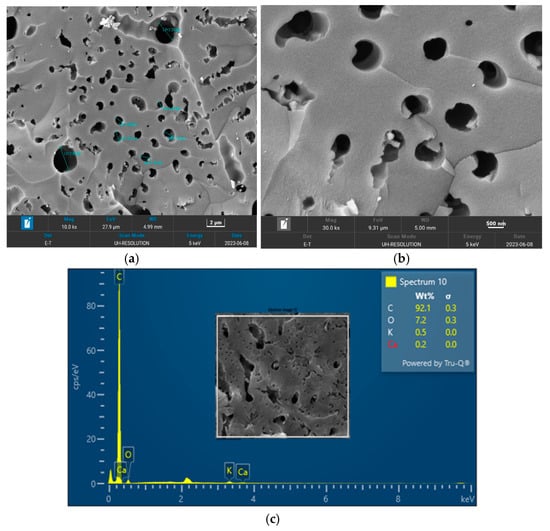
Figure 6.
Morphology of the biochar pyrolyzed at 600 °C: (a) 10 K and (b) 30 K magnifications; (c) EDX micrograph of the biochar pyrolyzed at 600 °C.
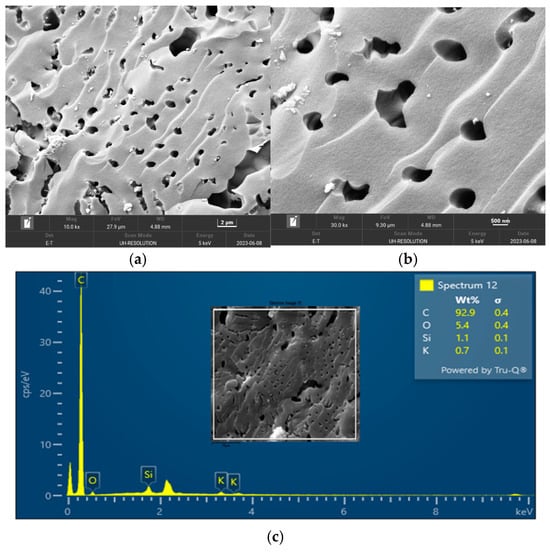
Figure 7.
Morphology of the biochar pyrolyzed at 800 °C: (a) 10 K and (b) 30 K magnifications; (c) EDX micrograph of the biochar pyrolyzed at 400 °C.
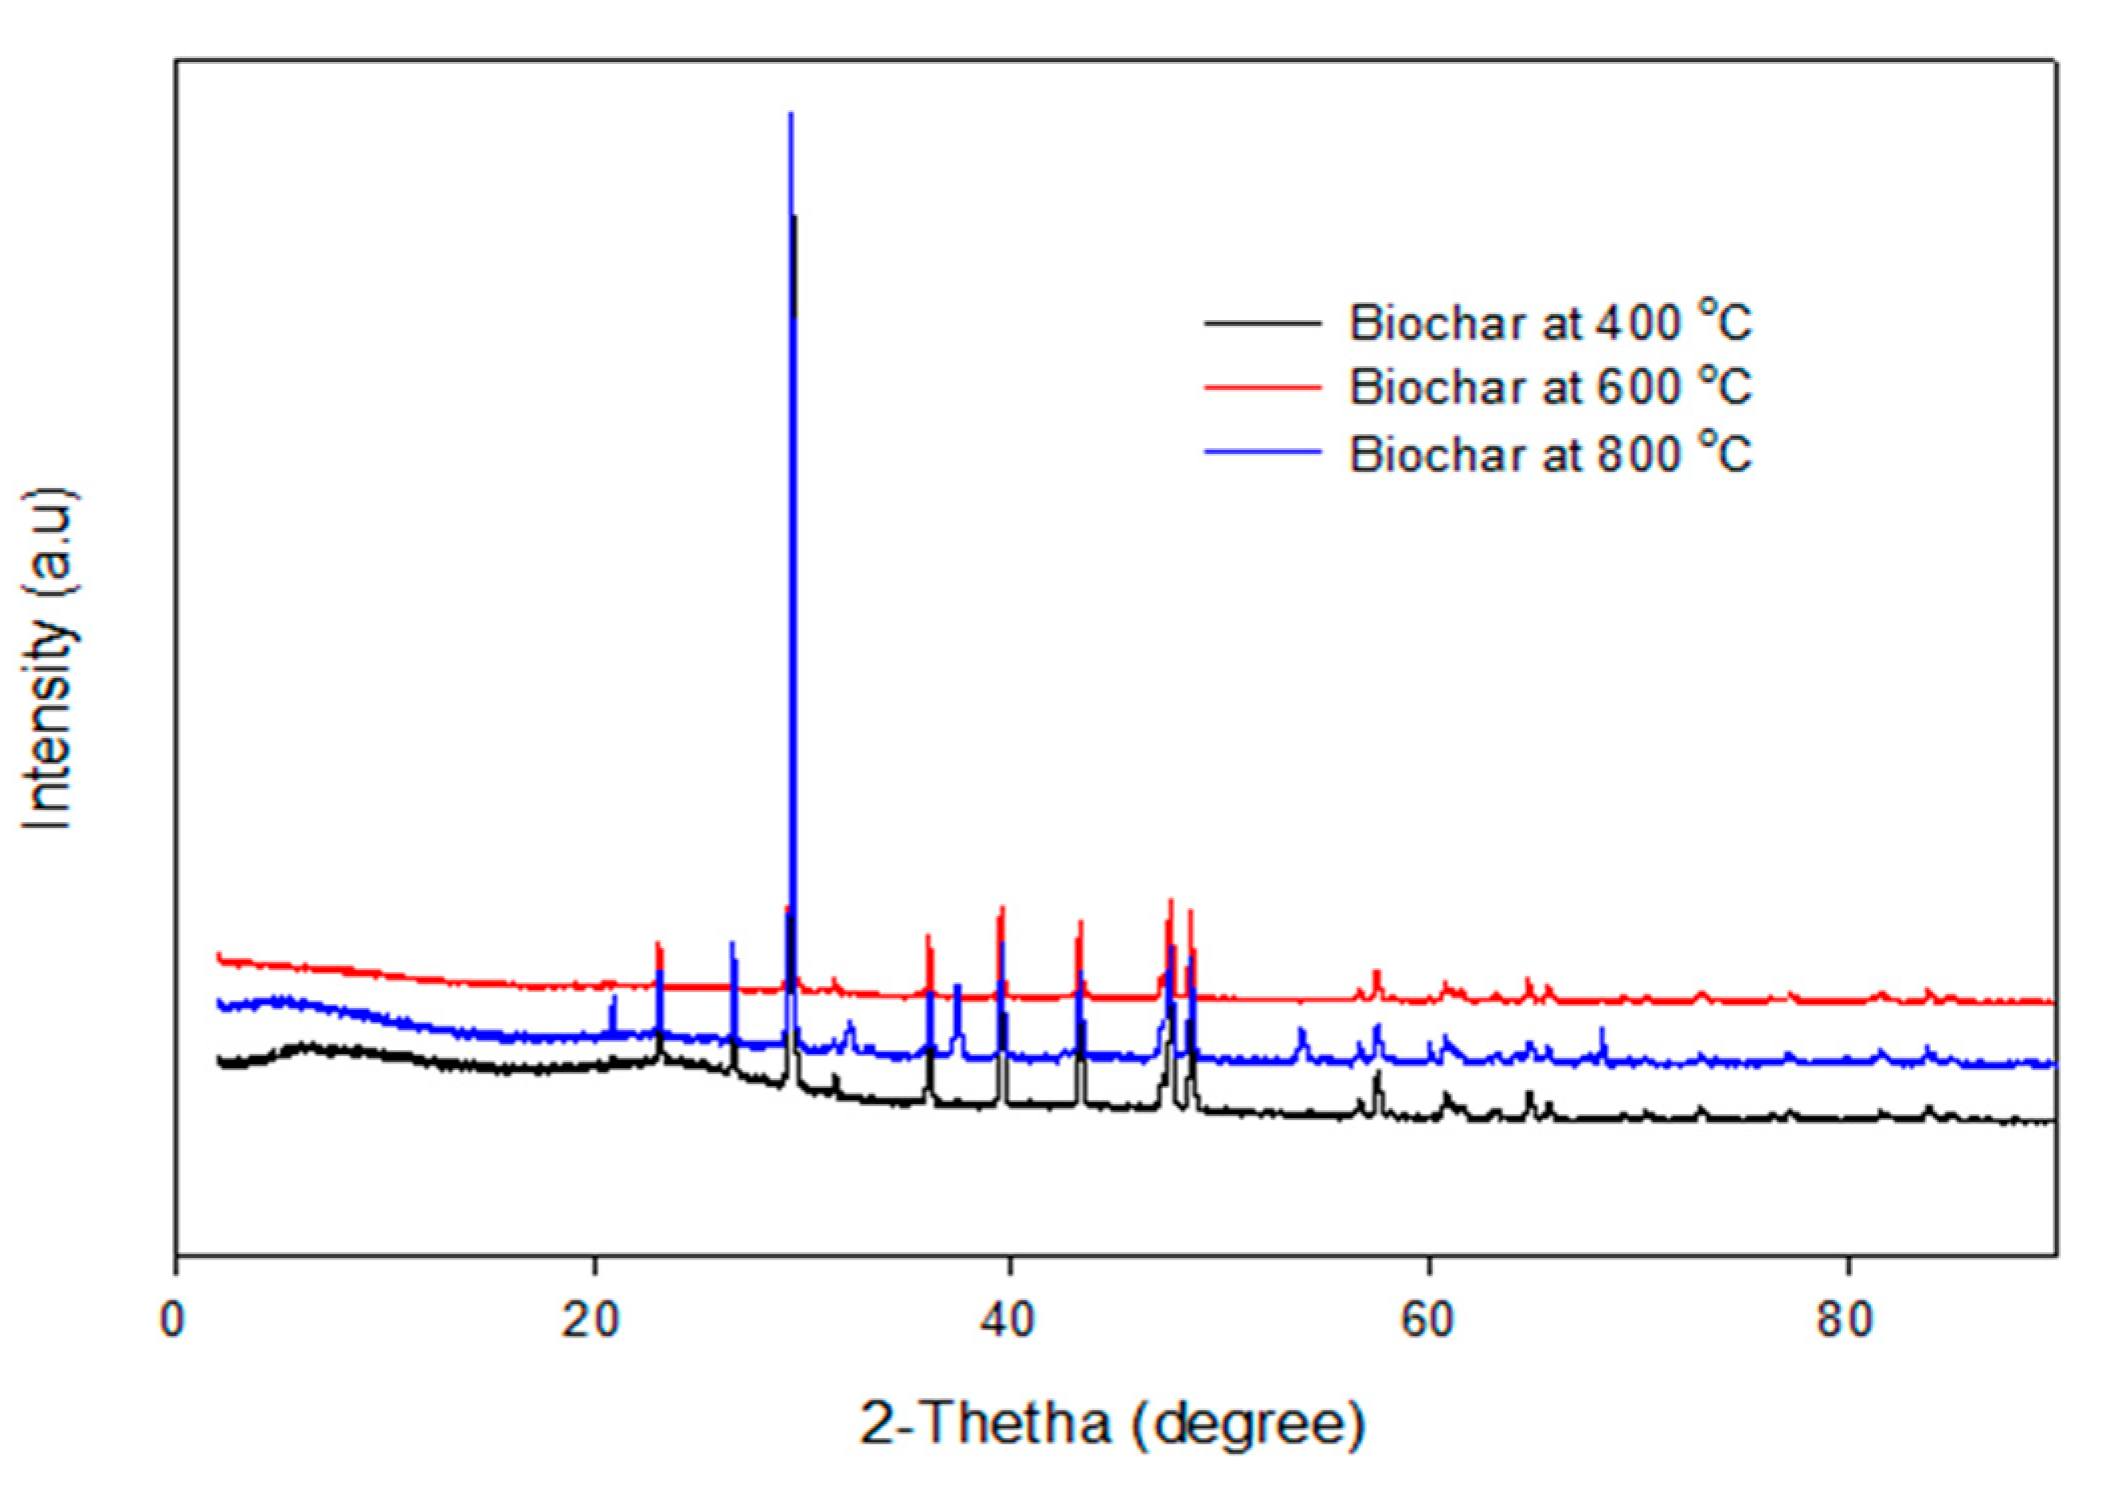
The XRD pattern of the biochars produced by the pyrolysis of PKS at 400 °C, 600 °C, and 800 °C are depicted in Figure 8. It can be seen that the XRD pattern of the biochar obtained at temperatures of 400 °C, 600 °C, and 800 °C are identical, which implies that the crystallite makeup of the biochar was homogeneous, irrespective of the pyrolysis temperature. This is consistent with the EDX micrographs, which show identical elements obtained from the biochar obtained at different temperatures.
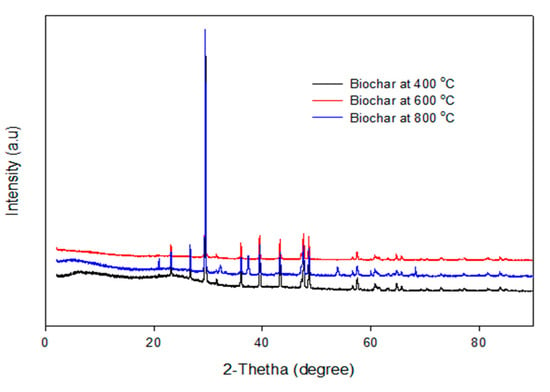
Figure 8.
XRD pattern of the biochar pyrolyzed at 400–800 °C.
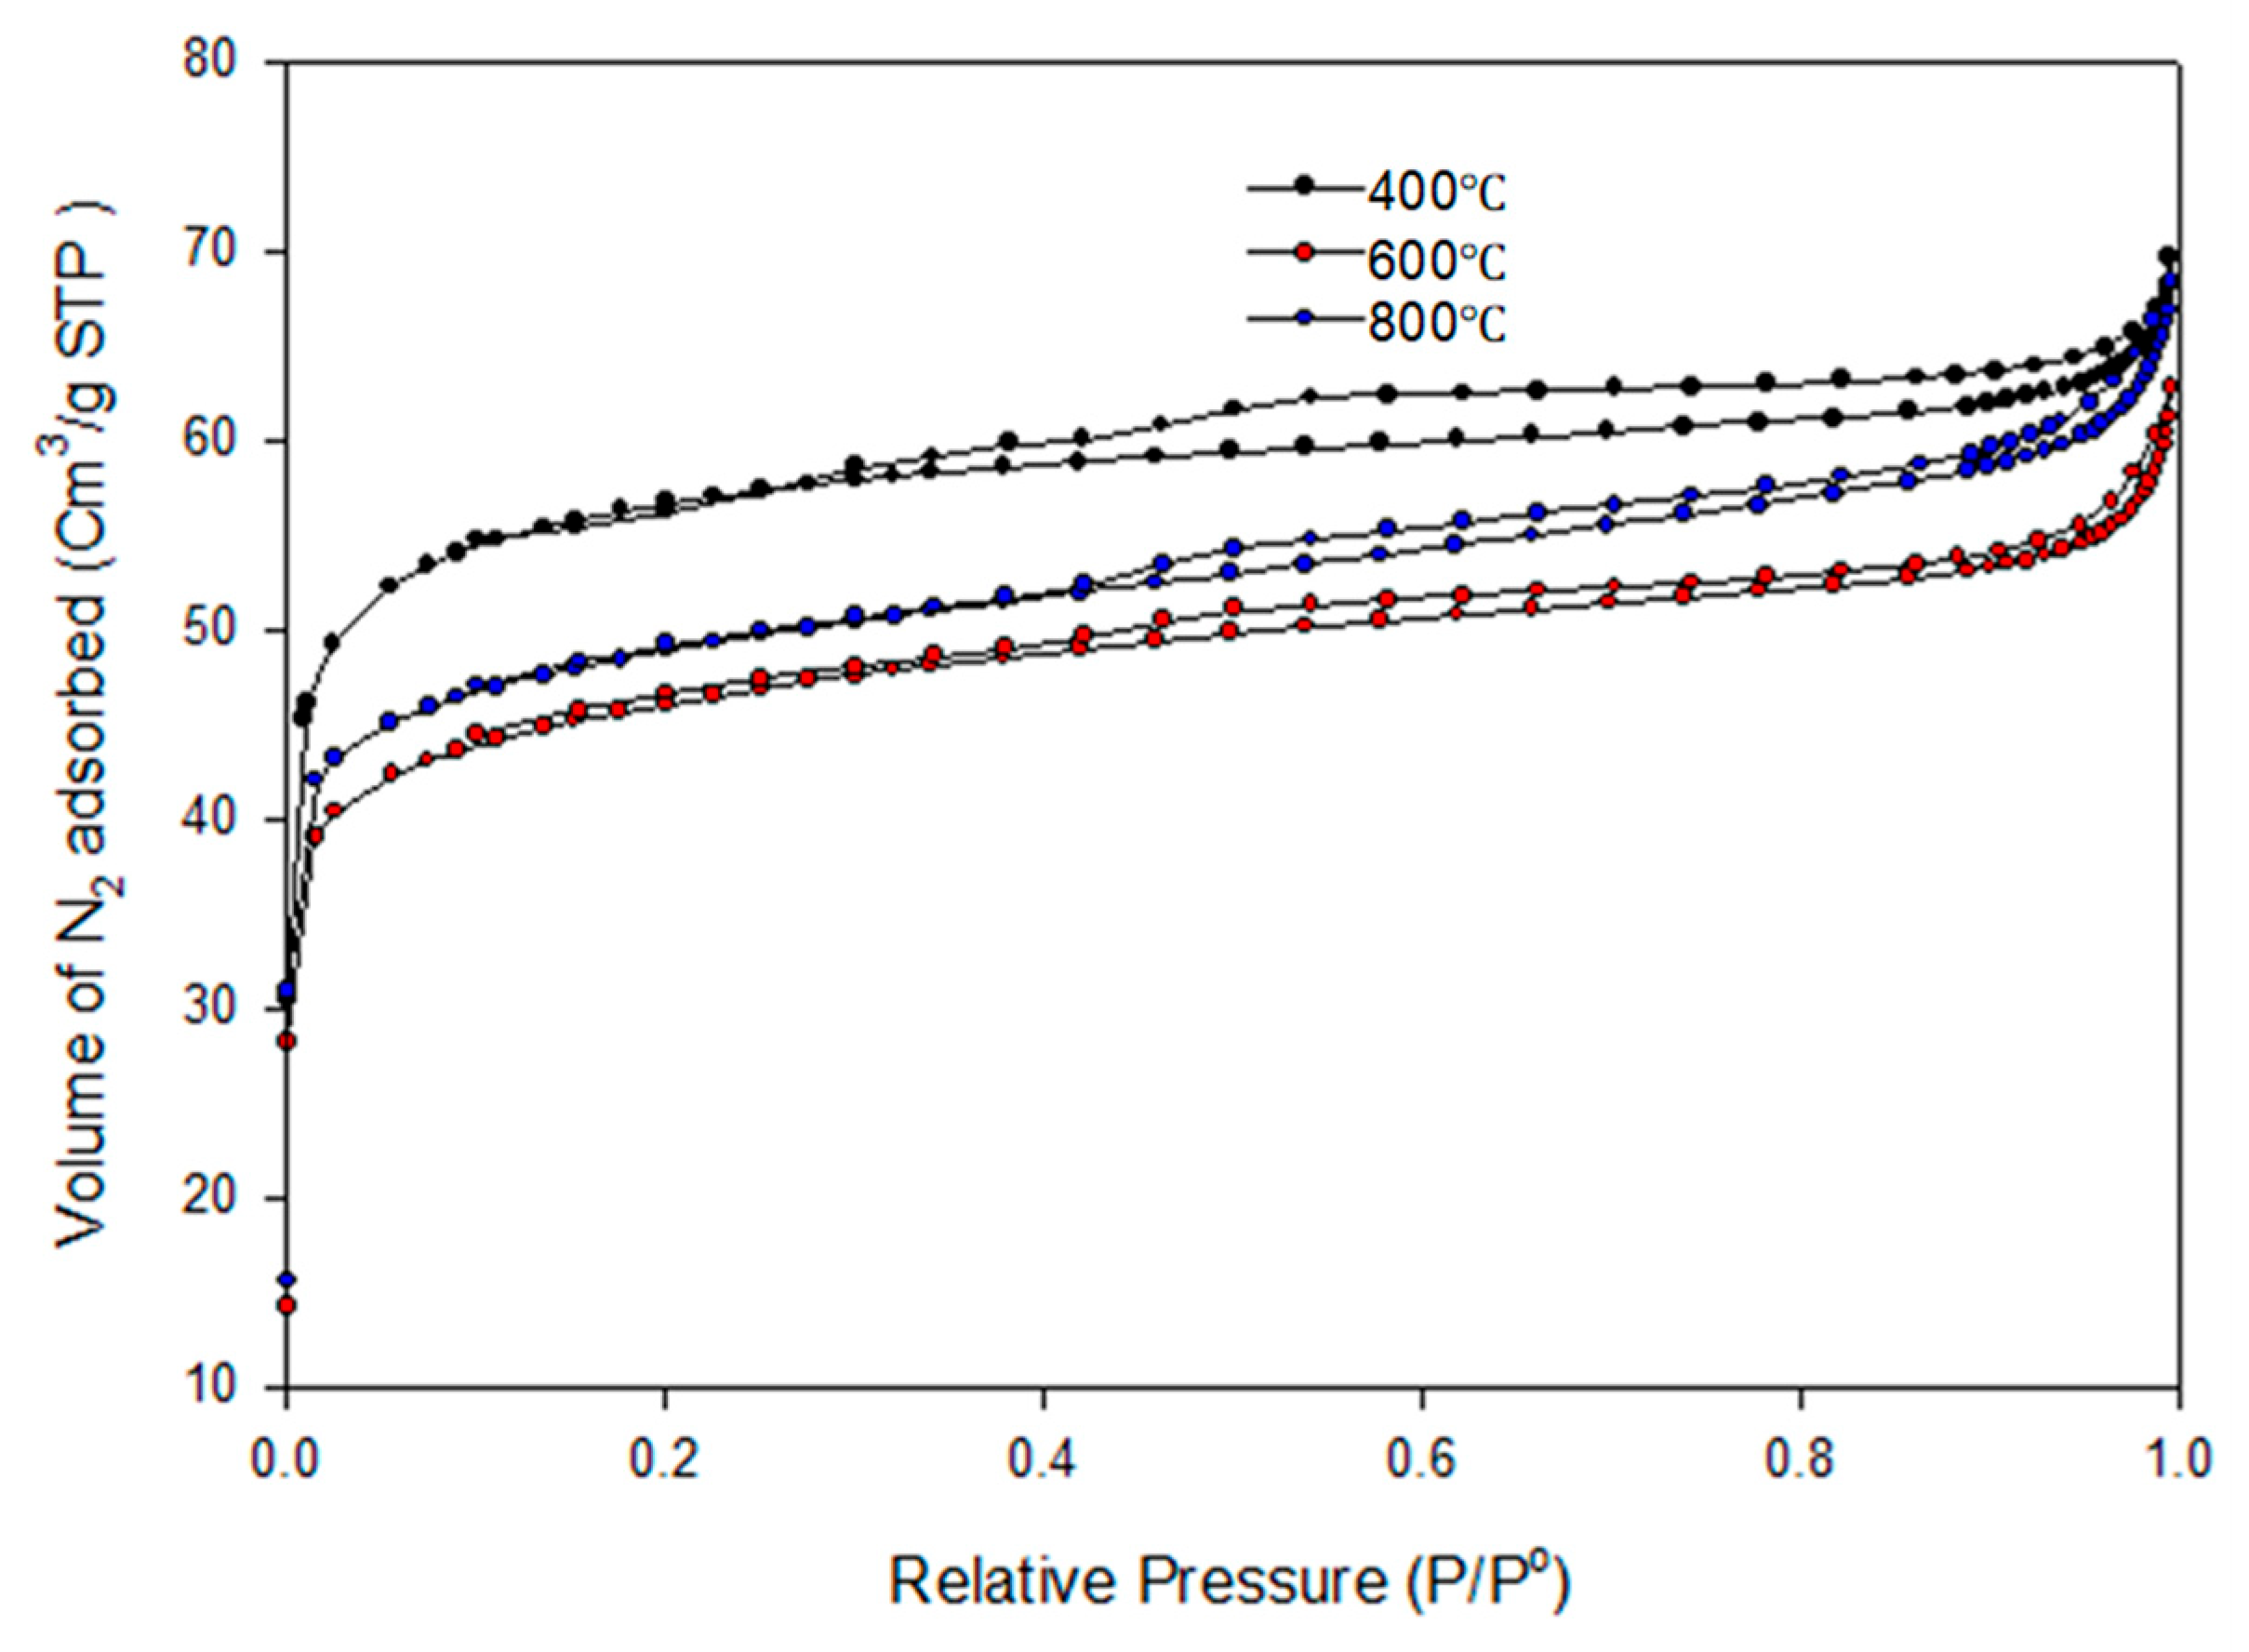
The N2 physisorption analysis of the biochar obtained from the pyrolysis of the PKS at 400 °C, 600 °C, and 800 °C is depicted in Figure 9. Although there are discrepancies in the adsorbed volumes, the isotherm’s shapes in the biochars produced at the same temperatures are comparable. It can be seen that the adsorption isotherms can be classified as type II. Adsorption isotherms of type II are commonly found in adsorbents characterized by a broad spectrum of pore sizes. The formation of the bilayer occurs after the complete formation of the monolayer, whereas the tri-layer is generated after the complete formation of the bilayer. The BET surface area, cumulative pore volume, and pore diameter of the biochar obtained at 400 °C were reported as 178.13 m2/g, 0.020086 cm3/g, and 5.6529 nm, respectively. Also, the BET surface area, cumulative pore volume, and pore diameter of the biochar obtained at 600 °C were reported as 146.22 m2/gm2/g, 0.026528 cm3/g, and 5.5797 nm, respectively. For the biochar pyrolyzed at 800 °C, the BET surface area was estimated as 154.7591 m2/g, cumulative pore volume was estimated as 0.032060 cm3/g, and pore diameter was reported as 5.9025 nm. The pore diameters of the biochar greater than 2 nm were an indication that the biochar was a mesoporous material.
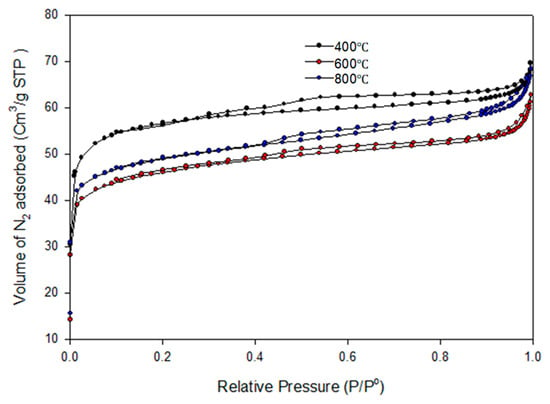
Figure 9.
N2 adsorption isotherm of the biochar pyrolyzed at 400–800 °C.
3.5. Potential Applications of the Biochar Produced
The characterization of the biochar obtained from the PKS pyrolysis revealed some impressive physicochemical properties, such as high porosity, high carbon content, and large surface area at the optimum conditions. Hence, the biochar can be used for many applications, such as soil amendment, carbon sequestration, water filtration, energy storage, and waste management. Brassard et al. [24] and Adhikari et al. [25] reported the potential of biochar obtained from the thermochemical valorization of different biomasses for soil amendment. The study revealed that the biochar derived from the pyrolysis of biomass such as palm kernel shell has the potential to enhance the chemical, physical, and biological properties of soil. Due to the high surface area recorded in this study, the biochar could help to remediate soil from any contamination, such as pesticides and heavy metals, through direct adsorption, thereby mitigating the leaching of such contaminants to water bodies. The leaching of ammonium and nitrate from Acrisol and Calcisol amended with holm oak biochar has been reported by Teutscherova et al. [26]. Besides being used for soil amendment and the adsorption of organic contaminants, biochar derived from the pyrolysis of agricultural waste also finds wide application as a potential material for nutrient dynamics. Peiris et al. [27] reported that biochar obtained from the pyrolysis of agriculture waste can help to enhance the retention of soil nutrients, thereby minimizing nutrient-leaching effects.
4. Conclusions
RSM and ANN performance in modeling biochar yield from the slow pyrolysis of PKS was investigated in this study. The analysis of variance of the five response surface models evaluated (linear, mean, 2FI, quadratic, and cubic) revealed that the response surface quadratic model displayed the best performance, as indicated by parameters such as the p-value of the model and the significance of the lack of fit. The three factors, namely, pyrolysis temperature, the flow rate of nitrogen, and the time on stream, were found to have a significant effect on the biochar yield. Based on the ranking of the desirability function, the response surface quadratic model optimization criteria resulted in a maximum biochar yield of 37.87% obtained under the optimized conditions of pyrolysis temperature of 799.71 °C, nitrogen flow rate of 150.01 mL/min, and duration on stream of 107.61 min. Among the four ANN models investigated (narrow, medium, wide, and optimized), the optimized ANN displayed the best predictability of biochar yield, as revealed by an R2 of 0.9 and the lowest RMSE and MAE. Nevertheless, the response surface quadratic model displayed better predictability, as indicated by the R2 of 0.989 compared with the ANN. Since there is growing interest in the use of biochar derived from agricultural wastes for soil amendment and as adsorbents for the removal of contaminants from polluted wastewater, the characterization of the biochar using FESEM, EDX, XRD, and N2 physisorption revealed great potential of the biochar for soil amendment and as an adsorbent.
Author Contributions
Conceptualization, H.H.S. and R.K.; methodology, B.V.A.; software, B.V.A.; validation, R.K., H.H.S. and B.V.A.; formal analysis, R.K. and B.V.A.; investigation, R.K.; resources, H.H.S.; data curation, R.K.; writing—original draft preparation, R.K. and B.V.A.; writing—review and editing, H.H.S.; visualization, H.H.S.; project administration, H.H.S.; funding acquisition, H.H.S. All authors have read and agreed to the published version of the manuscript.
Funding
This research work was funded by Institutional Fund Projects under grant no. (IFPRC-195-135-2020). Therefore, the authors gratefully acknowledge technical and financial support from the Ministry of Education and King Abdulaziz University, DSR, Jeddah, Saudi Arabia.
Data Availability Statement
All data are presented in the main text.
Acknowledgments
The authors gratefully acknowledge technical and financial support from the Ministry of Education and King Abdulaziz University, DSR, Jeddah, Saudi Arabia.
Conflicts of Interest
The authors declare that they have no known competing financial interests or personal relationships that could have appeared to influence the work reported in this paper.
Abbreviations
| Acronyms | Meaning |
| ANN | Artificial neural network |
| ANOVA | Analysis of variance |
| BBD | Box–Behnken Design |
| BET | Brunauer–Emmett–Teller |
| CCD | Central composite design |
| df | Degree of freedom |
| EDX | Energy dispersive X-ray |
| FESEM | Field emission scanning electron microscopy |
| MAE | Mean absolute value |
| PKS | Palm kernel shell |
| R2 | Coefficient of determination |
| RSM | Response surface methodology |
| RMSE | Root mean squared error |
| 2FI | Two-factor interaction |
References
- Koul, B.; Yakoob, M.; Shah, M.P. Agricultural waste management strategies for environmental sustainability. Environ. Res. 2022, 206, 112285. [Google Scholar] [CrossRef] [PubMed]
- Xiang, W.; Zhang, X.; Chen, J.; Zou, W.; He, F.; Hu, X.; Tsang, D.C.W.; Ok, Y.S.; Gao, B. Biochar technology in wastewater treatment: A critical review. Chemosphere 2020, 252, 126539. [Google Scholar] [CrossRef] [PubMed]
- Al, M.; Ahmed, M.; Al, Z.; Vuthaluru, H.; Znad, H.; Al, M. Boron removal from seawater using date palm (Phoenix dactylifera) seed ash. Desalin. Water Treat. 2016, 57, 5130–5137. [Google Scholar] [CrossRef]
- Gupta, G.K.; Mondal, M.K. Bio-energy generation from sagwan sawdust via pyrolysis: Product distributions, characterizations and optimization using response surface methodology. Energy 2019, 170, 423–437. [Google Scholar] [CrossRef]
- Wafti, N.S.A.; Lau, H.L.N.; Loh, S.K.; Aziz, A.A.; Rahman, Z.A.; May, C.Y. Activated carbon from oil palm biomass as potential adsorbent for palm oil mill effluent treatment. J. Oil Palm Res. 2017, 29, 278–290. [Google Scholar] [CrossRef][Green Version]
- Hamzah, N.; Tokimatsu, K.; Yoshikawa, K. Solid fuel from oil palm biomass residues and municipal solid waste by hydrothermal treatment for electrical power generation in Malaysia: A review. Sustainability 2019, 11, 1060. [Google Scholar] [CrossRef]
- Uemura, Y.; Saadon, S.; Osman, N.; Mansor, N.; Tanoue, K. Torrefaction of oil palm kernel shell in the presence of oxygen and carbon dioxide. Fuel 2015, 144, 171–179. [Google Scholar] [CrossRef]
- Chew, J.J.; Soh, M.; Sunarso, J.; Yong, S.-T.; Doshi, V.; Bhattacharya, S. Gasification of torrefied oil palm biomass in a fixed-bed reactor: Effects of gasifying agents on product characteristics. J. Energy Inst. 2020, 93, 711–722. [Google Scholar] [CrossRef]
- Shahbaz, M.; Yusup, S.; Inayat, A.; Patrick, D.O.; Pratama, A.; Ammar, M. Optimization of hydrogen and syngas production from PKS gasification by using coal bottom ash. Bioresour. Technol. 2017, 241, 284–295. [Google Scholar] [CrossRef]
- Waqar, A.; Bheel, N.; Kirgiz, M.S.; Khan, M.B.; Mansoor, M.S. Agro-Industrial Supplementary Cementitious Materials for Realizing Sustainable Development Goals of the UN and Net-Zero CO2 Emission. In Handbook of Innovative Adhesive Technology; Jenny Stanford Publishing: Singapore, 2025; pp. 215–243. [Google Scholar]
- Chan, Y.H.; Yusup, S.; Quitain, A.T.; Uemura, Y.; Sasaki, M. Bio-oil production from oil palm biomass via subcritical and supercritical hydrothermal liquefaction. J. Supercrit. Fluids 2014, 95, 407–412. [Google Scholar] [CrossRef]
- Dechapanya, W.; Khamwichit, A. Biosorption of aqueous Pb(II) by H3PO4-activated biochar prepared from palm kernel shells (PKS). Heliyon 2023, 9, e17250. [Google Scholar] [CrossRef] [PubMed]
- Baby, R.; Hussein, M.Z.; Zainal, Z.; Abdullah, A.H. Preparation of Functionalized Palm Kernel Shell Bio-adsorbent for the treatment of heavy metal-contaminated water. J. Hazard. Mater. Adv. 2023, 10, 100253. [Google Scholar] [CrossRef]
- Hazman, N.F.S.; Zaki, M.S.M.; Ideris, A. Carbon catalyst from palm kernel shell (PKS) for methane cracking: Effect of preparation. Mater. Today Proc. 2023. [Google Scholar] [CrossRef]
- Hossain, M.A.; Ganesan, P.B.; Sandaran, S.C.; Rozali, S.B.; Krishnasamy, S. Catalytic microwave pyrolysis of oil palm fiber (OPF) for the biochar production. Environ. Sci. Pollut. Res. 2017, 24, 26521–26533. [Google Scholar] [CrossRef] [PubMed]
- Onokwai, A.O.; Okokpujie, I.P.; Ajisegiri, E.S.A.; Oki, M.; Onokpite, E.; Babaremu, K.; Jen, T.-C. Optimization of Pyrolysis Operating Parameters for Biochar Production from Palm Kernel Shell Using Response Surface Methodology. Math. Model. Eng. Probl. 2023, 10, 757–766. [Google Scholar] [CrossRef]
- Siddiqui, M.T.H.; Nizamuddin, S.; Mubarak, N.M.; Shirin, K.; Aijaz, M.; Hussain, M.; Baloch, H.A. Characterization and Process Optimization of Biochar Produced Using Novel Biomass, Waste Pomegranate Peel: A Response Surface Methodology Approach. Waste Biomass Valorization 2019, 10, 521–532. [Google Scholar] [CrossRef]
- Arumugasamy, S.K.; Selvarajoo, A. Feedforward neural network modeling of biomass pyrolysis process for biochar production. Chem. Eng. Trans. 2015, 45, 1681–1686. [Google Scholar] [CrossRef]
- Khan, M.; Ullah, Z.; Mašek, O.; Naqvi, S.R.; Khan, M.N.A. Artificial neural networks for the prediction of biochar yield: A comparative study of metaheuristic algorithms. Bioresour. Technol. 2022, 355, 127215. [Google Scholar] [CrossRef]
- Tee, J.X.; Selvarajoo, A.; Arumugasamy, S.K. Prediction of carbon sequestration of biochar produced from biomass pyrolysis by artificial neural network. J. Environ. Chem. Eng. 2022, 10, 107640. [Google Scholar] [CrossRef]
- Kassim, M.A.B.M.; Kaus, N.H.M.; Imam, S.S.; Sagadevan, S.; Salaeh, S. Rapid and facile chemical synthesis of Fe3O4/biochar nanocomposite for the adsorptive removal of fluoroquinolones from aqueous solution. Inorg. Chem. Commun. 2023, 156, 111156. [Google Scholar] [CrossRef]
- Kong, S.H.; Loh, S.K.; Bachmann, R.T.; Zainal, H.; Cheong, K.Y. Palm kernel shell biochar production, characteristics and carbon sequestration potential. J. Oil Palm Res. 2019, 31, 508–520. [Google Scholar] [CrossRef]
- Giorcelli, M.; Savi, P.; Khan, A.; Tagliaferro, A. Analysis of biochar with different pyrolysis temperatures used as filler in epoxy resin composites. Biomass Bioenergy 2019, 122, 466–471. [Google Scholar] [CrossRef]
- Brassard, P.; Godbout, S.; Lévesque, V.; Palacios, J.H.; Raghavan, V.; Ahmed, A.; Hogue, R.; Jeanne, T.; Verma, M. Biochar for soil amendment. In Char and Carbon Materials Derived from Biomass; Elsevier: Amsterdam, The Netherlands, 2019; pp. 109–146. [Google Scholar]
- Adhikari, S.; Timms, W.; Mahmud, M.P. Optimising water holding capacity and hydrophobicity of biochar for soil amendment—A review. Sci. Total Environ. 2022, 851, 158043. [Google Scholar] [CrossRef] [PubMed]
- Teutscherova, N.; Houška, J.; Navas, M.; Masaguer, A.; Benito, M.; Vazquez, E. Leaching of ammonium and nitrate from Acrisol and Calcisol amended with holm oak biochar: A column study. Geoderma 2018, 323, 136–145. [Google Scholar] [CrossRef]
- Peiris, C.; Gunatilake, S.R.; Wewalwela, J.J.; Vithanage, M. Biochar for sustainable agriculture: Nutrient dynamics, soil enzymes, and crop growth. In Biochar from Biomass and Waste; Elsevier: Amsterdam, The Netherlands, 2019; pp. 211–224. [Google Scholar] [CrossRef]
Disclaimer/Publisher’s Note: The statements, opinions and data contained in all publications are solely those of the individual author(s) and contributor(s) and not of MDPI and/or the editor(s). MDPI and/or the editor(s) disclaim responsibility for any injury to people or property resulting from any ideas, methods, instructions or products referred to in the content. |
© 2025 by the authors. Licensee MDPI, Basel, Switzerland. This article is an open access article distributed under the terms and conditions of the Creative Commons Attribution (CC BY) license (https://creativecommons.org/licenses/by/4.0/).

