Article

Optimizing Fertilization Strategies to Promote Leaf-Use Ginkgo Productivity and Ecosystem Economic Benefits: An Integrated Evaluation of a Field Trial in Southern China

1
College of Forestry, Jiangxi Agricultural University, Nanchang 330045, China
2
College of Forestry & Landscape Architecture, South China Agricultural University, Guangzhou 510642, China
3
Department of Forestry and Natural Resources, Purdue University, West Lafayette, IN 47907-2061, USA
*
Authors to whom correspondence should be addressed.
Agronomy 2024, 14(9), 1956; https://doi.org/10.3390/agronomy14091956
Submission received: 15 July 2024 / Revised: 24 August 2024 / Accepted: 26 August 2024 / Published: 29 August 2024
(This article belongs to the Section Horticultural and Floricultural Crops)

Abstract

:
Field experiments were conducted on a four-year-old leaf-use ginkgo plantation in southern China to assess the impact of nine different fertilization strategies with varying N-P2O5-K2O rates at three growth phases (FBD: March for bud development; FLG: May for leaf growth; FLS: July for leaf strengthening) on leaf-use ginkgo (Ginkgo biloba L.) leaf productivity and ecological economic benefits (EEBs). The results indicated that regardless of timing and rate, fertilizer application led to an increase in leaf area and thickness, resulting in higher ginkgo leaf yield. The highest fresh (215.14 g tree−1) and dry (78.83 g tree−1) yields were observed with 3 g N + 2.5 g P2O5 + 1.5 g K2O tree−1 in FLG. FLS was found to mitigate the decline in SPAD values of leaves during late summer. Furthermore, fertilized ginkgo trees exhibited higher flavonoid concentrations in leaves, enhancing profitability. However, higher fertilizer rates were associated with elevated greenhouse gas emissions, nitrogen losses and ecological costs. Despite these drawbacks, all fertilization treatments resulted in increased net economic income. Specifically, compared to no fertilization, FBD, FLG and FLS treatments boosted net income by 3.5~26.6%, 11.6~60.5% and 5.8~35.4%, respectively. Using the entropy weight TOPSIS method, it was concluded that optimizing the N, P and K fertilization rate and timing (applying 3–2.5–1.5 g tree−1 of N-P2O5-K2O in May) is a beneficial approach to maximize EEBs and industrial benefits in leaf-use ginkgo plantations in southern China. This study provides valuable insights into suitable fertilization patterns and management for leaf-use ginkgo plantations in southern China.

1. Introduction

Ginkgo (Ginkgo biloba L.) is a valuable woody medicinal plant [1,2] with two industrial uses, namely, seed/nut products and leaf extracts. The main medicinal components of ginkgo leaves, flavonoids such as quercetin, kaempferol and isorhamnetin, have been reported to have functions such as capturing free radicals, inhibiting platelet activating factors, promoting blood circulation and brain metabolism, and playing important roles in the treatment of various cardiovascular and cerebrovascular diseases [3]. Currently, ginkgo leaf-derived products have gained widespread use in the medical and healthcare sectors [4].
To meet the growing demand for ginkgo products, many countries and regions have made ginkgo cultivation an important agricultural and forestry industry [5]. China has more than 90% of the world’s ginkgo resources, and has planted over 200,000 hectares of commercial plantations to address the increased demand of ginkgo products [6]. South China has a hot and humid climate, with sufficient sunlight, making it a very promising area for leaf-use ginkgo planting [1,7,8]. However, previous studies have found that high-temperature stress [9,10] and soil fertility constraints [11] led to a low yield of ginkgo flavonoid content [1,12]. Therefore, there is a growing need to establish ginkgo-management techniques that can enhance the flavonoid yield in leaf-use ginkgo plantations dedicated to leaf use.
Fertilization is a crucial strategy for enhancing the medicinal components of medicinal plants [13,14,15]. Researchers have applied N, P, K and sometimes Mg/Se as a single nutrient or in different dosage combinations, and observed improvement in ginkgo leaf biomass and flavonoid yield with fertilization [16,17,18]. However, excessive fertilization often occurs in China’s forestry-production system, which hinders the formation of essential biochemical components and negatively affects the nutritional status of plant growth, ultimately leading to a decrease in product yield, quality and the income of farmers [19]. For example, an excessive N supply can interfere with the growth of ginkgo and the formation of flavonoids in later stages [18]. Excessive use of P decreases the contents of substances related to the synthesis of flavonoids, such as glutamine, indole acrylic acid and para coumaric acid [20]. In addition, over fertilization can lead to leaching into nearby ecosystems, resulting in severe environmental issues like eutrophication of water bodies and increased greenhouse gas emissions [21,22]. However, previous research on fertilization in leaf-use ginkgo plantations has focused mainly on yield and profitability, and few studies have incorporated environmental benefits into specific fertilization-management strategies [18]. Therefore, there is an urgent need to identify a viable fertilization method for leaf-use ginkgo plantations to balance sustainable forestry development, farmers’ economic benefits and environmental risks control.
According to the growing season and soil moisture requirements, there are usually four fertilization methods for leaf-use ginkgo plantations: fertilizer for bud development, fertilizer for leaf growth, fertilizer for leaf strengthening and nutritional fertilizer [23]. These fertilization practices are tied to phenological changes. February to April each year is the budding period of ginkgo leaves, and branches grow along their length [18]. April to June is the peak period for the growth of leaf-use ginkgo leaves and is also an important time for the accumulation of flavonoids [23]. The two months before picking ginkgo leaves (June and July) is the recovery period of the flavonoid concentration. After leaf picking (September and October), it is necessary to use nutritional fertilizers to ensure the balance of soil nutrients in leaf-use ginkgo plantations [23]. However, due to limitations in labor and/or cost management, only a few ginkgo plantations use continuous fertilization during the various stages of ginkgo leaf growth, and one-time fertilization remains the most common management measure in current ginkgo plantations. The success of fertilization is contingent upon plants effectively absorbing nutrients from the soil, assimilating them and redistributing them to their intended organs. Throughout the entire crop growth period, synchronizing fertilizer supply with crop demand is conducive to crop growth and the accumulation of secondary metabolites [24,25,26]. According to Paolo et al. [26], fertilization can affect the availability of resources throughout the crop growth cycle, leading to adjustments in most yield components and maintaining their plasticity. As short-lived organs, leaves are highly susceptible to environmental changes and can be easily influenced by fertilization [27], exhibiting significant differences due to different fertilization times [28]. Therefore, another issue that needs to be considered is the coupling between fertilization timing and yield maximization. However, most previous studies have focused on improving ginkgo leaf yield and flavonoid concentration by considering the effects of different fertilizer rates. Few studies have considered combining fertilizer levels and timing to achieve regulation of ginkgo leaf flavonoid yield.
To ensure yield maximization, stakeholders and policymakers must develop adaptive strategies that simultaneously consider factors such as leaf quality, economic benefits and environmental impact. Fertilization levels and timing may be important in this regard. To provide more information on this issue, in this study, we conducted a one-year field-fertilization experiment in leaf-use ginkgo plantations in Nanxiong City, Guangdong Province, China. Our specific goals were to (1) determine how and to what extent different fertilization systems (fertilization dosage, ratio and fertilization timing) affect the agronomic parameters (yield and quality) of ginkgo leaves, environment (N loss and greenhouse gas emissions) and ecosystem economic benefits (considering environmental and human health costs), and (2) establish a comprehensive evaluation system using the approximate ideal solution method (TOPSIS) and develop the best fertilization strategy for leaf ginkgo production. This study is expected to help develop fertilization guidelines that balance the leaf growth, flavonoid yield, profitability and ecosystem economic benefits.

2. Materials and Methods

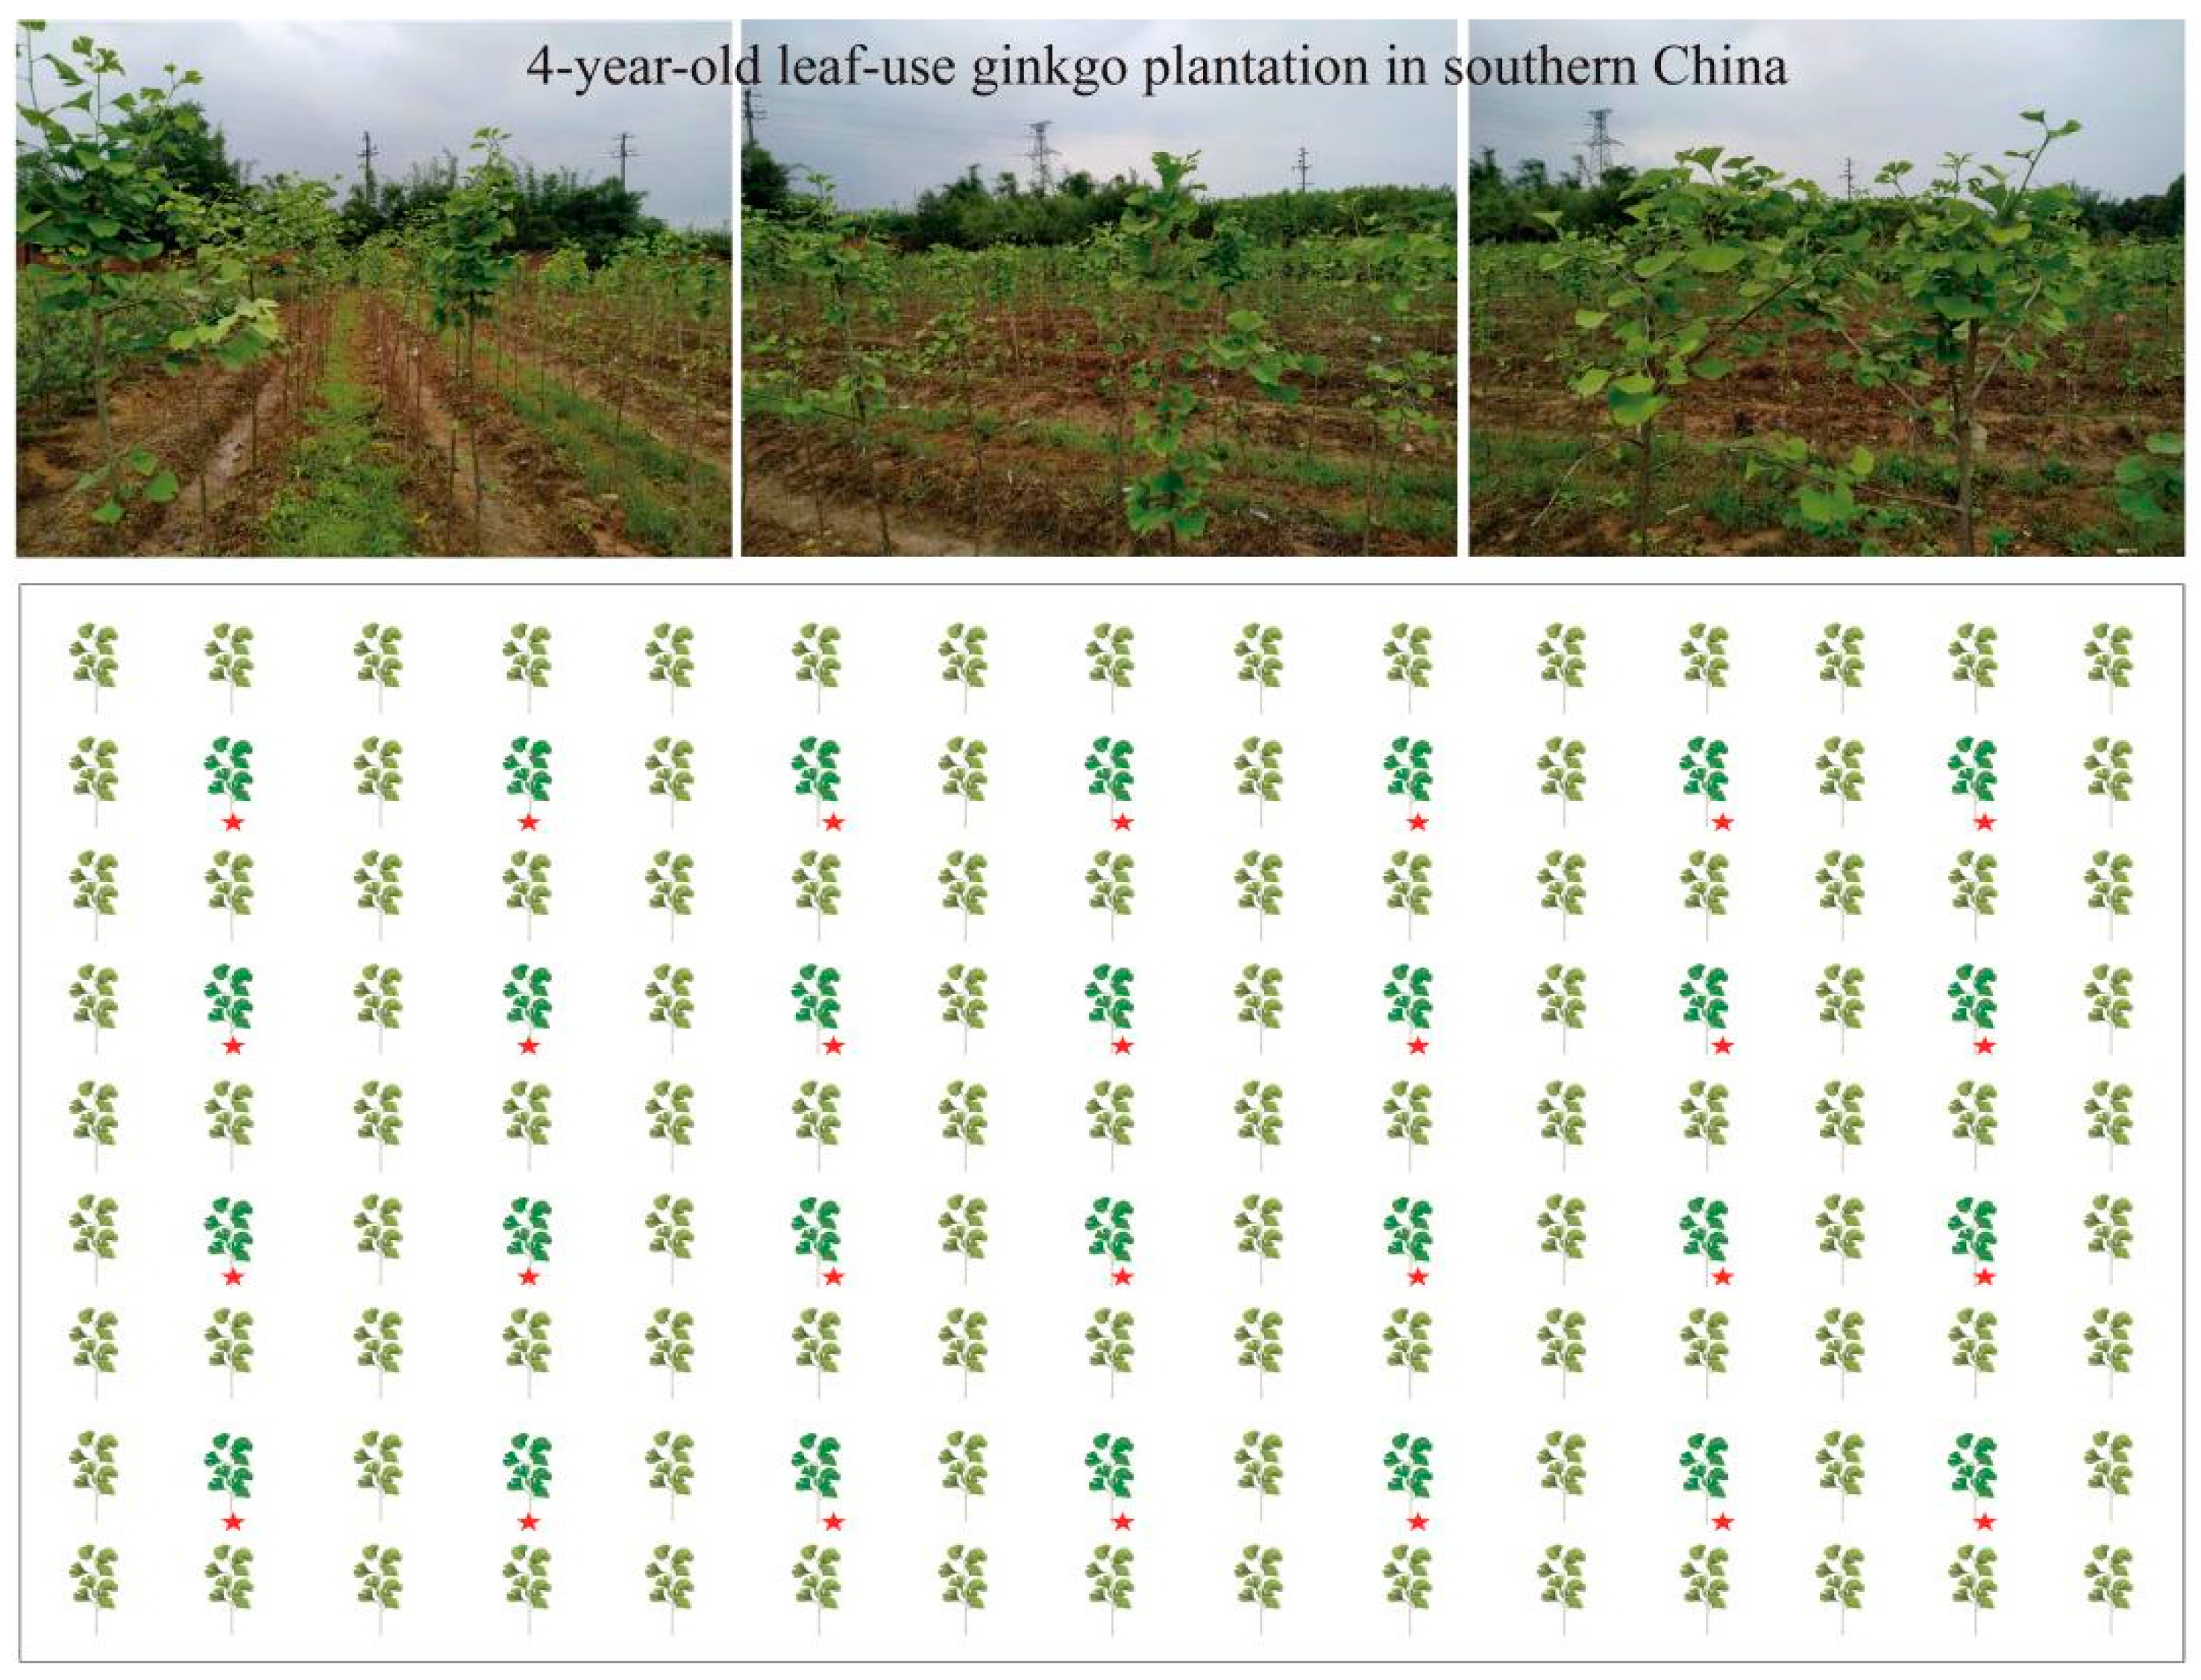
2.1. Study Site Description

The field experiments were conducted in 2019 in leaf-use ginkgo plantations in the nursery of the Forestry Science Research Institute (25°9′15″ N,114°19′44″ E) in Nanxiong City, Guangdong Province. Nanxiong has a subtropical oceanic monsoon climate with an annual temperature of 24.6 °C (Table S1) during the research period, and an annual precipitation of 1447.8 mm. According to the International Union of Soil Sciences (lUSS) Working Group World Reference Base for Soil Resources, the soil is acidic and classified as Oxisols. The soil pH is 5.49 ± 0.26, organic matter content is 24.80 ± 2.57 g kg−1 and total nitrogen, phosphorus and potassium contents are 1.24 ± 0.20 g kg−1, 0.31 ± 0.03 g kg−1 and 22.82 ± 1.75 g kg−1, respectively. The leaf-use ginkgo trees are four years old, with an average plant height of 1.50 m and an average ground diameter of 14.00 mm. The trees were planted at a row spacing of 1.5 m × 1.5 m.

2.2. Experimental Materials

Three types of fertilizers were used in this study: urea (46% N), superphosphate (12% P2O5) and potassium chloride (60% K2O), all of which were purchased from local markets.

2.3. Experimental Design and Field Management

According to local planting practices, three different fertilization times were set in March (bud development fertilizer, named FBD), May (leaf growth fertilizer, named FLG) and July (leaf strengthening fertilizer, named FLS), with 9 different fertilizer ratios set for each fertilization time (Table 1). Subsequently, 5 repeated experimental blocks were established in the aforementioned deciduous leaf-use ginkgo plantation (as shown in Figure 1). In each experimental blocks, 27 different N-P2O5-K2O fertilization (9 treatments for 3 fertilization time) ratios treatments were randomly assigned, with no fertilization as the control (CK). In this way, there were 5 effective survey trees for each treatment. To avoid the impact of other fertilization treatments on each experimental tree, buffer trees were set around each experimental tree, resulting in 135 trees in each block and an effective number of experimental plants of 28 (trees marked with red pentagram in Figure 1).The experimental trees were randomly chosen for FBD, FLG and FLS fertilization, and CK. Independent fertilization trials of FBD, FLG and FLS were conducted on 26 March, 26 May and 26 June 2019, respectively. The fertilization method was to apply fertilizer in a concentric circle with a radius of 20 cm around the trunk of the ginkgo tree and covered with soil. During the experiment, routine management, regular weeding and pest management were performed on the leaf-use ginkgo plantation.

2.4. Methods for Sample Collection and Indicator Determination

On 18 May, 1 June, 1 July, 1 August and 1 September 2019, a Chlorophyll Meter (Konica Minolta Inc., Tokyo, Japan, model 502Plus), was used to measure SPAD values. On 1 September 2019, the leaves of all experimental leaf-use ginkgo trees were harvested, and fifteen leaves were randomly selected from each tree for leaf area and thickness measurement. The leaf area was measured with the CI-203 Leaf Area Meter produced by CID Inc., Camas, WA, USA, and the thickness was determined using a Vernier caliper. Subsequently, all leaves were washed three times with deionized water, then naturally dried for 1–2 h and weighed to determine fresh weight. The leaves were then placed in an oven at 105 ℃ for 30 min and dried to constant weight at 75 °C, crushed and sieved (0.25 mm) for later analysis.
The flavonoid extraction from leaves was analyzed according to Wu et al. [18]. Quercetin, kaempferol and isorhamnetin were analyzed using a high-performance liquid chromatography system (Agilent Technologies 1260 Infinity II, Santa Clara, CA, USA) and equipped with a 5TC-18 column with a model size of 250 mm × 4.6 mm and 5 µm. According to the Chinese Pharmacopoeia Committee [29], the total flavonoid content of ginkgo leaves is 2.51 times the sum of quercetin, kaempferol and isorhamnetin content. The flavonoid yield per tree of ginkgo was determined by the product of flavonoid content and dry weight yield of leaves per tree in this study.

2.5. Estimation of Environmental Risks Caused by Fertilization

According to Tang et al. [19] and Zhang et al. [30], the environmental risks caused by fertilization were mainly due to greenhouse gas emissions (GHG), which were divided into four parts: direct N2O emissions caused by N fertilizer application (ED N2O), indirect N2O emissions caused by N fertilizer application (EI N2O), N fertilizer production (EP) and transportation (ET) and emissions caused by P and K fertilizer production and transportation (others). The calculation formula is as follows:
Total GHG emissions (kg CO2 eq ha−1) = N2Ototal-N × 44/28 × 298 + (EP + ET) + Others
N2Ototal-N = ED N2O + EI N2O
ED N2O = Nrate × 2.72%
EI N2O = Nrate × (12.9% × 1% + 9.8% × 0.75%)
EP + ET = (8.21 + 0.09) × Nrate
Others = P2O5rate × (0.73 + 0.06) + K2Orate × (0.5 + 0.05)
In the formula, 44/28 is the coefficient for converting N to N2O. The global warming potential over a 100-year horizon of N2O is 298 times that of CO2 on a mass basis [31]. The direct emission coefficient for nitrogen application is 2.72%. The nitrogen loss coefficients for ammonia nitrogen (NH3-N) and the indirect emission factor for NH3 volatilization are 12.9% and 1%, respectively. In contrast, the nitrogen loss factor and the indirect emission factor for leaching runoff of nitrate nitrogen (NO3-N) are 9.8% and 0.75%, respectively [30]. The variable Nrate represents the amount of nitrogen applied, with emission factors for nitrogen production and transportation being 8.21 and 0.09, respectively [30]. Emissions from the manufacturing and transportation of phosphorus pentoxide (P2O5) are 0.73 and 0.06, while the emission factors for potassium oxide (K2O) production and transportation are 0.5 and 0.05, respectively [19].

2.6. Estimation of Profitability Derived from Fertilization

In this study, we focused on both the economic benefits of fertilization for growers and the ecosystem economic benefits. Referring to the method of Zhang et al. (2021) [32], the following equations were used for the calculation:
BY = (Y − Y0) × Wprice
EEB = BY − Fcost − Lcost − Ecost − Hcost
Ecost = CGHG + Ceu + Cacid = (CO2 × 0.0204) + (1.12 × NO3-N + 0.24 × NH3-N + 0.0018 × N) + (1.87 × NH3-N + 0.021 × N)
Hcost = (0.30 × N2Ototal-N + 0.20 × NO3-N + 3.30 × NH3-N)
Here, BY represents the private profitability of ginkgo leaves derived from fertilization. Y and Y0 represent the yield of ginkgo leaves under fertilization and no fertilization treatments, respectively. Wprice represents the local market price of ginkgo leaves (3.74 $ kg−1 (dry weight) on average). Fcost and Lcost are fertilizer and labor costs related to fertilization, respectively. In this study, urea, superphosphate and potassium chloride were 0.40 $ kg−1, 0.47 $ kg−1 and 0.37 $ kg−1 (local market price), respectively. The labor cost for one-time fertilization was 86.64 $ ha−1. EEB represents the economic ecosystem benefits. Ecost represents the cost of ecosystem damage, consisting of three parts: the cost of GHG emissions damage (CGHG), the cost of water eutrophication damage (Ceu) and the cost of soil acidification damage (Cacid). The market price of GHG (CO2) is 0.0204 $ kg−1. The cost of treating eutrophication caused by NO3-N and NH3-N was 1.12 and 0.24 $ kg−1, respectively, and the cost of treating soil acidification damage caused by NH3-N was 1.87 $ kg−1. The cost of eutrophication and soil acidification damage per kilogram of N fertilizer production were calculated to be 0.0018 and 0.021 $ kg−1, respectively. The human health costs (Hcost) caused by various Nr losses during N fertilizer application were also considered. Specifically, the human health costs of N2Ototal-N, NO3-N and NH3-N were found to be 0.30, 0.20 and 3.30 $ kg−1, respectively [32].

2.7. Comprehensive Evaluation with TOPSIS Model

Referring to the method of Qu et al. [33], the TOPSIS integrated analysis method was used to comprehensively evaluate the suitability of the fertilization treatment for ginkgo (refer to Table S2 for the representative meanings of each indicator). First, Equations (11) and (12) were used to normalize the minimum or maximum values of data representing multiple indicators, such as leaf quality, flavonoid yield, environmental risk and profitability in ginkgo leaf samples, which were used for normalization processing to obtain a standardized decision matrix using the vector normalization method. Subsequently, Equations (13)–(15) were used to calculate the entropy weights of the evaluation indicators, and the normalized decision matrix is multiplied by the weights of the evaluation indicators to obtain a weighted decision matrix. The normalized decision matrix was multiplied by the weights of the evaluation indicators and Equation (16) was used to obtain the weighted decision matrix. Using Equations (17) and (18), based on the optimal vector Z+ and the worst vector Z of the weighted decision matrix, the optimal and worst solutions were obtained. According to Equations (19) and (20), the distances D+ and D were calculated from the ideal value to the negative ideal value for each scheme and the queuing indicator value Ci was calculated (i.e., comprehensive evaluation index) for each production area according to Equation (21). Finally, we determined a comprehensive suitability ranking of under different fertilization conditions. The closer the value of Ci is to 1, the better the comprehensive evaluation of the fertilization.
x ij * = x i j min   ( x j ) max   ( x j ) min   ( x j )
x ij * = max   ( x j ) x i j max   ( x j ) min   ( x j )
H j = 1 ln   m ( j = 1 n f i j   l n   f i j )
f ij = 1 + x i j n i = 0 n 1 + x i j n
ω j = 1 H j m j = 1 m H j ( 0 ω j 1 , j = 1 m ω j = 1 )
Z = ( ω j · x ij * ) m × n
Z j + = max   ( Z 1   j ,   Z 2   j ,   Z n   j )
Z j = min   ( Z 1   j ,   Z 2   j ,   Z n   j )
D i + = j = 1 m ω j ( Z i j Z j + ) 2
D i = j = 1 m ω j ( Z i j Z j ) 2
C i = D j D j + + D j × 100 %

2.8. Statistical Analysis

Microsoft Excel (Office2016. Microsoft Corp, Redmond, WA, USA) was used for data recording, calculation of objective weight and TOPSIS evaluation. The analysis of variance (ANOVA) of the data were conducted in SPSS 23.0 (SPSS, IBM, Chicago, IL, USA) for Windows. Specifically, through one-way ANOVA and Duncan’s multiple comparisons, the differences in fresh weight, dry weight, leaf area, leaf thickness, flavonoid content in leaves and flavonoid yield per tree of ginkgo in different fertilization treatments were analyzed. When p < 0.05, the differences were considered significant. Origin 22.0 software (OriginLab Corporation, Northampton, MA, USA) was used to create graphics.

3. Results

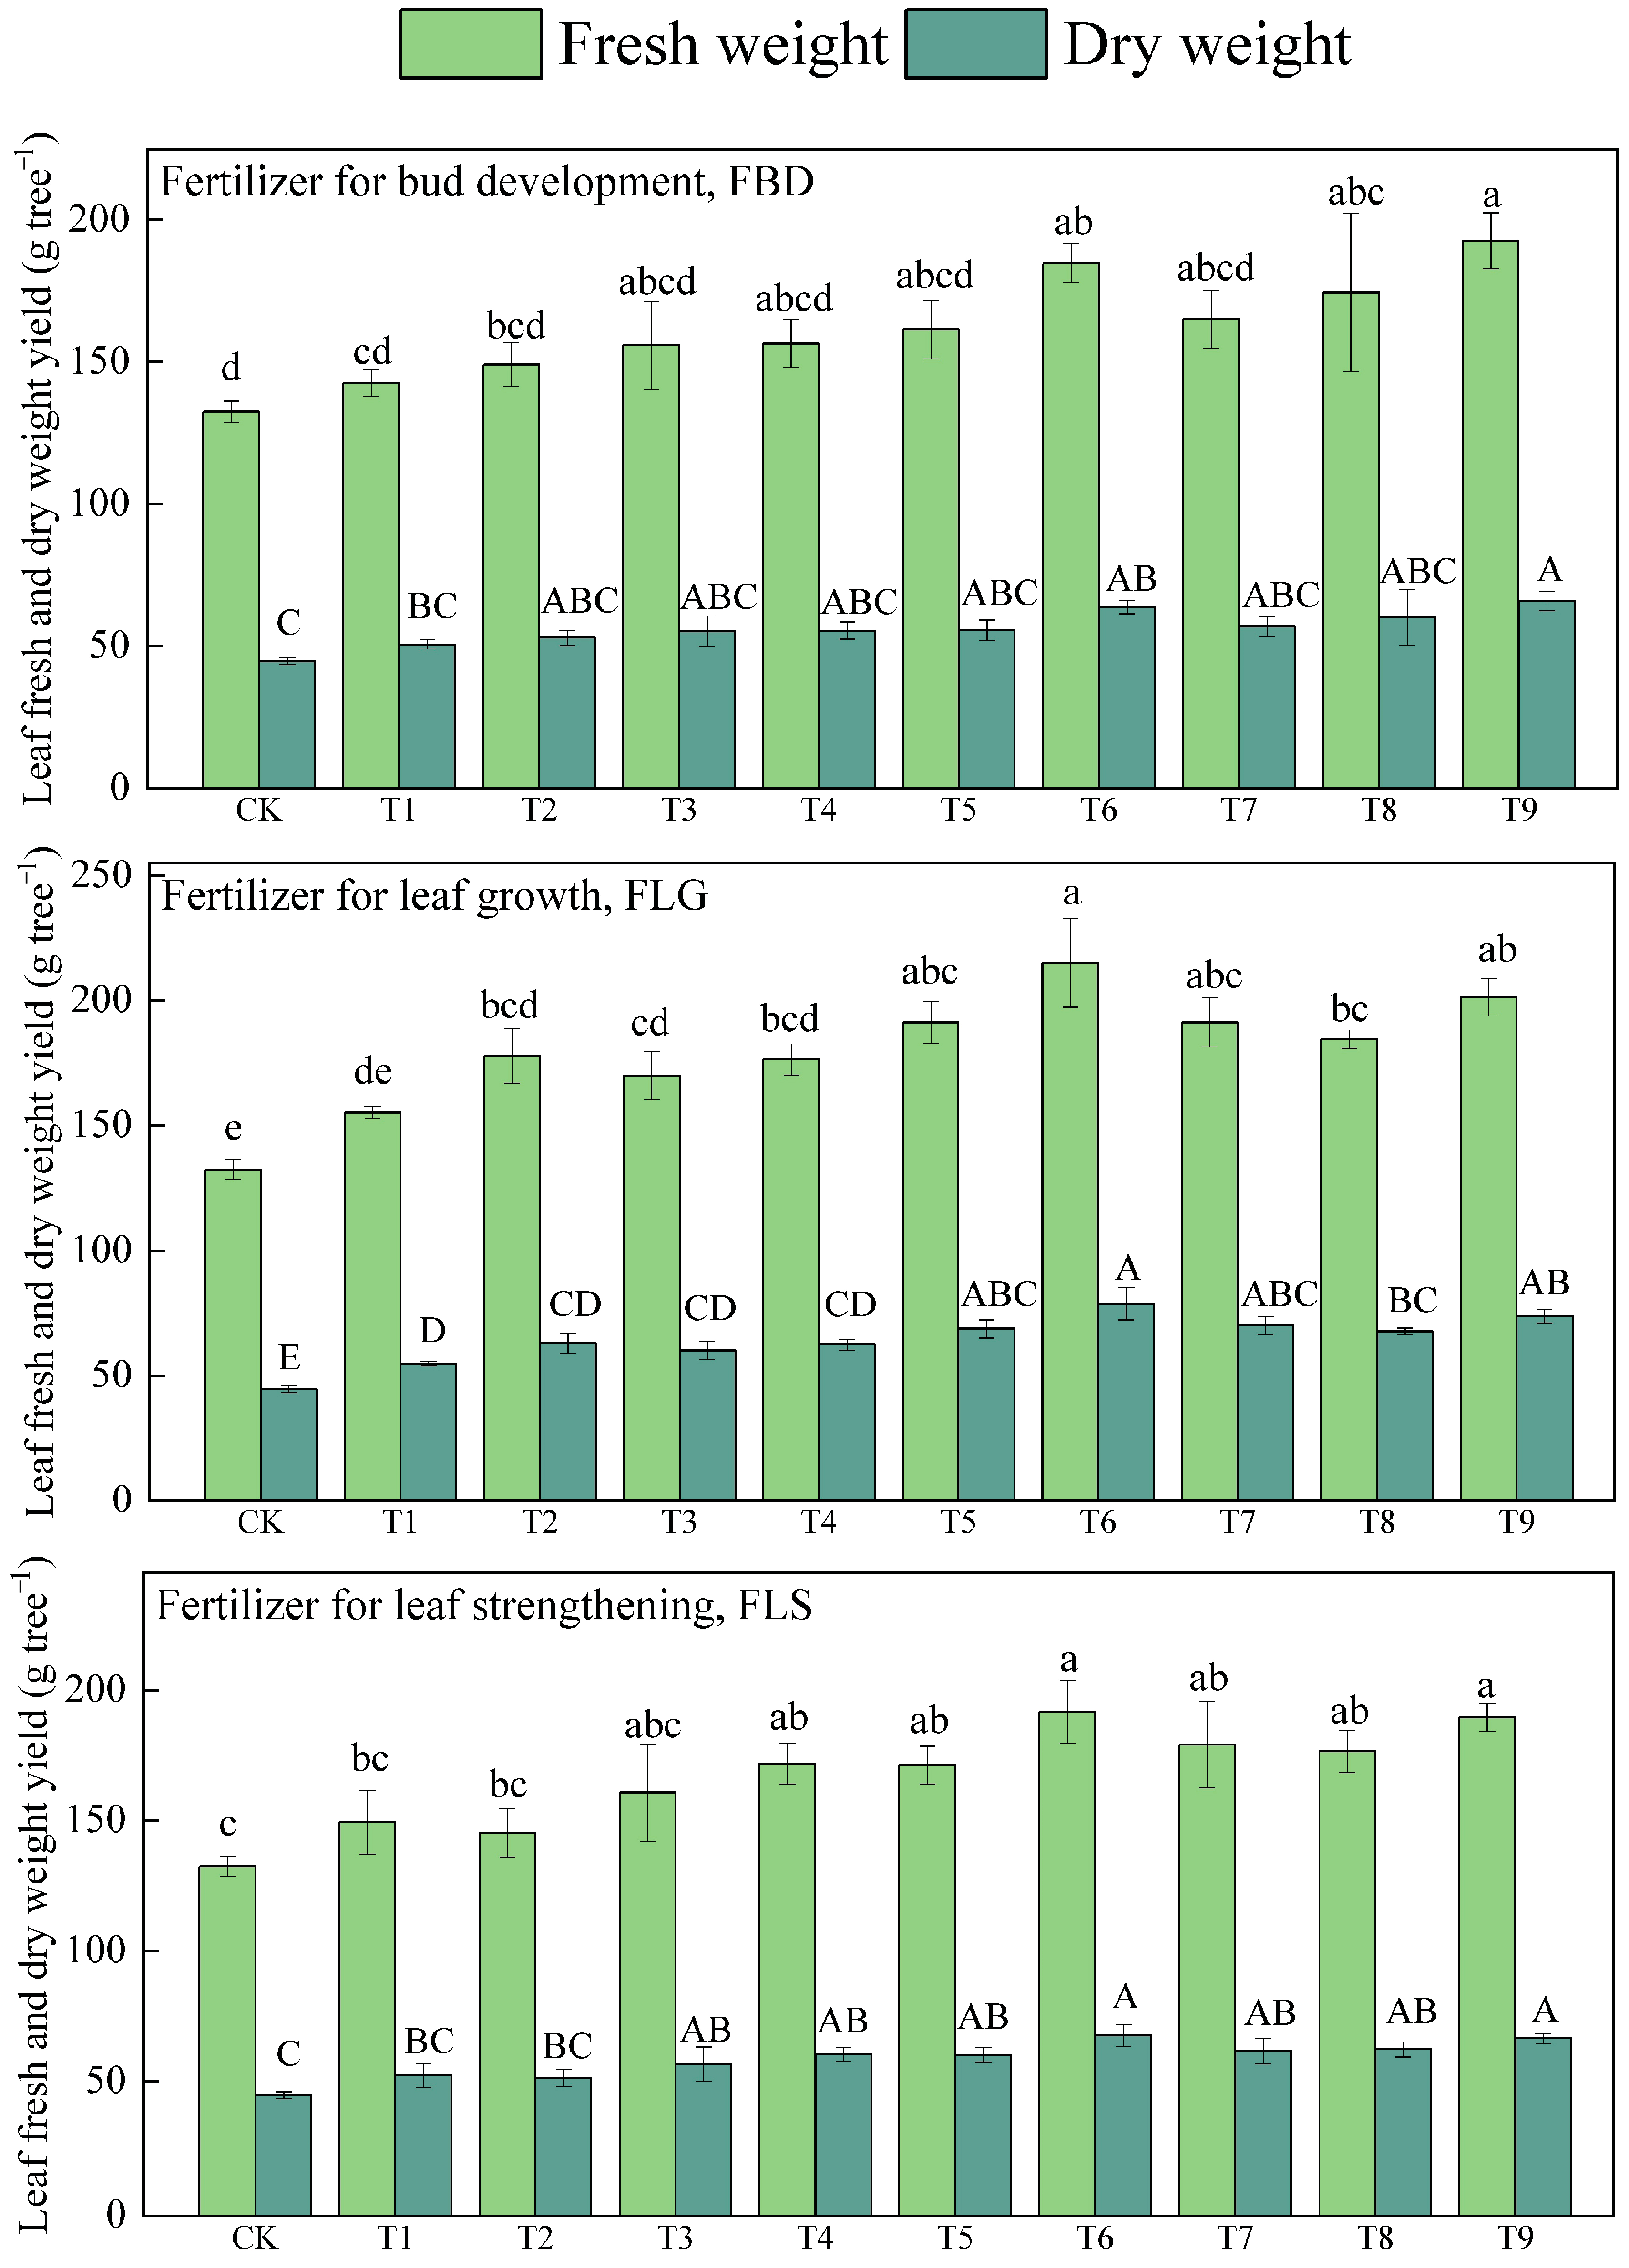
3.1. Leaf-Use Ginkgo Leaves Yield

Among the FBD treatments, T6, T8 and T9 significantly increased the fresh weight of ginkgo leaves, and T6 and T9 increased dry weight of leaves, as compared to CK (Figure 2). However, all the treatments of FLG except T1 significantly increased the fresh weight of leaves and all increased the dry weight, with T6 resulting in the biggest increment. Among the FLS treatments, T4-T9 significantly increased fresh weight of leaves and T3-T9 significantly increased dry weight. There was no significant difference compared to different fertilization periods. The highest fresh (215.14 g tree−1) and dry yield (78.83 g tree−1) were observed with T6 in FLG.

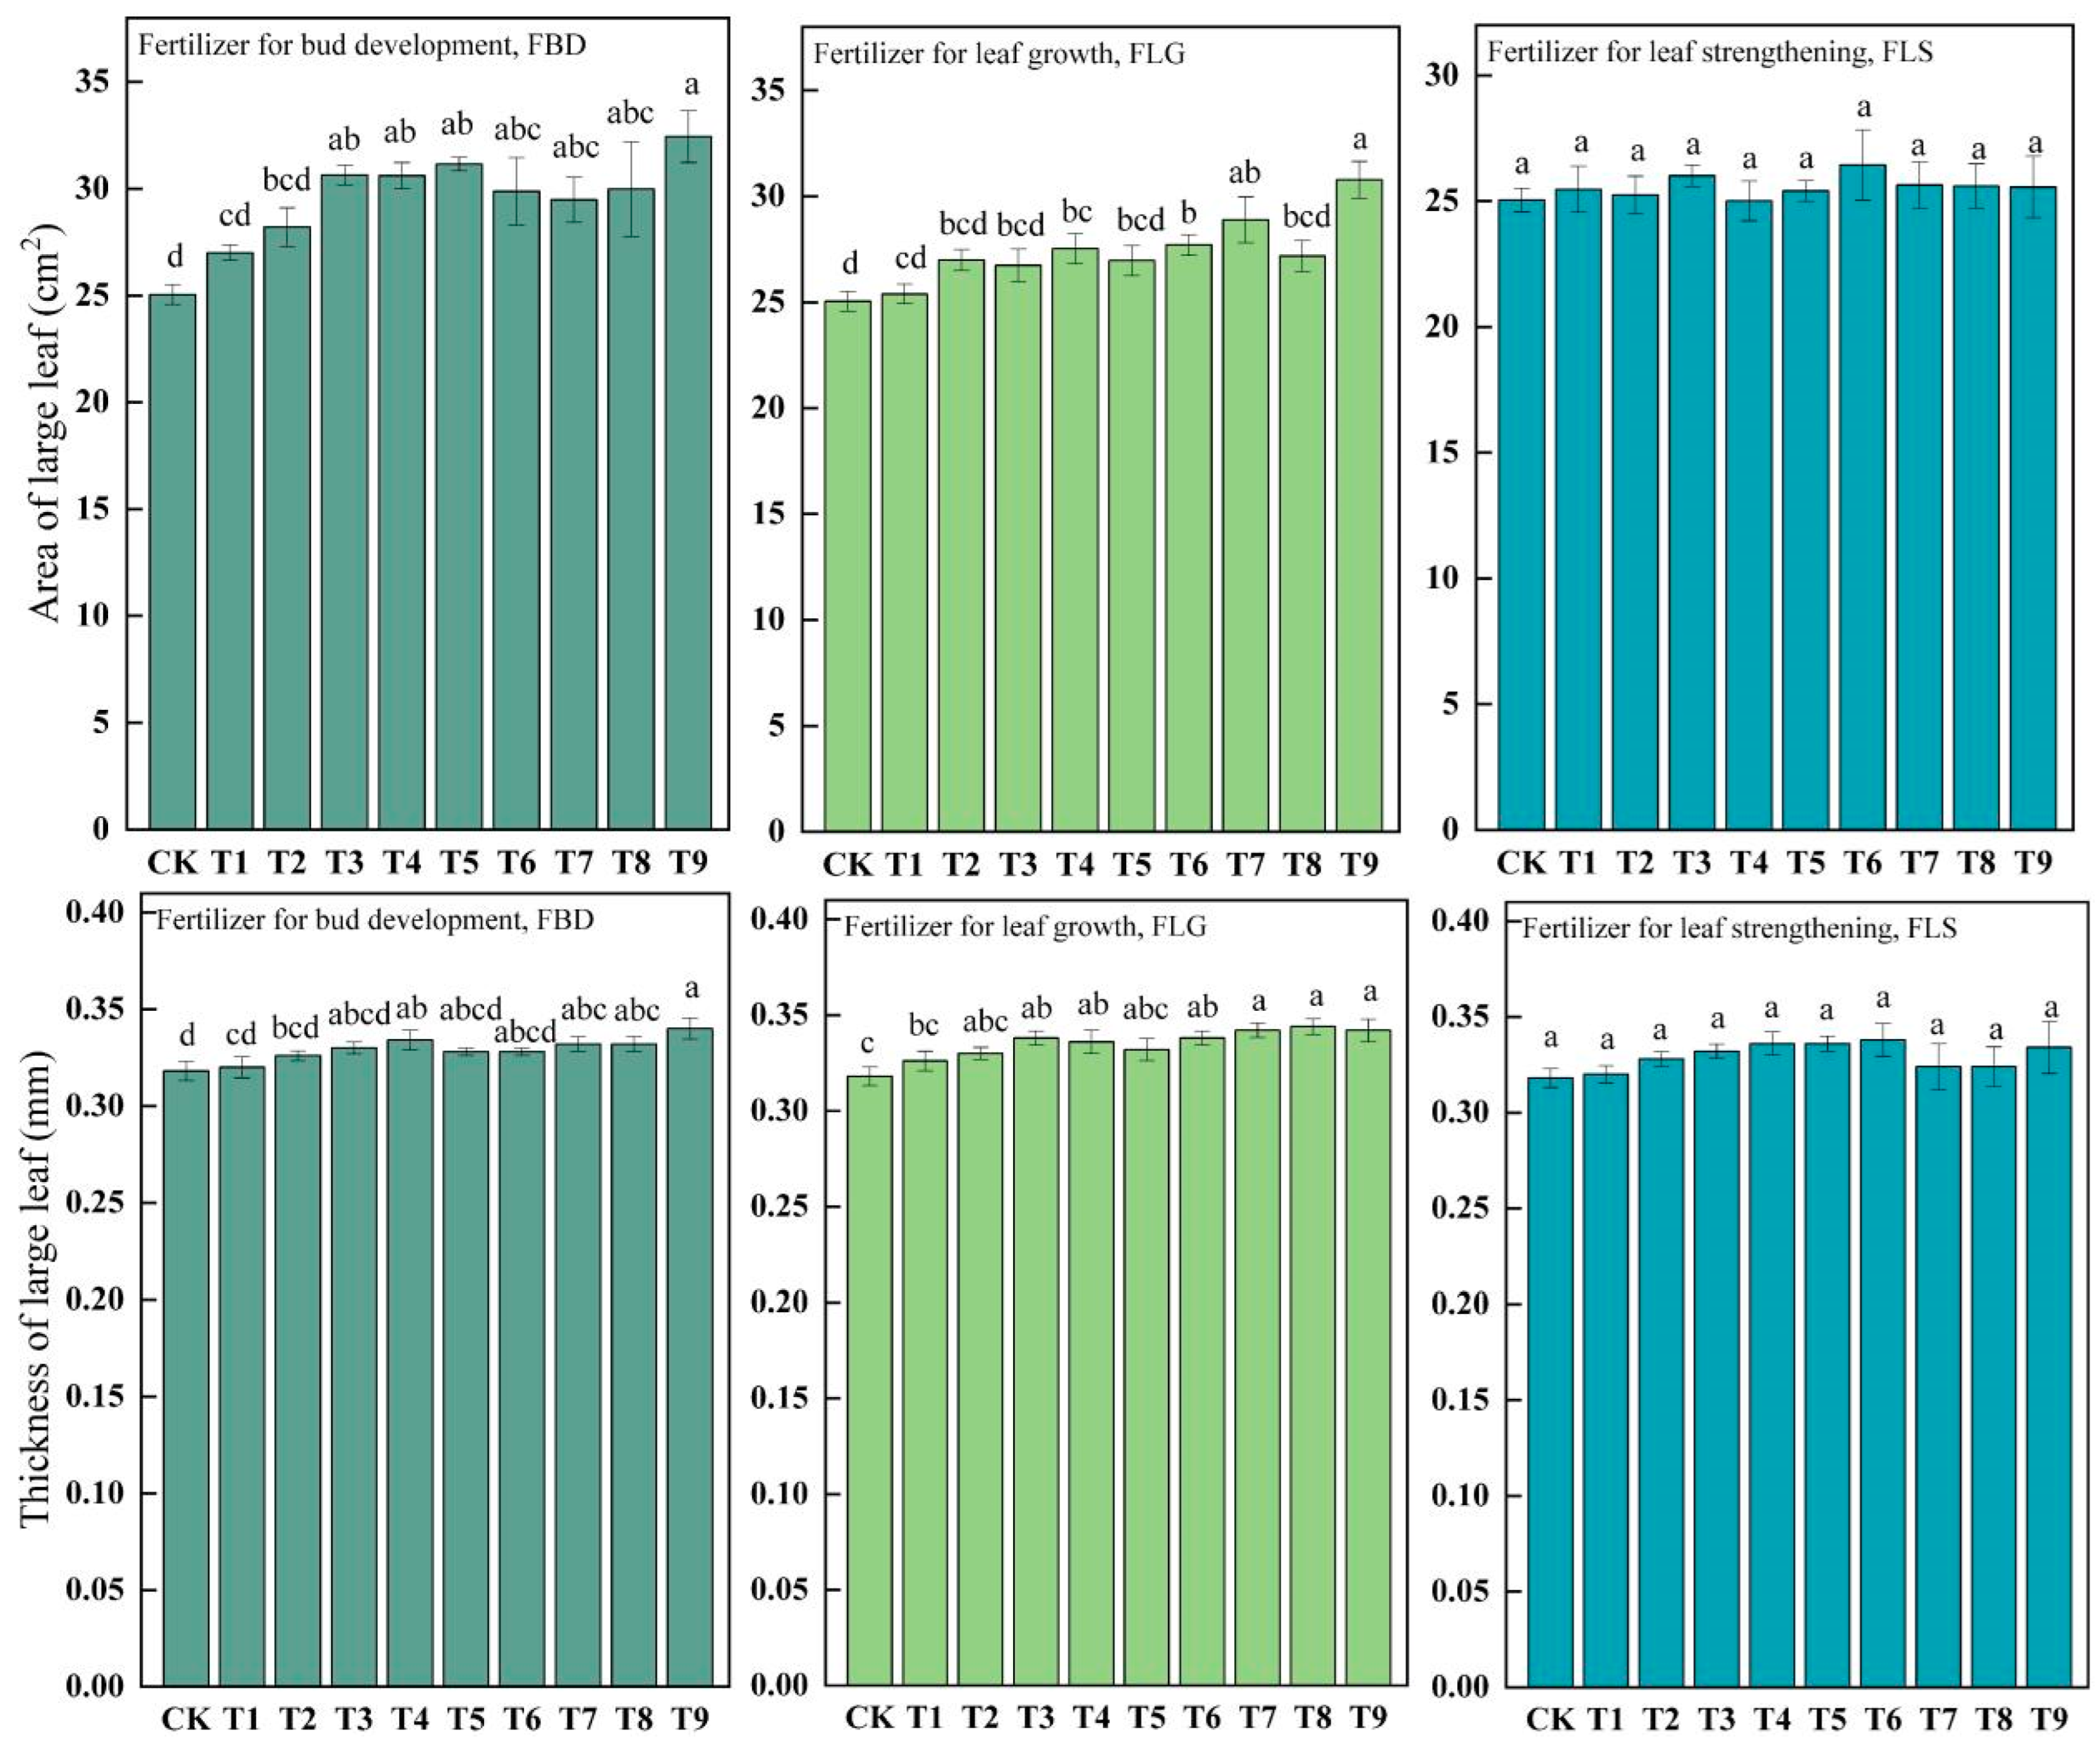
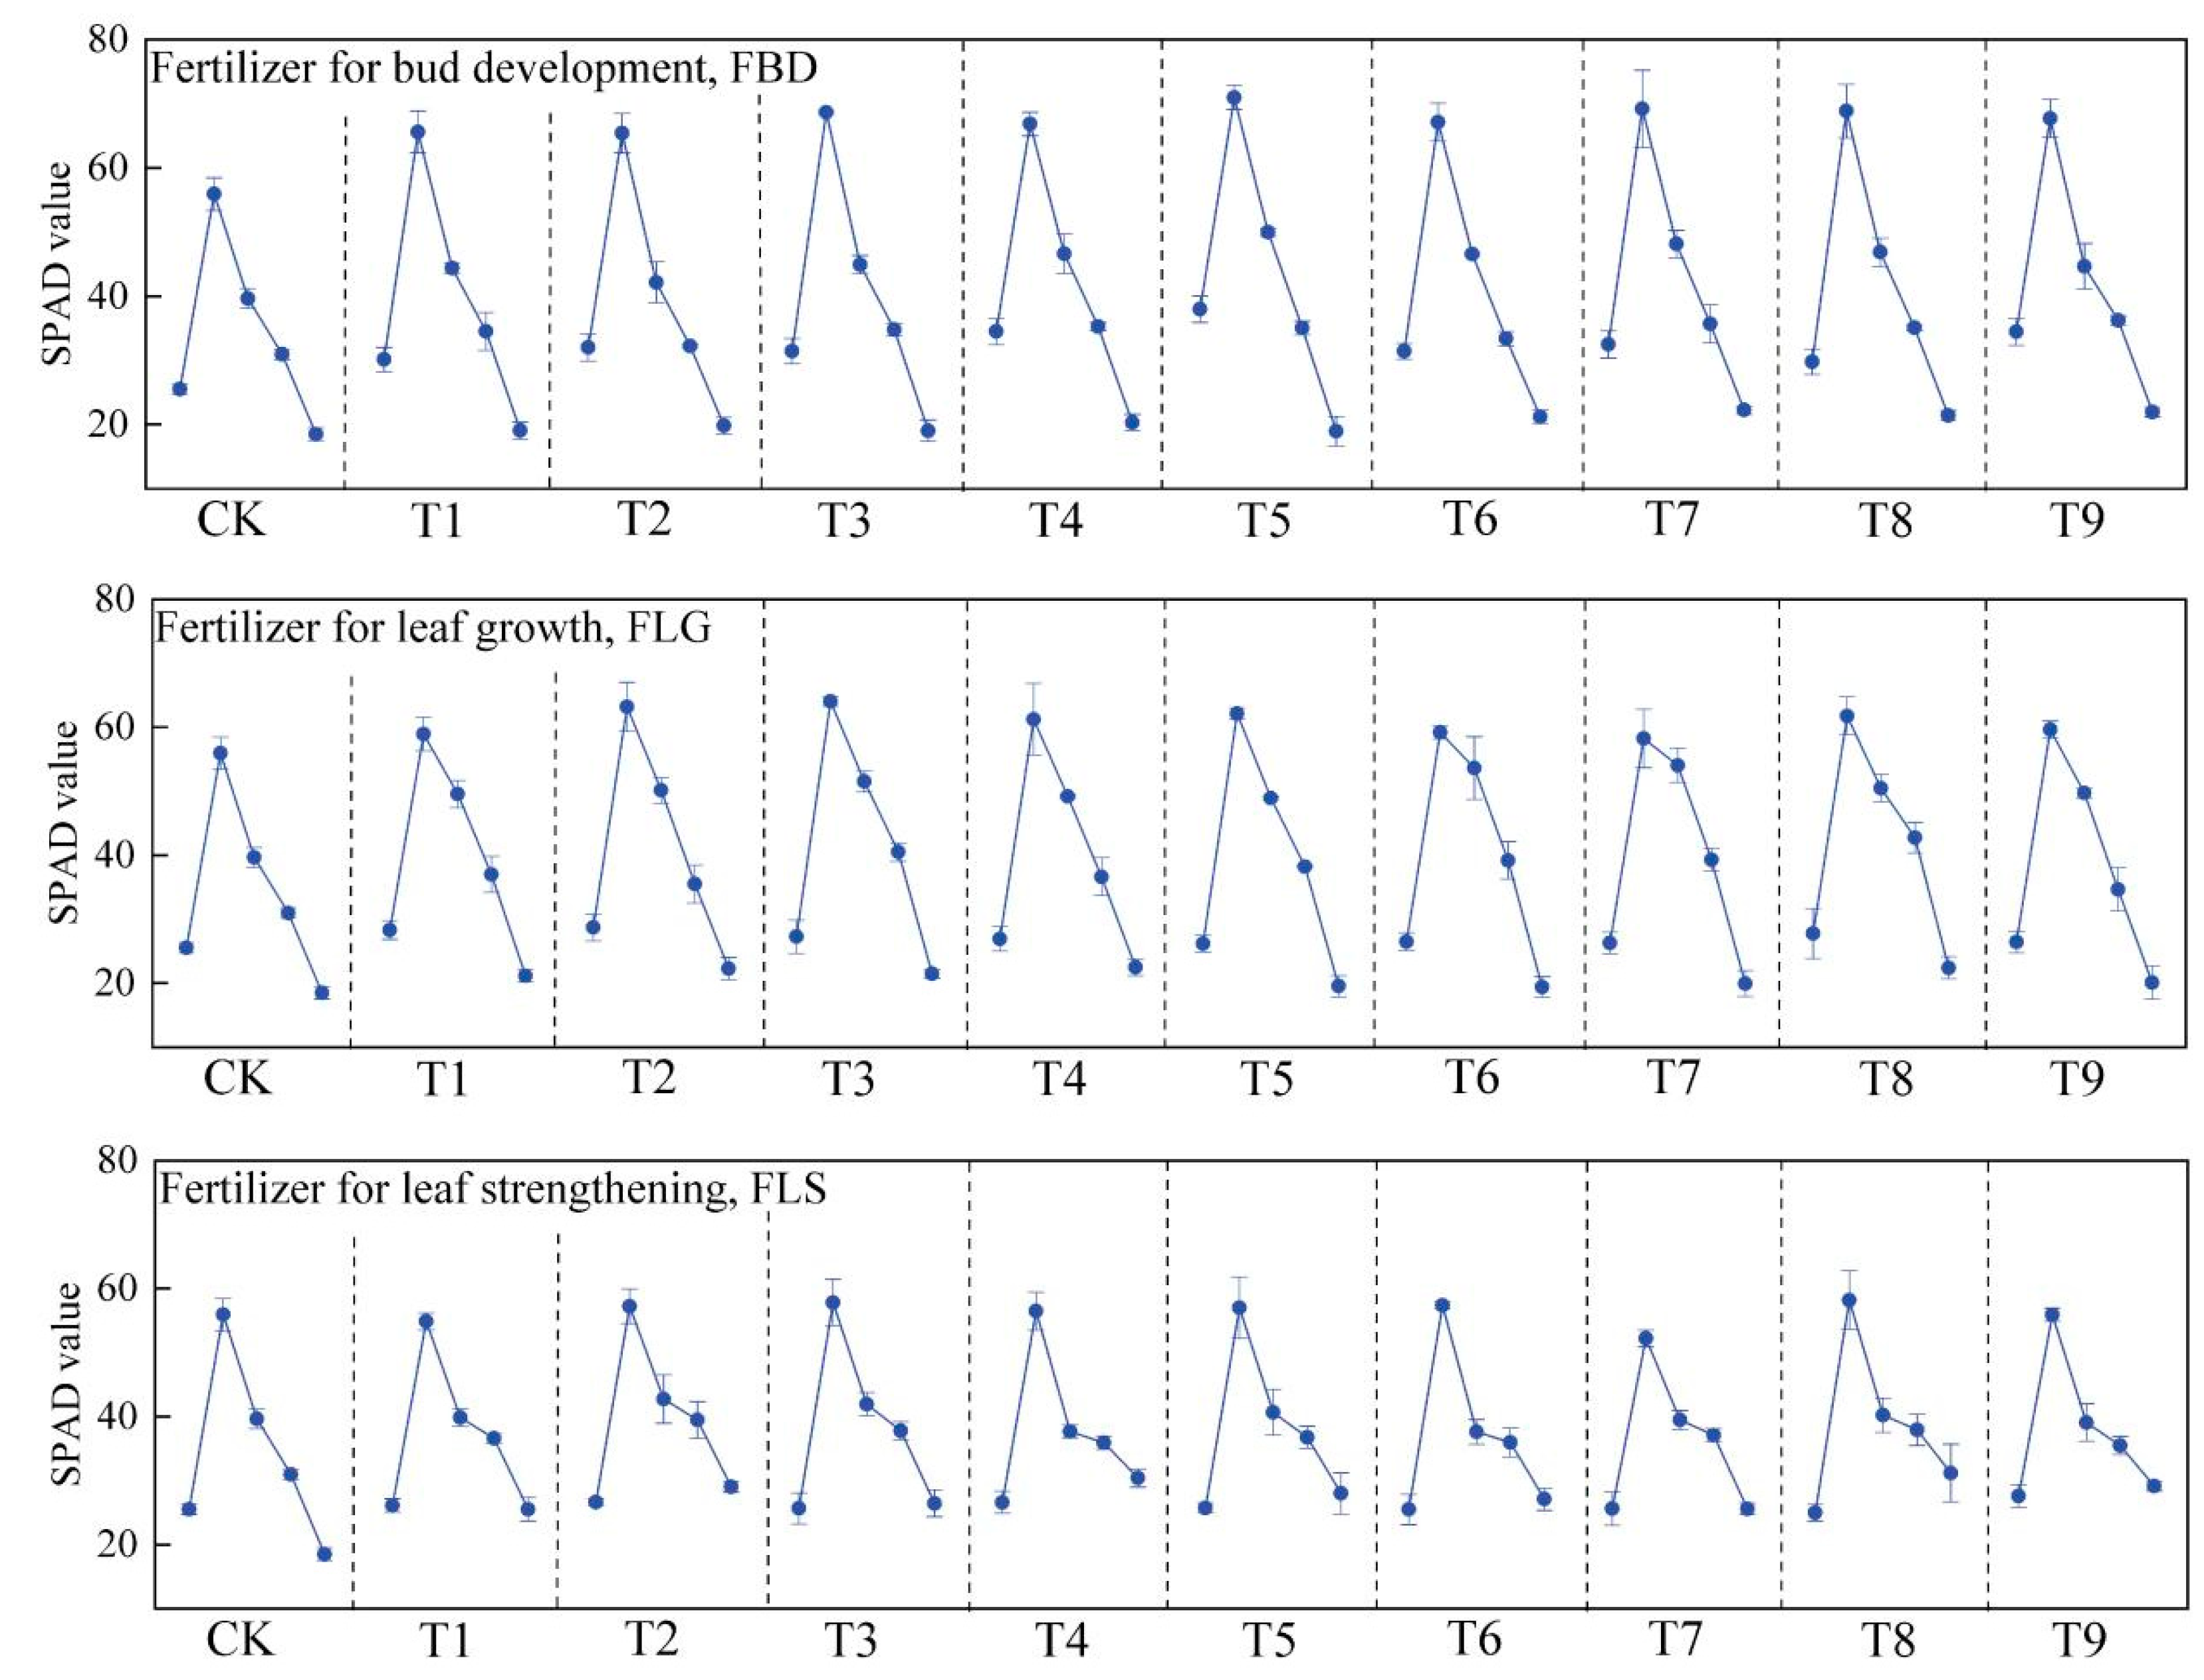
3.2. Main Characteristics of Leaf-Use Ginkgo Leaves

All FBD treatments (except T1 and T2) significantly increased leaf area, and T4, T7, T8 and T9 significantly increased leaf thickness, with T9 producing the biggest increment in both area and thickness. Among FLG treatments, T4, T6, T7 and T9 had a significant increase in leaf area. T4, T7–T9 in FBG treatments and T3–T4 and T6–T9 in FLG treatments significantly increased leaf thickness. However, the application of FLS had no significant effects on leaf area or thickness (Figure 3). Within two months after fertilizer application, the SPAD of ginkgo leaves receiving fertilization treatment was significantly higher than that of CK (Table S3). According to visual observations during harvest, ginkgo treated with FLS also had higher SPAD values during the harvest period, which was not particularly evident in ginkgo leaves treated with FBD and FLG (Figure 4). In addition, it was observed that the fertilization treatment promoted the absorption of N, P, K, Ca and Mg in leaves (Table S4).

3.3. Effects of Fertilization on Flavonoid Content and Yield

The scaffold structures of flavonoids in ginkgo leaf include kaempferol, quercetin and isorhamnetin. Compared with CK, fertilization increased the content of quercetin, kaempferol, isorhamnetin and total flavonoid contents in leaf-use ginkgo leaves (Table 2). Among all the treatments, T3 in the FBD group, T1–T5 and T7 in the FLG group, and T1 and T4 in the FLS group produced significantly higher total flavonoid contents than CK. Among them, the total flavonoid in the leaves of T2 in the FLG group was more than mg g−1 (8.07 ± 0.46 mg g−1).
All the FLG and FLS fertilization treatments resulted in significantly higher flavonoid yield than CK. The highest flavonoid yield was also found in T6 in the FLG group (524.08 ± 42.02 mg tree−1), 2.20 times of CK (238.09 ± 30.34 mg tree−1). The FBF treatments also increased flavonoid yield, with the increments in T2-T4, T6, T7 and T9 being statistically significant.

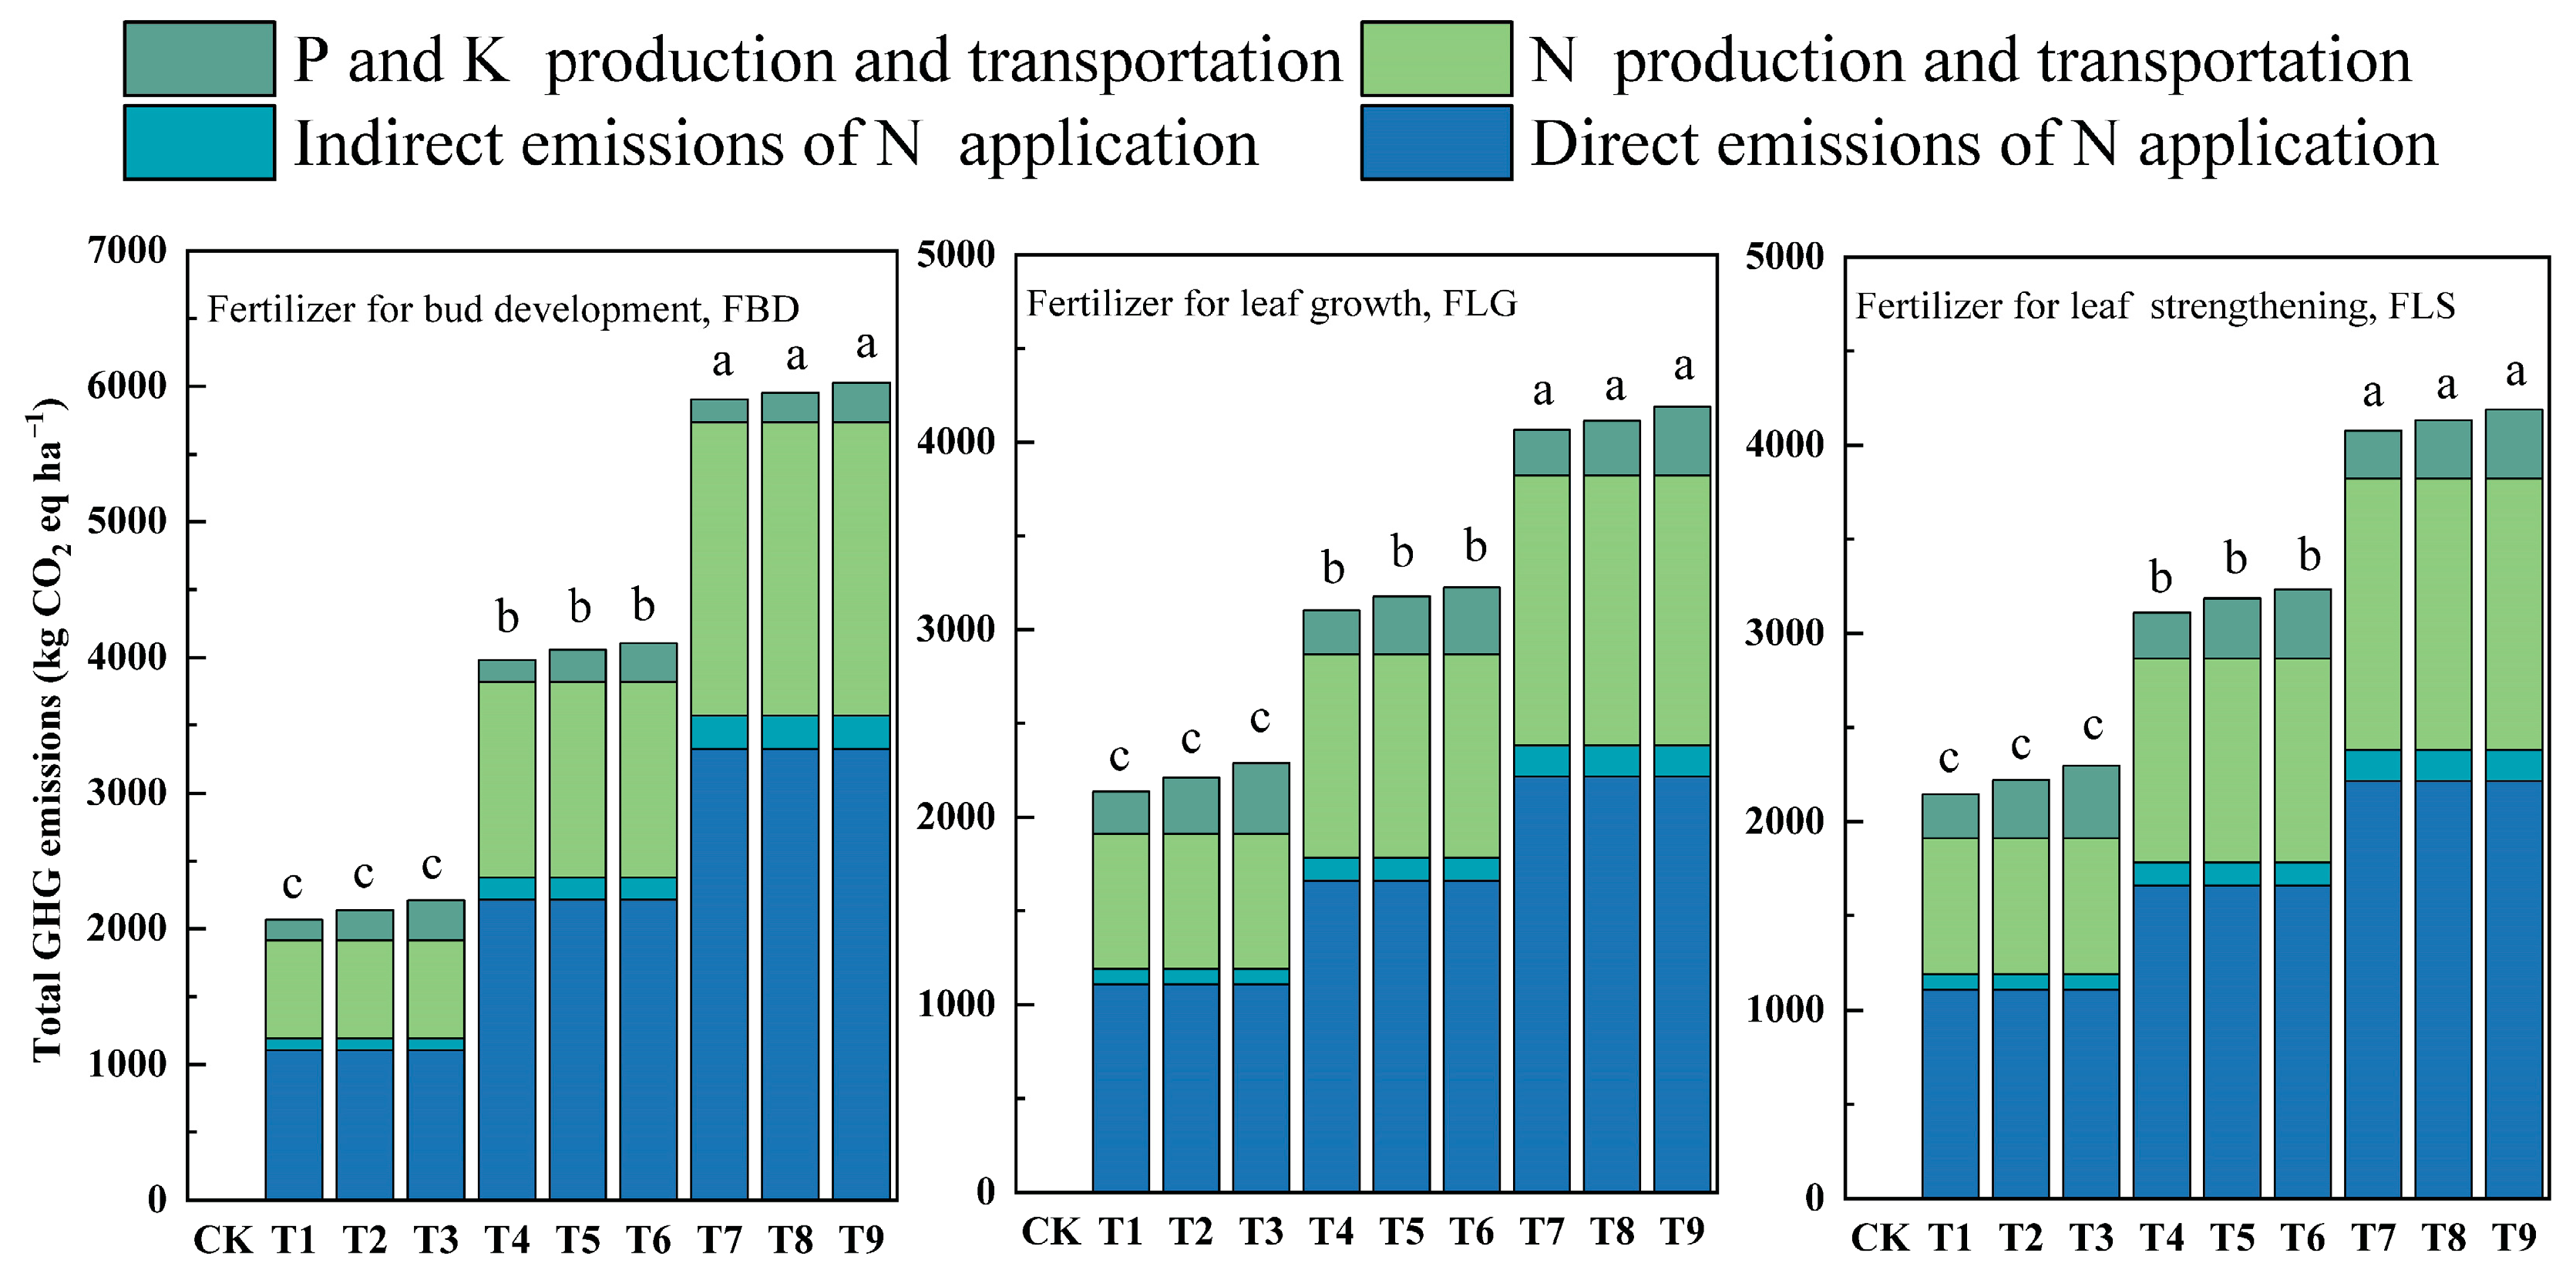
3.4. Analysis of Environmental Risks and Economic Benefits of Fertilization

The GHG during the life cycle was mainly caused by N fertilization, which tends to increase with increasing N fertilization rate. Therefore, regardless of fertilization timing, the T7–T9 treatments of FBD, FLG and FLS groups released significantly higher greenhouse gases (Figure 5) and resulted in more ecological and health costs (Table 3) than other treatments. However, in terms of the total income and EEB, fertilization was found to be profitable regardless of fertilization level and timing, with T6 in FLG group bringing the highest EEB (2014.55 $ ha−1).

3.5. Suitability Ranking of Fertilization Treatments Based on Game Theory Weighting and TOPSIS

An integrated evaluation system was established for the six sub-factor indicators (Table S5) that characterized the comprehensive growth of leaf-use ginkgo leaves. The entropy weight method was used to weigh and analyze individual indicators. The weights of each indicator were calculated and the target weights were obtained (Table S5). Table 4 shows the comprehensive scores for the different treatments. The scores of the FLG treatments were higher than their respective counterparts in the FBG and FLS groups. The results indicated that T6 in the FLG group was the best fertilization strategy for leaf-use ginkgo trees.

4. Discussion

4.1. Effects of Different Fertilization Conditions on Leaf Growth of Leaf-Use Ginkgo

Field experiments can help to develop a relatively accurate relationship between target yield and fertilization, which may be used for prescribing effective fertilization strategies. In our study, leaf-use ginkgo subjected to fertilization exhibited many enhanced developmental characteristics related to leaf yield, including significant increases in leaf size, thickness and weight, as well as delayed senescence, which increased leaf biomass. Wu et al. [18] reported a significant increase in leaf-use ginkgo leaf yield by combining fertilizers with other organic fertilizers or low-dose mineral fertilizers. Although most FBD treatments showed an increased leaf yield in our study, the difference was not significant. However, an appropriate amount of FLG resulted in a significant increase in leaf yield, indicating that ginkgo leaf yield was jointly affected by fertilization rate and timing (Figure 2). Effects of fertilization levels and timing on stem biomass, leaf number and branch length, as well as fruit characteristics of other plants, such as apples [34], Chinese fir [28], peaches [35], Pinus radiata [36] and cotton [37] have been reported. Generally, fertilization affects plant physiology by enhancing leaf photosynthesis, promoting nutrient absorption and stimulating cell division, thereby improving yield and quality. However, the level and proportion of fertilization determines the balance of organic matter input and nutrient elements in the soil, which is why most studies have reported that leaf yield is affected by fertilization levels. The effectiveness of fertilizers as a nutrient source is also influenced by the timing of nutrient release and the plant’s nutrient requirements [38]. Seasonal differences in fertilizer effectiveness are common and these effects are related to seasonal changes in the allocation of fertilizers and other resources to different organs [28]. For example, in spring fertilization, if organic matter is not fully decomposed and cannot be absorbed by the root system, it often leads to the secondary growth of new shoots in the later stage of growth, which limits the yield of leaves or fruits [37]. Thus, control of apical dominance is recommended to increase plant yield [39,40]. Another reason that FBD did not significantly increase leaf yield in this study is that fertilization leads to a large loss of fertilizer when other vegetation grows most vigorously [41]. In this study, spring was the maximum growth period for weeds and other vegetation types in the study area, which may consume most of the fertilizer.
In this experiment, fertilization in March and May increased leaf area, while fertilization in July did not. A reasonable explanation for this phenomenon was that if sudden changes in environmental conditions and consequent changes in resource availability occur late enough, certain features of plants can no longer be proportionally adjusted [26]. For leaf-use ginkgo trees, spring and early summer are the most active periods for nutrient growth and consumption [18], while autumn reduces the consumption of nutrients and does not require high doses of fertilizers. However, based on visual observations during harvest, ginkgo leaves that received FLS remained green and vigorous for a longer period (with higher SPAD values), which was not particularly evident in ginkgo leaves that received FBG and FLG (Figure 4). This result enabled us to infer that if the harvest period needs to be extended for certain operational or technical reasons, the application of FLS seems to be able to appropriately delay the harvest period of ginkgo leaves.

4.2. Concentration and Accumulation of Flavonoids in Ginkgo Leaves under Different Fertilization Schemes

Nutrient supply to plants is a significant factor in their secondary metabolism [42]. Previous studies have reported that fertilization significantly improves the flavonoid content of ginkgo leaves by inducing the upregulation of genes involved in flavonoid biosynthesis, including PAL, FMO, C3′H and IGS [1,43]. The results of this study showed that the mixed application of N-P2O5-K2O significantly stimulated the bioaccumulation of flavonoids in ginkgo leaves, which was most evident in the FLG treatments. In contrast, although the application of FBD and FLS increased the concentration of flavonoids, the increments were not statistically significant. This discovery once again confirms that synchronizing fertilizer application with crop demand is conducive to the accumulation of secondary metabolites [26]. Previous reports have shown that secondary metabolism is coordinated with the growth of ginkgo, exhibiting seasonal differences [44]. Summer is an important period for the accumulation and recovery of flavonoids in ginkgo leaves, and synchronization of fertilizer supply and crop demand leads to a general increase in flavonoid accumulation in ginkgo leaves [18].
Forestry management focuses on maximizing crop yield in commercial markets. For leaf-use ginkgo, the flavonoid yield is generated by the development and growth of two yield components: ginkgo leaf yield and flavonoid concentration. Previous studies have explored techniques to increase both leaf productivity and flavonoid content simultaneously, with the goal of increasing ginkgo flavonoid yield [18]. However, few studies have identified a successful strategy, with most studies reporting a negative correlation between high leaf productivity and flavonoid content [17]. In the current study, we observed a “dilution effect” in most treatments, where leaf-use ginkgo leaves had a higher dry weight but lower flavonoid content. However, we found that in T1–T5 and T8 of the FLG group and T4 of the FLS group, fertilization not only resulted in higher flavonoid accumulation but also greater biomass. This phenomenon has been considered an evolutionary adaptation in other studies, allowing plants to respond to changes in external resource availability while maintaining stable leaf weight [18]. This indicates that an effective combination of fertilization level and timing can simultaneously achieve a dual increase in leaf-use ginkgo leaf productivity and flavonoid content, which may serve as a starting point for future regulation of leaf-use ginkgo leaf flavonoid yield.

4.3. Environmental Risks and Economic Benefits Derived from Different Fertilization Regimes

Although this study found that higher leaf-use ginkgo leaf yields were achieved through fertilization, a cost–benefit analysis was conducted to determine the optimal ratio and dosage of fertilizers. This information should allow farmers to determine whether surplus can compensate for fertilization cost. Additionally, with the improvement in human environmental awareness, the economic benefits of ecosystems have also been suggested to be included in specific fertilization-management strategies [19]. Our study found that, although certain treatments led to an increase in leaf yield and total income, treatments with higher fertilizer doses resulted in higher greenhouse gas emissions and N losses, which also resulted in higher fertilizer and social costs. Leaf-use ginkgo, as a typical leaf-based crop, requires sufficient nutrition to meet the requirements of leaf growth and metabolic product synthesis [18]. However, our results suggest that the current use of fertilizers, especially N, by farmers may far exceed the demand for ginkgo leaves, leading to an increase in greenhouse gas emissions.
Regardless of fertilization time, one-time fertilization achieved higher economic income (all treatments’ EEBs were greater than 0). As China continues to rapidly urbanize, the availability of agricultural labor is expected to decrease, leading to increased labor costs [45]. Fortunately, the price of fertilizers is expected to decrease in the future due to advancements in production technologies [46]. Thus, adjusting the fertilizer level to balance labor and fertilizer costs will bring greater profitability to producers. In this study, T6 in the FLG treatments exhibited good profitability and the highest EEB, which means that combining fertilization timing with the optimal fertilization rate provides a potential win–win strategy for growers and public health.

4.4. Suitable Fertilization-Management Strategies for Leaf-Use Ginkgo Plantations

We attempted to identify a field-fertilization-management strategy suitable for the cultivation of ginkgo in southern China through a comprehensive analysis. However, to effectively evaluate the growth and economic benefits of ginkgo under different fertilization treatments, relying solely on a single evaluation index is insufficient. A comprehensive evaluation system should be employed to assess the integrated growth status of leaf-use ginkgo [33]. In this regard, the TOPSIS comprehensive evaluation method using integrated entropy weight coefficients considers the comprehensive strategies of all “4R” components and demonstrates comprehensive advantages in agronomy, the environment and ecosystem economic performance, thus providing a useful framework for promoting sustainable fertilization management. In our study, the TOPSIS evaluation results showed that T6 in FLG group was the most suitable fertilization strategy for leaf-use ginkgo trees, followed by T9 and T7 in FLG group. This means that if ginkgo is cultivated in southern China, the optimal fertilization scheme is 3–2.5–1.5 g tree−1 (N-P2O5-K2O) in May for 4-year trees. This result provides more choices of fertilization time and levels for farmers in the region who are unable to fertilize at optimal timeframes in spring, which can help improve yield and economic returns for farmers who may be constrained by labor.
Fertilization recommendations based on both yield response and agronomic efficiency must be dynamic. This requires a quantitative understanding of the consistency between nutrient supply and crop demand to optimize spatial and temporal management [47]. From this perspective, owing to differences in biophysics and socioeconomic factors, the application of these fertilization strategies in different regions needs to be modified according to local conditions. In addition, in other studies, phased application of fertilizers solved the problem of time asynchrony between fertilizer application and plant absorption. This method fully applies fertilizers to each nutrient growth stage [48]; however, the labor cost of the phased fertilization should be considered. As our field trials are confined to a complete growth cycle of leaf–use ginkgo leaves, additional case studies should be conducted to thoroughly assess conditions at specific locations and enhance the applicability of optimal fertilization rates in ginkgo plantations across various regions.

5. Conclusions

In this field experiment, suitable N, P2O5 and K2O fertilization levels and timing were determined using three application methods, which can provide scientific references for further fertilization management in leaf-use ginkgo plantations. Fertilization improved leaf yield and quality, including increasing leaf area, increasing leaf biomass through thickness and regulating leaf nutrient content. The application of FLS slowed a decrease in leaf SPAD values and delayed the yellowing and senescence of ginkgo leaves. In addition, fertilization can increase the concentration and yield of flavonoids and improve the economic benefits of farmers. Through TOPSIS analysis, we recommend applying 3–2.5–1.5 g tree−1 (N-P2O5-K2O) in May as the appropriate fertilization formula for leaf-use ginkgo plantations in southern China. This study provides some important information on the utilization and management aspects of fertilization application rate and timing in leaf-use ginkgo plantations in similar areas. Further research should prioritize studying the long-term effects of fertilization on soil characteristics, including microbial, nutrient and enzyme levels, in leaf-use ginkgo plantations. Additionally, it is important to consider the environmental risks associated with monitoring GHG emissions, NH3 destruction, nitrate leaching and runoff when developing fertilization-management strategies to establish more scientifically sound fertilization plans.

Supplementary Materials

The following supporting information can be downloaded at: https://www.mdpi.com/article/10.3390/agronomy14091956/s1, Table S1. Changed of temperatures in each month in Nanxiaong in 2019; Table S2. The representative meanings of each indicator of TOPSIS; Table S3. Effects of fertilization on SPAD; Table S4. Effects of fertilization on nutrient elements content; Table S5. Sub-factor indicators and weigh.

Author Contributions

M.X.: Conceptualization, Methodology, Data curation, Writing—Original draft. S.C. and F.Z.: Data curation, Writing—original draft. L.X. and J.L.: Data curation, Visualization. D.L., J.O. and M.L.: Investigation, Data curation. D.F.J. and D.H.: Writing—Review and Editing. S.Z.: Conceptualization, Methodology, Project administration, Writing—Review and Editing. All authors have read and agreed to the published version of the manuscript.

Funding

This work was financially supported by Forestry Science and Technology Innovation Project of Guangdong Province (2022KJCX015) and National Natural Science Foundation of China (Grant Nos. 42007335, 31971629), Natural Science Foundation of Guangdong Province (2021A1515012157).

Data Availability Statement

Raw data will be available upon request.

Conflicts of Interest

The authors declare that they have no known competing financial interests or personal relationships that could have appeared to influence the work reported in this paper.

References

  1. Guo, Y.; Wang, M.; Gao, C.; Fu, F.; El-Kassaby, Y.A.; Wang, T.; Wang, G. Spatial prediction and delineation of Ginkgo biloba production areas under current and future climatic conditions. Ind. Crop. Prod. 2021, 166, 113444. [Google Scholar] [CrossRef]
  2. Wang, G.; Zhang, L.; Wang, G.; Cao, F. Growth and flavonol accumulation of Ginkgo biloba leaves affected by red and blue light. Ind. Crop. Prod. 2022, 187, 115488. [Google Scholar] [CrossRef]
  3. Liu, L.; Wang, Y.; Zhang, J.; Wang, S. Advances in the chemical constituents and chemical analysis of Ginkgo biloba leaf, extract, and phytopharmaceuticals. J. Pharmaceut. Biomed. 2021, 193, 113704. [Google Scholar] [CrossRef] [PubMed]
  4. Wang, X.; Gong, X.; Zhang, H.; Zhu, W.; Jiang, Z.; Shi, Y.; Li, L. In vitro anti-aging activities of Ginkgo biloba leaf extract and its chemical constituents. Food Sci. Technol. 2020, 40, 476–482. [Google Scholar] [CrossRef]
  5. Zhang, Q.; Li, J.; Sang, Y.; Xing, S.; Wu, Q.; Liu, X. Identification and Characterization of MicroRNAs in Ginkgo biloba var. epiphylla Mak. PLoS ONE 2015, 10, 127184. [Google Scholar]
  6. Cao, F. Chinese Ginkgo; Jiangsu Science and Technology Press: Beijing, China, 2002. [Google Scholar]
  7. Zhou, Q.; Mu, K.; Ni, Z.; Liu, X.; Li, Y.; Xu, L. Analysis of genetic diversity of ancient Ginkgo populations using SSR markers. Ind. Crop. Prod. 2020, 145, 111942. [Google Scholar] [CrossRef]
  8. Lin, H.Y.; Li, W.H.; Lin, C.F.; Wu, H.R.; Zhao, Y.P. International Biological Flora: Ginkgo biloba. J. Ecol. 2022, 110, 951–982. [Google Scholar] [CrossRef]
  9. Wang, G.; Cao, F.; Chang, L.; Guo, X.; Wang, J. Temperature has more effects than soil moisture on biosynthesis of flavonoids in Ginkgo (Ginkgo biloba L.) leaves. New For. 2014, 45, 797–812. [Google Scholar] [CrossRef]
  10. Guo, Y.; Guo, J.; Shen, X.; Wang, G.; Wang, T. Predicting the Bioclimatic Habitat Suitability of Ginkgo biloba L. in China with Field-Test Validations. Forests 2019, 10, 705. [Google Scholar] [CrossRef]
  11. Chu, S.; Ouyang, J.; Liao, D.; Zhou, Y.; Liu, S.; Shen, D.; Wei, X.; Zeng, S. Effects of enriched planting of native tree species on surface water flow, sediment, and nutrient losses in a Eucalyptus plantation forest in southern China. Sci. Total Environ. 2019, 675, 224–234. [Google Scholar] [CrossRef]
  12. Guo, Y.; Gao, C.; Wang, M.; Fu, F.; El-Kassaby, Y.A.; Wang, T.; Wang, G. Metabolome and transcriptome analyses reveal flavonoids biosynthesis differences in Ginkgo biloba associated with environmental conditions. Ind. Crop. Prod. 2020, 158, 112963. [Google Scholar] [CrossRef]
  13. Afonso, S.; Arrobas, M.; Ferreira, I.Q.; Rodrigues, M.A. Leaf nutrient concentration standards for lemon verbena (Aloysia citrodora Paláu) obtained from field and pot fertilization experiments. J. Appl. Res. Med. Aroma. Plants 2018, 8, 33–40. [Google Scholar] [CrossRef]
  14. Abou-Sreea, A.I.B.; Rady, M.M.; Roby, M.H.H.; Ahmed, S.M.A.; Majrashi, A.; Ali, E.F. Cattle manure and bio-nourishing royal jelly as alternatives to chemical fertilizers: Potential for sustainable production of organic Hibiscus sabdariffa L. J. Appl. Res. Med. Aromat. Plants 2021, 25, 100334. [Google Scholar] [CrossRef]
  15. Pouyanfar, M.; Alipour, N.M.; Nourafcan, H.; Faramarzi, A. Role of foliar nutrition on the growth, yield, and fatty acid compositions of linseed (Linum usitatissimum L.). J. Appl. Res. Med. Aromat. Plants 2022, 31, 100414. [Google Scholar] [CrossRef]
  16. Guo, J.; Wu, Y.; Wang, B.; Lu, Y.; Cao, F.; Wang, G. The Effects of Fertilization on the Growth and Physiological Characteristics of Ginkgo biloba L. Forests 2016, 7, 293. [Google Scholar] [CrossRef]
  17. Wang, L.; Shi, H.; Wu, J.; Cao, F. Alternative partial root-zone irrigation enhances leaf flavonoid accumulation and water use efficiency of Ginkgo biloba. New For. 2016, 47, 377–391. [Google Scholar] [CrossRef]
  18. Wu, D.; Feng, J.; Lai, M.; Ouyang, J.; Liao, D.; Yu, W.; Wang, G.; Cao, F.; Jacobs, D.F.; Zeng, S. Combined application of bud and leaf growth fertilizer improves leaf flavonoids yield of Ginkgo biloba. Ind. Crop. Prod. 2020, 150, 112379. [Google Scholar] [CrossRef]
  19. Tang, S.; Zheng, N.; Ma, Q.; Zhou, J.; Sun, T.; Zhang, X.; Wu, L. Applying Nutrient Expert system for rational fertilisation to tea (Camellia sinensis) reduces environmental risks and increases economic benefits. J. Clean. Prod. 2021, 305, 127197. [Google Scholar] [CrossRef]
  20. Ding, Z.; Jia, S.; Wang, Y.; Xiao, J.; Zhang, Y. Phosphate stresses affect ionome and metabolome in tea plants. Plant Physiol. Biochem. 2017, 120, 30–39. [Google Scholar] [CrossRef]
  21. Kim, G.W.; Gwon, H.S.; Jeong, S.T.; Hwang, H.Y.; Kim, P.J. Different responses of nitrogen fertilization on methane emission in rice plant included and excluded soils during cropping season. Agric. Ecosyst. Environ. 2016, 230, 162–168. [Google Scholar] [CrossRef]
  22. Zhou, P.; Bai, X.; Wang, H.; Yang, M.; Bao, L.; Deng, X.; Chen, Z.; Zhou, J. Optimizing nitrogen and water management for sustainable greenhouse vegetable production with less greenhouse gas emissions. Agric. Ecosyst. Environ. 2023, 352, 108529. [Google Scholar] [CrossRef]
  23. Wu, J.; Ying, Y.; Cao, F. Advances in Research on Fertilization for Ginkgo biloba. Acta Agric. Univ. Jiangxiensis 2003, 25, 402–406. [Google Scholar]
  24. Gomaa, M.A.; Kandil, E.E.; El-Dein, A.A.M.Z.; Abou-Donia, M.E.M.; Ali, H.M.; Abdelsalam, N.R. Increase maize productivity and water use efficiency through application of potassium silicate under water stress. Sci. Rep. 2021, 11, 224. [Google Scholar] [CrossRef] [PubMed]
  25. Chattha, M.U.; Hassan, M.U.U.; Khan, I.; Nawaz, M.; Shah, A.N.; Sattar, A.; Hashem, M.; Alamri, S.; Aslam, M.T.; Alhaithloul, H.A.S.; et al. Hydrogen peroxide priming alleviates salinity induced toxic effect in maize by improving antioxidant defense system, ionic homeostasis, photosynthetic efficiency and hormonal crosstalk. Mol. Biol. Rep. 2022, 49, 5611–5624. [Google Scholar] [CrossRef]
  26. Paolo, B.; Lara, R.; Martina, C.; Emma, T.; Giacomo, T.; Beatrice, F.; Adolfo, R. Nitrogen fertilization levels and timing affect the plasticity of yield components in bread wheat (Triticum aestivum L.). Field. Crops Res. 2022, 289, 108734. [Google Scholar]
  27. Chitwood, D.H.; Sinha, N.R. Evolutionary and Environmental Forces Sculpting Leaf Development. Curr. Biol. 2016, 26, R297–R306. [Google Scholar] [CrossRef]
  28. Bu, W.; Wang, F.; Zhang, C.; Bruelheide, H.; Fang, X.; Wang, H.; Chen, F. The contrasting effects of nitrogen and phosphorus fertilizations on the growth of Cunninghamia lanceolata depend on the season in subtropical China. For. Ecol. Manag. 2021, 482, 118874. [Google Scholar] [CrossRef]
  29. Chinese Pharmacopoeia Commission. Pharmacopoeia of the People’s Republic of China; Chinese Medical Science and Technology Press: Beijing, China, 2015; pp. 1491–1494. [Google Scholar]
  30. Zhang, W.; Dou, Z.; He, P.; Ju, X.; Powlson, D.; Chadwick, D.; Norse, D.; Lu, Y.; Zhang, Y.; Wu, L.; et al. New technologies reduce greenhouse gas emissions from nitrogenous fertilizer in China. Proc. Natl. Acad. Sci. USA 2013, 110, 8375–8380. [Google Scholar] [CrossRef]
  31. Cui, Z.; Yue, S.; Wang, G.; Zhang, F.; Chen, X. In-Season Root-Zone N Management for Mitigating Greenhouse Gas Emission and Reactive N Losses in Intensive Wheat Production. Environ. Sci. Technol. 2013, 47, 6015–6022. [Google Scholar] [CrossRef]
  32. Zhang, L.; Liang, Z.; Hu, Y.; Schmidhalter, U.; Zhang, W.; Ruan, S.; Chen, X. Integrated assessment of agronomic, environmental and ecosystem economic benefits of blending use of controlled-release and common urea in wheat production. J. Clean. Prod. 2021, 287, 125572. [Google Scholar] [CrossRef]
  33. Qu, F.; Zhang, Q.; Jiang, Z.; Zhang, C.; Zhang, Z.; Hu, X. Optimizing irrigation and fertilization frequency for greenhouse cucumber grown at different air temperatures using a comprehensive evaluation model. Agric. Water. Manag. 2022, 273, 107876. [Google Scholar] [CrossRef]
  34. Li, J.; Liu, Y.; Tang, Y.; Shao, J.; Xu, T.; Ma, R.; Jiang, Y.; Cheng, D. Optimizing Fertilizer Management Based on Controlled-Release Fertilizer to Improve Yield, Quality, and Reduce Fertilizer Application on Apples. J. Plant Nutr. Soil Sci. 2022, 22, 393–405. [Google Scholar] [CrossRef]
  35. Zhang, Y.; Guo, J.; Ren, F.; Jiang, Q.; Zhou, X.; Zhao, J.; Liu, X. Integrated Physiological, Transcriptomic, and Metabolomic Analyses of the Response of Peach to Nitrogen Levels during Different Growth Stages. Int. J. Mol. Sci. 2022, 23, 10876. [Google Scholar] [CrossRef]
  36. Xue, J.; Kimberley, M.O.; McKinley, R.B. Impact of nitrogen input from biosolids application on carbon sequestration in a Pinus radiata forest. For. Ecosyst. 2022, 9, 100020. [Google Scholar] [CrossRef]
  37. Wang, T.; Wang, Z.; Zhang, J.; Ma, K. An optimum combination of irrigation amount, irrigation water salinity and nitrogen application rate can improve cotton (for fiber) nitrogen uptake and final yield. Ind. Crops Prod. 2022, 187, 115386. [Google Scholar] [CrossRef]
  38. Radicetti, E.; Campiglia, E.; Marucci, A.; Mancinelli, R. How winter cover crops and tillage intensities affect nitrogen availability in eggplant. Nutr. Cycl. Agroecosys. 2017, 108, 177–194. [Google Scholar] [CrossRef]
  39. Pal, P.K.; Prasad, R.; Pathania, V. Effect of decapitation and nutrient applications on shoot branching, yield, and accumulation of secondary metabolites in leaves of Stevia rebaudiana Bertoni. J. Plant Physiol. 2013, 170, 1526–1535. [Google Scholar] [CrossRef] [PubMed]
  40. Vanderzande, S.; Hias, N.; Edge-Garza, D.; Costes, E.; Davey, M.W.; Keulemans, J. Sylleptic branching in winter-headed apple (Malus × domestica) trees: Accession-dependent responses and their relationships with other tree architectural characteristics. Tree Genet. Genomes 2016, 12, 87. [Google Scholar] [CrossRef]
  41. Van Do, T.; Thang, N.T.; Lam, V.T.; Van Thuyet, D.; Trung, P.D.; Quy, T.H.; Phuong, N.T.T.; Huyen, L.T.T.; Thinh, N.H.; Van Tuan, N.; et al. Monitoring fine root growth to identify optimal fertilization timing in a forest plantation: A case study in Northeast Vietnam. PLoS ONE 2019, 14, 225567. [Google Scholar] [CrossRef]
  42. Pandey, V.; Patel, A.; Patra, D.D. Amelioration of mineral nutrition, productivity, antioxidant activity and aroma profile in marigold (Tagetes minuta L.) with organic and chemical fertilization. Ind. Crop. Prod. 2015, 76, 378–385. [Google Scholar] [CrossRef]
  43. Deng, K.; Li, L.; Li, L.; Xu, F.; Yuan, H.; Zha, S.; Xiao, X.; Yu, J.; Cheng, S.; Cheng, H. Molecular Mechanism of Selenium Affecting the Synthesis of Flavonoids in G. biloba Leaves. Plant Mol. Biol. Report. 2022, 40, 232–246. [Google Scholar] [CrossRef]
  44. Lin, Y.; Lou, K.; Wu, G.; Wu, X.; Zhou, X.; Feng, Y.; Zhang, H.; Yu, P. Bioactive metabolites in of Ginkgo biloba leaves: Variations by seasonal, meteorological and soil. Braz. J. Biol. 2020, 80, 790–797. [Google Scholar] [CrossRef] [PubMed]
  45. Chen, X.; Cui, Z.; Fan, M.; Vitousek, P.; Zhao, M.; Ma, W.; Wang, Z.; Zhang, W.; Yan, X.; Yang, J.; et al. Producing more grain with lower environmental costs. Nature 2014, 514, 486–489. [Google Scholar] [CrossRef]
  46. Zhang, W.; Liang, Z.; He, X.; Wang, X.; Shi, X.; Zou, C.; Chen, X. The effects of controlled release urea on maize productivity and reactive nitrogen losses: A meta-analysis. Environ. Pollut. 2019, 246, 559–565. [Google Scholar] [CrossRef] [PubMed]
  47. Xu, X.; He, P.; Pampolino, M.F.; Li, Y.; Liu, S.; Xie, J.; Hou, Y.; Zhou, W. Narrowing yield gaps and increasing nutrient use efficiencies using the Nutrient Expert system for maize in Northeast China. Field Crop. Res. 2016, 194, 75–82. [Google Scholar] [CrossRef]
  48. Zeng, S.; Jacobs, D.F.; Sloan, J.L.; Xue, L.; Li, Y.; Chu, S. Split fertilizer application affects growth, biomass allocation, and fertilizer uptake efficiency of hybrid Eucalyptus. New For. 2013, 44, 703–718. [Google Scholar] [CrossRef]
Figure 1. A schematic diagram of the experimental design. Note: The trees marked with a red pentagram are the fertilization or CK trees and those around them are buffer trees.
Agronomy 14 01956 g001
Figure 2. Dry and fresh weight of leaf-use ginkgo leaves in different fertilization treatments. Note: FBD: fertilizer for bud development; FLG: fertilizer for leaf growth; FLS: fertilizer for leaf strengthening. Values are mean ± SE (n = 5). At the same fertilization timing, means with different lower-case letters are significantly different between treatments in fresh weight, while means with different upper-case letters are significant difference in dry weight between different treatments (α = 0.05 by Duncan’s test).
Agronomy 14 01956 g002
Figure 3. Ginkgo leaf area and thickness in different fertilization treatments. Note: FBD: fertilizer for bud development; FLG: fertilizer for leaf growth; FLS: fertilizer for leaf strengthening. Values are mean ± SE (n = 5). At the same fertilization timing, means with different lower-case letters are significantly different between treatments (α = 0.05 by Duncan’s test).
Agronomy 14 01956 g003
Figure 4. Changes of leaf SPAD values in different fertilization treatments. Note: FBD: fertilizer for bud development; FLG: fertilizer for leaf growth; FLS: fertilizer for leaf strengthening. Values are mean ± SE (n = 5). The five inflection points in each subgraph represent the SPAD mean values measured on 18 May, 1 June, 1 July, 1 August and 1 September 2019, respectively.
Agronomy 14 01956 g004
Figure 5. Greenhouse gas emissions under different fertilization conditions. Note: FBD: fertilizer for bud development; FLG: fertilizer for leaf growth; FLS: fertilizer for leaf strengthening. Values are mean ± SE (n = 5). The fertilization amount for each treatment is the same. At the same fertilization timing, means with different lower-case letters are significantly different between treatments (α = 0.05 by Duncan’s test).
Agronomy 14 01956 g005
Table 1. Different fertilization treatments in different periods.
TreatmentsFertilizer for Bud Development FBD (Applied in March)Fertilizer for Leaf Growth
FLG (Applied in May)
Fertilizer for Leaf Strengthening FLS (Applied in July)
CK000
T12.0 g N + 1.0 g P2O5 + 1.0 g K2O2.0 g N + 1.5 g P2O5 + 1.5 g K2O2.0 g N + 1.5 g P2O5 + 2.0 g K2O
T22.0 g N + 1.5 g P2O5 + 1.5 g K2O2.0 g N + 2.0 g P2O5 + 2.0 g K2O2.0 g N + 2.0 g P2O5 + 2.5 g K2O
T32.0 g N + 2.0 g P2O5 + 2.0 g K2O2.0 g N + 2.5 g P2O5 + 2.5 g K2O2.0 g N + 2.5 g P2O5 + 3.0 g K2O
T44.0 g N + 1.0 g P2O5 + 1.5 g K2O3.0 g N + 1.5 g P2O5 + 2.0 g K2O3.0 g N + 1.5 g P2O5 + 2.5 g K2O
T54.0 g N + 1.5 g P2O5 + 2.0 g K2O3.0 g N + 2.0 g P2O5 + 2.5 g K2O3.0 g N + 2.0 g P2O5 + 3.0 g K2O
T64.0 g N + 2.0 g P2O5 + 1.0 g K2O3.0 g N + 2.5 g P2O5 + 1.5 g K2O3.0 g N + 2.5 g P2O5 + 2.0 g K2O
T76.0 g N + 1.0 g P2O5 + 2.0 g K2O4.0 g N + 1.5 g P2O5 + 2.5 g K2O4.0 g N + 1.5 g P2O5 + 3.0 g K2O
T86.0 g N + 1.5 g P2O5 + 1.0 g K2O4.0 g N + 2.0 g P2O5 + 1.5 g K2O4.0 g N + 2.0 g P2O5 + 2.0 g K2O
T96.0 g N + 2.0 g P2O5 + 1.5 g K2O4.0 g N + 2.5 g P2O5 + 2.0 g K2O4.0 g N + 2.5 g P2O5 + 2.5 g K2O
Note: Set 9 different fertilization ratios for each of the three different fertilization times, all named T1–T9. The fertilizer dosage in the table refers to the amount used per tree. N, P2O5 and K2O application rates in the table refer to the conversion rates of urea, superphosphate and potassium chloride. For example, 2.00 g N corresponds to 2/0.46 = 4.36 g urea, 1.00 g P2O5 refers to 1/0.12 = 8.33 g superphosphate, 1.00 g K2O refers to 1/0.6 = 1.67 g potassium chloride.
Table 2. Effects of fertilization on flavonoid content and yield.
TreatmentQuercetin (mg g−1)Kaempferol (mg g−1)Isorhamnetin (mg g−1)Total Flavonoid (mg g−1)Flavonoid Yield (mg tree−1)
Fertilizer for bud development, FBDCK0.83 ± 0.11 ab1.22 ± 0.12 b0.06 ± 0.01 a5.28 ± 0.59 b238.09 ± 30.34 b
T11.08 ± 0.07 a1.37 ± 0.05 b0.06 ± 0.01 a6.30 ± 0.14 ab318.25 ± 6.04 ab
T20.94 ± 0.07 ab1.53 ± 0.07 ab0.06 ± 0.02 a6.36 ± 0.26 ab335.02 ± 14.94 a
T30.98 ± 0.07 ab1.81 ± 0.22 ab0.08 ± 0.01 a7.20 ± 0.45 a393.10 ± 31.94 a
T41.06 ± 0.12 ab1.39 ± 0.10 b0.08 ± 0.01 a6.36 ± 0.38 ab355.80 ± 35.67 a
T50.84 ± 0.04 ab1.33 ± 0.15 b0.09 ± 0.02 a5.69 ± 0.39 b320.28 ± 36.82 ab
T60.80 ± 0.06 b1.37 ± 0.08 b0.07 ± 0.01 a5.62 ± 0.11 b358.83 ± 16.40 a
T70.89 ± 0.09 ab1.6 ± 0.17 ab0.07 ± 0.01 a6.42 ± 0.3 ab365.27 ± 27.95 a
T80.81 ± 0.05 ab1.37 ± 0.14 b0.07 ± 0.01 a5.66 ± 0.40 b331.17 ± 39.07 ab
T90.86 ± 0.1 ab1.47 ± 0.13 ab0.08 ± 0.01 a6.04 ± 0.45 ab399.33 ± 40.98 a
Fertilizer for leaf growth, FLGCK0.83 ± 0.11 c1.22 ± 0.12 d0.06 ± 0.01 b5.28 ± 0.59 b238.09 ± 30.34 b
T11.49 ± 0.24 a1.49 ± 0.08 bcd0.07 ± 0.01 ab7.65 ± 0.77 a419.10 ± 39.13 a
T21.46 ± 0.12 ab1.67 ± 0.1 abc0.08 ± 0.01 ab8.07 ± 0.46 a512.72 ± 53.17 a
T31.12 ± 0.07 bc1.88 ± 0.13 a0.07 ± 0.01 ab7.73 ± 0.27 a465.23 ± 33.01 a
T41.04 ± 0.04 c1.68 ± 0.14 abc0.07 ± 0.01 ab7.01 ± 0.31 a437.60 ± 22.51 a
T51.08 ± 0.12 c1.85 ± 0.14 ab0.09 ± 0.01 ab7.58 ± 0.65 a514.22 ± 29.88 a
T61.00 ± 0.10 c1.64 ± 0.15 abc0.07 ± 0.01 ab6.79 ± 0.62 ab524.08 ± 42.02 a
T71.02 ± 0.05 c1.65 ± 0.11 abc0.21 ± 0.13 a7.22 ± 0.49 a507.00 ± 45.55 a
T80.98 ± 0.14 c1.52 ± 0.07 abcd0.08 ± 0.01 ab6.49 ± 0.43 ab438.96 ± 27.89 a
T91.01 ± 0.11 c1.43 ± 0.1 cd0.07 ± 0.01 ab6.31 ± 0.51 ab466.13 ± 41.62 a
Fertilizer for leaf strengthening, FLSCK0.83 ± 0.11 c1.22 ± 0.12 a0.06 ± 0.01 a5.28 ± 0.59 c238.09 ± 30.34 c
T11.15 ± 0.05 abc1.67 ± 0.08 a0.08 ± 0.01 a7.27 ± 0.29 ab382.09 ± 41.97 ab
T21.13 ± 0.06 abc1.58 ± 0.10 a0.08 ± 0.01 a6.98 ± 0.28 abc355.93 ± 17.46 b
T31.39 ± 0.15 a1.39 ± 0.18 a0.09 ± 0.04 a7.20 ± 0.73 bc390.03 ± 21.1 ab
T41.33 ± 0.14 abc1.55 ± 0.19 a0.21 ± 0.14 a7.73 ± 0.68 a460.30 ± 24.15 a
T51.04 ± 0.06 bc1.52 ± 0.13 a0.07 ± 0.01 a6.59 ± 0.27 abc394.79 ± 16.7 ab
T60.90 ± 0.11 c1.41 ± 0.20 a0.07 ± 0.01 a5.98 ± 0.75 bc398.38 ± 40.78 ab
T70.93 ± 0.09 c1.59 ± 0.15 a0.05 ± 0.01 a6.46 ± 0.51 abc390.68 ± 24.24 ab
T80.90 ± 0.10 c1.35 ± 0.06 a0.22 ± 0.14 a6.19 ± 0.33 abc388.96 ± 35.11 ab
T90.87 ± 0.03 c1.48 ± 0.10 a0.22 ± 0.14 a6.45 ± 0.48 abc427.37 ± 27.77 ab
Note: Values are mean ± SE (n = 5). Means with different letters are significantly different among treatments at the same fertilization timing for the same parameter (α = 0.05 by Duncan test).
Table 3. Mean costs and benefits ($ ha−1) under different fertilization treatments.
TreatmentTotal Income AFertilizer Cost BLabor
Costs B
Ecological Costs BHealth Costs BNet IncomeEcosystem Economic Benefits C
Fertilizer for bud development, FBDCK3327.32 ± 98.82 c00003327.32 ± 98.82 a-
T13766.87 ± 120.84 bc125.4586.6472.2239.483443.08 ± 120.84 a115.77 ± 45.62 b
T23936.5 ± 196.66 abc170.7886.6473.7539.483565.85 ± 196.66 a238.54 ± 98.11 b
T34113.72 ± 400.63 abc216.1286.6475.2839.483696.21 ± 400.63 a368.89 ± 304.27 ab
T44127.56 ± 219.44 abc166.486.64141.5678.973654.00 ± 219.44 a326.68 ± 135.32 ab
T54140.06 ± 269.48 abc211.7386.64143.0978.973619.63 ± 269.48 a292.32 ± 184.47 ab
T64748.36 ± 179.34 ab238.5786.64144.0678.974200.13 ± 179.34 a872.81 ± 95.07 a
T74235.89 ± 261.92 abc207.3586.64210.9118.453612.55 ± 261.92 a285.23 ± 168.49 ab
T84479.62 ± 721.49 ab234.1886.64211.87118.453828.48 ± 721.49 a501.16 ± 642.40 a
T94907.87 ± 260.97 a279.5186.64213.4118.454209.86 ± 260.97 a882.55 ± 194.88 a
Fertilizer for leaf growth, FLGCK3327.32 ± 98.82 c00003327.32 ± 98.82 e-
T14084.26 ± 61.96 d170.7886.6473.7539.483713.61 ± 61.96 de386.29 ± 40.09 e
T24696.57 ± 297.19 cd216.1286.6475.2839.484279.06 ± 297.19 bcd951.74 ± 226.68 bcde
T34477.99 ± 259.45 cd261.4586.6476.8139.484013.61 ± 259.45 cde686.29 ± 194.49 de
T44654.91 ± 168.15 cd194.3486.64108.5159.234206.19 ± 168.15 bcd878.88 ± 78.22 cde
T55122.14 ± 265.4 abc239.6786.64110.0459.234626.56 ± 265.40 abc1299.25 ± 176.10 bcd
T65865.25 ± 480.34 a266.5186.64111.0159.235341.87 ± 480.34 a2014.55 ± 402.34 a
T75221.24 ± 264.83 abc217.9086.64143.2778.974694.46 ± 264.83 abc1367.14 ± 181.72 bc
T85040.15 ± 99.94 bc244.7386.64144.2478.974485.57 ± 99.94 bcd1158.25 ± 43.42 bcd
T95492.51 ± 198.12 ab290.0786.64145.7778.974891.06 ± 198.12 ab1563.74 ± 106.34 ab
Fertilizer for leaf strengthening, FLSCK3327.32 ± 98.82 c00003327.32 ± 98.82 c-
T13896.63 ± 338.61 bc176.9586.6473.9339.483519.62 ± 338.61 bc192.3 ± 258.11 c
T23817.02 ± 241.53 bc222.2886.6475.4639.483393.15 ± 241.53 c65.83 ± 170.19 c
T34208.81 ± 493.03 ab267.6286.6476.9939.483738.08 ± 493.03 abc410.76 ± 418.94 bc
T44488.4 ± 192.38 ab200.5186.64108.759.234033.33 ± 192.38 abc706.02 ± 93.61 abc
T54474.42 ± 205.18 ab245.8486.64110.2359.233972.48 ± 205.18 abc645.17 ± 109.94 abc
T65036.14 ± 315.34 a272.6786.64111.259.234506.40 ± 315.34 a1179.08 ± 216.82 a
T74585.87 ± 361.16 ab224.0786.64143.4678.974052.73 ± 361.16 abc725.42 ± 279.27 abc
T84638.54 ± 211.95 ab257.0786.64144.6278.974071.25 ± 211.95 abc743.93 ± 150.29 abc
T94946.26 ± 130.96 a290.0786.64145.7778.974344.81 ± 130.96 ab1017.5 ± 38.23 ab
A: The planting density of 0.8 m × 0.6 m is comparatively suitable for industrial cultivation of leaf-harvesting ginkgo, and the best planting density is about 20,000 plant/ha. B: Under the same treatment, the fertilization level was the same, so the fertilizer cost, ecological cost and health cost are consistent, with a standard error of 0. C: ecosystem economic benefits = N-derived grain benefits; N costs; labor costs; ecological costs; health costs. Values are mean ± SE (n = 5). Means with different letters are significantly different among treatments at the same fertilization timing for the same parameter (α = 0.05 by Duncan test).
Table 4. Ranking of fertilization suitability for ginkgo based on TOPSIS comprehensive evaluation.
Treatment D i + D i CiRanking Number
Fertilizer for bud development, FBDCK356.630028
T1331.8336.530.127
T2309.5758.20.1624
T3286.2582.110.2219
T4294.1970.540.1923
T5299.2672.730.222
T6198.47162.150.4510
T7300.4673.130.221
T8262.72105.420.2917
T9196.28168.140.469
Fertilizer for leaf growth, FLGT1284.178.510.2220
T2185.7172.860.488
T3230.87134.20.3714
T4198.51159.520.4511
T5125.09232.510.654
T612.48355.070.971
T7113.78243.010.683
T8149.04209.490.586
T978.51280.020.782
Fertilizer for leaf strengthening, FLST1317.4253.930.1525
T2338.5854.140.1426
T3278.5195.420.2618
T4228.13131.710.3715
T5237.92126.490.3516
T6145.34214.590.65
T7224.18137.250.3813
T8220.56143.310.3912
T9173.03189.80.527
Disclaimer/Publisher’s Note: The statements, opinions and data contained in all publications are solely those of the individual author(s) and contributor(s) and not of MDPI and/or the editor(s). MDPI and/or the editor(s) disclaim responsibility for any injury to people or property resulting from any ideas, methods, instructions or products referred to in the content.

