
Economic and Environmental Assessment of Conventional Lemon Cultivation: The Case of Southeastern Spain


Abstract
1. Introduction
- The establishment of the two lemon cultivation models representative of the SE of Spain, which correspond to the two principal varieties (Fino and Verna) and the main (conventional) production system.
- To apply life cycle costing and life cycle assessment to the two production models to evaluate and compare them economically and environmentally.
- To carry out a sensitivity analysis, granting variability to the elements identified as relevant in previous evaluations and proposing more efficient alternatives.
2. Materials and Methods
2.1. Data Collection
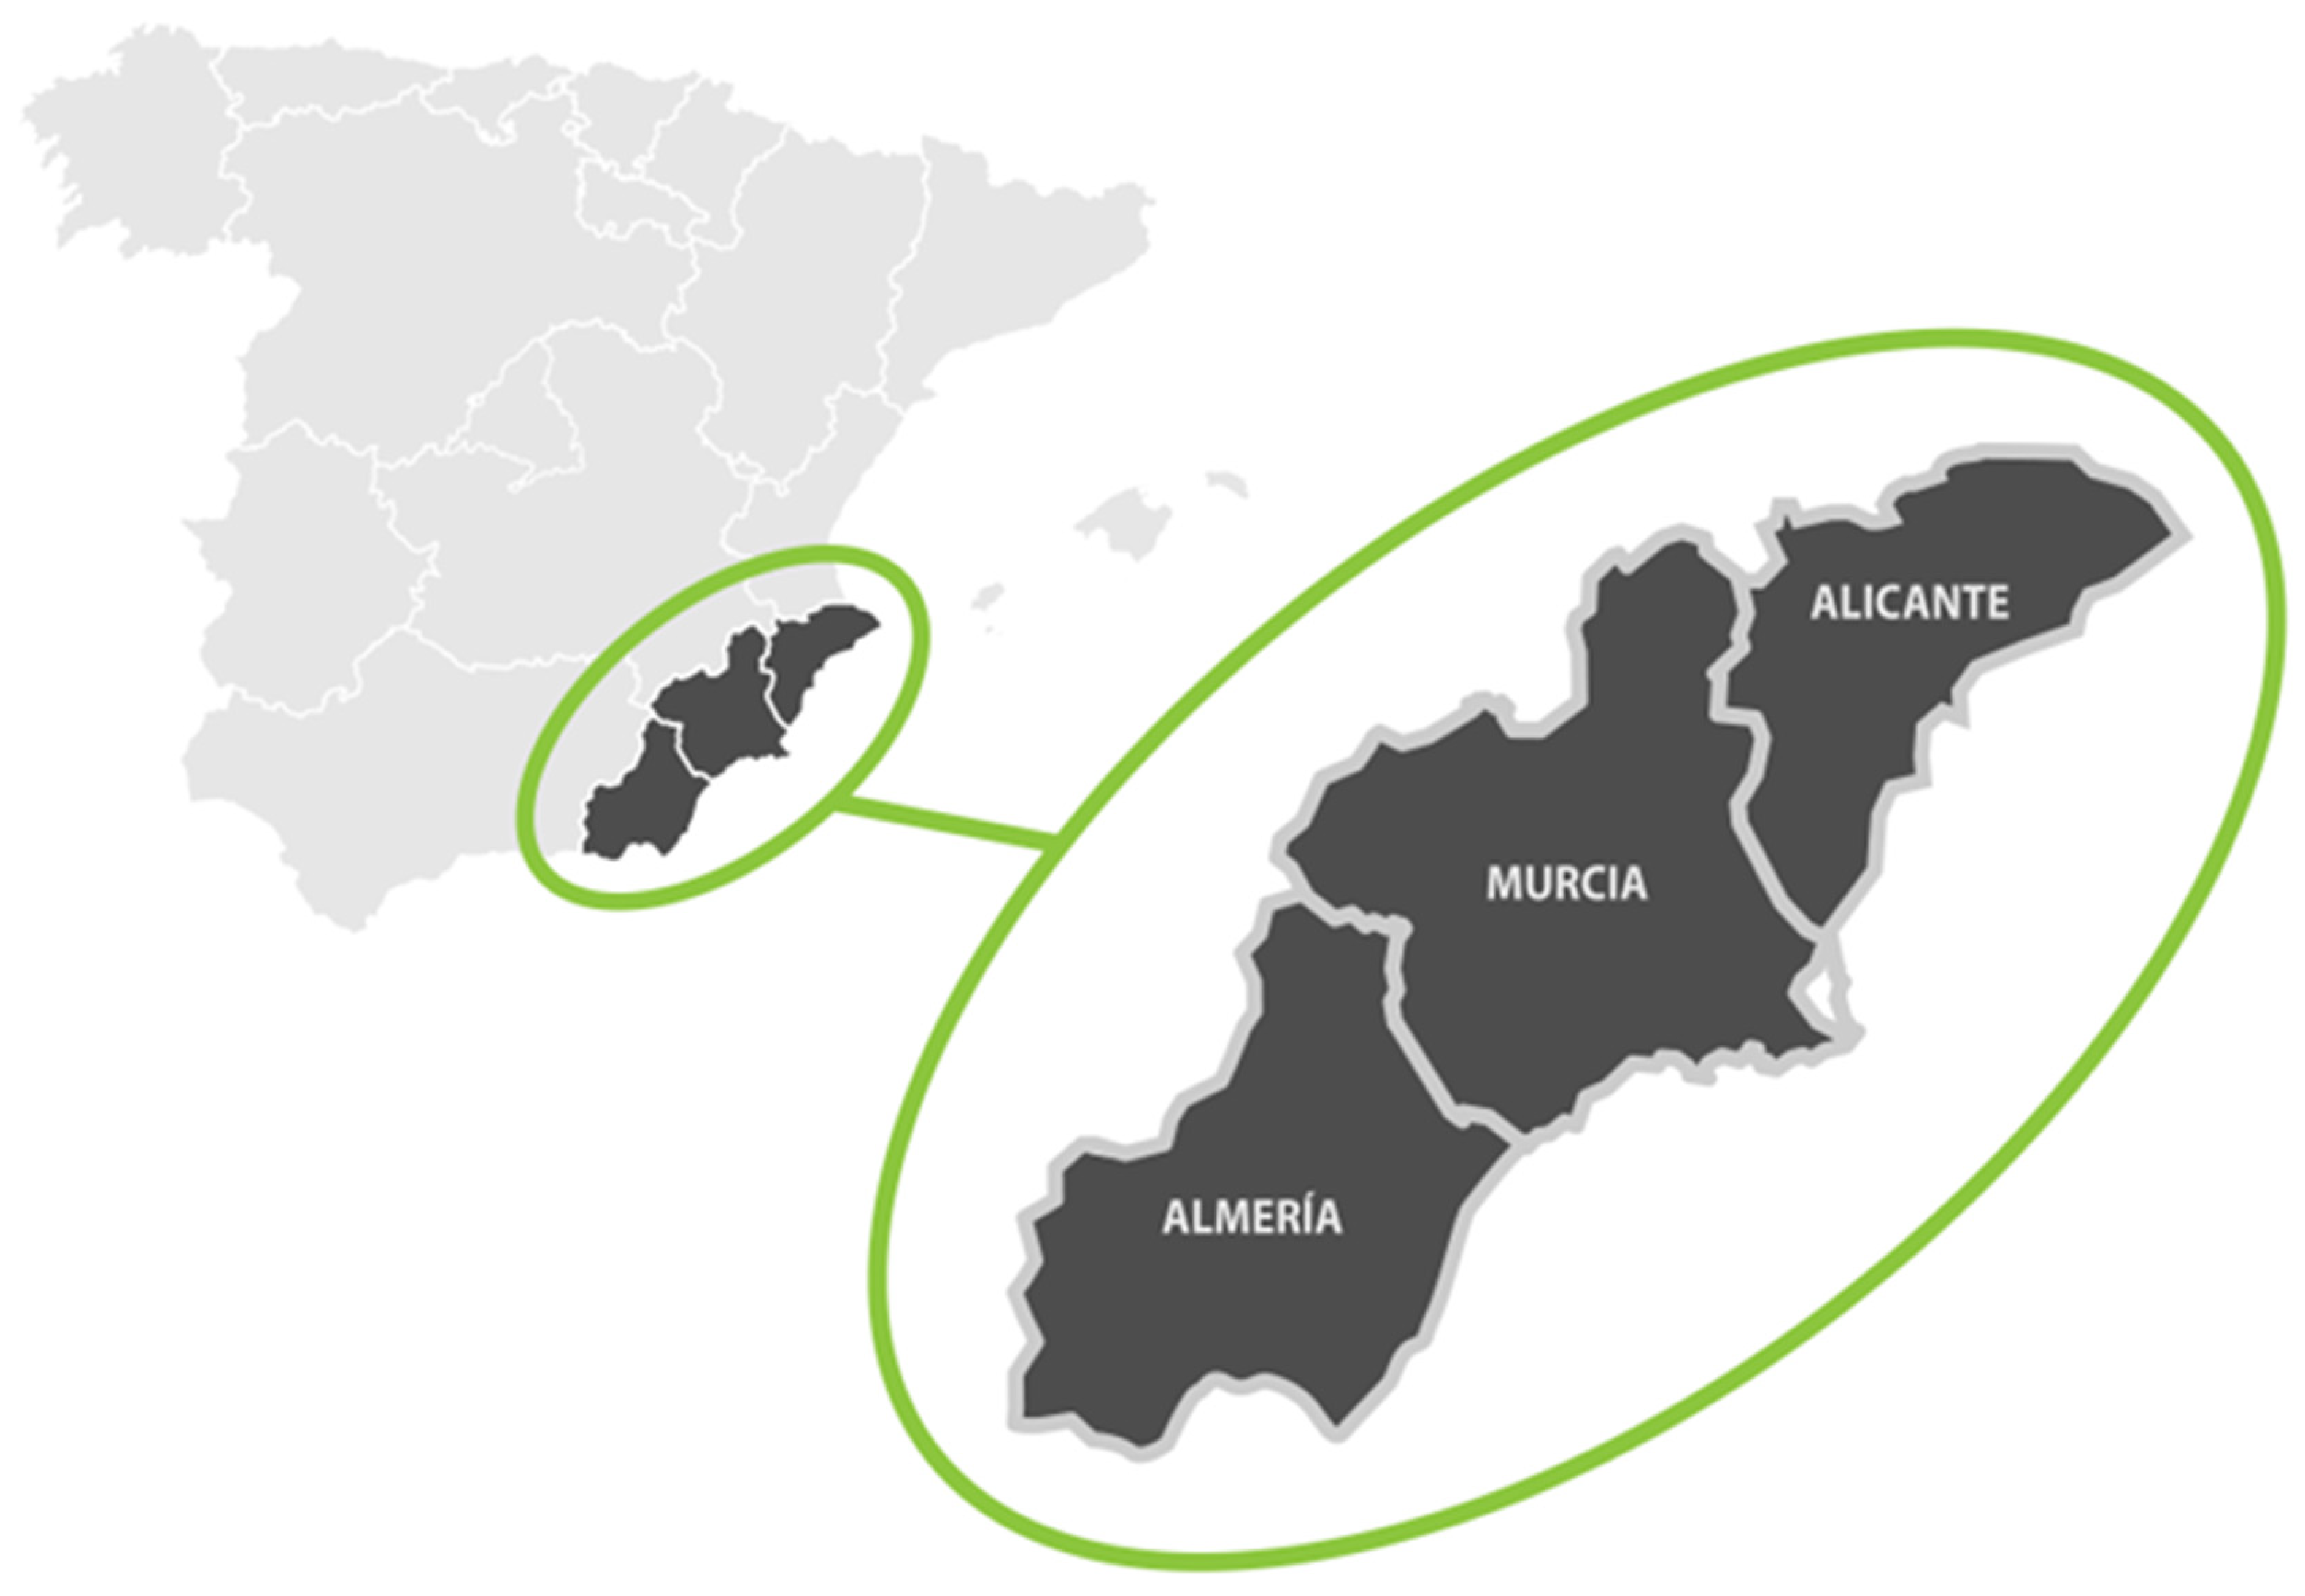
2.2. Characterization of the Study Area
2.3. Establishment of Production Models
- Fino conventional
- Verna conventional
2.4. Economic Evaluation: Life Cycle Cost Analysis
2.4.1. Fixed Costs
2.4.2. Variable Costs
- Crop insurance
- Pruning
- Machinery
- Fertilizers
- Phytosanitary treatments
- Herbicides
- Maintenance
- Permanent staff
- Water (irrigation)
- Electrical energy (irrigation)
2.5. Environmental Evaluation: Life Cycle Assessment
2.5.1. Objective and Scope
- Infrastructure: This corresponds to the investment and fixed assets of the LCC. It includes the fuel and lubricant consumed by the machinery during the preparation and planting of the land and its emissions into the atmosphere; the production process of the seedling in the nursery; the irrigation equipment and the irrigation network, accounting for its raw materials, manufacture, and transportation; the reservoir, taking into account the fuel and lubricant consumed in its construction; the resulting emissions; and the necessary raw materials, their manufacture, and transportation.
- Machinery: the fuel and lubricant consumed by machinery during agricultural work in the production cycle and its emissions.
- Fertilizers: the production of inorganic fertilizers and their transportation, packaging, and emissions into the atmosphere derived from the application of nitrogen fertilizers in the field.
- Pesticides: the production of phytosanitary products and herbicides, their packaging, and transportation.
- Electrical energy: the electrical energy consumed during fertigation.
- Waste treatment: The treatment of infrastructure and packaging (metals and plastics) that have reached the end of their useful life. It was considered that 80% of these materials are recycled and the remaining 20% end up in landfills. Prunings were not considered waste since they are crushed and incorporated into the soil.
2.5.2. Life Cycle Inventory
2.5.3. Impact of the Life Cycle: Evaluation and Interpretation
2.6. Sensitivity Analysis
3. Results and Discussion
3.1. Economic Evaluation: Life Cycle Cost Analysis
3.2. Environmental Evaluation: Life Cycle Assessment
3.3. Sensitivity Analysis
4. Conclusions
Author Contributions
Funding
Data Availability Statement
Acknowledgments
Conflicts of Interest
Appendix A

| Initial Investment for the Farm (EUR) | Initial Investment (EUR·ha−1) | Useful Life (years) | Residual Value (EUR·ha−1) | Amortization (EUR·ha−1·year −1) | Fixed Costs * (EUR·ha−1·year −1) | |
|---|---|---|---|---|---|---|
| Shed for equipment | 16,000.0 | 1600.0 | 30.0 | 400.0 | 40.0 | 41 |
| Preparation and planting | 35,500.7 | 3550.1 | 25.0 | 0.0 | 142.0 | 144 |
| Irrigation reservoir | 33,717.5 | 3371.8 | 30.0 | 842.9 | 84.3 | 86 |
| Irrigation equipment | 13,125.0 | 1312.5 | 15.0 | 0.0 | 87.5 | 89 |
| Irrigation network | 18,972.9 | 1897.3 | 10.0 | 0.0 | 189.7 | 193 |
| Various | 1250.0 | 125.0 | 5.0 | 0.0 | 25.0 | 25 |
| 118,566.1 | 11,856.6 | 578 |
| Initial Investment for the Farm (EUR) | Initial Investment (EUR·ha−1) | Useful Life (Years) | Residual Value (EUR·ha−1) | Amortization (EUR·ha−1·year −1) | Fixed Costs * (EUR·ha−1·year −1) | |
|---|---|---|---|---|---|---|
| Shed for equipment | 16,000.0 | 1600.0 | 30.0 | 400.0 | 40.0 | 41 |
| Preparation and planting | 37,215.0 | 3721.5 | 30.0 | 0.0 | 124.1 | 126 |
| Irrigation reservoir | 29,553.2 | 2955.3 | 30.0 | 738.8 | 73.9 | 75 |
| Irrigation equipment | 13,125.0 | 1312.5 | 15.0 | 0.0 | 87.5 | 89 |
| Irrigation network | 18,972.9 | 1897.3 | 10.0 | 0.0 | 189.7 | 193 |
| Various | 1250.0 | 125.0 | 5.0 | 0.0 | 25.0 | 25 |
| 116,116.0 | 11,611.6 | 549 |
References
- World Bank. Global Economic Prospects; The World Bank: Washington, DC, USA, 2023; ISBN 978-1-4648-1952-0. [Google Scholar]
- United Nations Department of Economic and Social Affairs, Population Division. World Population Prospects 2022: Summary of Results; United Nations: New York, NY, USA, 2022; ISBN 978-92-1-001438-0. [Google Scholar]
- United Nations Department of Economic and Social Affairs. Global Sustainable Development Report 2023: Times of Crisis, Times of Change: Science for Accelerating Transformations to Sustainable Development; United Nations: New York, NY, USA, 2023; ISBN 978-92-1-358511-5. [Google Scholar]
- Beccali, M.; Cellura, M.; Iudicello, M.; Mistretta, M. Resource Consumption and Environmental Impacts of the Agrofood Sector: Life Cycle Assessment of Italian Citrus-Based Produdts. Environ. Manag. 2009, 43, 707–724. [Google Scholar] [CrossRef]
- Beccali, M.; Cellura, M.; Iudicello, M.; Mistretta, M. Life Cycle Assessment of Italian Citrus-Based Products. Sensitivity Analysis and Improvement Scenarios. J. Environ. Manag. 2010, 91, 1415–1428. [Google Scholar] [CrossRef]
- Falcone, G.; De Luca, A.; Stillitano, T.; Strano, A.; Romeo, G.; Gulisano, G. Assessment of Environmental and Economic Impacts of Vine-Growing Combining Life Cycle Assessment, Life Cycle Costing and Multicriterial Analysis. Sustainability 2016, 8, 793. [Google Scholar] [CrossRef]
- European Comission. A Farm to Fork Strategy; Communication from the Commission to the European Parliament, the Council, the European Economic and Social Committee and the Committee of the Regions; European Commission: Brussels, Belgium, 2020. [Google Scholar]
- European Environment Information and Observation. Agriculture-Introduction; European Environment Information and Observation (Eionet): Copenhagen, Denmark, 2020. [Google Scholar]
- European Comission. The European Green Deal. Communication from the Commission to the European Parliament, the Council, the European Economic and Social Committee and the Committee of the Regions; European Commission: Brussels, Belgium, 2019. [Google Scholar]
- European Comission. EU Biodiversity Strategy for 2030; Communication from the Commission to the European Parliament, the Council, the European Economic and Social Committee and the Committee of the Regions; European Commission: Brussels, Belgium, 2020. [Google Scholar]
- Maudos, J.; Salamanca, J. Observatorio Sobre el Sector Agroalimentario Español en el Contexto Europeo: Informe 2022; Cajamar Caja Rural: Almería, Spain, 2023; ISBN 978-84-95531-74-2. [Google Scholar]
- CARM. Estadística Agraria de Murcia 2020/21; Comunidad Autónoma de la Región de Murcia; Consejería de Agua, Agricultura, Ganadería, Pesca, Medio Ambiente y Emergencias: Murcia, Spain, 2022. [Google Scholar]
- Martin-Gorriz, B.; Gallego-Elvira, B.; Martínez Alvarez, V.; Maestre-Valero, J.F. Life Cycle Assessment of Fruit and Vegetable Production in the Region of Murcia (South-East Spain) and Evaluation of Impact Mitigation Practices. J. Clean. Prod. 2020, 265, 121856. [Google Scholar] [CrossRef]
- ISO 14040; Environmental Management–Life Cycle Assessment: Principles and Framework. International Organization for Standards (ISO): Geneva, Switzerland, 2006.
- ISO 14044; Environmental Management–Life Cycle Assessment: Requirements and Guidelines. International Organization for Standards (ISO): Geneva, Switzerland, 2006.
- Clift, R.; Druckman, A. Taking Stock of Industrial Ecology; Springer Open: Cham, Switzerland, 2016; ISBN 978-3-319-20571-7. [Google Scholar]
- Rivela, B.; Kuczenski, B.; Sucozhañay, D. Chapter 6. Life Cycle Sustainability Assessment-Based Tools. In Assessing Progress Towards Sustainability; Teodosiu, C., Fiore, S., Hospido, A., Eds.; Elsevier: Amsterdam, The Netherlands, 2022; pp. 93–118. ISBN 978-0-323-85851-9. [Google Scholar]
- Ciroth, A.; Huppes, G.; Klöpffer, W.; Rüdenauer, I.; Steen, B.; Swarr, T. Environmental Life Cycle Costing; Hunkeler, D., Lichtenvort, K., Rebitzer, G., Eds.; CRC Press: Boca Raton, FL, USA; Taylor & Francis Group: New York, NY, USA, 2008; ISBN 978-1-4200-5470-5. [Google Scholar]
- Settanni, E.; Notarnicola, B.; Tassielli, G. Combining Life Cycle Assessment of Food Products with Economic Tools. In Environmental Assessment and Management in the Food Industry; Elsevier: Amsterdam, The Netherlands, 2010; pp. 207–218. ISBN 978-1-84569-552-1. [Google Scholar]
- ISO 15663; Petroleum, Petrochemical and Natural Gas Industries—Life Cycle Costing. International Organization for Standards (ISO): Geneva, Switzerland, 2021.
- ISO 15686; Buildings and Constructed Assets -Service Life Planning—Life Cycle Costing. International Organization for Standards (ISO): Geneva, Switzerland, 2017.
- Tamburini, E.; Pedrini, P.; Marchetti, M.; Fano, E.; Castaldelli, G. Life Cycle Based Evaluation of Environmental and Economic Impacts of Agricultural Productions in the Mediterranean Area. Sustainability 2015, 7, 2915–2935. [Google Scholar] [CrossRef]
- Sottile, F.; Massaglia, S.; Peano, C. Ecological and Economic Indicators for the Evaluation of Almond (Prunus dulcis L.) Orchard Renewal in Sicily. Agriculture 2020, 10, 301. [Google Scholar] [CrossRef]
- García Castellanos, B.; García Garcia, B.; García García, J. Evaluation of the Sustainability of Vineyards in Semi-Arid Climates: The Case of Southeastern Spain. Agronomy 2022, 12, 3213. [Google Scholar] [CrossRef]
- Ribal, J.; Sanjuan, N.; Clemente, G.; Fenollosa, M.L. Medición de La Ecoeficiencia En Procesos Productivos En El Sector Agrario. Caso de Estudio Sobre Producción de Cítricos. Econ. Agrar. Recur. Nat. 2009, 9, 125–148. [Google Scholar]
- Pergola, M.; D’Amico, M.; Celano, G.; Palese, A.M.; Scuderi, A.; Di Vita, G.; Pappalardo, G.; Inglese, P. Sustainability Evaluation of Sicily’s Lemon and Orange Production: An Energy, Economic and Environmental Analysis. J. Environ. Manag. 2013, 128, 674–682. [Google Scholar] [CrossRef]
- Cabot, M.I.; Lado, J.; Sanjuán, N. Multi-Season Environmental Life Cycle Assessment of Lemons: A Case Study in South Uruguay. J. Environ. Manag. 2023, 326, 116719. [Google Scholar] [CrossRef]
- Canaj, K.; Mehmeti, A.; Cantore, V.; Todorović, M. LCA of Tomato Greenhouse Production Using Spatially Differentiated Life Cycle Impact Assessment Indicators: An Albanian Case Study. Environ. Sci. Pollut. Res. 2020, 27, 6960–6970. [Google Scholar] [CrossRef]
- Roy, P.; Nei, D.; Orikasa, T.; Xu, Q.; Okadome, H.; Nakamura, N.; Shiina, T. A Review of Life Cycle Assessment (LCA) on Some Food Products. J. Food Eng. 2009, 90, 1–10. [Google Scholar] [CrossRef]
- Cabot, M.I.; Lado, J.; Clemente, G.; Sanjuán, N. Towards Harmonised and Regionalised Life Cycle Assessment of Fruits: A Review on Citrus Fruit. Sustain. Prod. Consum. 2022, 33, 567–585. [Google Scholar] [CrossRef]
- García García, J. Análisis del Sector Del Limonero y Evaluación Económica de su Cultivo; Consejería de Agricultura y Agua de la Región de Murcia: Murcia, Spain, 2014; ISBN 978-84-697-0909-2. [Google Scholar]
- Sgroi, F.; Candela, M.; Di Trapani, A.M.; Foderà, M.; Squatrito, R.; Testa, R.; Tudisca, S. Economic and Financial Comparison between Organic and Conventional Farming in Sicilian Lemon Orchards. Sustainability 2015, 7, 947–961. [Google Scholar] [CrossRef]
- Raschio, G.; Smetana, S.; Contreras, C.; Heinz, V.; Mathys, A. Spatio-Temporal Differentiation of Life Cycle Assessment Results for Average Perennial Crop Farm: A Case Study of Peruvian Cocoa Progression and Deforestation Issues. J. Ind. Ecol. 2017, 22, 1378–1388. [Google Scholar]
- Brandão, M.; Heijungs, R.; Cowie, A.L. On Quantifying Sources of Uncertainty in the Carbon Footprint of Biofuels: Crop/Feedstock, LCA Modelling Approach, Land-Use Change, and GHG Metrics. Biofuel Res. J. 2022, 9, 1608–1616. [Google Scholar] [CrossRef]
- Arcas Lario, N.; Alcón Provencio, F. Contribución de Las Entidades de “Economía Social” a La Gestión Eficiente Del Agua Para Uso Agrícola: Situación En La Región de Murcia. Rev. Estud. Coop. 2007, 91, 7–33. [Google Scholar]
- Soto García, M.; Martínez Álvarez, V.; Martín Górriz, B. El Regadío en la Región de Murcia. Caracterización y Análisis Mediante Indicadores de Gestión; Sindicato Central de Regantes del Acueducto Tajo-Segura: Murcia, Spain, 2014; ISBN 978-84-697-0372-4. [Google Scholar]
- Grindlay Moreno, A.L.G.; Lizágarra Mollinedo, C.L. Regadío y territorio en la Región de Murcia: Evolución y perspectivas de futuro. Estud. Territ. 2012, 44, 281–298. [Google Scholar]
- Ben Abdallah, S.; Gallego-Elvira, B.; Imbernón-Mulero, A.; Martínez-Alvarez, V.; Maestre-Valero, J. Environmental Footprint of Organic and Conventional Grapefruit Production Irrigated with Desalinated Seawater in Spain. Sustain. Prod. Consum. 2023, 39, 326–335. [Google Scholar] [CrossRef]
- Porras Castillo, I. Técnicas de cultivo para la mejora de la calidad en limonero. Vida Rural 2005, 210, 24–28. [Google Scholar]
- García Lidón, Á.; del Río Conesa, J.A.; Porras Castillo, I.; Fuster Soler, M.D.; Ortuño Tomás, A. El Limón y sus Componentes Bioactivos; Técnica y de Estudios; Consejería de Agricultura, Agua y Medio Ambiente: Murcia, Spain, 2003; ISBN 84-688-2698-7. [Google Scholar]
- Porras Castillo, I. Nuevas tendencias en el cultivo el limonero. Agricultura 2007, 895, 285–293. [Google Scholar]
- Generalitat Valenciana. Patrones y Variedades de Cítricos; Generalitat Valenciana Consellería de Agricultura, Pesca y Alimentación: Valencia, Spain, 2001; ISBN V-1324-2001. [Google Scholar]
- Porras Castillo, I.; Pérez Tornero, O. La colección de limonero del IMIDA. Investig. IMIDA 2007, 1, 46–51. [Google Scholar]
- Soria Alfonso, A. La Fertirrigación del Limonero; Formación Agroalimentaria; Comunidad Autónoma de la Región de Murcia Consejería de Agricultura y Agua: Murcia, Spain, 2008; ISBN MU-1.004-2008. [Google Scholar]
- Ballestero, E. Economía de la Empresa Agraria y Alimentaria; Mundi-Prensa: Madrid, Spain, 2000; ISBN 978-84-7114-863-6. [Google Scholar]
- Mitrović, I.; Todorović, M.; Marković, M.; Mehmeti, A. Eco-Efficiency Analysis of Rainfed and Irrigated Maize Systems in Bosnia and Herzegovina. J. Water Clim. Chang. 2023, 14, 4489–4505. [Google Scholar] [CrossRef]
- Samuelson, P.A.; Nordhaus, W.D. Economía; McGraw-Hill Interamericana: Madrid, Spain, 2006; ISBN 978-84-481-5154-6. [Google Scholar]
- Ministerio de Medio Ambiente y Medio Rural y Marino. Guía Práctica de la Fertilización Racional de los Cultivos en España; Ministerio de Medio Ambiente y Medio Rural y Marino (MAGRAMA): Madrid, Spain, 2010; ISBN 978-84-491-0997-3. [Google Scholar]
- Lucas Espadas, A. Plagas y Enfermedades de Limón y Pomelo en la Región de Murcia; Formación agroalimentaria; Comunidad Autónoma de la Región de Murcia Consejería de Agricultura y Agua: Murcia, Spain, 2008; ISBN MU-981-2008. [Google Scholar]
- Yan, M.; Cheng, K.; Yue, Q.; Yan, Y.; Rees, R.M.; Pan, G. Farm and Product Carbon Footprints of China’s Fruit Production—Life Cycle Inventory of Representative Orchards of Five Major Fruits. Environ. Sci. Pollut. Res. 2016, 23, 4681–4691. [Google Scholar] [CrossRef]
- Ribal, J.; Ramírez-Sanz, C.; Estruch, V.; Clemente, G.; Sanjuán, N. Organic versus Conventional Citrus. Impact Assessment and Variability Analysis in the Comunitat Valenciana (Spain). Int. J. Life Cycle Assess. 2016, 22, 571–586. [Google Scholar] [CrossRef]
- Ingrao, C.; Matarazzo, A.; Tricase, C.; Clasadonte, M.T.; Huisingh, D. Life Cycle Assessment for Highlighting Environmental Hotspots in Sicilian Peach Production Systems. J. Clean. Prod. 2015, 92, 109–120. [Google Scholar] [CrossRef]
- Bartzas, G.; Vamvuka, D.; Komnitsas, K. Comparative Life Cycle Assessment of Pistachio, Almond and Apple Production. Inf. Process. Agric. 2017, 4, 188–198. [Google Scholar] [CrossRef]
- Rapa, M.; Ciano, S. A Review on Life Cycle Assessment of the Olive Oil Production. Sustainability 2022, 14, 654. [Google Scholar] [CrossRef]
- European Environment Agency. EMEP/EEA Air Pollution Emission Inventory Guidebook 2019. Technical Guidance to Prepare National Emission Inventories; EEA Report; Publications Office of the European Union: Luxembourg, 2019; ISBN 978-92-9213-806-6. [Google Scholar]
- The Intergovernmental Panel on Climate Change. Refinement to the 2006 IPCC Guidelines for National Greenhouse Gas Inventories; Calvo Buendia, E., Tanabe, K., Kranjc, A., Baasansuren, J., Fukuda, M., Ngarize, S., Osako, A., Pyrozhenko, Y., Shermanau, P., Federici, S., Eds.; IPCC: Geneva, Switzerland, 2019; ISBN 978-4-88788-232-4. [Google Scholar]
- Gazulla, C.; Raugei, M.; Fullana-i-Palmer, P. Taking a Life Cycle Look at Crianza Wine Production in Spain: Where Are the Bottlenecks? Int. J. Life Cycle Assess. 2010, 15, 330–337. [Google Scholar] [CrossRef]
- Bosco, S.; Di Bene, C.; Galli, M.; Remorini, D.; Massai, R.; Bonari, E. Greenhouse Gas Emissions in the Agricultural Phase of Wine Production in the Maremma Rural District in Tuscany, Italy. Ital. J. Agron. 2011, 6, 93–100. [Google Scholar] [CrossRef]
- Villanueva-Rey, P.; Vázquez-Rowe, I.; Moreira, M.T.; Feijoo, G. Comparative Life Cycle Assessment in the Wine Sector: Biodynamic vs. Conventional Viticulture Activities in NW Spain. J. Clean. Prod. 2014, 65, 330–341. [Google Scholar] [CrossRef]
- De Luca, A.I.; Falcone, G.; Iofrida, N.; Stillitano, T.; Strano, A.; Gulisano, G. Life Cycle Methodologies to Improve Agri-Food Systems Sustainability. Riv. Studi Sulla Sostenibilita 2015, 1, 135–150. [Google Scholar] [CrossRef]
- Ferrara, C.; De Feo, G. Life Cycle Assessment Application to the Wine Sector: A Critical Review. Sustainability 2018, 10, 395. [Google Scholar] [CrossRef]
- Martín-Górriz, B.; Martínez-Alvarez, V.; Maestre-Valero, J.F.; Gallego-Elvira, B. Influence of the Water Source on the Carbon Footprint of Irrigated Agriculture: A Regional Study in South-Eastern Spain. Agronomy 2021, 11, 351. [Google Scholar] [CrossRef]
- Machin Ferrero, L.M.; Wheeler, J.; Mele, F.D. Life Cycle Assessment of the Argentine Lemon and Its Derivatives in a Circular Economy Context. Sustain. Prod. Consum. 2022, 29, 672–684. [Google Scholar] [CrossRef]
- García García, J.; García García, B. Sustainability Assessment of Greenhouse Pepper Production Scenarios in Southeastern Spain. Agronomy 2022, 12, 1254. [Google Scholar] [CrossRef]
- Nemecek, T.; Antón, A.; Basset-Mens, C.; Gentil-Sergent, C.; Renaud-Gentié, C.; Melero, C.; Naviaux, P.; Peña, N.; Roux, P.; Fantke, P. Operationalising Emission and Toxicity Modelling of Pesticides in LCA: The OLCA-Pest Project Contribution. Int. J. Life Cycle Assess. 2022, 27, 527–542. [Google Scholar] [CrossRef]
- European Commission. COMMISSION RECOMMENDATION (EU) 2021/2279 on the Use of the Environmental Footprint Methods to Measure and Communicate the Life Cycle Environmental Performance of Products and Organisations; European Commission: Brussels, Belgium, 2021. [Google Scholar]
- García García, J. Estructura de Costes de las Orientaciones Productivas Agrícolas de la Región de Murcia: Frutales de Hueso y Cítricos; Técnica; Consejería de Agua, Agricultura, Ganadería y Pesca de la Región de Murcia: Murcia, Spain, 2018; ISBN MU-198-2018. [Google Scholar]
- Fernandez Zamudio, M.Á. Metodología-IVIA: Determinación Costes de Cultivo. Resultados Preliminares de Costes de Mandarino, Naranjo y Caqui; IVIA: Valencia, Spain, 2022. [Google Scholar]
- García García, J. Estructura de Costes de las Orientaciones Productivas Agrícolas de la Región de Murcia: Frutos Secos, Frutales de Pepita, Vid y Olivo; Técnica; Consejería de Agua, Agricultura, Ganadería y Pesca de la Región de Murcia: Murcia, Spain, 2019; ISBN MU 422-2019. [Google Scholar]
- Bessou, C.; Basset-Mens, C.; Tran, T. LCA Applied to Perennial Cropping Systems: A Review Focused on the Farm Stage. Int. J. Life Cycle Assess. 2013, 18, 340–361. [Google Scholar] [CrossRef]
- Sanjuan, N.; Úbeda, L.; Clemente, G.; Mulet, A. LCA of Integrated Orange Production in the Comunidad Valenciana (Spain). Int. J. Agric. Resour. Gov. Ecol. 2005, 4, 163–177. [Google Scholar]
- Cerutti, A.K.; Beccaro, G.L.; Bruun, S.; Bosco, S.; Donno, D.; Notarnicola, B.; Bounous, G. Life Cycle Assessment Application in the Fruit Sector: State of the Art and Recommendations for Environmental Declarations of Fruit Products. J. Clean. Prod. 2014, 73, 125–135. [Google Scholar] [CrossRef]
- Aguilera, E.; Guzmán, G.; Alonso, A. Greenhouse Gas Emissions from Conventional and Organic Cropping Systems in Spain. I. Herbaceous Crops. Agron. Sustain. Dev. 2015, 35, 713–724. [Google Scholar] [CrossRef]
- Lo Giudice, A.; Mbohwa, C.; Clasadonte, M.T.; Ingrao, C. Environmental Assessment of the Citrus Fruit Production in Sicily Using LCA. Ital. J. Food Sci. 2013, 25, 202–212. [Google Scholar]
| Fino Conventional | Verna Conventional | |
|---|---|---|
| CHARACTERISTICS | ||
| Useful life (years) | 25 | 30 |
| Plant spacing (m × m) | 7 × 5 | 7 × 5 |
| Yield in productive years (kg·ha−1) | 46,000 | 31,000 |
| Non-fresh marketable yield (industry) (%) | 20 | 17 |
| Non-productive years | 1 | 1 |
| Partially productive years | 4 | 5 |
| INPUTS IN PRODUCTIVE YEARS | ||
| Machinery hours (h·ha−1) | 14.25 | 13.75 |
| Diesel consumed by machinery (l·ha−1) | 136.96 | 131.06 |
| Fertilizers (N-P2O5-K2O-CaO-MgO) | (190-70-140-20-10) | (160-60-120-15-8) |
| Phosphoric acid (l·ha−1) | 84.10 | 72.10 |
| Ammonium nitrate (kg·ha−1) | 98.60 | 85.70 |
| Urea ammonium nitrate (l·ha−1) | 258.00 | 216.90 |
| Potassium nitrate (kg·ha−1) | 304.30 | 260.90 |
| Calcium nitrate (kg·ha−1) | 74.00 | 55.70 |
| Magnesium nitrate (kg·ha−1) | 62.60 | 50.00 |
| Fe chelates (kg·ha−1) | 17.15 | 14.30 |
| Humic and fulvic acids (l·ha−1) | 42.90 | 35.70 |
| Zn and Mn chelates (l·ha−1) | 6 | 6 |
| Amino acids (l·ha−1) | 4 | 4 |
| Phytosanitary treatments | ||
| Bacillus thuringiensis (kg·ha−1) | 1.50 | 1.50 |
| Neoseiulus californicus (nº insects·ha−1) | 1000 | 1000 |
| Sexual confusion traps (units·ha−1) | - | 30 |
| Paraffin oil (83%) (l·ha−1) | 60.00 | 60.00 |
| Spirotetramat (10%) (l·ha−1) | 1.80 | 1.80 |
| Piriproxifen (10%) (l·ha−1) | 1.50 | 1.50 |
| Hexitiazox (10%) (l·ha−1) | 0.60 | 0.60 |
| Glyphosate (l·ha−1) | 8.00 | 8.00 |
| Irrigation | ||
| Water (m3·ha−1) | 5800 | 5200 |
| Fertirrigation electricity (kWh·ha−1) | 714.70 | 640.13 |
| Gross Production | Year 1 | Year 2 | Year 3 | Year 4 | Year 5 | Year 6 |
|---|---|---|---|---|---|---|
| Coefficients for Fino conventional (%) | 0 | 8 | 25 | 50 | 80 | Adult |
| Coefficients for Verna conventional (%) | 0 | 8 | 20 | 40 | 60 | 80 |
| Variable Costs | Year 1 | Year 2 | Year 3 | Year 4 | Year 5 | Year 6 |
|---|---|---|---|---|---|---|
| Coefficients for Fino conventional (%) | 20 | 35 | 60 | 75 | 85 | Adult |
| Coefficients for Verna conventional (%) | 20 | 30 | 45 | 65 | 80 | 90 |
| Fino Conventional | Verna Conventional | |
|---|---|---|
| INFRASTRUCTURE | ||
| Preparation and planting | ||
| Diesel (g·kg−1) | 0.2072 | 0.2550 |
| Lubricant oil (g·kg−1) | 0.0002 | 0.0003 |
| Manure (kg·kg−1) | 0.0151 | 0.0186 |
| Local transportation (kg·km·kg−1) | 0.7538 | 0.9277 |
| Irrigation reservoir | ||
| Diesel (g·kg−1) | 0.3396 | 0.5016 |
| Lubricant oil (g·kg−1) | 0.0004 | 0.0005 |
| HDPE sheet (g·kg−1) | 0.1164 | 0.1719 |
| Local transportation (kg·km·kg−1) | 0.0058 | 0.0086 |
| Irrigation equipment | ||
| Iron (mg·kg−1) | 8.3754 | 12.3689 |
| Steel (mg·kg−1) | 0.8375 | 1.2369 |
| Copper (mg·kg−1) | 2.5126 | 3.7107 |
| Brass (mg·kg−1) | 0.1675 | 0.2474 |
| PVC pipe (mg·kg−1) | 6.7003 | 9.8951 |
| LDPE pipe (mg kg−1) | 0.3350 | 0.4948 |
| Polyamide (mg·kg−1) | 0.5025 | 0.7421 |
| HDPE tanks (mg·kg−1) | 7.5378 | 11.1320 |
| Local transportation (kg·km·kg−1) | 0.0013 | 0.0020 |
| Irrigation network | ||
| LDPE (g·kg−1) | 0.4336 | 0.6403 |
| Local transportation (kg·km·kg−1) | 0.0217 | 0.0320 |
| INPUTS/SUPPLIES | ||
| Agricultural machinery | ||
| Diesel (g·kg−1) | 2.6055 | 3.6819 |
| Lubricant oil (g·kg−1) | 0.0028 | 0.0040 |
| Fertilizers | ||
| Phosphoric acid (g·kg−1) | 3.0767 | 3.8954 |
| Ammonium nitrate (g N·kg−1) | 0.7892 | 1.0130 |
| Urea ammonium nitrate (g N·kg−1) | 2.2653 | 2.8124 |
| Potassium nitrate (g N·kg−1) | 0.9641 | 1.2208 |
| Calcium nitrate (g N·kg1) | 0.2891 | 0.3213 |
| Magnesium nitrate (g N·kg−1) | 0.2704 | 0.3190 |
| Humic and fulvic acids (g N·kg−1) | 0.0245 | 0.0241 |
| Local transportation (kg·km·kg−1) | 1.0275 | 1.3360 |
| Pesticides | ||
| Paraffin oil (83%) (g·kg−1) | 1.1387 | 1.6816 |
| Spirotetramat (10%) (g·kg−1) | 0.0041 | 0.0091 |
| Piriproxifen (10%) (g·kg−1) | 0.0034 | 0.0051 |
| Hexitiazox (10%) (g·kg−1) | 0.0014 | 0.0020 |
| Glyphosate (g·kg−1) | 0.0659 | 0.0972 |
| Local transportation (kg·km·kg−1) | 0.0936 | 0.1383 |
| Irrigation | ||
| Electricity (kwh·kg−1) | 0.0163 | 0.0216 |
| Fino Conventional | Verna Conventional | |||
|---|---|---|---|---|
| Absolute Annual Costs (EUR·ha−1) | Relative Costs (%) | Absolute Annual Costs (EUR·ha−1) | Relative Costs (%) | |
| Fixed costs (FCs) | ||||
| Warehouse for equipment | 41 | 0.42% | 41 | 0.45% |
| Preparation and planting | 144 | 1.49% | 126 | 1.39% |
| Irrigation reservoir | 86 | 0.89% | 75 | 0.83% |
| Irrigation equipment | 89 | 0.92% | 89 | 0.98% |
| Irrigation network | 193 | 2.00% | 193 | 2.13% |
| Various materials | 25 | 0.26% | 25 | 0.28% |
| Total fixed costs | 578 | 5.98% | 549 | 6.07% |
| Variable costs (VCs) | ||||
| Insurance | 747 | 7.73% | 522 | 5.77% |
| Pruning | 1131 | 11.70% | 1028 | 11.36% |
| Machinery | 650 | 6.72% | 630 | 6.96% |
| Fertilizers | 1014 | 10.49% | 855 | 9.45% |
| Phytosanitary products | 504 | 5.21% | 504 | 5.57% |
| Biotechnological products | 330 | 3.41% | 488 | 5.39% |
| Herbicides | 57 | 0.59% | 57 | 0.63% |
| Maintenance of infrastructure | 125 | 1.29% | 118 | 1.30% |
| Irrigation energy | 196 | 2.03% | 175 | 1.93% |
| Irrigation water | 2060 | 21.31% | 1847 | 20.41% |
| Permanent staff | 2276 | 23.54% | 2276 | 25.15% |
| Total variable costs | 9090 | 94.02% | 8500 | 93.93% |
| Total costs (TCs) | 9668 | 100.00% | 9049 | 100.00% |
| Gross lemon cost * (EUR·kg−1) | 0.210 | 0.292 | ||
| Fresh lemon cost ** (EUR·kg−1) | 0.263 | 0.352 | ||
| Compensated gross lemon cost *** (EUR·kg−1) | 0.222 | 0.307 | ||
| Compensated fresh lemon cost **** (EUR·kg−1) | 0.278 | 0.370 | ||
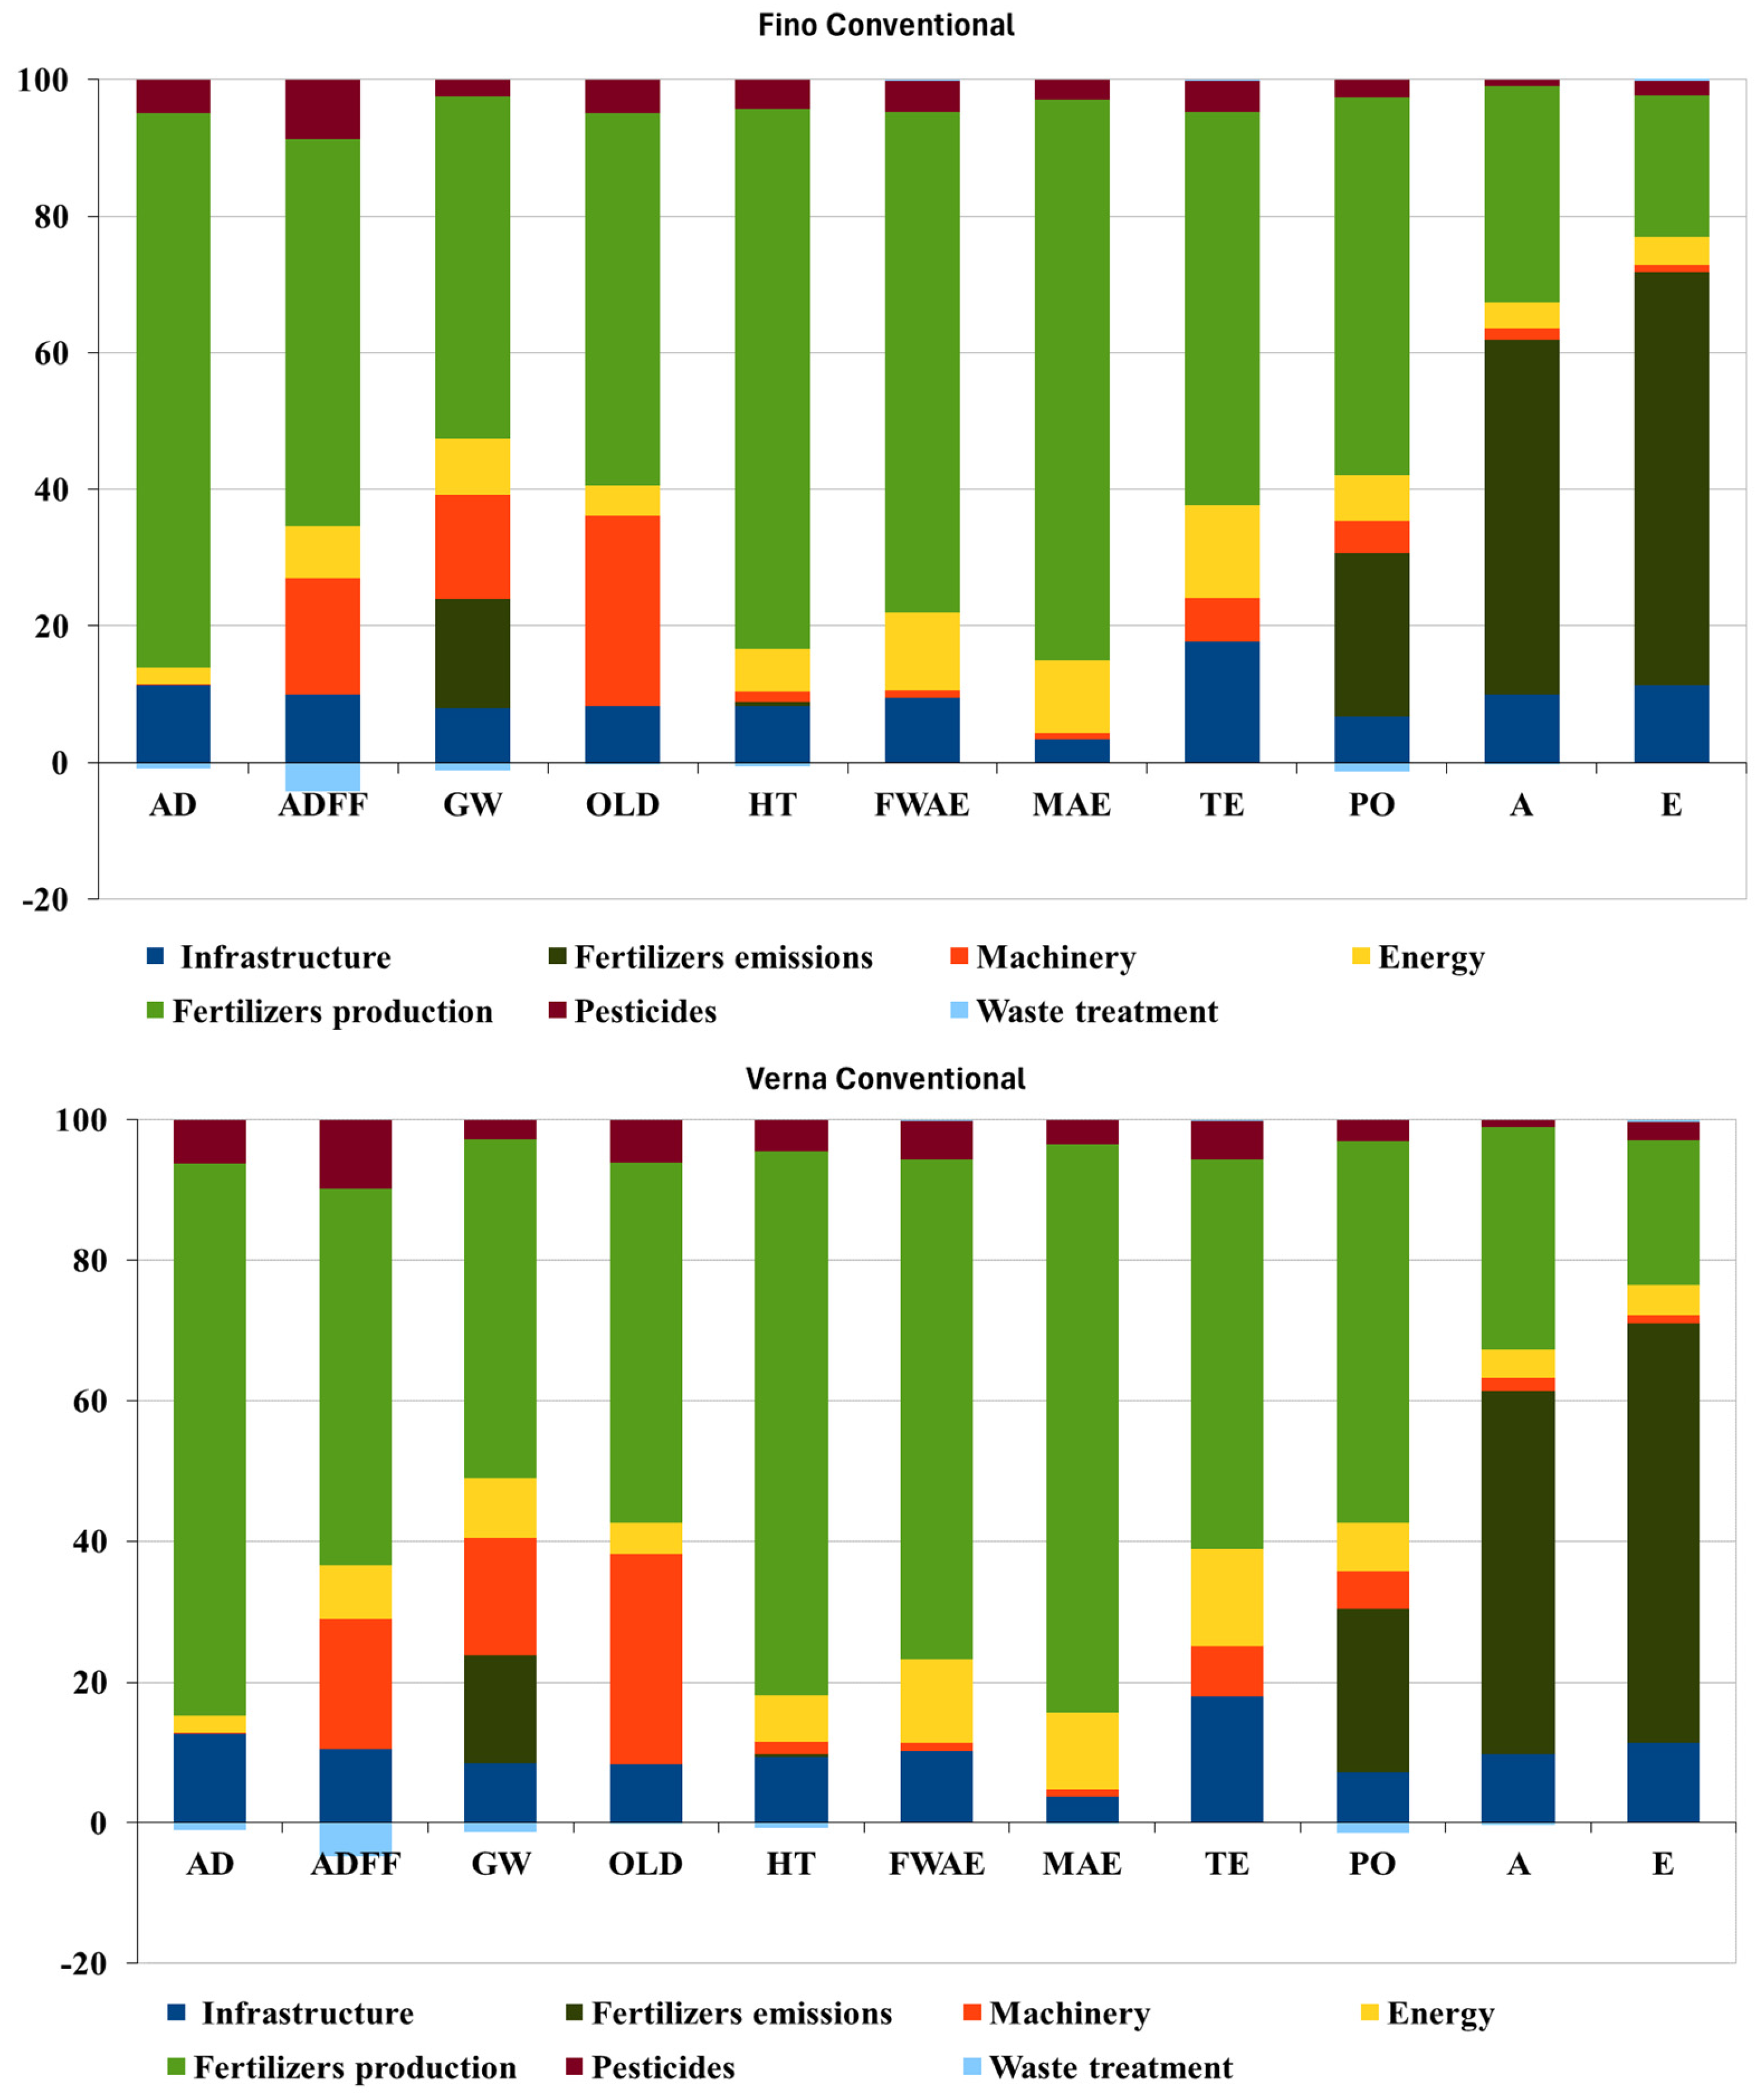
| Impact Category | Absolute Values | Infrastructure | Machinery | Energy | Fertilizer Production | Fertilizer Emissions | Pesticides | Waste Treatment |
|---|---|---|---|---|---|---|---|---|
| Fino Conventional | Contributions (%) | |||||||
| AD (kg Sb-eq) | 6.89 × 10⁻⁷ | 11.42 | 0.21 | 2.41 | 81.94 | 0.00 | 4.94 | −0.91 |
| ADFF (MJ) | 7.73 × 10⁻¹ | 10.29 | 17.81 | 8.00 | 59.05 | 0.00 | 9.05 | −4.18 |
| GW (kg CO2-eq) | 6.30 × 10⁻² | 8.10 | 15.42 | 8.30 | 50.68 | 16.12 | 2.47 | −1.10 |
| OLD (kg CFC-11-eq) | 6.48 × 10⁻⁹ | 8.25 | 27.99 | 4.43 | 54.63 | 0.00 | 4.89 | −0.18 |
| HT (kg 1,4-DB-eq) | 4.64 × 10⁻² | 8.38 | 1.60 | 6.26 | 79.55 | 0.54 | 4.29 | −0.61 |
| FWAE (kg 1,4-DB-eq) | 2.21 × 10⁻² | 9.56 | 1.07 | 11.31 | 73.24 | 0.00 | 4.70 | 0.12 |
| MAE (kg 1,4-DB-eq) | 8.31 × 101 | 3.40 | 0.92 | 10.61 | 82.17 | 0.00 | 2.97 | −0.06 |
| TE (kg 1,4-DB-eq) | 1.79 × 10⁻⁴ | 17.71 | 6.43 | 13.52 | 57.51 | 0.00 | 4.71 | 0.12 |
| PO (kg C2H4-eq) | 2.12 × 10⁻⁵ | 6.79 | 4.80 | 6.81 | 55.89 | 24.31 | 2.72 | −1.30 |
| A (kg SO2-eq) | 1.02 × 10⁻³ | 9.90 | 1.65 | 3.82 | 31.78 | 52.14 | 0.93 | −0.21 |
| E (kg PO4-eq) | 2.17 × 10⁻⁴ | 11.37 | 1.04 | 4.09 | 20.79 | 60.23 | 2.20 | 0.29 |
| Overall contribution (%) | 9.56 | 7.18 | 7.23 | 58.84 | 13.94 | 3.99 | −0.73 | |
| Verna conventional | ||||||||
| AD (kg Sb-eq) | 8.81 × 10⁻⁷ | 12.74 | 0.23 | 2.49 | 79.24 | 0.00 | 6.35 | −1.05 |
| ADFF (MJ) | 1.01 × 100 | 11.07 | 19.19 | 8.07 | 56.14 | 0.00 | 10.22 | −4.70 |
| GW (kg CO2-eq) | 8.10 × 10⁻² | 8.54 | 16.95 | 8.54 | 48.87 | 15.49 | 2.87 | −1.26 |
| OLD (kg CFC-11-eq) | 8.60 × 10⁻⁹ | 8.43 | 29.81 | 4.41 | 51.42 | 0.00 | 6.12 | −0.20 |
| HT (kg 1,4-DB-eq) | 5.87 × 10⁻² | 9.35 | 1.79 | 6.55 | 77.98 | 0.52 | 4.52 | −0.71 |
| FWAE (kg 1,4-DB-eq) | 2.81 × 10⁻² | 10.23 | 1.18 | 11.75 | 71.19 | 0.00 | 5.51 | 0.14 |
| MAE (kg 1,4-DB-eq) | 1.06 × 10² | 3.71 | 1.02 | 11.00 | 80.87 | 0.00 | 3.46 | −0.06 |
| TE (kg 1,4-DB-eq) | 2.30 × 10⁻⁴ | 17.96 | 7.07 | 13.91 | 55.46 | 0.00 | 5.46 | 0.13 |
| PO (kg C2H4-eq) | 2.70 × 10⁻⁵ | 7.36 | 5.32 | 7.06 | 55.09 | 23.55 | 3.12 | −1.50 |
| A (kg SO2-eq) | 1.28 × 10⁻³ | 9.88 | 1.86 | 4.02 | 31.81 | 51.63 | 1.05 | −0.24 |
| E (kg PO4-eq) | 2.73 × 10⁻⁴ | 11.37 | 1.17 | 4.31 | 20.58 | 59.66 | 2.57 | 0.34 |
| Overall contribution (%) | 10.06 | 7.78 | 7.47 | 57.15 | 13.71 | 4.66 | −0.83 | |
| Scenarios | Fino | Verna |
|---|---|---|
| Total costs (EUR ha−1) | ||
| S0 (conventional) | 9668 | 9049 |
| S1 | 10,599 | 9883 |
| Relative difference * (%) | ||
| S0 vs. S1 | −9.63 | −9.22 |
| Lemon Fino PEI | Scenario 0 (S0) | Scenario 2 (S2) | Scenario 3 (S3) | Scenario 4 (S4) | Scenario 5 (S5) |
|---|---|---|---|---|---|
| AD (kg Sb-eq) | 6.89 × 10⁻⁷ | 8.76 × 10⁻⁷ | 1.01 × 10⁻⁶ | 6.89 × 10⁻⁷ | 6.89 × 10⁻⁷ |
| ADFF (MJ) | 7.73 × 10⁻¹ | 1.47 × 100 | 1.96 × 100 | 7.73 × 10⁻¹ | 7.73 × 10⁻¹ |
| GW (kg CO2-eq) | 6.30 × 10⁻² | 1.22 × 10⁻¹ | 1.63 × 10⁻¹ | 6.30 × 10⁻² | 6.30 × 10⁻² |
| OLD (kg CFC-11-eq) | 6.48 × 10⁻⁹ | 9.72 × 10⁻⁹ | 1.20 × 10⁻⁸ | 6.48 × 10⁻⁹ | 6.48 × 10⁻⁹ |
| HT (kg 1,4-DB-eq) | 4.64 × 10⁻² | 7.92 × 10⁻² | 1.02 × 10⁻¹ | 4.64 × 10⁻² | 4.64 × 10⁻² |
| FWAE (kg 1,4-DB-eq) | 2.21 × 10⁻² | 5.03 × 10⁻² | 7.00 × 10⁻² | 2.25 × 10⁻² | 2.32 × 10⁻² |
| MAE (kg 1,4-DB-eq) | 8.31 × 101 | 1.82 × 10² | 2.52 × 10² | 8.31 × 101 | 8.31 × 101 |
| TE (kg 1,4-DB-eq) | 1.79 × 10⁻⁴ | 4.52 × 10⁻⁴ | 6.42 × 10⁻⁴ | 1.85 × 10⁻⁴ | 1.85 × 10⁻⁴ |
| PO (kg C2H4-eq) | 2.12 × 10⁻⁵ | 3.75 × 10⁻⁵ | 4.89 × 10⁻⁵ | 2.12 × 10⁻⁵ | 2.12 × 10⁻⁵ |
| A (kg SO2-eq) | 1.02 × 10⁻³ | 1.47 × 10⁻³ | 1.77 × 10⁻³ | 1.02 × 10⁻³ | 1.02 × 10⁻³ |
| E (kg PO4-eq) | 2.17 × 10⁻⁴ | 3.18 × 10⁻⁴ | 3.88 × 10⁻⁴ | 2.17 × 10⁻⁴ | 2.17 × 10⁻⁴ |
| Relative Difference (%) | S0 vs. S2 | S0 vs. S3 | S0 vs. S4 | S0 vs. S5 | |
| AD | −27.21 | −46.21 | - | - | |
| ADFF | −90.31 | −153.45 | - | - | |
| GW | −93.70 | −159.24 | - | - | |
| OLD | −49.98 | −84.92 | - | - | |
| HT | −70.71 | −120.13 | −0.0017 | −0.0020 | |
| FWAE | −127.49 | −216.71 | −1.8851 | −4.9225 | |
| MAE | −119.56 | −203.25 | −0.0003 | −0.0001 | |
| TE | −152.30 | −258.91 | −3.1766 | −3.3457 | |
| PO | −76.86 | −130.61 | - | - | |
| A | −43.65 | −73.90 | - | - | |
| E | −46.40 | −78.72 | - | - |
| Lemon Verna PEI | Scenario 0 (S0) | Scenario 2 (S2) | Scenario 3 (S3) | Scenario 4 (S4) | Scenario 5 (S5) |
|---|---|---|---|---|---|
| AD (kg Sb-eq) | 8.81 × 10⁻⁷ | 1.13 × 10⁻⁶ | 1.31 × 10⁻⁶ | 8.81 × 10⁻⁷ | 8.81 × 10⁻⁷ |
| ADFF (MJ) | 1.01 × 100 | 1.95 × 100 | 2.61 × 100 | 1.01 × 100 | 1.01 × 100 |
| GW (kg CO2-eq) | 8.10 × 10⁻² | 1.60 × 10⁻¹ | 2.16 × 10⁻¹ | 8.10 × 10⁻² | 8.10 × 10⁻² |
| OLD (kg CFC-11-eq) | 8.60 × 10⁻⁹ | 1.29 × 10⁻⁸ | 1.60 × 10⁻⁸ | 8.60 × 10⁻⁹ | 8.60 × 10⁻⁹ |
| HT (kg 1,4-DB-eq) | 5.87 × 10⁻² | 1.03 × 10⁻¹ | 1.34 × 10⁻¹ | 5.87 × 10⁻² | 5.87 × 10⁻² |
| FWAE (kg 1,4-DB-eq) | 2.81 × 10⁻² | 6.59 × 10⁻² | 9.27 × 10⁻² | 2.87 × 10⁻² | 2.97 × 10⁻² |
| MAE (kg 1,4-DB-eq) | 1.06 × 10² | 2.39 × 10² | 3.34 × 10² | 1.06 × 10² | 1.06 × 10² |
| TE (kg 1,4-DB-eq) | 2.30 × 10⁻⁴ | 5.95 × 10⁻⁴ | 8.55 × 10⁻⁴ | 2.38 × 10⁻⁴ | 2.39 × 10⁻⁴ |
| PO (kg C2H4-eq) | 2.70 × 10⁻⁵ | 4.88 × 10⁻⁵ | 6.44 × 10⁻⁵ | 2.70 × 10⁻⁵ | 2.70 × 10⁻⁵ |
| A (kg SO2-eq) | 1.28 × 10⁻³ | 1.88 × 10⁻³ | 2.30 × 10⁻³ | 1.28 × 10⁻³ | 1.28 × 10⁻³ |
| E (kg PO4-eq) | 2.73 × 10⁻⁴ | 4.07 × 10⁻⁴ | 5.02 × 10⁻⁴ | 2.73 × 10⁻⁴ | 2.73 × 10⁻⁴ |
| Relative Difference (%) | S0 vs. S2 | S0 vs. S3 | S0 vs. S4 | S0 vs. S5 | |
| AD | −28.44 | −48.72 | - | - | |
| ADFF | −92.10 | −157.74 | - | - | |
| GW | −97.47 | −166.94 | - | - | |
| OLD | −50.38 | −86.28 | - | - | |
| HT | −74.76 | −128.04 | −0.0020 | −0.0024 | |
| FWAE | −134.11 | −229.70 | −2.1859 | −5.7047 | |
| MAE | −125.55 | −215.02 | −0.0003 | −0.0001 | |
| TE | −158.83 | −272.03 | −3.6499 | −3.8442 | |
| PO | −80.60 | −138.04 | - | - | |
| A | −45.94 | −78.69 | - | - | |
| E | −49.24 | −84.33 | - | - |
Disclaimer/Publisher’s Note: The statements, opinions and data contained in all publications are solely those of the individual author(s) and contributor(s) and not of MDPI and/or the editor(s). MDPI and/or the editor(s) disclaim responsibility for any injury to people or property resulting from any ideas, methods, instructions or products referred to in the content. |
© 2024 by the authors. Licensee MDPI, Basel, Switzerland. This article is an open access article distributed under the terms and conditions of the Creative Commons Attribution (CC BY) license (https://creativecommons.org/licenses/by/4.0/).
Share and Cite
García Castellanos, B.; García García, B.; García García, J. Economic and Environmental Assessment of Conventional Lemon Cultivation: The Case of Southeastern Spain. Agronomy 2024, 14, 1842. https://doi.org/10.3390/agronomy14081842
García Castellanos B, García García B, García García J. Economic and Environmental Assessment of Conventional Lemon Cultivation: The Case of Southeastern Spain. Agronomy. 2024; 14(8):1842. https://doi.org/10.3390/agronomy14081842
Chicago/Turabian StyleGarcía Castellanos, Begoña, Benjamín García García, and José García García. 2024. "Economic and Environmental Assessment of Conventional Lemon Cultivation: The Case of Southeastern Spain" Agronomy 14, no. 8: 1842. https://doi.org/10.3390/agronomy14081842
APA StyleGarcía Castellanos, B., García García, B., & García García, J. (2024). Economic and Environmental Assessment of Conventional Lemon Cultivation: The Case of Southeastern Spain. Agronomy, 14(8), 1842. https://doi.org/10.3390/agronomy14081842