Abstract
Despite the wealth of studies on benzothiadiazole (BTH) and its capacity to modulate grape polyphenol metabolism, comprehensive data detailing polyphenol accumulation at various grape growth stages remain scarce. Therefore, the present study utilized pre-harvest (at 21 days after flowering) canopy-applied BTH (50 mg/L) on Cabernet Gernischt and Cabernet Franc grapes to investigate the physicochemical and polyphenolic changes during grape maturation. The results showed that BTH treatment significantly affected the accumulation of total phenols, flavonoids, flavanols, anthocyanins, and tannins. Concurrently, it induced an increase in colorimetric parameters (CIRG, L*, b*, a*, and C*ab), resulting in the treated grapes exhibiting a greater color intensity and enhanced red-bluish colorimetric characteristics. Moreover, the BTH treatment amplified the anthocyanin content in the grapes, with the levels of petunidin-3-O-glucoside and peonidin-3-O-glucoside exhibiting remarkable increases, particularly in the Cabernet Franc grape. Notably, the content of peonidin-3-O-glucoside even surpassed that of malvidin-3-O-glucoside throughout the growth stages, indicating significant advantages in the treated samples. Additionally, the levels of flavanol, flavonols, phenolic acids, and stilbenes experienced a significant boost post-treatment. In conclusion, the application of BTH treatment can effectively enhance the accumulation of polyphenols and intensify the color of Cabernet Gernischt and Cabernet Franc grapes, thereby significantly improving the overall quality of wine grapes and ensuring the production of higher-quality wines. The research findings will serve as a theoretical foundation and provide scientific data for the appropriate utilization of BTH in wine grape cultivation.
1. Introduction
Grape quality is determined by their physicochemical, aroma, and polyphenolic parameters, with polyphenols playing a key role in the sensory attributes of grapes and their wines, affecting the color, taste, and primary aromatic complex [1]. Phenols are of great importance in plants, because they help them to resist biotic and abiotic stresses [2]; moreover, they enhance the sensory and nutritional properties of fruits and corresponding products [3]. In addition, polyphenols have cardioprotective [4], anti-inflammatory, anti-cancer [5], anti-aging, and anti-microbial properties, as well as modulatory effects on the immune system [6,7,8], which are considered beneficial for human health. Therefore, the study of polyphenols has been the focus of ecological science.
Several factors have been found to influence the composition and concentration of grape polyphenols, and these factors include the viticultural environmental climate [9,10], grape variety [11,12], ripening stage [12], light conditions [13], training system [14], and the application of exogenous elicitors [6,7]. Among these, the application of exogenous plant elicitors as an environmentally acceptable treatment approach has garnered substantial attention in recent years for its ability to manipulate plant secondary metabolism to enhance polyphenol content and improve disease resistance, thereby improving quality in fruit, such as pepper [15], potato [16], cucumber [17], navel orange [18], and plum [19].
Among elicitors, benzothiadiazole (BTH), as a prototypical plant elicitor, has been extensively studied for its role in enhancing acquired resistance, improving disease resistance, and regulating secondary metabolism in fruit. For example, Xu et al. [20] found that BTH enhanced resistance to downy blight (Peronophythora litchi) in litchi fruit and significantly affected the accumulation of metabolites post-treatment. Similar results have been observed in bananas [21], apples [22], and melons [23]. BTH has also been found to effectively induce the activity of secondary metabolism-related enzymes in fruits such as dragon fruit [24], peach [25], and papaya [26]. Moreover, BTH has induced the activation of enzymes related to anthocyanin metabolism. For example, post-harvest BTH treatment in strawberries increased the anthocyanin content and enzymes (such as shikimate dehydrogenase, SKDH; tyrosine ammonia lyase, TAL; dihydroflavonol 4-reductase, DFR; glucose-6-phosphate dehydrogenase, G6PDH; phenylalanine ammonia-lyase, PAL; cinnamate-4-hydroxylase, C4H; and 4-coumaroyl-CoA ligase, 4CL) [27].
Although there have been some reports on the use of BTH to modulate plant polyphenols, research on grapes, particularly Vitis vinifera for wine grapes, remains focused on specific growth stages (such as veraison or ripening stages) [28,29,30]. Moreover, due to differences in grape varieties and treatment methods, the effects of BTH application have shown varying degrees of efficacy. For example, previous studies have demonstrated that the pre-harvest application of 50 mg/L BTH on Merlot and Syrah grape berries resulted in a significant increase in anthocyanin content by 7.29% and 6.86%, flavonols by 32.20% and 11.75%, and tannins by 25.64% and 4.99%, respectively, indicating the promotion of phenolic compound accumulation in grapes through BTH treatment, with variations observed depending on the grape variety [31]. Additionally, other research has shown that treating Monastrell grapes with a concentration of 40.5 mg/L BTH led to an elevation in total anthocyanin concentration, as well as total polyphenol content [32]. In a field study conducted on Merlot berries, Iriti et al. [33] also discovered that this treatment increased both anthocyanin and proanthocyanidin content, particularly resulting in a remarkable enhancement of the proanthocyanidin fraction by up to 36%. However, conversely, Wang et al. [34] observed a decrease in polyphenol content compared to the control group when treating Merlot with 40.5 mg/L BTH. Our previous studies have indicated that pre-harvest treatment of Cabernet Gernischt and Cabernet Franc with a dosage (50 mg/L) of BTH significantly increased the polyphenol content in the grapes. However, comprehensive data on the accumulation of related polyphenols at different growth stages of grapes are still lacking. This information is crucial for a deeper understanding of the role of BTH in regulating the quality of polyphenols in wine grapes and necessitates specific investigative studies.
Therefore, to further clarify the impact of BTH treatment on Cabernet Gernischt and Cabernet Franc grapes, this study sprayed BTH on the grape canopy before grape harvesting and then collected samples regularly during grape ripening to analyze the physical and chemical parameters and polyphenol content, monitor the dynamic changes in anthocyanins and non-anthocyanins polyphenols, and explore the potential mechanisms of BTH treatment on the color characteristics, polyphenol accumulation, and metabolism of Cabernet Gernischt and Cabernet Franc grapes. This study will provide a theoretical basis and scientific data for the appropriate application of BTH in wine grape cultivation.
2. Materials and Methods
2.1. Vineyard Location, Grapevine Treatments, and Samples
The Cabernet Gernischt and Cabernet Franc grapes were harvested (from early June to the end of September 2022) during the 2022 growing season in a commercial vineyard located at Mogao Winery (Wuwei City, Gansu Province, northwest China, 36°46′–38°09′ N). The vineyard experiences an average annual temperature of 10 °C and receives an annual rainfall of 191 mm, the frost-free period lasts for 180 days, and the annual sunshine hours exceed 2724.8 h. The soil is composed of sandy loam with an average pH range of between 5.5 and 7.0. This study was performed on 9-year-old vines arranged in an east–west orientation with between-row and within-row spacing of 3 × 1 m.
Referring to studies by Iriti et al. [33] and Salifu et al. [35] on the application of BTH, this study adjusted the spraying method of BTH to canopy application. The experiment was arranged in a completely randomized block system with control and BTH treatment. One block included 10 grape vine plants uniquely pruned. Two untreated rows included between sample vines served as a physical barrier, effectively mitigating the risk of contamination. The BTH treatment was administered using 50 mg/L of BTH with Tween 80 as a surfactant. To ensure complete dissolution, a small amount of hot water (approximately 100 °C) was added during the configuration. The control vines were treated solely with aqueous Tween 80. The aqueous solutions were applied to the whole canopy of grapevine using a high-pressure sprayer, which applied approximately 15 L of solution to each vine. Treatments were administered on 23 June (21 days after flowering, DAF), 2022.
The initial sampling of the grape berries started at 21 DAF, and subsequent sampling times were 28, 42, 70, 84, 98, and 112 DAF, respectively. The samples comprised approximately 100 clusters (randomly selected from the upper, middle, and lower positions of the shaded and sunny surfaces of each grape cluster) in good sanitary conditions. Subsequently, the samples were collected and transported to the laboratory. The berries were destemmed, divided into small portions, individually wrapped in aluminum foil, and then rapidly frozen in liquid nitrogen before being stored at −80 °C until further use.
2.2. Reagents and Chemicals
BTH, Tween 80, acetonitrile, formic acid, and methanol are all of HPLC quality grade (Shanghai Yuanye Biotechnology Co., Ltd., Shanghai, China); Anhydrous ethanol (HPLC grade, Chengdu Cologne Chemical Co., Ltd., Chengdu, China); Distilled water (Guangzhou Watsons Food and Beverage Co., Ltd., Guangzhou, China), other experimental reagents (Damao Chemical Reagent Factory, Tianjin, China and Komio Chemical Co., Ltd., Tianjin, China).
The anthocyanins and non-anthocyanins compound standards were obtained from Sigma-Aldrich (St. Louis, MO, USA). All of the chemicals used in this study were high-purity compounds with a chromatographic purity above 97%.
2.3. Analysis of Grape Juice Physical and Chemical Parameters
The weight of the berries was measured in g/100 g randomly selected berries (100-berries weight, 100-BW). The berries were deseeded, manually pressed, and centrifuged (H2050R, Hunan Xiangyi Laboratory Instrument Development Co., Ltd., Changsha, China) at 8000 r/min for 10 min to obtain a clear juice. The juice was then analyzed for (TSS) total soluble solids (°Brix) using a PAL-1 pocket refractometer (Atago, Tokyo, Japan) and for pH using a pH meter (Inesa, Shanghai, China). The reducing sugars (RS) and titratable acidity (TA) of the berries were measured according to the National Standard of the People’s Republic of China (GB/T 15038-2006).
2.4. Analysis of Colorimetric Indexes in Grapes
The grape color was assessed via the CIELab parameters (L*, a*, b*, C*ab, h*, and ΔE*ab). Absorbance measurements were prepared using 2 mm path length glass cells in the TU-1810 UV-visible spectrophotometer (Beijing, China). Distilled water was used as the blank. The CIELab parameters were determined by measuring the transmittance of the sample (grape juice) every 1 nm from 400 to 700 nm using the D65 illuminant and a 10° observer angle. The color index of the red grapes (CIRG) was determined using the following formula: CIRG = [(180 − h*)/(L* + C*ab)] [36].
2.5. Analysis of Phenols in Grapes by Spectrophotometry
The determination of phenols refers to the method proposed by Cao et al. [27] and Gómez-Plaza et al. [29] and has been adjusted accordingly. The specific method is as follows:
Phenols extraction: Skin powder of the berries (0.5 g) was mixed with 5 mL of acidified methanol (1 mol/L, (HCl):(methanol):(water) = 1:80:19, v/v/v), extracted by ultrasound (F-100S, Shenzhen Fuyang Technology Group Co., Ltd., Shenzhen, China) at 25 °C for 30 min, then the powder was centrifuged at 7500× g at a low temperature for 15 min, the supernatant was collected, acidified methanol solution was added to the residue, and extracted according to the above process, which was repeated 3 times, the extraction solutions were combined, and stored and set aside at −20 °C for later use.
The sampling amount of seed powder of the berries was 0.25 g, and the rest were extracted using the same method as that used in the skin powder of berries.
Determination of total phenols (TP): A total of 0.1 mL of the diluted sample was mixed with 6 mL of water and 0.5 mL of Folin–Ciocalteu reagent thoroughly in a 10 mL volumetric flask, and then 1.5 mL of Na2CO3 solution (17%) was added. After being left at room temperature for 2 h, the absorbance was measured at 765 nm and the total phenolic content was calculated using gallic acid. The standard curve equation was y = 0.0011x + 0.1256, R2 = 0.9991.
Determination of total flavonoids (TFD): A total of 0.4 mL of the grape sample (diluted 20 times) was mixed with 7 mL of methanol solution (30%), and 0.3 mol/L AlCl3 solution was added. Finally, 2 mL of NaOH solution (1 mol/L) was added and shook well, then, its absorbance was measured at 510 nm. The standard curve equation was y = 0.0028x + 0.0065, R2 = 0.9901.
Determination of total flavanols (TFL): A total of 0.3 mL of sample solution (diluted 5 times) was mixed with 9 mL of p-DMACA (0.1% p-DMACA in 1 mol/L HCl-methanol solution) in the test tube. The mixture was thoroughly mixed and allowed to react for 10 min. Subsequently, a UV-vis spectrophotometer was used to measure the absorbance value at 640 nm. The standard curve equation was y = 0.0123x + 0.0128, R2 = 0.9992.
Determination of total anthocyanins (TAN): TAN was determined using the pH differential method. Specifically, 0.5 mL of grape sample was transferred into a 10 mL volumetric flask and mixed with pH 1.0 buffer (0.2 mol/L KCl-0.2 mol/L HCl, 25:67 v/v) and pH 4.5 buffer (0.2 mol/L CH3COONa-0.2 mol/L acetic acid, 1:1 v/v), respectively, before measuring the absorbance at wavelengths of 520 nm and 700 nm using a UV-vis spectrophotometer for the respective solutions. The content of TAN was then calculated using the following equation:
where A = (A520 − A700)pH1.0 − (A520 − A700)pH4.5; M is the molecular weight for malvidin-3-O-glucoside (493.2 g/mol); DF is the dilution factor; ɛ is the extinction coefficient (28,000 L/cm·mol); and L is the optical path length (1 cm).
The determination of total tannins (TT) involved mixing 0.1 mL of the sample with 7 mL of water, followed by the addition of 0.5 mL of Folin–Denis solution and finally, adding 1 mL of saturated sodium carbonate solution to make a total volume up to 10 mL. The absorbance at 760 nm was measured. The standard curve equation was y = 0.0006x + 0.0728, R2 = 0.9998.
2.6. Analysis of Anthocyanin Compounds in Grapes by UHPLC-QqQ-MS/MS
Grape anthocyanins were determined following the method described by Kyraleou et al. [37]. Twenty berries per treatment were randomly selected from various clusters. The grapes were meticulously peeled using a scalpel, and, subsequently, the skins were finely pulverized into a powder under the controlled freezing conditions of liquid nitrogen. A total of 0.5 g of skin powder was mixed with 10 mL of solution (formic acid:methanol = 0.2:9.8), the solution was extracted using ultrasound (F-100S, Shenzhen Fuyang Technology Group Co., Ltd., Shenzhen, China) for 20 min, and it was centrifuged (10,000× g) for 10 min. Finally, the supernatant was collected (repeated three times), the supernatant was evaporated to complete dryness, methanol solution was added to the final volume of 10 mL, and it was stored at −20 °C until analysis. All programs were performed under light shielding to prevent anthocyanin degradation.
Agilent 1290 ultra-performance liquid chromatography (UHPLC), furnished with a G1316C pump, a Poroshell 120 EC C-18 reversed-phase column (2.1 × 150 mm, 2.7 μm), and a 6460 triple quadrupole (QqQ) mass spectrometer (Agilent Technologies, Waldbronn, Germany), was employed. All samples were filtered through a 0.45 μm cellulose membrane before a 10 μL direct injection. The mobile phase, flowing at a rate of 0.2 mL/min, consisted of a mixture of solvents, as follows: solvent A (formic acid:water = 0.2:100) and solvent B (formic acid:methanol:acetonitrile = 0.2:50:50), using the following gradient elution: 0 min, 10% B; 18 min, 25% B; 20 min, 25% B; 30 min, 40% B; 35 min, 70% B; 40 min, 100% B. The column temperature was 30 °C. The MS conditions were as follows: electrospray ionization (ESI+); nebulizer, 35 psi; drying gas temperature, 350 °C; drying gas flow, 10 L/min; ion scanning range, 100 to 1000 m/z. Each anthocyanin was identified according to its chromatographic retention times and the information on precursor and product ions. The calibration curve of malvidin-3-O-glucoside was used to quantify each anthocyanin (Table S1, Supplementary Materials).
2.7. Analysis of Non-Anthocyanin Phenolics in Grapes by UHPLC-QqQ-MS/MS
A 2.5 g portion of the skin powder was mixed with a 10 mL solution (water:ethyl acetate = 0.1:99.9) and subjected to ultrasonic extraction for 20 min, followed by centrifugation at 10,000× g for 10 min. The supernatant was collected, and this procedure was repeated three times. The supernatant was evaporated to complete dryness, then adjusted to a final volume of 10 mL using the solution (acetic acid:methanol = 0.1:99.9), and subsequently stored at −20 °C until analysis.
All other devices were consistent with those used for anthocyanin determination, except for the use of a Zorbax SB-C18 (150 × 2.1 mm, 3.5 µm) chromatography column. The injection volume was 10 μL. The mobile phase, flowing at a rate of 0.2 mL/min, consisted of a mixture of the following solvents: solvent A (acetic acid:water = 0.02:100) and solvent B (acetonitrile), using the following gradient elution: 0 min, 2% B; 5 min, 7% B; 45 min, 30% B; 46 min, 65% B; 47 min, 95% B; 50 min, 2% B. The column temperature was set at 30 °C. The capillary was set at a temperature of 350 °C in negative electrospray ionization (ESI−) mode. The atomization gas pressure was set at 35 psi, the dry gas flow rate was set at 10 L/min, the dry gas temperature was set at 350 °C, and the ion scanning range was set at 50–1500 m/z. Each non-anthocyanin compound was identified primarily by examining the retention time and MS/MS data. Calibration curves for each standard were used to quantify the non-anthocyanins (Table S2).
2.8. Statistical Analysis
The data were analyzed in triplicate, and the results were presented as average values with standard deviation, computed using Excel (Microsoft Office 2010, Redmond, WA, USA). IBM SPSS Statistics 26.0 for Windows (SPSS Inc., Chicago, IL, USA) was employed for data analysis. One-way ANOVAs were performed on all parameters to compare the differences among the different groups and across different days after flowering. The means were compared using the Duncan test, and differences were considered significant at p < 0.05. Pearson correlation analysis was performed using the OmicStudio tool, accessible at https://www.omicstudio.cn, accessed on 10 July 2024. Heatmaps were generated using TBtools, available at https://github.com/CJ-Chen/TBtools/releases, accessed on 11 July 2024. Orthogonal projections to latent structures discriminant analysis (OPLS-DA) were conducted using SIMCA version 14.1.0 (Umetrics, Umeaa, Sweden).
3. Results and Discussion
3.1. Impact of BTH Treatment on Physical and Chemical Parameters
According to Figure 1, in the maturation phenophase of Cabernet Gernischt and Cabernet Franc grapes, total acidity (TA) initially surged, peaking at 42 DAF, with values of 34.62 g/L and 36.63 g/L, respectively, followed by a precipitous decline to an average of 4.97 g/L (p < 0.05). The BTH-treated grapes consistently exhibited lower TA levels than those of the control, with the most pronounced difference at 42 DAF, showing a decrease of 7.36% for Cabernet Gernischt and 12.99% for Cabernet Franc (p < 0.05). Meanwhile, the lowest and highest pH values appeared at 42 DAF (2.41 control vs. 2.33 treated, on average, p < 0.05) and 98 DAF (3.59 control vs. 3.51 treated, on average, p < 0.05), respectively.
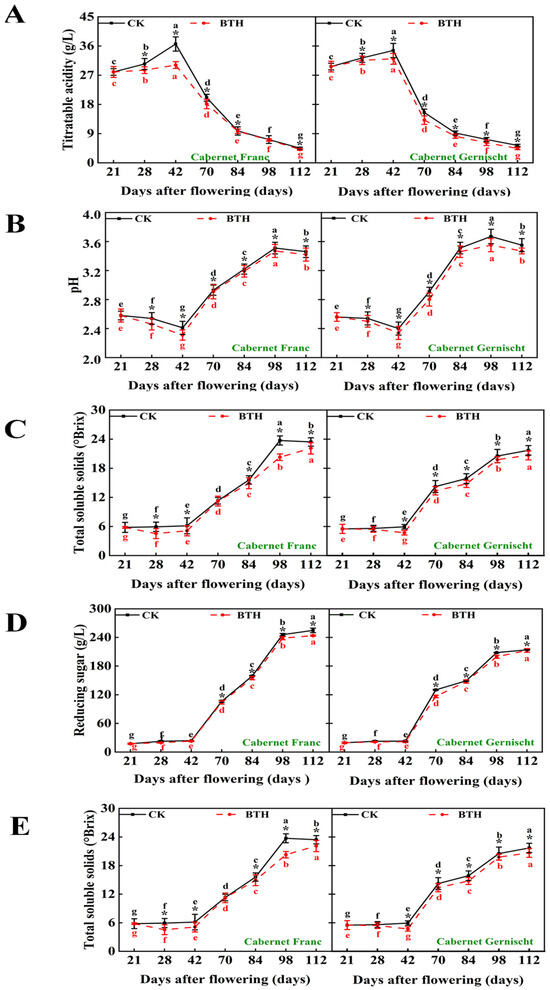
Figure 1.
The impact of BTH treatment on the physical and chemical parameters in Cabernet Gernischt and Cabernet Franc (CK: Control; BTH: BTH treated). (A) Titratable acidity, (B) pH, (C) Total soluble solids, (D) Reducing sugars, (E) 100-Berries weight. Data are expressed as means (n = 3). Error bars represent standard deviation. The * indicates a significant difference between the CK group and the BTH treatment group, different lowercase letters indicate significant differences within CK or BTH between different days after flowering (p < 0.05).
Contrasting the dynamics of acidity, total soluble solids (TSS), reducing sugars (RS), and 100-berries weight (100-BW) demonstrated a steady increase. Under the BTH treatment, however, the ascent of TSS in both grape varieties was more gradual, with the most significant divergence observed at 70 DAF, where TSS was 64.58% (p < 0.05) and 64.16% (p < 0.05) lower than the control for Cabernet Gernischt and Cabernet Franc, respectively. The RS in the BTH-treated grapes also decreased significantly (from 22.62 to 20.49 g/L at 28 DAF and from 234.47 to 228.27 g/L at 112 DAF, on average, p < 0.05). Generally, varietal genetics, environmental conditions, and elicitors affect the dynamics of sugar and acid simulation in grape berries [38]. Moreover, the sugar content in grape berries is not only a function of photosynthetic assimilate input from leaves, but also the respiratory consumption and metabolic fate of these products [39]. Our results have revealed that the BTH treatment led to a decrease in TSS, RS, and TA, possibly due to BTH’s inhibition of photosynthetic efficiency in grape leaves, thereby reducing the transport of photosynthates to the bunches and berries [40]. Simultaneously, BTH could potentially enhance the metabolism of organic acids within the fruit, resulting in a reduction in the TA content (an average decrease of 16.05%, p < 0.05). Similar observations were reported by Wang et al. [41] and Paladines-Quezada et al. [42] in BTH-treated grapes. In addition, the BTH treatment significantly increased the 100-BW of both grape varieties. Among them, the most significant increases were observed in Cabernet Gernischt and Cabernet Franc at 28 DAF (up to 16.80%) and 70 DAF (up to 25.29%), respectively.
Phenolic accumulation in grape skins typically peaks at harvest, followed by a decline and eventual plateau, while, in seeds, except for tannins, a consistent decrease in other phenolics (total phenols, total flavonoids, and total flavanols) has been observed [43]. BTH treatment appears to enhance phenolic accumulation in the berry’s skin. As depicted in Figure 2, the content of total anthocyanins (TAN) and total tannins (TT) in Cabernet Gernischt berry’s skin increased progressively, peaking at 98 DAF (8.45 and 12.63 mg/g, respectively), while the total flavonoids (TFD), total flavanols (TFL), and total phenols (TP) peaked at 21, 84, and 98 DAF at 23.20, 28.94, and 43.77 mg/g, respectively. Post-BTH-treatment, these contents surpassed those of the control, with peak times deviating from the control and reaching maximum levels at 70 DAF (TFD) and 84 DAF (TAN, TFL, TP, and TT), showing increases of 9.31% (TAN, p < 0.05), 9.82% (TFL, p < 0.05), 11.39% (TFD, p < 0.05), 12.27% (TP, p < 0.05), and 13.21% (TT, p < 0.05), respectively.
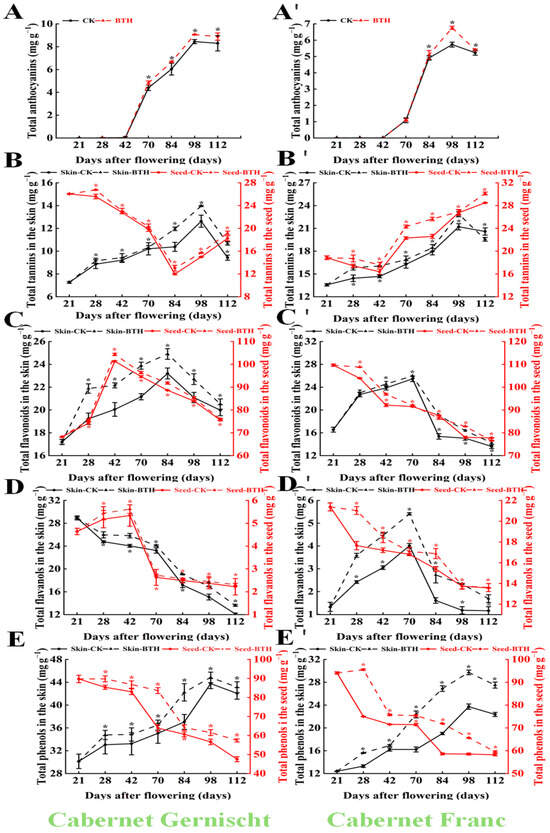
Figure 2.
The impact of BTH treatment on the phenol content in Cabernet Gernischt and Cabernet Franc (CK: Control; BTH: BTH treated). (A,A′) Total anthocyanins, (B,B′) Total tannins, (C,C′) Total flavonoids, (D,D′) Total flavanols, (E,E′) Total phenols. Data are expressed as mean (n = 3). Error bars represent standard deviation, The * indicates a significant difference between the CK group and the BTH treatment group.
A similar pattern was observed in Cabernet Franc, with TAN, TT, and TP reaching their maximum values at 98 DAF (5.73, 21.21, and 23.73 mg/g in the control vs. 6.76, 22.87, and 29.73 mg/g in the treated samples, respectively; p < 0.05). The BTH treatment also elevated the phenol levels within the seeds. For example, upon treatment, the seeds of Cabernet Gernischt demonstrated enhancements of 9.10% in TP (p < 0.05), 5.70% in TAN (p < 0.05), 3.61% in TFD (p < 0.05), 3.33% in TFL (p < 0.05), and 1.69% in TT (p < 0.05) contents. Conversely, the seeds of treated Cabernet Franc exhibited increases of 9.11% in TP (p < 0.05), 4.38% in TAN (p < 0.05), 5.72% in TFD (p < 0.05), 4.82% in TFL (p < 0.05), and 1.79% in TT (p < 0.05) contents, respectively.
Phenolic synthesis is primarily regulated by the enzymes involved in the synthesis pathways of phenylpropane, flavonoids, and anthocyanins, such as phenylalanine ammonia-lyase (PAL), chalcone synthase (CHS), chalcone isomerase (CHI), flavonoids-3′-hydroxylase (F3′H), flavonoids-3′,5′-hydroxylase (F3′5′H), flavonol synthase (FLS), and leucoanthocyanidin reductase (LAR) in the upstream pathway [28,41,44], and enzymes such as DFR, anthocyanidin synthase (ANS) [45], and UDP glucose-flavonoid 3-O-glucosyl transferase (UFGT) [46], which regulate anthocyanin synthesis in the downstream pathway. According to reports, BTH can regulate the activity of these enzymes, thereby enhancing the accumulation of phenols [47]. For example, BTH has been found to enhance the activity of PAL in strawberries [43] and increase the levels of total phenols, flavonoids, and anthocyanins. In addition, it has been suggested that BTH stimulates CHS activity during the biosynthesis of polyphenols and anthocyanins [48]. Therefore, the next step in our research will involve conducting a comprehensive study to elucidate the impact of BTH treatment on the enzymes involved in polyphenol biosynthesis in Cabernet Gernischt and Cabernet Franc.
3.2. Impact of BTH Treatment on Colorimetric Indexes in Grapes
The color properties of the grapes are presented in Figure 3 and Table S3, showing a consistent decline in the L* (lightness) and b* (yellow/blue chromaticity) values across all grape samples after the veraison stage (42 DAF), from 88.44 to 62.32 a.u. and from 10.97 to 3.14 a.u., respectively, alongside a marked elevation in the a* (green/red chromaticity) and C*ab (chroma) values, from −0.14 to 40.87 a.u. and from 21.42 to 48.56 a.u, respectivley. Notably, BTH application on Cabernet Gernischt and Cabernet Franc grapes modified these colorimetric values, intensifying the chromatic attributes. For example, the lowest recorded L* and b* values at 112 DAF were 54.48 and 2.49 a.u. (p < 0.05), respectively, suggesting that the BTH-treated grapes presented a more pronounced color depth compared to the controls. Meanwhile, there were observed increases of 47.01% in a* and 9.19% in C*ab (p < 0.05), which indicated a heightened anthocyanin concentration in the treated grapes. These observations were consistent with their TAN content.
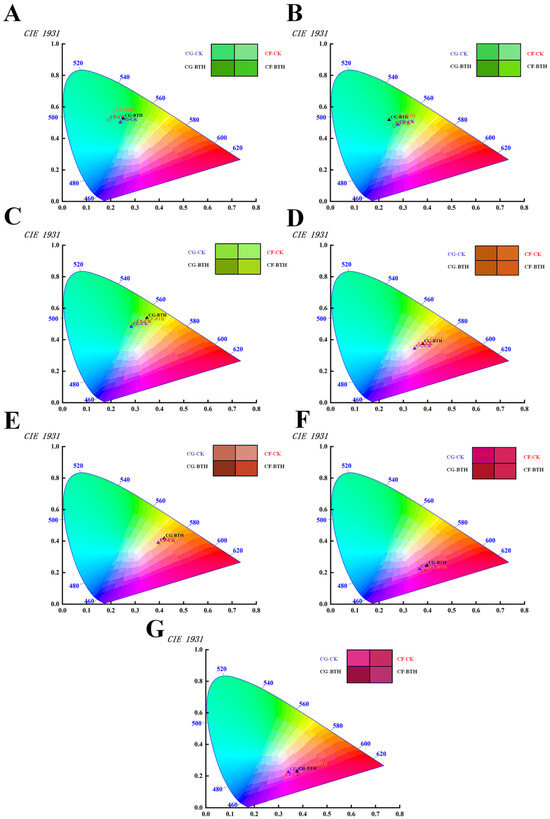
Figure 3.
The impact of BTH treatment on the color properties of Cabernet Gernischt and Cabernet Franc grapes in the CIE1931 color space (CG: Cabernet Gernischt; CF: Cabernet Franc; CK: Control; BTH: BTH treated). (A–G) Represent grape samples from 21, 28, 42, 70, 84, 98, and 112 days after flowering, respectively. The color splatter of each sample is visually presented within the quadrangle).
The color of grape berries is determined by a variety of substances [49]. Herrera et al. [50] pointed out that, in red varieties, when the berry undergoes a color change at 9 or 10 °Brix [51], it is a reliable indicator of the metabolic changes observed at the beginning of ripening. In addition, based on the type and concentration of synthesized anthocyanins [52], it can be observed that the color of the berries changes from green to pink, red, purple, or blue. It is not easy to compare the quality of different grape varieties using a single chromaticity value (L*, a*, b*) during the production process, and the Red Grape Color Index (CIRG) can be used as an indicator of grape skin anthocyanin content, which is a reliable indicator for evaluating grape appearance quality. In this study, CIRG parameters were used to provide a clearer description of the color transition of grape berries, where the color transition demonstrates a shift from green-yellow (CIRG < 2) to pink (2 < CIRG < 4) between 21 and 42 DAF, evolving to red-black (5 < CIRG < 6) from 70 to 84 DAF, and finally to blue-black (CIRG ≥ 6) from 98 to 112 DAF. Post-BTH-treatment, both grape varieties exhibited significant CIRG index enhancements at 28 DAF, with Cabernet Gernischt and Cabernet Franc showing increases of 14.63% and 16.36%, respectively.
Moreover, an examination of the ΔE*ab values post-treatment has revealed that BTH-treated Cabernet Gernischt and Cabernet Franc grapes had averages of 6.88 a.u. and 8.27 a.u., respectively. This result denotes perceptible color variances attributable to the BTH treatment. Therefore, considering the collective colorimetric indices, it can be inferred that BTH treatment engenders grapes with a deeper color intensity, augmented darkness, and an enhanced red-bluish hue and saturation. This result is similar to the findings of Salifu et al. [35] on the Cabernet Gernischt grape. The BTH-treated samples showed higher CIRG than their corresponding controls throughout the study, indicating that the processed grape has a darker color.
3.3. Impact of BTH Treatment on Anthocyanin Compounds in Grapes
The HPLC analysis revealed a similar trend in TAN content compared to the spectrophotometric method and provided more comprehensive information on anthocyanin profiles. As delineated in Figure 4 and Table S4, 15 distinct anthocyanin derivatives were discerned in the berry skin of Cabernet Gernischt and Cabernet Franc grapes, similar to the extant literature [37]. These included five primary monoglucosides of anthocyanidins—delphinidin, cyanidin, petunidin, peonidin, and malvidin—constituting on average 50.60% of the total anthocyanin concentration and their respective 6″-O-acetyl (averaging 38.61%) and 6″-O-p-coumaroyl (averaging 10.79%) derivatives.
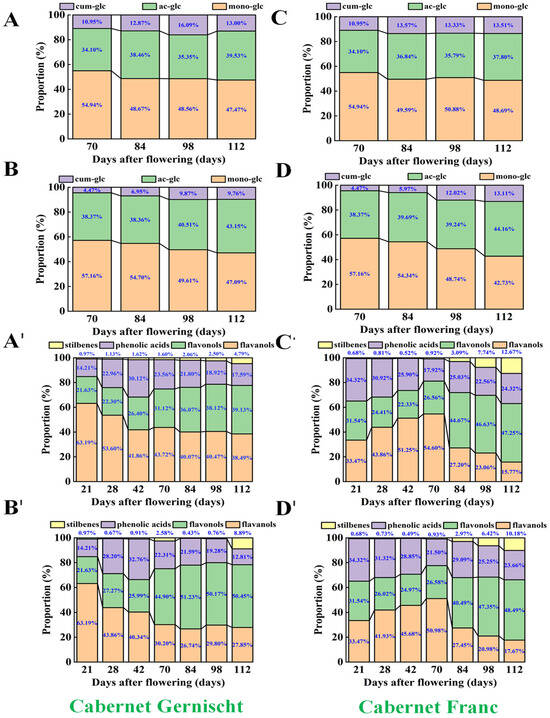
Figure 4.
The proportions of anthocyanins and non-anthocyanin compounds in Cabernet Gernischt and Cabernet Franc (CK: Control; BTH: BTH treated; ac-glc: Acetyl glucoside derivatives of anthocyanidins; cum-glc: Coumaryl glucoside derivatives of anthocyanidins; mono-glc: Monoglucosides of anthocyanidins). (A,A′) CK samples of Cabernet Gernischt, (B,B′) BTH samples of Cabernet Gernischt, (C,C′) CK samples of Cabernet Franc, (D,D′) BTH samples of Cabernet Franc.
Table S3 highlights malvidin-3-O-glucoside as the predominant anthocyanin in both grape varieties, with a notable concentration of 3959.21 mg/kg. During the 70–84 DAF interval, peonidin-3-O-glucoside in Cabernet Franc also manifested a considerable concentration, and these results are according to the findings in Monastrell grapes [32]. The other anthocyanins, including the glucoside forms of delphinidin, petunidin, and cyanidin, were present in lesser quantities. Post-BTH-treatment, the monoglucosides of anthocyanidins experienced an increase exceeding 31.56%. Remarkably, the surge in petunidin-3-O-glucoside and peonidin-3-O-glucoside was more pronounced. For example, petunidin-3-O-glucoside exhibited a robust increase of over 20.08% (p < 0.05) at 84 DAF in the BTH-treated berries compared to the control. Peonidin-3-O-glucoside in Cabernet Franc showed a significant elevation (from 389.86 mg/kg to 546.50 mg/kg, 36.25% higher than the control, p < 0.05), outpacing even malvidin-3-O-glucoside, which rose by 12.03% (p < 0.05). Despite a general decline in anthocyanin content at 112 DAF, petunidin- and peonidin-3-O-glucosides maintained considerable gains in the BTH-treated samples, paralleling observations in Alachua grapes treated with S-ABA, where peonidin-3-O-glucoside exhibited enhanced accumulation [53]. Similar trends were also noted in Cabernet Sauvignon berries and wines following the S-ABA application [54].
BTH treatment also influenced the accrual of acylated anthocyanins within the grape skins. Notably, malvidin-3-O-(6″-O-acetyl)-glucoside, peonidin-3-O-(6″-O-acetyl)-glucoside, and malvidin-3-O-(6″-O-p-coumaryl)-glucoside, as the principal acylated anthocyanins (comprising 2.87–18.49% of the total berry skin anthocyanin content), were found to be 25.32%, 41.94%, and 35.16% (p < 0.05) more abundant in the BTH-treated samples, respectively. Given that acylated anthocyanins are typically more stable than their non-acylated counterparts [55], the levels in the BTH-treated grapes may enhance the chemical stability of red grape pigments, thereby positively influencing wine coloration.
Previous studies have posited that BTH may amplify the activity of PAL and CHS. Additional research suggests that BTH treatment could instigate an “ethylene priming” effect, emerging from the interplay between ethylene and BTH signaling pathways, which may provoke sustained gene expression allied to anthocyanin synthesis [56,57,58,59,60]. The genes that regulate downstream key enzymes in the anthocyanin biosynthesis pathway include DFR, ANS, and UFGT [61]. In brightly colored fruits, these genes are usually highly expressed, leading to the synthesis of high concentrations of anthocyanins. Zhong et al. found in their study of grapes using metabolomics and transcriptomics that the synthesis of anthocyanins in grapes is influenced by the high expression rate of the anthocyanin biosynthetic related genes (PAL, C4H, 4CL, CHS, F3H, DFR, ANS, and anthocyanin 3-O-glucosyltransferase) [62]. Similar views were expressed in the studies of Lorenzis et al. [63] and Cheng et al. [64]. Nonetheless, these findings necessitate further analytical observation.
3.4. Impact of BTH Treatment on Non-Anthocyanin Phenolics in Grapes
Consistent with previous research, the temporal pattern of anthocyanin accumulation in grapes is sustained throughout the berries’ developmental phases [65,66], whereas non-anthocyanin compounds typically exhibit an inverse dynamic of accumulation. The untreated grapes had an anthocyanin content increase from 21 DAF to 112 DAF (5.90–6765.00 mg/kg), in contrast to a decline in non-anthocyanins (38.00–13.08 mg/kg, as shown in Figure 4 and Table S5). Within this non-anthocyanin category, flavanols represented the largest fraction (up to 44.36%), followed by flavonols (29.87%), phenolic acids (23.69%), and stilbenes (2.10%). Flavanols are crucial for the organoleptic properties and structural integrity of grapes and wine, while flavonols provide UV protection. These classes synergistically interact with anthocyanins to influence the chromatic properties of grapes and wines [67]. Phenolic acids contribute to color stabilization and antioxidation [68], and resveratrol, a notable stilbene, is renowned for its anti-cancer, anti-inflammatory, and antioxidative functions [69].
Table S5 reveals that, in both experimental varieties, the following flavanols were present: prescatechin, epicatechin, and epigallocatechin gallate. In the control samples of Cabernet Gernischt, it was found that a diminution in total flavanol content was observed, tapering from 22.76 to 4.18 mg/kg. Epicatechin was the most abundant, with a total amount of 43.23 mg/kg, followed by catechin and epigallocatechin gallate (23.61 mg/kg and 10.50 mg/kg, respectively). Post-BTH application, flavanol concentrations increase by 4.97% (p < 0.05), 11.61% (p < 0.05), and 5.41% (p < 0.05), respectively. Conversely, in the control sample of Cabernet Franc, the content of total flavanols first increased, reaching its peak at 70 DAF (22.61 mg/kg), and then continued to decrease, reaching its minimum at 112 DAF (2.49 mg/kg). Notably, the epigallocatechin gallate level in Cabernet Franc surpassed that of catechins (14.07% higher), and the BTH treatment augmented the total flavanol content by factors of 1.11 (epigallocatechin gallate), 1.20 (catechins), and 1.05 (epicatechin), respectively, for each compound (p < 0.05).
Eight flavonol derivatives were identified in both grape types during maturation. Isorhamnetin-3-O-glucoside continued to increase in both grape samples, reaching 2.41 mg/kg (on average) at 112 DAF; the level of myricitrin in both grape samples increased before decreasing, peaking at 70 DAF (3.10 mg/kg, on average); the level of kaempferol remained stable (in the range of 0.10 and 0.13 mg/kg); and rutin (4.09–0.51 mg/kg, on average), quercetin (1.98–0.47 mg/kg, on average), and chrysin (1.34–0.38 mg/kg, on average) all showed a decreasing trend in both grape samples. It is noteworthy that specific flavonol compounds demonstrated varietal-dependent accumulation patterns. For example, quercetin-3-O-glucoside decreased in Cabernet Gernischt (from 0.27 to 0.04 mg/kg) but increased in Cabernet Franc (from 0.10 to 0.72 mg/kg, post a transient dip at 42 DAF). Quercetin 3-O-galactoside exhibited dual peaks, one at 21 DAF (1.69 mg/kg, on average) and another at 84 DAF (1.56 mg/kg, on average). The BTH treatment significantly uplifted all flavonol levels, with increments ranging from 21.98% to 46.54% (p < 0.05), except for a 38.24% reduction in kaempferol in Cabernet Gernischt.
Garde Cerdán et al. [70] demonstrated that treating Tempranillo grapes with methyl jasmonate (MeJA) prior to harvest for two consecutive years would affect the levels of hydroxybenzoic acid and hydroxycinnamic acid to varying degrees. Ultimately, the content of hydroxybenzoic acid and hydroxycinnamic acid increased by 14.84% and 18.32%, respectively, after treatment. In our results, in the BTH-treated Cabernet Gernischt, the hydroxybenzoic acid levels decreased by 30.96% (p < 0.05), while the hydroxycinnamic acid levels increased by 43.00% (p < 0.05). In contrast, Cabernet Franc showed an increase in hydroxybenzoic acid and hydroxycinnamic acid by 69.33% (p < 0.05) and 16.86% (p < 0.05), respectively, suggesting that this may be related to the variety of grapes and the different elicitors applied.
One of the sole stilbenes detected, trans-resveratrol (an antitoxin produced by many plants when stimulated, which can be synthesized in grape leaves and skins and is a bioactive ingredient in wine and grape juice), exhibited a steady rise throughout growth, with levels ranging from 0.35 to 0.52 mg/kg and from 0.27 to 1.39 mg/kg in the control group of Cabernet Gernischt and Cabernet Franc grapes, respectively, from 21 to 112 DAF, with peaks at 112 DAF in both grapes (1.26 mg/kg in the control and 1.97 mg/kg in the treated group, p < 0.05). The total content of stilbenes in both grape types surged 10.05-fold compared to the control.
The non-anthocyanin phenolics in grapes encompass phenolic acid derivatives, flavanols, flavonols, and stilbenes. In our study, we observed an increase in the content of these compounds after BTH treatment. Garde Cerdán et al. [70] and Fang et al. [71] observed similar results in Monastrel grapes treated with BTH. In their research results, the content of flavanols (such as catechins and epicatechins) and caffeic acid increased after treatment, and similar changes were also reflected in our study. In addition, Fernandez Marin et al. [72] and Ruiz García et al. [73] showed that, after BTH induction of Syrah and Monastrel grapes, the content of stilbenes increased by 41.74% and 54.42%, respectively, which is similar to our results.
The biosynthesis of non-anthocyanin flavonoids in grapes is enzymatically regulated, with CHS and CHI initiating the flavonoid pathway. The subsequent enzymatic steps involving F3′H, F3′5′H, FLS, and LAR culminate in the production of compounds like quercetin and myricetin [74,75,76]. There are indications that BTH enhances phenolic synthesis by modulating CHS and CHI activities [57]. Therefore, we hypothesize that the observed increase in non-anthocyanin content may be attributable to BTH-induced enzymatic activity within these metabolic pathways. Nevertheless, the precise mechanisms warrant further investigation and validation.
3.5. Multivariable Analysis
3.5.1. Pearson Correlation Analysis of L*, a*, b*, and Anthocyanin Compounds
Previous investigations have established a profound linkage between the pigmentation of grapes and the dynamic accumulation of anthocyanins, a process intricately associated with the berries’ color transition and modulated by hormonal agents, such as MeJA and Strigolactone (SL) [77,78]. In light of these findings, we applied Pearson correlation analysis to scrutinize the influence of BTH treatment on the colorimetric indices (L*, a*, and b*) and the profiles of anthocyanin compounds during the grape ripening stage. The Pearson correlation coefficient (cor or rho) ranges from −1 to 1, with a value of 1 indicating complete positive correlation, −1 indicating complete negative correlation, and 0 indicating no correlation. In Figure 5, the line type and color represent positive and negative correlations, while the line thickness indicates the strength of the correlation. The number of related objects is represented by the dot size and color depth.
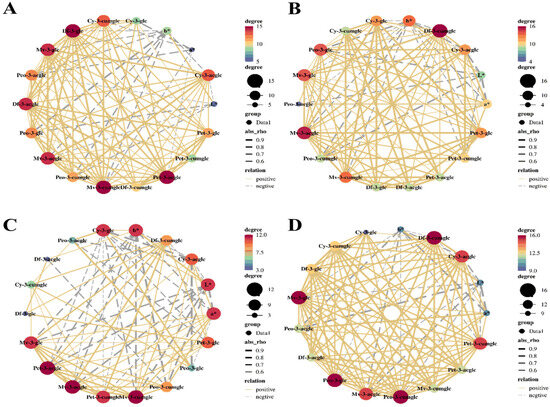
Figure 5.
The Pearson correlation analysis of L*, a*, b*, and anthocyanin compounds in grapes during grape ripening (CK: Control; BTH: BTH treated; Df-3-glc: Delphinidin-3-glucoside; Cy-3-glc: Cyanidin-3-glucoside; Pet-3-glc: Petunidin-3-O-glucoside; Peo-3-glc: Peonidin-3-O-glucoside; Mv-3-glc: Malvidin-3-O-glucoside; ac: Acetyl glucosides; cum: Coumaryl glucosides). (A) CK samples of Cabernet Gernischt, (B) BTH samples of Cabernet Gernischt, (C) CK samples of Cabernet Franc, (D) BTH samples of Cabernet Franc.
Figure 5 illustrates a significant correlation between the profiles of anthocyanins and colorimetric indices for these two experimental varieties. The data reveal that anthocyanin accumulation is a key determinant of grape coloration. Specifically, a marked negative correlation is observed between L* and b* with malvidin-3-O-glucoside, peonidin-3-O-glucoside, and cyanidin-3-O-glucoside, as well as their acylated derivatives (−0.89 < rho < −0.60). Conversely, a* is positively correlated with malvidin-3-O-glucoside and its acylated derivatives (0.63 < rho < 0.79), indicating a differential impact of individual anthocyanins on grape coloration. During maturation, the a* value of the grape samples under investigation increases while the L* value decreases, culminating in a darker coloration. Notably, BTH treatment appears to intensify this change, particularly in Cabernet Franc, where a substantial positive correlation between a* and levels of peonidin-3-O-glucoside, along with its acylated derivatives, is observed. In Cabernet Gernischt, a similar positive relationship is noted with malvidin-3-O-glucoside and peonidin-3-O-glucoside, including their acetylated forms (0.54 < rho < 0.90), suggesting that BTH application encourages the development of a redder pigment spectrum. When integrating C*ab, h*, and ΔE*ab into the analysis, it is evident that the BTH-treated samples exhibited elevated C*ab (27.18 a.u. in the control vs. 29.34 a.u. in the treated samples, on average) and lowered h* (0.30 a.u. in the control vs. 0.25 a.u. in the treated samples, on average) values relative to the control, with a markedly greater influence on ΔE*ab (6.88 a.u. in Cabernet Gernischt and 8.27 a.u. in Cabernet Franc, on average). Therefore, the application of BTH significantly augments the chromatic intensity of grapes, enriching the red–blue coloration and saturation and influencing the visual appeal and potential quality perception of the grapes.
3.5.2. OPLS-DA Analysis of Phenols
In concert with enhancing anthocyanin accumulation, treatment with BTH also precipitated alterations in the other phenolic profiles of the experiment grape varieties. To evaluate these changes, OPLS-DA was conducted on both treated and untreated BTH samples. R2X was measured to be 0.868, R2Y was 0.753, and Q2 was 0.572, with both goodness of fit and predictive goodness being greater than 0.5. For data analysis, hypothesis testing was conducted 200 times, as shown in Figure 6C. The R2 is 0.7816 with an intercept of 0.0355, and the Q2 is 0.5986 with an intercept of −0.487, indicating that the model is not overfitting and is reliable.
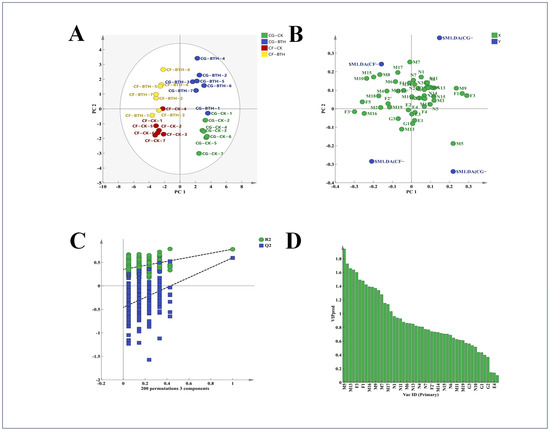
Figure 6.
OPLS-DA analysis scores plot (A), loading scatter plot (B), permutation test (C), distribution of VIP forecast values base (D) of phenols in Control (CK) and BTH-treated (BTH) Cabernet Gernischt and Cabernet Franc grapes during grape ripening. Data are expressed as means (n = 3). The numbers (from 1 to 7) represent 21, 28, 42, 70, 84, 98, and 112 days after flowering, respectively. CG: Cabernet Gernischt grape; CF: Cabernet Franc grape.
The score scatter plot (Figure 6A) delineates the spatial distribution of the control and BTH-treated samples within the score space. The control samples predominantly reside along the positive X-axis, in contrast to the BTH-treated samples, which are arrayed along the negative X-axis. This spatial segregation reflects pronounced compositional disparities between the two sample sets. Furthermore, the loading scatter plot (Figure 6B) reveals that the principal constituents responsible for the divergence between the control and the BTH samples are chiefly allocated along the positive X-axis.
Employing variable importance projection (VIP) values as a screening metric, we discerned a suite of 15 pivotal compounds with VIP scores exceeding the threshold of 1.0 (Figure 6D), including TP in grape skin, TFL in both grape skin and seed, and TT in grape skin, along with a spectrum of flavonoids and phenolic acids—epigallocatechin gallate, kaempferol, myricetin, quercetin, hyperoside, quercetin-3-O-galactoside, protocatechuic acid, gallic acid, p-hydroxycinnamic acid, chlorogenic acid, and syringic acid—as delineated in Figure 6. The collective profile of these 15 compounds is instrumental in demarcating the untreated and BTH-treated samples, suggesting their pivotal role as markers of compositional variance between the two groups. Particularly, phenolic acids like protocatechuic acid and flavonols such as kaempferol, which have been identified among these compounds, are frequently acknowledged as high-efficacy copigments with the potential to enhance grape coloration. Meanwhile, compounds such as TP, TT, and epigallocatechin gallate contribute to the organoleptic qualities of wine and are of considerable importance in augmenting the nutritional profile of both grapes and their vinous derivatives. Therefore, BTH treatment not only enhances the chromatic properties of grapes, but also advances their quality attributes through the promotion of phenolic compound accumulation.
3.5.3. Heatmap Analysis
To investigate the temporal dynamics of phenolic compounds, as well as the quality parameters of grape and colorimetric indexes for the two grape cultivars during maturation, we utilized heatmap analysis to contrast between the untreated and BTH-treated groups throughout the ripening stage.
As shown in Figure 7, the heatmap data delineate the stratification of the samples into two principal groups: those subjected to BTH treatment and the untreated controls. The samples from the initial phase of veraison (21–42 DAF) coalesce into one group, whereas the samples from the advanced phase of veraison (70–112 DAF) congregate into a separate group, underscoring the distinctions between these two categories. From Figure 7, it can be seen that, although the BTH treatment did not alter the profile of the compounds present in the two grape varieties, it markedly influenced their concentrations. There was a marked decrease in TA, catechins, epicatechin, rutin, quercetin, and the colorimetric L* and b* values, which was the most pronounced alteration observed. Similar changes also succeeded in the TP, TFL, and TFD levels.
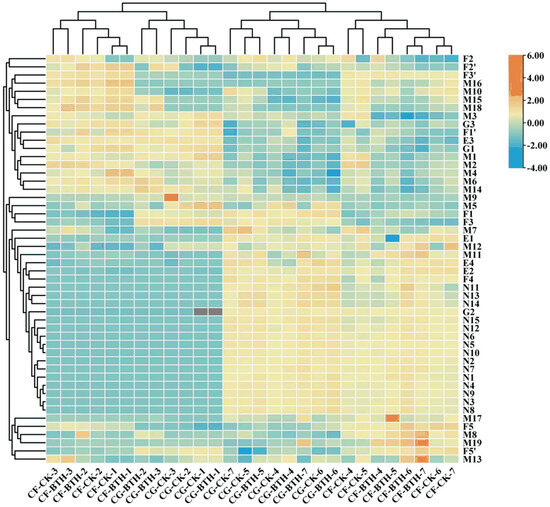
Figure 7.
Heatmap of phenols and physicochemical indicators in Control (CK) and BTH-treated (BTH) Cabernet Gernischt and Cabernet Franc grapes during ripening, where the red and blue segments represent the relatively high and low abundance of compounds, respectively. Data are expressed as means (n = 3). The numbers (from 1 to 7) represent 21, 28, 42, 70, 84, 98, and 112 DAF, respectively. CG: Cabernet Gernischt grape; CF: Cabernet Franc grape; color scale display shows that high concentration compounds range from white to red, while low concentration compounds range from white to blue.
Conversely, the levels of RS, TAN, and 15 anthocyanin derivatives showed an increase. Previous studies have suggested that flavonols and flavanols predominantly accumulate during the early stages of veraison, with their levels typically diminishing as the grape matures. In contrast, the synthesis of anthocyanins intensifies in the later stages of veraison and peaks during the ripening process, playing a pivotal role in the pigmentation of grapes. Therefore, the observed alterations in the content of these phenolic compounds explain the clustering patterns of grape samples from pre- to post-veraison, as depicted in the heatmap.
4. Conclusions
The present study utilized pre-harvest foliar application of BTH on Cabernet Gernischt and Cabernet Franc grapes to investigate the grape berries’ quality and polyphenolic changes during the berry maturation process. The results showed that the treatment led to a decrease in TA, TSS, and RS, while the 100-BW increased. The BTH treatment also enhanced the accumulation of polyphenols in the grape skins and seeds and significantly modified the chromatic attributes of the grapes. The treatment has had a profound impact on the composition of anthocyanin and non-anthocyanin phenolic compounds in the grapes, leading to a significant increase in the content of anthocyanin and non-anthocyanin phenolic compounds and a change in the anthocyanin spectrum. Pearson correlation analysis showed that there was a significant negative correlation between the L* and b* of the two samples and malvidin-3-O-glucoside, peonidin-3-O-glucoside, and cyanidin-3-O-glucoside and their acylation forms, while a* is positively correlated with malvidin-3-O-glucoside and its acylated derivatives, indicating a significant correlation between the anthocyanin spectrum and chromaticity index of the two grape varieties. BTH treatment deepens this correlation, resulting in darker color intensity, richer red and blue colors, and higher saturation of the treated grapes. OPLS-DA showed that the BTH treatment resulted in significant compositional differences between the control and the treated group sample sets, and VIP values were used as screening indicators to identify 15 key compounds that caused differences between the two samples, including a series of flavonoids such as epigallocatechin gallate, kaempferol, and myricetin, as well as phenolic acid compounds such as gallic acid and chlorogenic acid. Heatmap analysis further stratified the samples into two main groups, namely samples from the initial stage of veraison (21–42 DAF) and samples from the late stage of veraison (70–112 DAF), highlighting the differences between these two categories. Among them, compounds such as TA, catechin, epicatechin, rutin, and quercetin play important roles in the two main clustering groups, indicating that these compounds are also correlated with each other. In summary, BTH treatment can enhance the quality attributes of grapes by increasing the content of compounds in them, making it a promising strategy for wine grape cultivation.
However, this study only measured and analyzed data for a single year and for two grape varieties. Therefore, future experiments should be conducted over consecutive years and include a wider range of wine grape varieties to ensure the reliability and generalizability of the findings. Additionally, the analysis and discussion in this study were superficial, lacking a molecular-level mechanism analysis. Consequently, subsequent studies could focus on conducting more in-depth investigations into the activity of the relevant enzymes and genes through BTH treatment. Simultaneously, winemaking experiments using treated fruit can be carried out to examine its impact on wine quality.
Supplementary Materials
The following supporting information can be downloaded at: https://www.mdpi.com/article/10.3390/agronomy14081818/s1, Table S1: Chromatographic and mass spectrometric anthocyanins detected in grape samples; Table S2: Chromatographic and mass spectrometric non-anthocyanin phenolics detected in grape samples; Table S3: Influence of BTH treatment on colorimetric indexes in Cabernet Gernischt and Cabernet Franc grapes; Table S4: Influence of BTH treatment on anthocyanin compounds in Cabernet Gernischt and Cabernet Franc grapes; Table S5: Influence of BTH treatment on non-anthocyanin phenolics in Cabernet Gernischt and Cabernet Franc grapes; Table S6: Names of physicochemical parameters and phenolic compounds and their corresponding numbers (No.).
Author Contributions
Conceptualization, H.W. and B.Z.; data curation, W.Q.; formal analysis, H.W.; funding acquisition, B.Z.; methodology, T.M. (Tongwei Ma); writing—original draft preparation, H.W.; writing—review and editing, H.W. and B.Z.; supervision, B.W., Y.J. and T.M. (Tengzhen Ma). All authors have read and agreed to the published version of the manuscript.
Funding
This research was funded by the Longyuan Young Talents Program of Gansu Province (grant number GSRC-202311173), the Wine Industry Development Project of the Department of Commerce of Gansu Province (grant number GSPTJZX-2020-4 and 2017010), the Gansu Province Modern Fruit Industry System Project (grant number GARS-SG-7), and the Fu Xi Talents Program of Gansu Agricultural University (grant number Gaufx-02Y06).
Data Availability Statement
The original contributions presented in the study are included in the article and the Supplementary Materials.
Acknowledgments
The authors gratefully acknowledge the Gansu Mogao Industrial Development Co., Ltd. for their generous support in providing grape supplies.
Conflicts of Interest
The authors declare that they have no known competing financial interests or personal relationships that could have appeared to influence the work reported in this paper.
Abbreviations
| Abbreviation | Full form |
| BTH | Benzothiadiazole |
| DAF | Days after flowering |
| SKDH | Shikimate dehydrogenase |
| TAL | Tyrosine ammonia-lyase |
| DFR | Dihydroflavonol 4-reductase |
| G6PDH | Glucose-6-phosphate dehydrogenase |
| PAL | Phenylalanine ammonia-lyase |
| C4H | Cinnamate-4-hydroxylase |
| 4CL | 4-coumaroyl-CoA ligase |
| CHS | Chalcone synthase |
| CHI | Chalcone isomerase |
| FLS | Flavonol synthase |
| LAR | Leucoanthocyanidin reductase |
| ANS | Anthocyanidin synthase |
| UFGT | UDP-glucose-flavonoid 3-O-glucosyltransferase |
| F3′H | Flavonoids-3′-hydroxylase |
| F3′5′H | Flavonoids-3′,5′-hydroxylase |
| 100-BW | 100-Berries weight |
| TSS | Total soluble solids |
| RS | Reducing sugars |
| TA | Titratable acidity |
| TP | Total phenols |
| TFD | Total flavonoids |
| TFL | Total flavanols |
| TAN | Total anthocyanins |
| TT | Total tannins |
| OPLS-DA | Orthogonal partial least squares discriminant analysis |
| VIP | Variable importance projection |
References
- Šikuten, I.; Štambuk, P.; Andabaka, Ž.; Tomaz, I.; Marković, Z.; Stupić, D.; Maletić, E.; Kontić, J.K.; Preiner, D. Grapevine as a Rich Source of Polyphenolic Compounds. Molecules 2020, 25, 5604. [Google Scholar] [CrossRef] [PubMed]
- Ochoa-Velasco, C.E.; Avila-Sosa, R.; Navarro-Cruz, A.R.; López-Malo, A.; Palou, E. Chapter 9-Biotic and Abiotic Factors to Increase Bioactive Compounds in Fruits and Vegetables. In Food Bioconversion; Grumezescu, A.M., Holban, A.M., Eds.; Academic Press: Cambridge, MA, USA, 2017; pp. 317–349. [Google Scholar]
- Xavier Machado, T.O.; Portugal, I.B.M.; Padilha, C.; Ferreira Padilha, F.; Dos Santos Lima, M. New Trends in the Use of Enzymes for the Recovery of Polyphenols in Grape Byproducts. J. Food Biochem. 2021, 45, e13712. [Google Scholar] [CrossRef] [PubMed]
- Tian, Q.; Xu, Z.; Sun, X.; Deavila, J.; Du, M.; Zhu, M. Grape Pomace Inhibits Colon Carcinogenesis by Suppressing Cell Proliferation and Inducing Epigenetic Modifications. J. Nutr. Biochem. 2020, 84, 108443. [Google Scholar] [CrossRef] [PubMed]
- Martins, I.M.; Macedo, G.A.; Macedo, J.A. Biotransformed Grape Pomace as a Potential Source of Anti-Inflammatory Polyphenolics: Effects in Caco-2 Cells. Food Biosci. 2020, 35, 100607. [Google Scholar] [CrossRef]
- Brown, J.C.; Jiang, X. Activities of Muscadine Grape Skin and Polyphenolic Constituents Against Helicobacter Pylori. J. Appl Microbiol. 2013, 114, 982–991. [Google Scholar] [CrossRef] [PubMed]
- Weaver, S.R.; Rendeiro, C.; McGettrick, H.M.; Philp, A.; Lucas, S.J.E. Fine Wine or Sour Grapes? A Systematic Review and Meta-Analysis of the Impact of Red Wine Polyphenols on Vascular Health. Eur. J. Nutr. 2021, 60, 1–28. [Google Scholar] [CrossRef] [PubMed]
- Silva, V.; Igrejas, G.; Falco, V.; Santos, T.P.; Torres, C.; Oliveira, A.M.P.; Pereira, J.E.; Amaral, J.S.; Poeta, P. Chemical Composition, Antioxidant and Antimicrobial Activity of Phenolic Compounds Extracted from Wine Industry by-Products. Food Control 2018, 92, 516–522. [Google Scholar] [CrossRef]
- Matsui, K. Green Leaf Volatiles: Hydroperoxide Lyase Pathway of Oxylipin Metabolism. Curr. Opin. Plant Biol. 2006, 9, 274–280. [Google Scholar] [CrossRef] [PubMed]
- Mendez-Costabel, M.; Wilkinson, K.; Bastian, S.; McCarthy, M.; Ford, C.; Dokoozlian, N. Seasonal and Regional Variation of Green Aroma Compounds in Commercial Vineyards of Vitis vinifera L. Merlot in California. Am. J. Enol. Vitic. 2013, 64, 430–436. [Google Scholar] [CrossRef]
- Oliveira, J.M.; Faria, M.; Sá, F.; Barros, F.; Araújo, I.M. C6-Alcohols as Varietal Markers for Assessment of Wine Origin. Anal. Chim. Acta 2006, 563, 300–309. [Google Scholar] [CrossRef]
- Yuan, F.; Qian, M.C. Development of C13-Norisoprenoids, Carotenoids and Other Volatile Compounds in Vitis vinifera L. Cv. Pinot Noir Grapes. Food Chem. 2016, 192, 633–641. [Google Scholar] [CrossRef]
- Robinson, A.L.; Boss, P.K.; Heymann, H.; Solomon, P.S.; Trengove, R.D. Influence of Yeast Strain, Canopy Management, and Site on the Volatile Composition and Sensory Attributes of Cabernet Sauvignon Wines from Western Australia. J. Agric. Food Chem. 2011, 59, 3273–3284. [Google Scholar] [CrossRef] [PubMed]
- Xu, X.Q.; Cheng, G.; Duan, L.L.; Jiang, R.; Pan, Q.H.; Duan, C.Q.; Wang, J. Effect of Training Systems on Fatty Acids and Their Derived Volatiles in Cabernet Sauvignon Grapes and Wines of the North Foot of Mt. Tianshan. Food Chem. 2015, 181, 198–206. [Google Scholar] [CrossRef] [PubMed]
- Trejo-Saavedra, D.L.; García-Neria, M.A.; Rivera-Bustamante, R.F. Benzothiadiazole (BTH) Induces Resistance to Pepper Golden Mosaic Virus (PepGMV) in Pepper (Capsicum annuum L.). Biol. Res. 2013, 46, 333–340. [Google Scholar] [CrossRef] [PubMed]
- Jiang, H.; Wang, Y.; Li, C.; Wang, B.; Ma, L.; Ren, Y.; Bi, Y.; Li, Y.; Xue, H.; Prusky, D. The Effect of Benzo-(1,2,3)-Thiadiazole-7-Carbothioic Acid S-Methyl Ester (BTH) Treatment on Regulation of Reactive Oxygen Species Metabolism Involved in Wound Healing of Potato Tubers during Postharvest. Food Chem. 2020, 309, 125608. [Google Scholar] [CrossRef] [PubMed]
- Krome, K.; Kabsch, U.; Aumann, J. The Effect of Benzothiadiazole and Fungal Extracts of Cercospora beticola and Fusarium graminearum on Phosphoenolpyruvate Carboxylase Activity in Cucumber Leaves. J. Plant Dis. Protect. 2007, 114, 250–255. [Google Scholar] [CrossRef]
- Du, H.; Sun, Y.; Yang, R.; Zhang, W.; Wan, C.; Chen, J.; Kahramanoğlu, İ.; Zhu, L. Benzothiazole (BTH) Induced Resistance of Navel Orange Fruit and Maintained Fruit Quality during Storage. J. Food Qual. 2021, 2021, 6631507. [Google Scholar] [CrossRef]
- Huan, C.; Xu, Q.; Shuling, S.; Dong, J.; Zheng, X. Effect of Benzothiadiazole Treatment on Quality and Anthocyanin Biosynthesis in Plum Fruit during Storage at Ambient Temperature. J. Sci. Food Agric. 2021, 101, 3176–3185. [Google Scholar] [CrossRef] [PubMed]
- Xu, D.; Xi, P.; Lin, Z.; Huang, J.; Lu, S.; Jiang, Z.; Qiao, F. Efficacy and Potential Mechanisms of Benzothiadiazole Inhibition on Postharvest Litchi Downy Blight. Postharvest Biol. Technol. 2021, 181, 111660. [Google Scholar] [CrossRef]
- Zhu, X.; Ma, K.; Yao, Y.; Song, Z.; Zhou, Y.; Si, Z.; Lu, H.; Chen, W.; Li, X. Benzothiadiazole Induced Changes in the Transcriptome and Regulation of Banana Fruit Ripening and Disease Resistance. Postharvest Biol. Technol. 2023, 196, 112161. [Google Scholar] [CrossRef]
- Skłodowska, M.; Gajewska, E.; Kuzniak, E.; Wielanek, M.; Mikiciński, A.; Sobiczewski, P. Antioxidant Profile and Polyphenol Oxidase Activities in Apple Leaves after Erwinia Amylovora Infection and Pretreatment with a Benzothiadiazole-Type Resistance Inducer (BTH). J. Phytopathol. 2011, 159, 495–504. [Google Scholar] [CrossRef]
- Li, X.; Bi, Y.; Wang, J.; Dong, B.; Li, H.; Gong, D.; Zhao, Y.; Tang, Y.; Yu, X.; Shang, Q. BTH Treatment Caused Physiological, Biochemical and Proteomic Changes of Muskmelon (Cucumis melo L.) Fruit during Ripening. J. Proteom. 2015, 120, 179–193. [Google Scholar] [CrossRef]
- Ding, X.; Zhu, X.; Zheng, W.; Li, F.; Xiao, S.; Duan, X. BTH Treatment Delays the Senescence of Postharvest Pitaya Fruit in Relation to Enhancing Antioxidant System and Phenylpropanoid Pathway. Foods 2021, 10, 846. [Google Scholar] [CrossRef] [PubMed]
- Cao, S.; Yuan, Y.; Hu, Z.; Zheng, Y. Combination of Pichia Membranifaciens and Ammonium Molybdate for Controlling Blue Mould Caused by Penicillium Expansum in Peach Fruit. Int. J. Food Microbiol. 2010, 141, 173–176. [Google Scholar] [CrossRef] [PubMed]
- Zhu, Y.J.; Qiu, X.; Moore, P.H.; Borth, W.; Hu, J.; Ferreira, S.; Albert, H.H. Systemic Acquired Resistance Induced by BTH in Papaya. Physiol. Mol. Plant Pathol. 2003, 63, 237–248. [Google Scholar] [CrossRef]
- Cao, S.; Hu, Z.; Zheng, Y.; Lu, B. Effect of BTH on Anthocyanin Content and Activities of Related Enzymes in Strawberry after Harvest. J. Agric. Food Chem. 2010, 58, 5801–5805. [Google Scholar] [CrossRef] [PubMed]
- Paladines-Quezada, D.F.; Moreno-Olivares, J.D.; Fernández-Fernández, J.I.; Bleda-Sánchez, J.A.; Gil-Muñoz, R. Different Response of Proanthocyanidins from Vitis vinifera cv. Monastrell Depending on Time of Elicitor Application. J. Sci. Food Agric. 2023, 103, 143–151. [Google Scholar] [CrossRef] [PubMed]
- Gómez-Plaza, E.; Bautista-Ortín, A.B.; Ruiz-García, Y.; Fernández-Fernández, J.I.; Gil-Muñoz, R. Effect of Elicitors on the Evolution of Grape Phenolic Compounds during the Ripening Period. J. Sci. Food Agric. 2017, 97, 977–983. [Google Scholar] [CrossRef] [PubMed]
- Coombe, B.G. Growth Stages of the Grapevine: Adoption of a System for Identifying Grapevine Growth Stages. Aust. J. Grape Wine R. 2008, 1, 104–110. [Google Scholar] [CrossRef]
- Gil, R. Improving Phenolic and Chromatic Characteristics of Monastrell, Merlot and Syrah Wines by Using Two Elicitors. Oeno One 2017, 51, 1. [Google Scholar] [CrossRef]
- Paladines-Quezada, D.F.; Moreno-Olivares, J.D.; Fernández-Fernández, J.I.; Bleda-Sánchez, J.A.; Martínez-Moreno, A.; Gil-Muñoz, R. Elicitors and Pre-Fermentative Cold Maceration: Effects on Polyphenol Concentration in Monastrell Grapes and Wines. Biomolecules 2019, 9, 671. [Google Scholar] [CrossRef] [PubMed]
- Iriti, M.; Rossoni, M.; Borgo, M.; Ferrara, L.; Faoro, F. Induction of Resistance to Gray Mold with Benzothiadiazole Modifies Amino Acid Profile and Increases Proanthocyanidins in Grape: Primary Versus Secondary Metabolism. J. Agric. Food Chem. 2005, 53, 9133–9139. [Google Scholar] [CrossRef] [PubMed]
- Wang, K.; Liao, Y.; Cao, S.; Di, H.; Zheng, Y. Effects of Benzothiadiazole on Disease Resistance and Soluble Sugar Accumulation in Grape Berries and Its Possible Cellular Mechanisms Involved. Postharvest Biol. Technol. 2015, 102, 51–60. [Google Scholar] [CrossRef]
- Salifu, R.; Jiang, Y.; Ba, L.; Zhang, Z.; Feng, L.; Li, J. Influence of Benzothiadiazole on the Amino Acids and Aroma Compositions of ‘Cabernet Gernischt’ Grapes (Vitis vinifera L.). Horticulturae 2022, 8, 812. [Google Scholar] [CrossRef]
- Carreño, J.; Martínez, A.; Almela, L.; Fernández-López, J.A. Proposal of an Index for the Objective Evaluation of the Colour of Red Table Grapes. Food Res. Int. 1995, 28, 373–377. [Google Scholar] [CrossRef]
- Kyraleou, M.; Kallithraka, S.; Gkanidi, E.; Koundouras, S.; Mannion, D.T.; Kilcawley, K.N. Discrimination of Five Greek Red Grape Varieties According to the Anthocyanin and Proanthocyanidin Profiles of Their Skins and Seeds. J. Food Compos. Anal. 2020, 92, 103547. [Google Scholar] [CrossRef]
- Topalovic, A.; Mikulic-Petkovsek, M. Changes in Sugars, Organic Acids and Phenolics of Grape Berries of Cultivar Cardinal during Ripening. J. Food Agric. Environ. 2010, 8, 223–227. [Google Scholar]
- Wang, Z.P.; Deloire, A.; Carbonneau, A.; Federspiel, B.; Lopez, F. An in Vivo Experimental System to Study Sugar Phloem Unloading in Ripening Grape Berries during Water Deficiency Stress. Ann. Bot. 2003, 92, 523–528. [Google Scholar] [CrossRef] [PubMed][Green Version]
- Keller, M.; Shrestha, P.; Hall, G.; Bondada, B.; Davenport, J. Arrested Sugar Accumulation and Altered Organic Acid Metabolism in Grape Berries Affected by the Berry Shrivel Syndrome. Am. J. Enol. Vitic. 2016, 67, 398–406. [Google Scholar] [CrossRef]
- Wang, J.; Han, Y.; Chen, C.; Sam, F.E.; Guan, R.; Wang, K.; Zhang, Y.; Zhao, M.; Chen, C.; Liu, X.; et al. Influence of Benzothiadiazole on the Accumulation and Metabolism of C6 Compounds in Cabernet Gernischt Grapes (Vitis vinifera L.). Foods 2023, 12, 3710. [Google Scholar] [CrossRef]
- Paladines-Quezada, D.F.; Moreno-Olivares, J.D.; Fernández-Fernández, J.I.; Bautista-Ortín, A.B.; Gil-Muñoz, R. Influence of Methyl Jasmonate and Benzothiadiazole on the Composition of Grape Skin Cell Walls and Wines. Food Chem. 2019, 277, 691–697. [Google Scholar] [CrossRef]
- Pérez-Magariño, S.; José, M. Effect of Ripening Stage of Grapes on the Low Molecular Weight Phenolic Compounds of Red Wines. Eur. Food Res. Technol. 2005, 220, 597–606. [Google Scholar] [CrossRef]
- Gozzo, F. Systemic Acquired Resistance in Crop Protection: From Nature to a Chemical Approach. J. Agric. Food Chem. 2003, 51, 4487–4503. [Google Scholar] [CrossRef]
- Wang, P.; Zhang, L.; Zhao, L.; Zhang, X.; Zhang, H.; Han, Y.; Jiang, X.; Liu, Y.; Gao, L.; Xia, T. Comprehensive Analysis of Metabolic Fluxes from Leucoanthocyanins to Anthocyanins and Proanthocyanidins (PAs). J. Agric. Food Chem. 2020, 68, 15142–15153. [Google Scholar] [CrossRef]
- Chen, W.; Zhang, M.; Zhang, G.; Li, P.; Ma, F. Differential Regulation of Anthocyanin Synthesis in Apple Peel Under Different Sunlight Intensities. Int. J. Mol. Sci. 2019, 23, 6060. [Google Scholar] [CrossRef]
- Costa, C.; Graça, A.; Fontes, N.; Teixeira, M.; Gerós, H.; Santos, J. The Interplay Between Atmospheric Conditions and Grape Berry Quality Parameters in Portugal. Appl. Sci. 2020, 10, 4943. [Google Scholar] [CrossRef]
- Hukkanen, A.T.; Kokko, H.I.; Buchala, A.J.; McDougall, G.J.; Stewart, D.; Kärenlampi, S.O.; Karjalainen, R.O. Benzothiadiazole Induces the Accumulation of Phenolics and Improves Resistance to Powdery Mildew in Strawberries. J. Agric. Food Chem. 2007, 55, 1862–1870. [Google Scholar] [CrossRef]
- Liu, Z.; Zhu, C.; Sun, J.; Zhang, Z.; Zhao, S.; Shi, W.; Wang, W.; Zhao, B. Influence of Rootstock on Endogenous Hormones and Color Change in Cabernet Sauvignon grapes. Sci. Rep. 2023, 13, 6608. [Google Scholar] [CrossRef]
- Herrera, J.; Castellarin, S.D. Preveraison Water Deficit Accelerates Berry Color Change in Merlot Grapevines. Am. J. Enol. Vitic. 2016, 67, 356–360. [Google Scholar] [CrossRef]
- Castellarin, S.D.; Di Gaspero, G. Transcriptional Control of Anthocyanin Biosynthetic Genes in Extreme Phenotypes for Berry Pigmentation of Naturally Occurring Grapevines. BMC Plant Biol. 2007, 7, 46. [Google Scholar] [CrossRef]
- Shahab, M.; Silvestre, P.; Ahmed, S.; Colombo, R.; Roberto, S.; Koyama, R.; Souza, R. Relationship Between Anthocyanins and Skin Color of Table Grapes Treated with Abscisic Acid at Different Stages of Berry Ripening. Sci. Hortic. 2019, 259, 108859. [Google Scholar] [CrossRef]
- Yang, L. Influential Factor of Anthocyanin Stability and the Potential Pathways Improving Their Stability. Hans J. Food Nutr. Sci. 2017, 6, 137–142. [Google Scholar] [CrossRef]
- Sandhu, A.K.; Gray, D.J.; Lu, J.; Gu, L. Effects of Exogenous Abscisic Acid on Antioxidant Capacities, Anthocyanins, and Flavonol Contents of Muscadine Grape (Vitis rotundifolia) Skins. Food Chem. 2011, 126, 982–988. [Google Scholar] [CrossRef]
- Gonzalez, A.; Olea, P.; Bordeu, E.; Alcalde, J.; Gény, L. S-Abscisic Acid, 2-Chloroethylphosphonic Acid and Indole-3-Acetic Acid Treatments Modify Grape (Vitis vinifera L. Cv. ‘Cabernet Sauvignon’) Hormonal Balance and Wine Quality. Vitis 2012, 51, 45–52. [Google Scholar]
- Iriti, M.; Rossoni, M.; Borgo, M.; Faoro, F. Benzothiadiazole Enhances Resveratrol and Anthocyanin Biosynthesis in Grapevine, Meanwhile Improving Resistance to Botrytis cinerea. J. Agric. Food Chem. 2004, 52, 4406–4413. [Google Scholar] [CrossRef]
- Fumagalli, F.; Rossoni, M.; Iriti, M.; di Gennaro, A.; Faoro, F.; Borroni, E.; Borgo, M.; Scienza, A.; Sala, A.; Folco, G. From Field to Health: A Simple Way to Increase the Nutraceutical Content of Grape as Shown by NO-Dependent Vascular Relaxation. J. Agric. Food Chem. 2006, 54, 5344–5349. [Google Scholar] [CrossRef]
- Flamini, R.; Mattivi, F.; De Rosso, M.; Arapitsas, P.; Bavaresco, L. Advanced Knowledge of Three Important Classes of Grape Phenolics: Anthocyanins, Stilbenes and Flavonols. Int. J. Mol. Sci. 2013, 14, 19651–19669. [Google Scholar] [CrossRef]
- Ullah, C.; Tsai, C.J.; Unsicker, S.B.; Xue, L.; Reichelt, M.; Gershenzon, J.; Hammerbacher, A. Salicylic Acid Activates Poplar Defense against the Biotrophic Rust Fungus Melampsora larici-Populina Via Increased Biosynthesis of Catechin and Proanthocyanidins. New Phytol. 2019, 221, 960–975. [Google Scholar] [CrossRef]
- Felicijan, M.; Kristl, J.; Krajnc, A. Pre-Treatment with Salicylic Acid Induces Phenolic Responses of Norway Spruce (Picea abies) Bark to Bark Beetle (Ips typographus) Attack. Trees 2016, 30, 2117–2129. [Google Scholar] [CrossRef]
- Han, Y.; Vimolmangkang, S.; Soria-Guerra, R.E.; Korban, S.S. Introduction of Apple ANR Genes into Tobacco Inhibits Expression of Both CHI and DFR Genes in Flowers, Leading to Loss of Anthocyanin. J. Exp. Bot. 2012, 63, 2437–2447. [Google Scholar] [CrossRef] [PubMed]
- Zhong, H.; Zhongjie, L.; Zhang, F.; Zhou, X.; Sun, X.; Li, Y.; Liu, W.; Xiao, H.; Wang, N.; Lu, H.; et al. Metabolomic and Transcriptomic Analyses Reveal the Effects of Self-and Hetero-Grafting on Anthocyanin Biosynthesis in Grapevine. Hortic. Res. 2022, 9, uhac103. [Google Scholar] [CrossRef] [PubMed]
- De Lorenzis, G.; Rustioni, L.; Parisi, S.G.; Zoli, F.; Brancadoro, L. Anthocyanin Biosynthesis during Berry Development in Corvina Grape. Sci. Hortic. 2016, 212, 74–80. [Google Scholar] [CrossRef]
- Cheng, J.; Yu, K.; Shi, Y.; Wang, J.; Duan, C. Transcription Factor VviMYB86 Oppositely Regulates Proanthocyanidin and Anthocyanin Biosynthesis in Grape Berries. Front. Plant Sci. 2020, 11, 613677. [Google Scholar] [CrossRef] [PubMed]
- Gervasi, T.; Oliveri, F.; Gottuso, V.; Squadrito, M.; Bartolomeo, G.; Cicero, N.; Dugo, G. Nero d’Avola and Perricone Cultivars: Determination of Polyphenols, Flavonoids and Anthocyanins in Grapes and Wines. Nat. Prod. Res. 2016, 30, 2329–2337. [Google Scholar] [CrossRef]
- Mattivi, F.; Guzzon, R.; Vrhovsek, U.; Stefanini, M.; Velasco, R. Metabolite Profiling of Grape: Flavonols and Anthocyanins. J. Agric. Food Chem. 2006, 54, 7692–7702. [Google Scholar] [CrossRef] [PubMed]
- Tahmaz, H.; Söylemezoğlu, G. Effects of Vinification Techniques Combined with UV-C Irradiation on Phenolic Contents of Red Wines. J. Food Sci. 2017, 82, 1351–1356. [Google Scholar] [CrossRef]
- Sridhar, K.; Charles, A.L. In Vitro Antioxidant Activity of Kyoho Grape Extracts in DPPH and ABTS Assays: Estimation Methods for EC (50) Using Advanced Statistical Programs. Food Chem. 2019, 275, 41–49. [Google Scholar] [CrossRef] [PubMed]
- Meng, T.; Xiao, D.; Muhammed, A.; Deng, J.; Chen, L.; He, J. Anti-Inflammatory Action and Mechanisms of Resveratrol. Molecules 2021, 26, 229. [Google Scholar] [CrossRef]
- Garde-Cerdán, T.; Sáenz de Urturi, I.; Rubio-Bretón, P.; Marín-San Román, S.; Baroja, E.; Ramírez-Rodríguez, G.B.; Delgado-López, J.M.; Pérez-Álvarez, E.P. Foliar Application of Methyl Jasmonate and Methyl Jasmonate Supported on Nanoparticles: Incidence on Grape Phenolic Composition Over Two Seasons. Food Chem. 2023, 402, 134244. [Google Scholar] [CrossRef] [PubMed]
- Fang, F.; Huang, W.D. Salicylic Acid Modulated Flavonol Biosynthesis in Three Key Phases during Grape Berry Development. Eur. Food Res. Technol. 2013, 237, 441–448. [Google Scholar] [CrossRef]
- Fernandez-Marin, M.; Guerrero, R.; Puertas, B.; Garcia-Parrilla, M.; Collado, I.; Cantos-Villar, E. Impact of Preharvest and Postharvest Treatment Combinations on Increase of Stilbene Content in Grape. J. Int. Sci. Vigne Vin 2013, 47, 203–212. [Google Scholar] [CrossRef]
- Ruiz-Garcia, Y.; Romero-Cascales, I.; Bautista-Ortín, A.; Gil, R.; Adrian, M.; Gomez-Plaza, E. Increasing Bioactive Phenolic Compounds in Grapes: Response of Six Monastrell Grape Clones to Benzothiadiazole and Methyl Jasmonate Treatments. Am. J. Enol. Vitic. 2013, 64, 459–465. [Google Scholar] [CrossRef]
- Xie, S.; Song, C.; Wang, X.; Liu, M.; Zhang, Z.; Xi, Z. Tissue-Specific Expression Analysis of Anthocyanin Biosynthetic Genes in White-and Red-Fleshed Grape Cultivars. Molecules 2015, 20, 22767–22780. [Google Scholar] [CrossRef] [PubMed]
- Lu, R.; Song, M.; Wang, Z.; Zhai, Y.; Hu, C.; Perl, A.; Ma, H. Independent Flavonoid and Anthocyanin Biosynthesis in the Flesh of a Red-Fleshed Table Grape Revealed by Metabolome and Transcriptome Co-Analysis. BMC Plant Biol. 2023, 23, 361. [Google Scholar] [CrossRef] [PubMed]
- Jiang, Y.; Sam, F.E.; Li, J.; Bi, Y.; Ma, T.; Zhang, B. Pre-Harvest Benzothiadiazole Spraying Promotes the Cumulation of Phenolic Compounds in Grapes. Foods 2022, 11, 3345. [Google Scholar] [CrossRef] [PubMed]
- Ju, Y.L.; Liu, M.; Zhao, H.; Meng, J.F.; Fang, Y.L. Effect of Exogenous Abscisic Acid and Methyl Jasmonate on Anthocyanin Composition, Fatty Acids, and Volatile Compounds of Cabernet Sauvignon (Vitis vinifera L.) Grape Berries. Molecules 2016, 21, 1345. [Google Scholar] [CrossRef]
- Ju, Y.L.; Liu, B.C.; Xu, X.L.; Wu, J.R.; Sun, W.; Fang, Y.L. Targeted Metabolomic and Transcript Level Analysis Reveals the Effects of Exogenous Strigolactone and Methyl Jasmonate on Grape Quality. Sci. Hortic. 2022, 299, 111009. [Google Scholar] [CrossRef]
Disclaimer/Publisher’s Note: The statements, opinions and data contained in all publications are solely those of the individual author(s) and contributor(s) and not of MDPI and/or the editor(s). MDPI and/or the editor(s) disclaim responsibility for any injury to people or property resulting from any ideas, methods, instructions or products referred to in the content. |
© 2024 by the authors. Licensee MDPI, Basel, Switzerland. This article is an open access article distributed under the terms and conditions of the Creative Commons Attribution (CC BY) license (https://creativecommons.org/licenses/by/4.0/).