1. Introduction
In agricultural production, weeds pose a significant threat to crop growth and yield, often causing more severe losses than those inflicted by pests and fungi [
1,
2,
3]. However, conventional large-scale and full-coverage herbicide spraying leads to excessive herbicide usage, soil pollution, and potential threats to food safety. Hence, from the perspectives of cost investment, fertilizer usage, and ecological safety, the primary research focus for field weed control operations should be on precise weed identification, advanced weed control technology, and minimizing or eliminating the use of herbicides [
4,
5,
6]. Moreover, this kind of weed treatment method plays a very important role in promoting the development of organic green agriculture that strictly controls the amount of herbicide applied [
7,
8].
Smart agriculture refers to the combination of modern digital technologies and agricultural production to achieve the digitization, automation, and intelligence of the agricultural production process [
9]. As one of the most important technologies in the field of smart agriculture, machine-vision-based detection techniques have made significant progress in the field of agricultural production. Weed identification based on machine vision and deep learning has become the mainstream solution for achieving efficient weed identification due to its advantages, such as non-contact detection, high efficiency and high precision, and saving manpower and costs [
10,
11,
12]. YOLO (You Only Look Once) represents a streamlined, one-stage methodology designed specifically for object detection. It significantly enhances the speed of this process by employing a Convolutional Neural Network (CNN) architecture, efficiently identifying both the locations and the types of objects present within the image. YOLO5 accurately and quickly detected weeds and crops in images at a rate of 40 frames per second with a detection speed of 0.02 s per image and mAP IOU@0.5 of 0.88 [
13]. Continuous improvements have been proposed for YOLO-based methods to detect weeds. The GTCBS-YOLOv5s model was proposed to identify six types of weeds in paddy fields [
14]. They introduced a bidirectional Feature Pyramid Network coupled with a Concat structure in the Neck network to achieve multi-scale feature fusion, thereby effectively identifying various types of weeds. The detection network employed three distinct output feature maps to discern weeds of varying sizes and a comprehensive scale-sensitive intersection-over-union (SIoU) loss function was incorporated to mitigate redundant detection boxes. The results showed that the mean average precision (mAP) of the model on the test set was 91.1%, and the recognition speed reached 85.7 frames per second (FPS). YOLO v5 and CBAM attention mechanisms were combined to construct a dataset by slicing high-resolution images and calculating the overlap rate, thereby reducing the possibility of losing details due to compressing high-resolution images during training [
15]. Comparison results showed that the improved model had higher precision and recall than YOLO v5. After multi-scale training, the network performance was further improved, and the average precision (AP) of YOLO-CBAM increased from 0.9017 to 0.9272. Furthermore, research and reports on vision-based and machine learning weed removal devices and robots are gradually increasing and have developed into a research hotspot in intelligent field agriculture [
6,
16].
Although existing methods for crop and weed identification have undergone continuous enhancement, the challenge persists due to the vast array of weed species with varying shapes and forms found in agricultural fields. For some weeds with relatively rare morphologies or small quantities, there is a continuous need to expand the weed image dataset and conduct model training, which often causes great challenges to researchers. Therefore, the weed detection method urgently needs improvement and innovation.
In response to this challenge, an advanced crop recognition algorithm leveraging an improved YOLOv8 framework is present in this study. The improved model significantly enhances feature extraction capabilities by replacing the C2f layer with the CSPStage layer and optimizing PANet with the introduction of the GFPN feature fusion module. Furthermore, the multi-SEAM attention mechanism is integrated to deeply explore critical feature information. In the post-processing stage, the Slide Loss function is adopted to replace the traditional loss function, which not only improves detection accuracy and efficiency but also ensures the model’s outstanding performance in real-time detection scenarios. Finally, OpenCV image processing technology is used for reverse weed recognition detection. This methodology is characterized by precise, swift, and comprehensive weed detection capabilities, thereby contributing to the elevated automation and intelligence of field weeding operations.
2. Materials and Methods
2.1. Image Aquisiton
2.1.1. Laboratory Image Acquisition
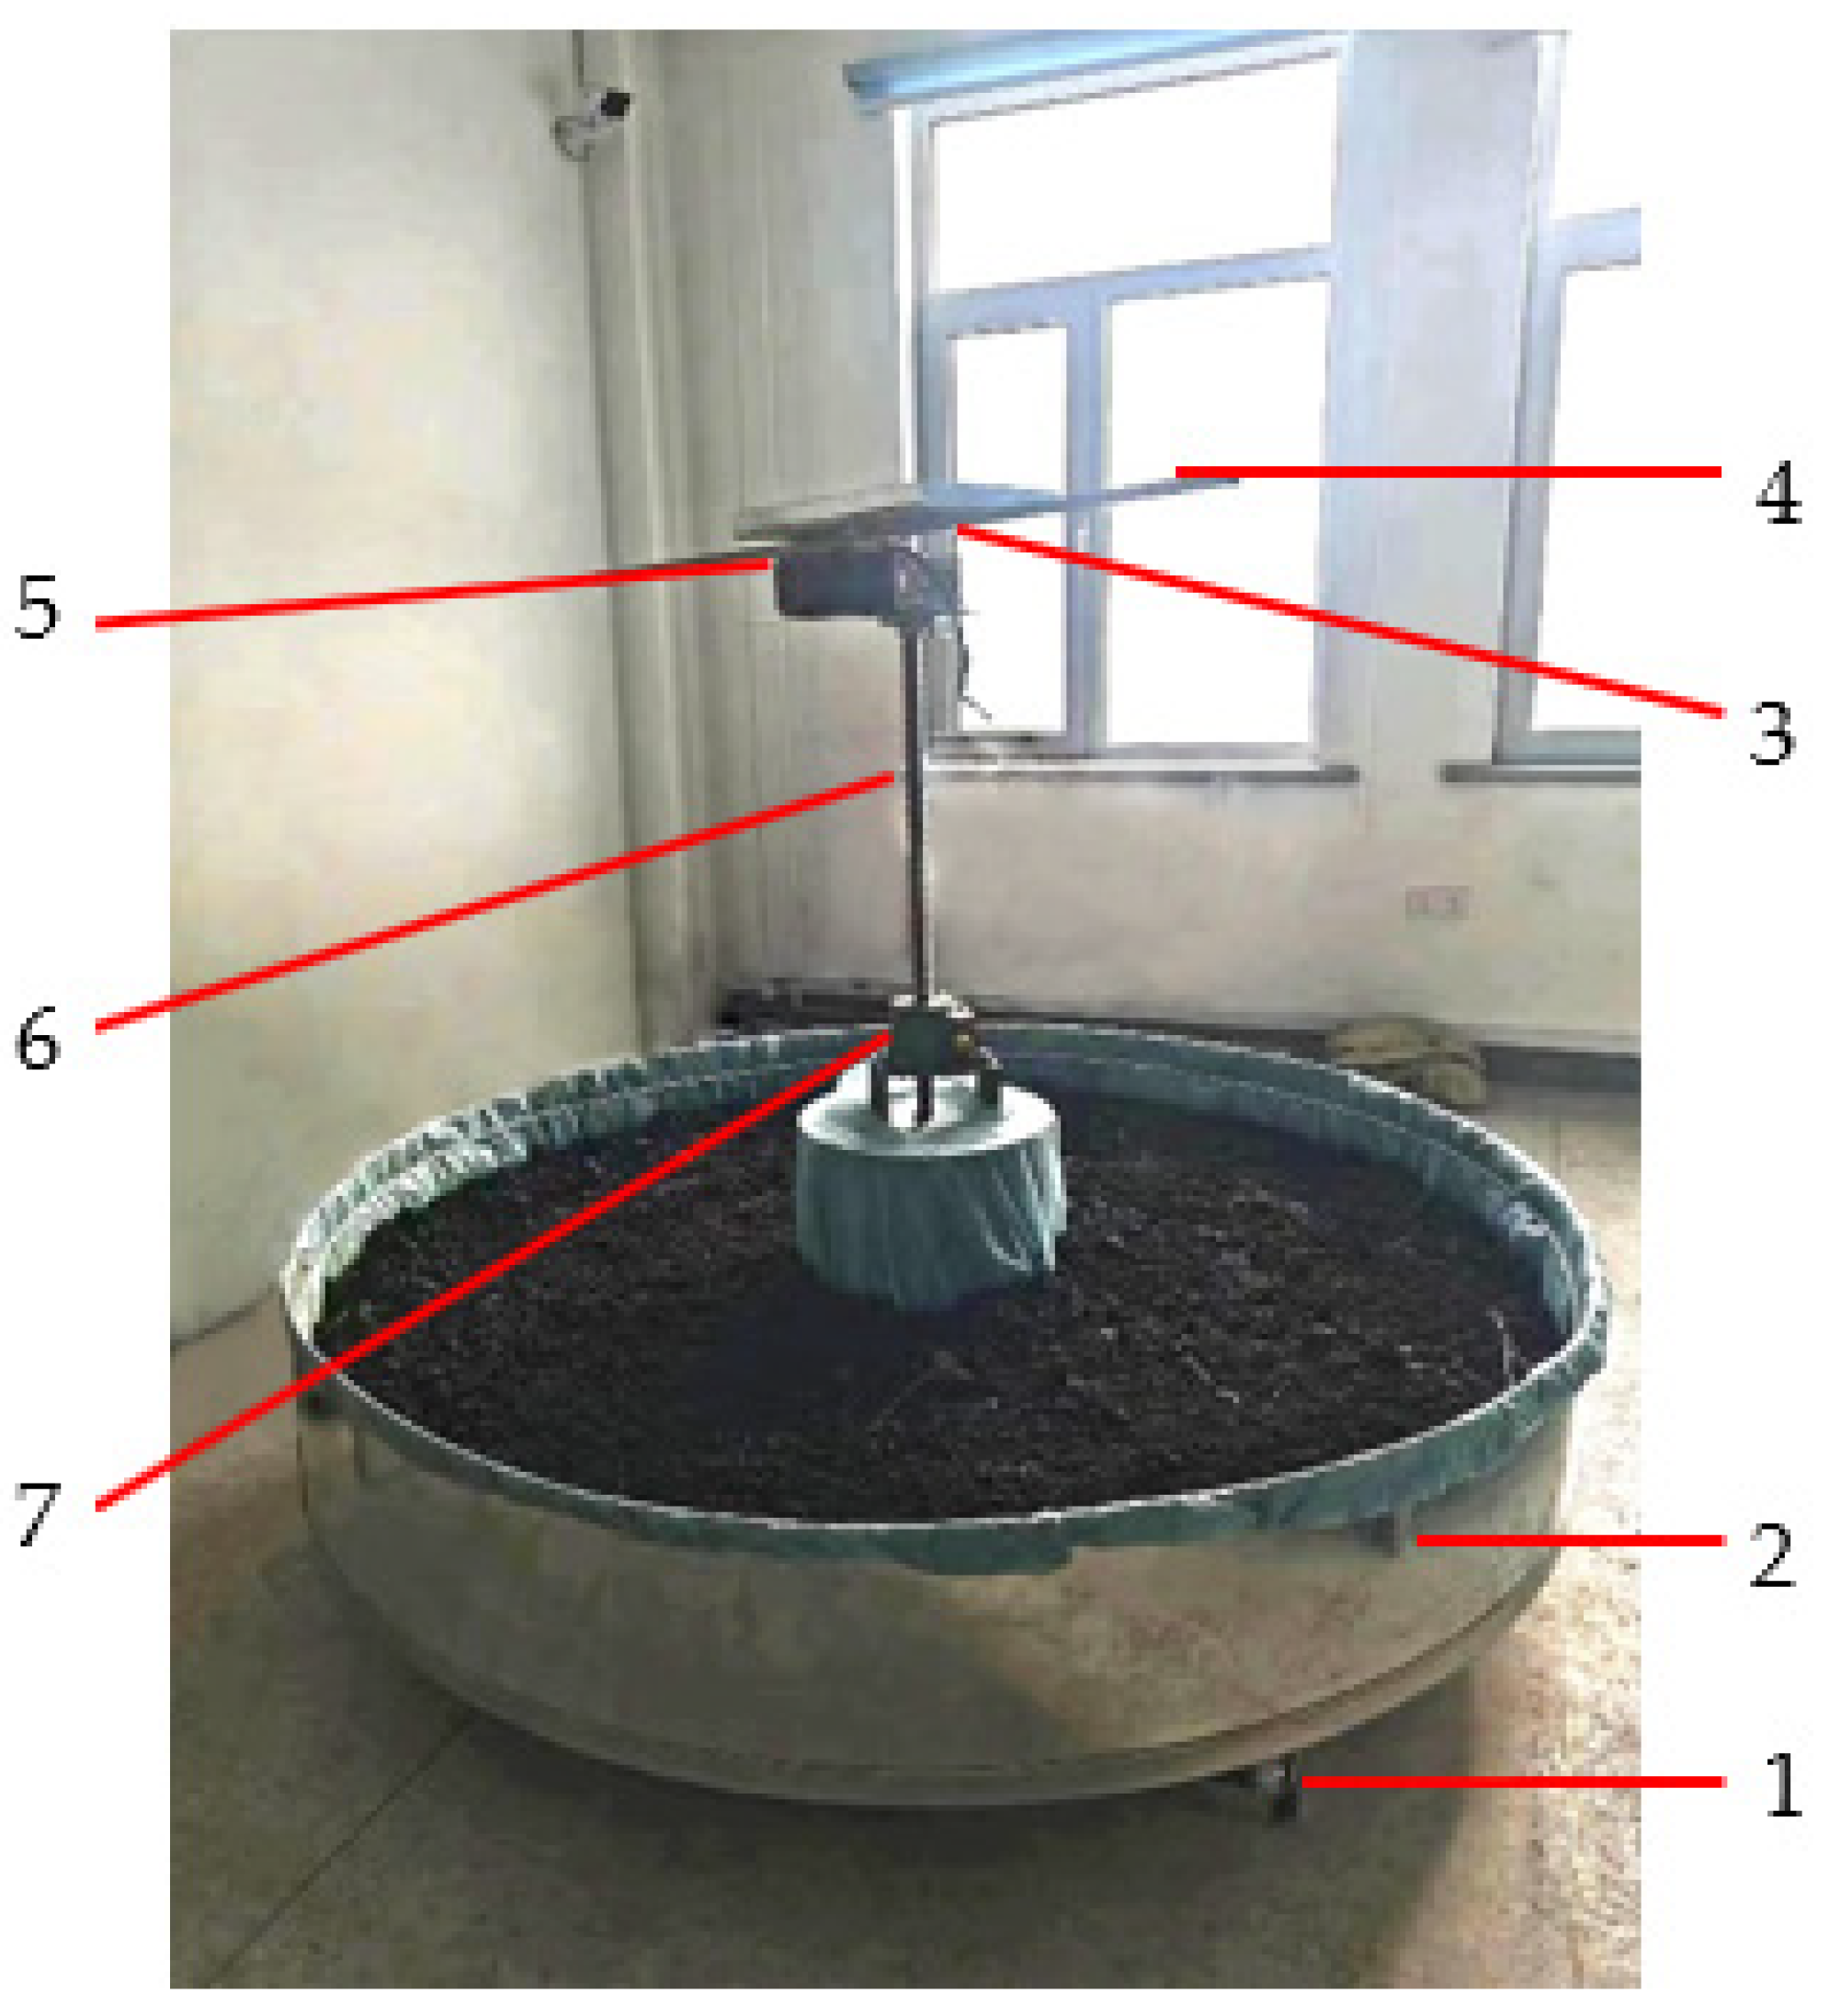
A laboratory experiment was conducted in the Weed Detection and Identification Laboratory of Northeast Agricultural University, situated in Heilongjiang Province, China. The weed identification testbed comprises a rotating base, a rotation speed controller, a camera bracket, a rotation motor, a lifting motor, and other components, as shown in
Figure 1. The camera bracket can be moved vertically and rotated horizontally, independently controlled by the rotation motor and lifting motor, respectively. The rotation speed of the camera is regulated by the rotation speed controller. The indoor environment was maintained at a temperature range of 23–24 °C, with a relative humidity of approximately 75%. The crop grown was corn (variety: Longdan 137). The photography period spanned from 12 December to 24 December 2023, totaling 12 days. The corn growth cycle covered in these images ranged from the 8th to the 20th day after sowing, encompassing the stages from corn seedlings to the four-leaf stage. The primary weeds present are teeth-edged spikes and amaranth, which are common in northeastern China. We divided the soil box into four sectors evenly and took photos of the soil surface at the same time and height every day.
The device utilized for capturing images was an iPhone XR mobile phone, equipped with a resolution/device pixel of 12 million pixels. After the 20th day of planting, a total of 879 pictures were captured. A representative corn image captured during this study is presented in
Figure 2.
2.1.2. Field Image Acquisition
In order to demonstrate the practicality, the model was used to detect actual corn seedling pictures, which were collected in the experimental field of Northeast Agricultural University in Harbin, China (45°44′34″ N, 126°43′39″ E). The experimental field had an altitude of approximately 150 m, with a mid-temperate continental monsoon climate. The annual average precipitation was 523 mm. The shooting times were on 17 May 2024, with a temperature of around 20 °C, sunny with sufficient sunlight, and on 23 May 2024, with a temperature of around 15 °C, cloudy with weaker light. The crops in the field images were corn, specifically the variety Huangtianjianuo 521. The experiment was mainly carried out in the four-leaf stage, with a small number of seedlings in the 2–3-leaf stage. The average height of the crops was 15–20 cm. The weeds included thistles, amaranths, etc., with heights ranging from 5 cm to 15 cm. The shooting height was 30–100 cm from the ground to the camera.
2.2. Dataset Composition and Preprocessing
To enhance the model’s generalization capacity and robustness while mitigating overfitting, this study employed data augmentation techniques on the images. These techniques encompassed the horizontal or vertical flipping of images, rotation, brightness adjustment, scaling, cropping, and the addition of minor noise levels, among others [
17]. While enhancing the diversity of the images, data augmentation also expanded the dataset’s sample, ultimately resulting in a total of 3438 images after augmentation.
The entire collection of processed images was then partitioned into a training set and a validation set, with a ratio of 8:2, resulting in 2754 training images and 684 validation images. LabelImg was utilized to annotate the gathered images, assigning a single label of ‘Maize’ to identify corn seedlings. The annotations were initially saved in an xml format but were later converted to the txt format required by the YOLO algorithm.
In this study, the software environment for conducting training experiments comprised a robust deep-learning framework built upon Windows 10. This framework leveraged Python 3.8, Torch 1.10.0, CUDA v10.2, and cuDNN v7615 for optimized performance. Furthermore, to realize the capabilities of Ultralytics YOLO v8.0.78, the hardware setup consisted of an Intel® Core™ i7-8750H CPU clocked at 2.20 GHz, accompanied by an NVIDIA GeForce GTX 1050 graphics card, ensuring sufficient computational power for the experiments.
2.3. Improved YOLO v8 Algorithm
2.3.1. YOLO v8 Target Recognition Algorithm
YOLO (You Only Look Once) [
18,
19,
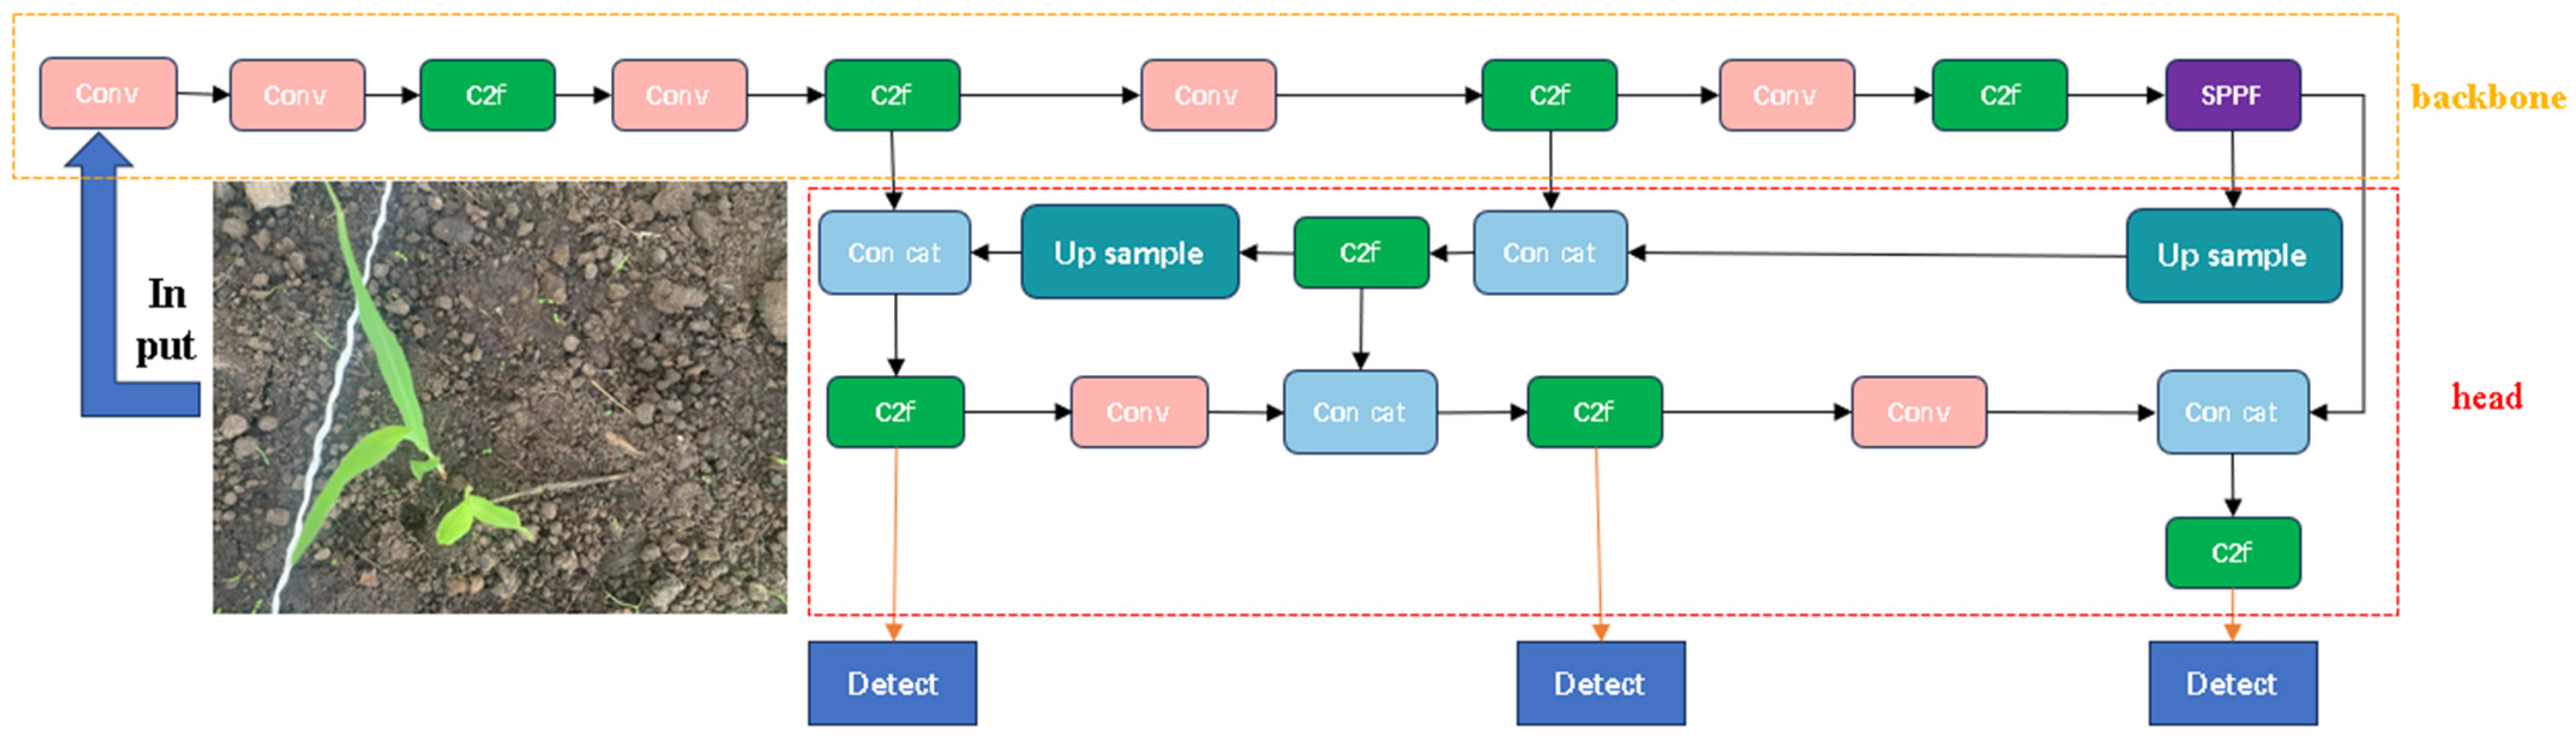
20] is a real-time target recognition algorithm based on deep learning. YOLO v8 introduces a new backbone network architecture, enhancing its feature extraction and processing capabilities, ultimately resulting in more precise target detection and segmentation, as shown in
Figure 3. YOLO v8 innovates by utilizing an Anchor-Free detection head, which eliminates the dependence on anchor boxes. This approach grants the model greater flexibility, enabling it to adapt seamlessly to the diverse shapes and sizes of the targets. Furthermore, YOLO v8 introduces a novel loss function, enhancing the model’s convergence speed and overall performance [
21]. In addition, YOLO v8 also uses a new loss function to further improve the convergence speed and performance of the model. Notably, YOLO v8n, a variant specifically tailored for mobile devices, maintains a swift recognition speed while maintaining high accuracy. Its streamlined design ensures easy deployment on embedded and cost-effective devices [
22]. Therefore, this paper uses YOLO v8n as the primary model.
2.3.2. GFPN Feature Fusion Module
In this research, the PANet feature fusion module [
23], present in the v8 source code, was substituted with GFPN feature fusion. The conventional FPN adopts a top-down method to integrate multi-scale features spanning from level 3 to level 7 [
24]. However, it falls short in facilitating feature transfer between cross-scale and same-scale cross-layers, thereby limiting the comprehensive utilization of feature information.
Figure 4 illustrates the feature fusion aspect of PANet. Fortunately, GFPN effectively addresses this limitation.
The Generalized-FPN (GFPN) was introduced by Jiang et al. in their novel “giraffe-like” GiraffeDet architecture [
25]. Derived from PANet, GFPN introduces cross-scale connections between adjacent layers and cross-layer connections among features of the same scale. It integrates level features from both the previous and current layers, while the log2n skip layer connections provide more efficient information transfer. This design allows GFPN to scale effectively to deeper networks. The feature fusion of GFPN is shown in
Figure 5. Based on the light backbone and heavy Neck mode, the GiraffeDet family performs well in a variety of FLOP performance trade-offs.
2.3.3. Multi-Scale Extended Attention Mechanism
Multi-SEAM [
26] is essentially similar to SEAM, commencing with channel convolutions. The depthwise separable convolution technique effectively learns the importance of different channels while simultaneously reducing the number of parameters. To compensate for the potential loss of inter-channel information that depthwise separable convolutions may overlook, multi-SEAM employs the outputs of various depthwise convolutions and combines them through 1 × 1 pointwise convolutions. Subsequently, two fully connected layers are utilized to fuse the information from each channel, strengthening the connections between channels. The logits output by the fully connected layers undergoes exponential processing, expanding their value range from [0, 1] to [1, e]. This exponential normalization method provides monotonic mapping, making the model more tolerant of positional errors.
2.3.4. Slide Loss Function
Slide Loss [
26] is a weighting function designed to address the imbalance between easy and difficult samples encountered during training. It achieves this by dynamically adjusting sample weights. To differentiate between easy and challenging samples, Slide Loss relies on the intersection over union (IoU) metric, comparing the predicted bounding box with the ground truth bounding box. To streamline the process and minimize the need for numerous hyperparameters, the function sets the threshold
μ as the average IoU between all potential positive samples and the actual annotations. Samples falling below this threshold are categorized as negative, while those exceeding it are deemed positive. This approach ensures that the model focuses more on challenging samples, thereby enhancing its performance and robustness.
The Slide Loss function model accentuates its focus on difficult samples during training. Specifically, for samples that reside near the classification boundary (i.e., samples with an IoU value close to the threshold
μ), their weights within the loss function are escalated. This approach enables the model to leverage these boundary samples more effectively during training, as shown in
Figure 6. Consequently, Slide Loss aids in enhancing the model’s capacity to detect challenging samples, thereby improving its overall performance.
The Slide Loss function model pays more attention to difficult samples during training. For samples close to the boundary (that is, samples whose IoU is close to
μ), their weights in the loss function are increased, as shown in
Figure 6. This allows the model to make better use of these samples for training. In this way, Slide Loss helps improve the model’s ability to detect difficult samples. The mathematical expression of the Slide Loss function is shown in Equation (1):
where
x is the IoU value between the predicted bounding box and the true bounding box, and
μ is the average IoU value of all positive samples.
2.3.5. Improved YOLO v8 Recognition Algorithm Architecture
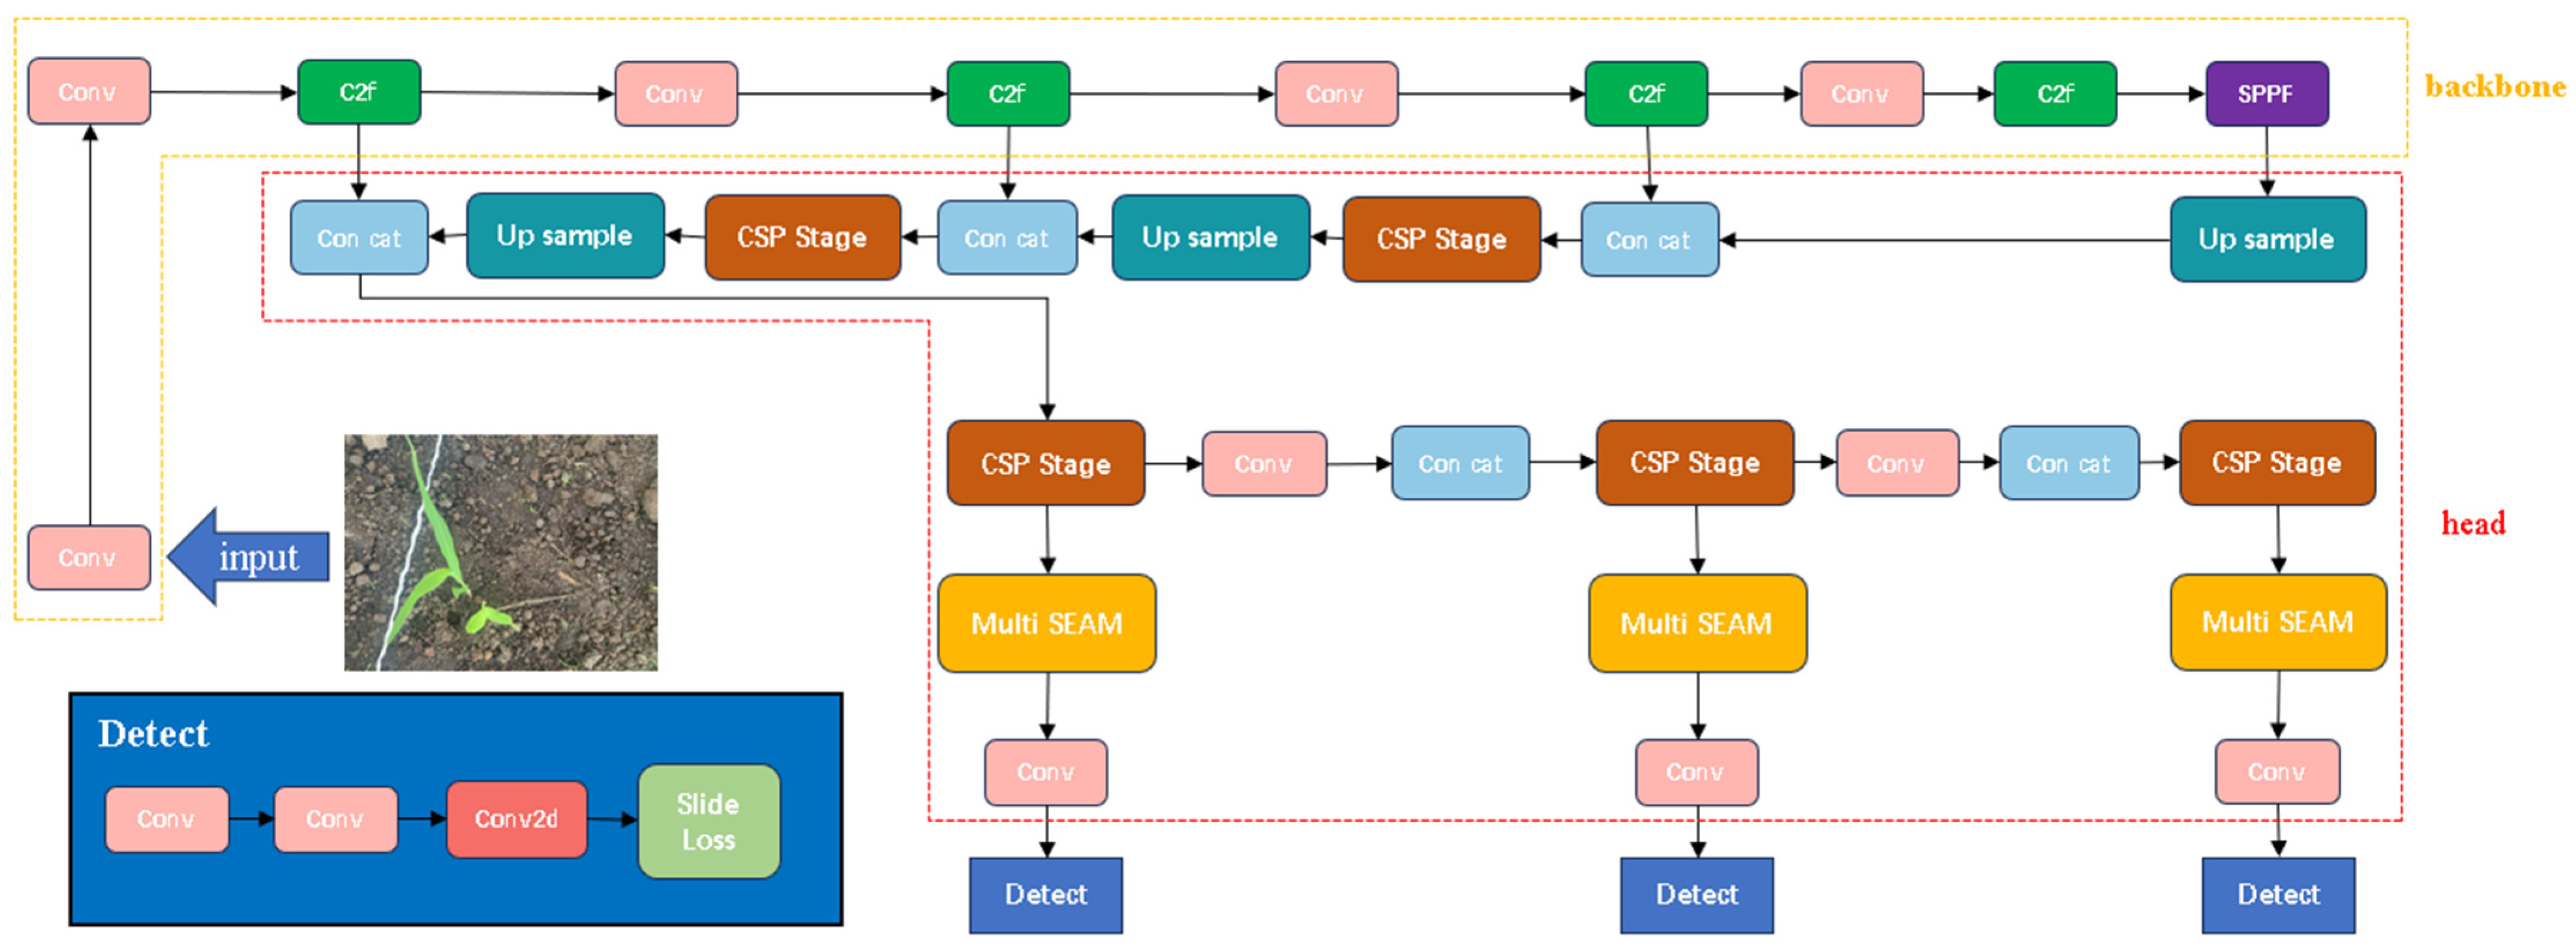
The improved YOLO v8 model replaces the C2f layer in the head network with the CSPStage layer and successfully introduces the GFPN feature fusion module to replace the PANet feature fusion module in the v8 source code. This module adds cross-scale connections between adjacent layers and cross-layer connections at the same scale and fuses the level features of the previous and current layers. Information can be extended to a deeper network so that information is transmitted more efficiently. Based on GFPN-YOLO v8, the multi-SEAM attention mechanism is introduced into the network; this attention mechanism calculates attention features of different sizes through parallel convolution modules and averages these features.
Three multi-SEAM attention mechanisms were employed in the head network at layers 25, 27, and 29. Each module employed a distinct convolution kernel size to perform convolutions on the input data and then consolidated attention features via global average pooling. This approach enabled the model to adeptly adapt to inputs of diverse scales, fostering tighter inter-channel connections. Consequently, the model becomes more adept at processing occlusion information and exhibits superior flexibility and precision in handling intricate tasks.
At the post-processing stage, the Slide Loss function was used as a replacement for the original loss function. By leveraging a sliding window mechanism, the Slide Loss addresses the issue of sample imbalance, adjusting the boundaries of positive and negative samples to a range that is more suitable for small targets. This enhancement elevates the detection accuracy for small objects. Additionally, it improves the balance between positive and negative samples, bolstering the model’s detection capabilities for objects belonging to diverse categories. This prevents the model from primarily focusing on learning features from easy samples during training while neglecting difficult samples. Ultimately, the introduction of Slide Loss enhances the accuracy and robustness of the target detection model during training. The refined model architecture is shown in
Figure 7.
2.3.6. Evaluation Metrics
Average precision (AP) is often used to evaluate the recognition ability of target recognition algorithms. AP is calculated by integrating precision with recall. The specific calculation method is as follows.
In Equations (2) and (3), TP (True Positive) represents the count of positive samples that are correctly identified, FP (False Positive) stands for the number of negative samples mistakenly identified, and FN (False Negative) signifies the number of positive samples mistakenly classified as negative. By plotting recall on the horizontal axis and precision on the vertical axis, we obtained a precision–recall (P–R) curve, where precision and recall exhibited a negative correlation.
where
r is the recall rate and
P(
r) represents the precision rate when the recall rate is
r.
In addition, the recall rate and precision rate are affected by the confidence threshold, and the AP values of different categories of targets are also different. In order to evaluate the accuracy of the model more objectively, we used the mean average precision (mAP). The calculation method is as follows: calculate the AP values of all categories of targets under 10 different confidence threshold settings and then calculate the average of these AP values. Usually, the confidence threshold is set in the range of 0.5–0.95 with a step size of 0.05. The F1 score is also a measure of classification. It is a harmonic mean function of the precision and recall rate between 0 and 1. The larger the value, the better the recognition performance. The equation is shown as follows.
In order to save time and improve work efficiency, this study randomly selected multiple experiments and found that after 70 rounds, the accuracy, mAP value, recall rate, and other indicators increased slowly or even stopped increasing. Therefore, the training rounds were set to 70. Mosaic data enhancement was turned off, pre-training weights were disabled, and the rest of the experimental training environments remained default.
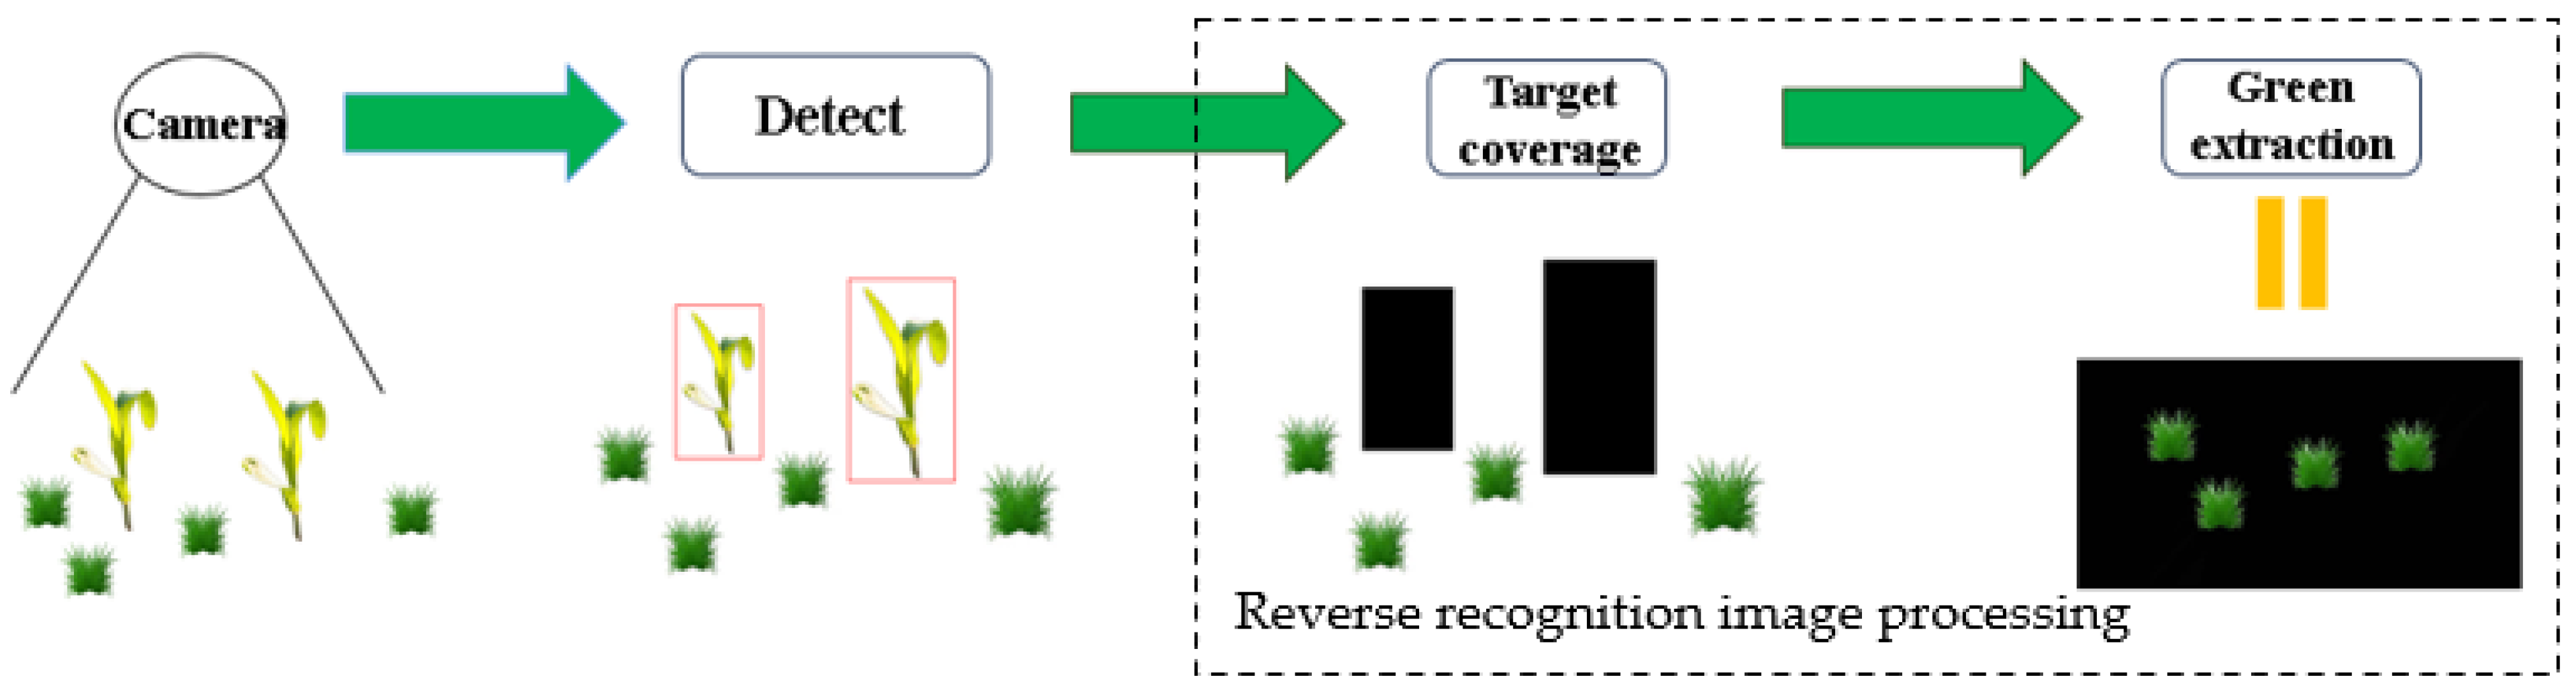
2.4. Weed Reverse Detection Method
After accurately identifying target crops, an OpenCV-based reverse identification image processing method for weeds was proposed, which mainly includes the following two main steps.
The recognition algorithm based on YOLO v8 can quickly and accurately locate and identify various objects in the image, including the target crop. Then, the identified crops were filled with black; that is, the pixel value in the crop area was set to black, and the crop was removed from the picture, thus achieving the separation of the crop image.
- (ii)
Green extraction
OpenCV (open-source computer vision library) was used to convert the BGR color space into the HSV (hue, saturation, value) color space. The green extraction operation was performed on the HSV range of (40, 40, 40)–(70, 255, 255) in the picture, retaining the green information captured by the camera in the picture and covering the non-green part with black. This step needed to be performed after YOLO recognition so as to avoid the noise interference of green extraction on the image and reduce the impact of noise on YOLO recognition.
3. Results
3.1. Improved Model Experimental Comparison
In order to more comprehensively demonstrate the performance of this model, the improved model was compared with the mainstream recognition models and with other YOLO series algorithms. The training results are shown in
Table 1.
The experimental results showed that the improved YOLO v8 model outperformed other YOLO algorithms in terms of precision, recall, F1, mAP50, and mAP50-95.
Figure 8 shows the P–R curves before and after improvement. The results indicate that the improved model performed better than the original YOLO v8 on the training set, with a 1.5% increase in mAP. Moreover, the recognition time on the test machine was only 10 ms longer than that of YOLO v8 and 6ms longer than that of YOLO v7, which was comparable to YOLO v5 and better than the other algorithms, meeting the requirements of real-time recognition. Moreover, the results showed that the recognition speed of YOLO v9 was slightly higher than that of YOLO v8, but the accuracy of YOLO v10 was weaker than that of YOLO v8. Therefore, after comprehensive analysis, the improved v8 model was chosen for further recognition.
The figure below shows a comparison of heatmaps between YOLO v8 (
Figure 9a) and the improved YOLO v8 (
Figure 9b). As can be seen from
Figure 9, the red areas in the heatmap of the improved YOLO v8 are more concentrated, with clearer boundaries of the targets, more targets, and more concentrated heat at each target location. This indicates that the improved model had a higher confidence in the target locations and improved detection accuracy and sensitivity. Additionally, the improved model significantly reduced background noise, avoiding false alarms, and the overall detection performance significantly improved.
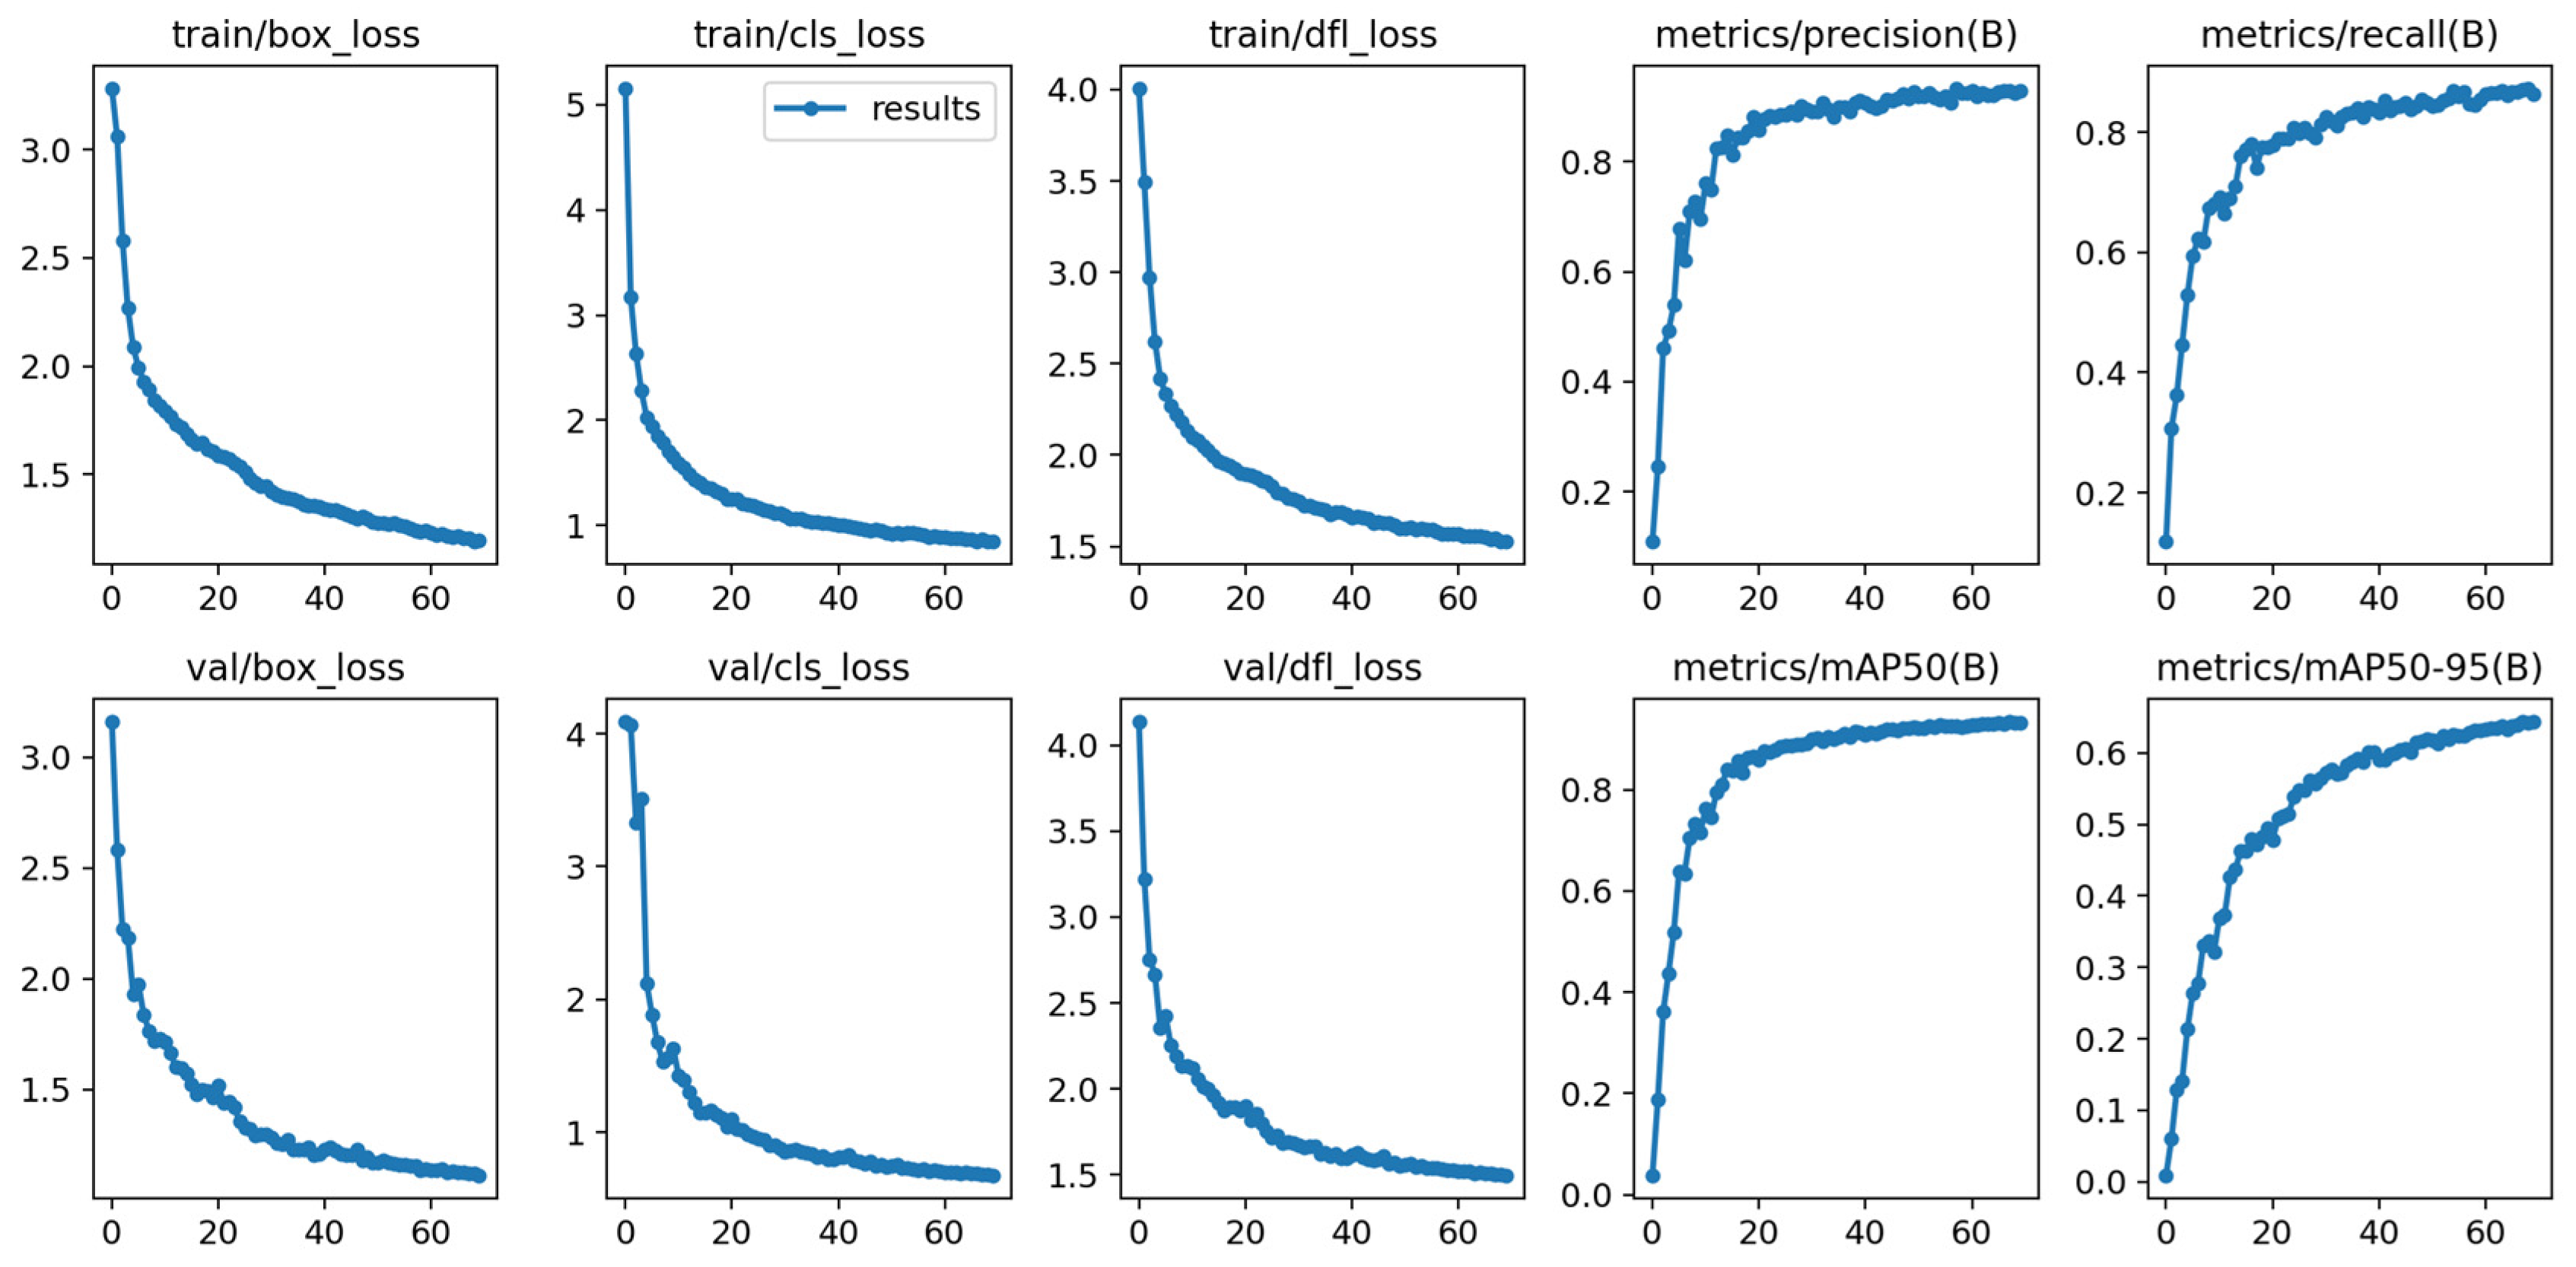
Figure 10 demonstrates the trend of changes in the loss functions and evaluation metrics during the training and validation processes of the improved YOLO v8 model. It can be observed that as the training progressed, the model’s training and validation losses significantly decreased, indicating a gradual improvement in the model’s prediction accuracy in these aspects. Concurrently, the model’s various evaluation metrics on the validation set also showed remarkable improvements, with precision rising from nearly 0.2 to 0.9, recall increasing from approximately 0.2 to over 0.8, and mAP at an IoU threshold of 0.5 increasing from near 0 to almost 0.9. Furthermore, the AP across different IoU thresholds (ranging from 0.5 to 0.95) increased from nearly 0 to above 0.6. These results suggest that the YOLO v8 model effectively learned the object detection task during training and exhibited good generalization capabilities on the validation set.
In order to fully demonstrate the performance of the improved model, each model was set to recognize the same corn image and output the recognition results (
Figure 11). As can be seen from
Figure 11, the improved YOLO v8 model had better recognition effects than all other models. Although the confidence rates of a few recognition frames of the YOLO v6 and YOLO v7 models were higher than those of improved YOLO v8, there were omissions in recognition in these two algorithms. The YOLO v3 and YOLO v8 recognition frames overlapped and were messy, which could affect subsequent processing. The YOLO v5 recognition effect was relatively good, but the confidence rates of most recognition frames were lower than those of the improved YOLO v8 model, and it did not perform well for overlapping targets. The improved YOLO v8 model not only achieved comprehensiveness and accuracy in detecting targets but also showed good performance for complex overlapping targets.
The weed reverse recognition method proposed in this study first used YOLO v8 to quickly and accurately locate and identify crops in the images captured by the camera and covered the identified target crops with black to separate the crop images. The green extraction step was to separate the weeds within the green range of the picture from the image, and the rest were regarded as the background and filled with black so that the crops and background were deleted from the picture, and only the weed images were retained, and finally, comprehensive weed detection was achieved. The flow is shown in
Figure 12.
Figure 13 shows the results of the weed reverse detection method.
3.2. Field Picture Test
For field image acquisition and preprocessing, the detection results are shown in
Figure 14 and
Table 2.
Figure 14 shows that the improved YOLO v8 model can accurately identify corn seedlings when processing images under different sunlight conditions. Even in an environment filled with various types of weeds, the model can successfully identify them, demonstrating its excellent practicality. It can be seen from
Table 2 that under the height of 80–100 cm, especially at 90 cm, the detection effect is significantly better than that of other heights. One of the reverse weed recognition detections in
Figure 13 is shown in
Figure 15.
4. Discussion
(1) Based on YOLO v8, this paper employs data augmentation techniques on the dataset to reduce the model’s dependence on certain features, increase the amount of data, improve data quality, and enhance data diversity, thus enabling the model to achieve high robustness in weed identification and avoid overfitting. Mahmudul et al. utilized data augmentation to increase the diversity of datasets, alleviating the imbalance issue in large datasets [
27]. By contrast, thousands of weed images were acquired, and a medium-scale dataset was built at the seedling stage of the cotton field scenario [
28]. So, in this research, data augmentation can enhance the performance of the model and positively impact the accuracy of crop weed detection and classification for smaller datasets.
(2) YOLO v8 leverages an advanced backbone network to capture richer features, while newly designed detection heads enhance the accuracy and diversity of object detection. Optimized training strategies ensure both stability and efficiency in model performance. These enhancements enable YOLO v8 to surpass its predecessors.
GFPN, built upon the foundation of FPN(Feature Pyramid Networks) + PAN(Path Aggregation Network), was used to incorporate a cross-layer connection structure. This allowed the output features of FPN at different scales to intersect, thereby enhancing the transfer of feature information. It also minimized computational load. Therefore, the improved YOLO v8 method demonstrated higher precision and recognition speed than YOLO v8 and lower versions. This conclusion can be found in other detection applications [
28,
29].
Slide Loss employs a sliding window mechanism to prevent the model from focusing primarily on easy samples during training, ensuring difficult samples are adequately learned. By adjusting the boundaries of positive and negative samples to better suit small targets, the detection accuracy for these targets is enhanced. Similar research has been reported in other areas [
26].
(3) When testing field corn images with different shooting heights, if the shooting height is relatively low (30–50 cm), the camera is close to the corn seedling, resulting in a larger proportion of the plants in the image. This makes it easier for the model to capture corn leaves and achieve a high recognition rate. However, there ARE ALSO situations where the same corn seedling appears in different photos, leading to repeated detection. When shooting photos at a medium height (60–70 cm), it is occasionally the case that the whole crop and its leaves are detected simultaneously, causing a small amount of overlap. When shooting photos at a higher height (80–100 cm), the proportion of corn seedlings in the image is relatively small, which is more in line with the characteristics of the model training. This makes it easier for the model to capture the whole corn plant, and the overlap and intersection phenomenon is reduced. Therefore, the detection effect of corn seedlings is better when the height is 80–100 cm. It is recommended to use this height for monitoring probes when weeding in the field.
5. Conclusions
(1) In this study, the PANet feature fusion module of YOLO v8 was innovatively substituted with GFPN feature fusion, significantly enhancing its performance. Moreover, the integration of three multi-SEAM attention mechanisms into specific layers (25, 27, and 29) of the head network further bolstered its accuracy. In the crucial post-processing phase, the introduction of the Slide Loss function as a replacement for the original loss function marked another milestone in improving the model’s overall efficacy.
The experimental outcomes are noteworthy, demonstrating that the improved YOLO v8 algorithm surpasses other YOLO series models in terms of crucial metrics. Specifically, it achieved an accuracy of 92.9%, a recall rate of 87.0%, an F1 score of 90%, mAP50 of 93.4%, and mAP50-95 of 64.4%. These improvements not only validate the effectiveness of the modifications but also establish the algorithm as a highly competent solution for real-time detection tasks. Remarkably, the detection speed on the test machine was merely 22.47 ms, ensuring swift and efficient performance in practical applications.
(2) A novel weed reverse detection approach, incorporating target coverage analysis and green color extraction utilizing OpenCV’s image processing capabilities, has been proposed. This method efficiently and comprehensively detects various weed types, overcoming the challenge posed by the diverse morphological differences among numerous weed species in the field, where traditional detection methods are limited to identifying only the primary crops and weeds.
(3) The improved model was tested on field images. It accurately identified crop seedlings regardless of their height in the farmland. Even in environments with mixed weeds, the model was able to successfully identify them, demonstrating good practicality.
This study provides a novel weed detection method for agricultural production, which contributes to automating and intelligent field weeding operations. In future work, further optimized algorithms will be taken into account to achieve real-time processing capabilities on embedded and mobile devices, facilitating their practical deployment under field conditions. We will explore techniques such as model pruning, quantization, and edge computing to develop adaptive learning systems that can update and improve models based on real-time feedback from the field. Ultimately, we aim to integrate the weed detection system with autonomous weed-removal robots to achieve precise mechanical weeding without the use of chemical herbicides, thereby promoting sustainable agricultural practices.
Author Contributions
Conceptualization, H.L. and J.Z.; data curation and software, Y.H. and S.H.; writing—original draft preparation, P.Z. and H.L.; writing—review and editing, P.Z.; project administration and funding acquisition, J.Z. All authors have read and agreed to the published version of the manuscript.
Funding
This research was supported by the National Key R&D Program of China (2023YFD2300100), the earmarked fund for CARS (CARS-04), and the new round of Heilongjiang Province’s “double first-class” discipline collaborative innovation achievement project (LJGXCG2023-038).
Data Availability Statement
The original contributions presented in the study are included in the article, further inquiries can be directed to the corresponding author.
Conflicts of Interest
The authors declare no conflicts of interest.
References
- Gharde, Y.; Singh, P.K.; Dubey, R.P.; Gupta, P.K. Assessment of yield and economic losses in agriculture due to weeds in India. Crop Prot. 2018, 107, 12–18. [Google Scholar] [CrossRef]
- Hussain, Z.; Marwat, K.B.; Cardina, J.; Khan, I.A. Xanthium stramonium L. Impact on corn yield and yield components. Turk. J. Agric. For. 2014, 38, 39–46. [Google Scholar] [CrossRef]
- Tursun, N.; Datta, A.; Sakinmaz, M.S.; Kantarci, Z.; Knezevic, S.Z.; Chauhan, B.S. The critical period for weed control in three corn (Zea mays L.) types. Crop Prot. 2016, 90, 59–65. [Google Scholar]
- Ju, J.Y.; Chen, G.Q.; Lv, Z.Y.; Zhao, M.Y.; Sun, L.; Wang, Z.T.; Wang, J.F. Design and experiment of an adaptive cruise weeding robot for paddy fields based on improved YOLOv5. Comput. Electron. Agric. 2024, 219, 108824. [Google Scholar] [CrossRef]
- Meesaragandla, S.; Jagtap, P.M.; Khatri, N.; Madan, H.; Vadduri, A.A. Herbicide spraying and weed identification using drone technology in modern farms: A comprehensive review. Results Eng. 2024, 21, 101870. [Google Scholar] [CrossRef]
- Li, Y.; Guo, Z.Q.; Shuang, F.; Zhang, M.; Li, X.H. Key technologies of machine vision for weeding robots: A review and benchmark. Comput. Electron. Agric. 2022, 196, 106880. [Google Scholar] [CrossRef]
- Rani, M.; Kaushik, P.; Bhayana, S.; Kapoor, S. Impact of organic farming on soil health and nutritional quality of crops. J. Saudi Soc. Agric. Sci. 2023, 22, 560–569. [Google Scholar] [CrossRef]
- Gamage, A.; Gangahagedara, R.; Gamage, J.; Jayasinghe, N.; Kodikara, N.; Suraweera, P.; Merah, O. Role of organic farming for achieving sustainability in agriculture. Farming Syst. 2023, 1, 100005. [Google Scholar] [CrossRef]
- Hazim, Z.A.Z.; Nizam, S.J.; Alamshah, N.B.; Wahi, R.; Affendy, M.A. Harvesting a sustainable future: An overview of smart agriculture’s role in social, economic, and environmental sustainability. J. Clean. Prod. 2024, 434, 140338. [Google Scholar]
- Wu, Z.; Chen, Y.; Zhao, B.; Kang, X.; Ding, Y. Review of weed detection methods based on computer vision. Sensors 2021, 21, 3647. [Google Scholar] [CrossRef]
- Boydston, R.A.; Williams, M.M. Sweet corn hybrid tolerance to weed competition under three weed management levels. Renew. Agric. Food Syst. 2016, 31, 281–287. [Google Scholar] [CrossRef]
- Dhanya, V.G.; Subeesh, A.; Kushwaha, N.L.; Vishwakarma, D.K.; Kumar, T.N.; Ritika, G.; Singh, A.N. Deep learning based computer vision approaches for smart agricultural applications. Artif. Intell. Agric. 2022, 6, 211–229. [Google Scholar] [CrossRef]
- Fatima, H.S.; ul Hassan, I.; Hasan, S.; Khurram, M.; Stricker, D.; Afzal, M.Z. Formation of a Lightweight, Deep Learning-Based Weed Detection System for a Commercial Autonomous Laser Weeding Robot. Appl. Sci. 2023, 13, 3997. [Google Scholar] [CrossRef]
- Shao, Y.Y.; Guan, X.L.; Xuan, G.T.; Gao, F.R.; Feng, W.J.; Guo, G.L.; Wang, Q.Y.; Huang, X.C.; Li, J.C. GTCBS-YOLOv5s: A lightweight model for weed species identification in paddy fields. Comput. Electron. Agric. 2023, 215, 108461. [Google Scholar] [CrossRef]
- Wang, Q.F.; Cheng, M.; Huang, S.; Cai, Z.J.; Zhang, J.L.; Yuan, H.B. A deep learning approach incorporating YOLO v5 and attention mechanisms for field real-time detection of the invasive weed Solanum rostratum Dunal seedlings. Comput. Electron. Agric. 2022, 199, 107194. [Google Scholar] [CrossRef]
- Juwono, F.H.; Wong, W.K.; Verma, S.; Shekhawat, N.; Lease, B.A.; Apriono, C. Machine learning for weed–plant discrimination in agriculture 5.0: An in-depth review. Artif. Intell. Agric. 2023, 10, 13–25. [Google Scholar] [CrossRef]
- Dang, F.Y.; Chen, D.; Lu, Y.Z.; Li, Z.J. YOLO Weeds: A novel benchmark of YOLO object detectors for multi-class weed detection in cotton production systems. Comput. Electron. Agric. 2023, 205, 107655. [Google Scholar] [CrossRef]
- Redmon, J.; Farhadi, A. Yolov3: An incremental improvement. arXiv 2018, arXiv:1804.02767. [Google Scholar]
- Wang, C.Y.; Bochkovskiy, A.; Liao, H.Y.M. YOLOv7: Trainable bag-of-freebies sets new state-of-the-art for real-time object detectors. In Proceedings of the 2023 IEEE/CVF Conference on Computer Vision and Pattern Recognition (CVPR), Vancouver, BC, Canada, 17–24 June 2023; pp. 7464–7475. [Google Scholar]
- Jocher, G.; Chaurasia, A.; Qiu, J. Ultralytics YOLO (Version 8.0.0) [Computer Software]. 2024. Available online: https://github.com/ultralytics/ultralytics (accessed on 21 June 2024).
- Ma, B.L.; Hua, Z.X.; Wen, Y.C.; Deng, H.X.; Zhao, Y.J.; Pu, L.R.; Song, H.B. Using an improved lightweight YOLOv8 model for real-time detection of multi-stage apple fruit in complex orchard environments. Artif. Intell. Agric. 2024, 11, 70–82. [Google Scholar] [CrossRef]
- Wang, Z.; Hua, Z.X.; Wen, Y.C.; Zhang, S.J.; Xu, X.S.; Song, H.B. E-YOLO: Recognition of estrus cow based on improved YOLOv8n model. Expert Syst. Appl. 2024, 238, 122212. [Google Scholar] [CrossRef]
- Liu, S.; Qi, L.; Qin, H.F.; Shi, J.P.; Jia, J.Y. Path aggregation network for instance segmentation. In Proceedings of the 2018 IEEE/CVF Conference on Computer Vision and Pattern Recognition, Salt Lake City, UT, USA, 18–23 June 2018; pp. 8759–8768. [Google Scholar]
- Lin, T.Y.; Dollar, P.; Girshick, R.; He, K.M.; Hariharan, B.; Belongie, S. Feature pyramid networks for object detection. In Proceedings of the 2017 IEEE Conference on Computer Vision and Pattern Recognition (CVPR), Honolulu, HI, USA, 21–26 July 2017; IEEE: New York, NY, USA, 2017; pp. 936–944. [Google Scholar]
- Jiang, Y.Q.; Tan, Z.Y.; Wang, J.Y.; Sun, X.Y.; Lin, M.; Li, H. GiraffeDet: A heavy-neck paradigm for object detection. arXiv 2022, arXiv:2202.04256. [Google Scholar]
- Yu, Z.; Huang, H.; Chen, W.; Su, Y.; Liu, Y.; Wang, X. Yolo-facev2: A scale and occlusion aware face detector. Pattern Recognit. 2024, 155, 110714. [Google Scholar] [CrossRef]
- Mahmudul, A.H.; Dean, D.; Hamid, L.; Michael, G.J.; Sohel, F. Object-level benchmark for deep learning-based detection and classification of weed species. Crop Prot. 2024, 177, 106561. [Google Scholar]
- Fang, X.P.; Chai, X.J.; Zhou, J.P.; Sun, T. Deep learning based weed detection and target spraying robot system at seedling stage of cotton field. Comput. Electron. Agric. 2023, 214, 108317. [Google Scholar]
- Guo, A.; Jia, Z.; Wang, J.; Zhou, G.; Ge, B.; Chen, W. A lightweight weed detection model with global contextual joint features. Eng. Appl. Artif. Intell. 2024, 136, 108903. [Google Scholar] [CrossRef]
| Disclaimer/Publisher’s Note: The statements, opinions and data contained in all publications are solely those of the individual author(s) and contributor(s) and not of MDPI and/or the editor(s). MDPI and/or the editor(s) disclaim responsibility for any injury to people or property resulting from any ideas, methods, instructions or products referred to in the content. |
© 2024 by the authors. Licensee MDPI, Basel, Switzerland. This article is an open access article distributed under the terms and conditions of the Creative Commons Attribution (CC BY) license (https://creativecommons.org/licenses/by/4.0/).


