Article

The Impact of Water-Saving Irrigation on Rice Growth and Comprehensive Evaluation of Irrigation Strategies

1
School of Agricultural Engineering, Jiangsu University, Zhenjiang 212013, China
2
School of Computer Science and Technology, Xinjiang University, Urumqi 830017, China
3
Department of Electronic Engineering, Beijing National Research Center for Information Science and Technology, Tsinghua University, Beijing 100084, China
*
Author to whom correspondence should be addressed.
Agronomy 2024, 14(7), 1363; https://doi.org/10.3390/agronomy14071363
Submission received: 18 May 2024 / Revised: 18 June 2024 / Accepted: 18 June 2024 / Published: 25 June 2024
(This article belongs to the Section Water Use and Irrigation)

Abstract

:
To explore the effects of different water-saving treatments on rice plant growth and select suitable water-saving irrigation strategies for aerobic rice varieties, we conducted relevant field experiments from June to October 2023 at Jiangsu Runguo Agricultural Development Co., Ltd., China, which is located in a north subtropical monsoon climate where the soil is alkaline sandy loam. Four water treatments were set up, including the control of local conventional irrigation (CK, without water stress), mild water-saving treatment (W1, 20% more water saved than CK), moderate water-saving treatment (W2, 30% more water saved than CK), and severe water-saving treatment (W3, 40% more water saved than CK). The experiment results showed that rice plant heights were inhibited and leaf chlorophyll contents increased under all water-saving treatments compared to CK. Among them, the MDA content in paddy leaves under the W1 treatment decreased, while the activities of SOD and POD were enhanced and the membrane lipid peroxidation capacity of rice was also enhanced. Meanwhile, the results showed that the rice yield and quality under the W1 treatment significantly improved. Based on those experiments, a comprehensive evaluation of rice plant height, chlorophyll content, grain yield, yield components, and rice quality was conducted using the TOPSIS entropy weight method. It was preliminarily concluded that the suitable irrigation scheme for south and central Jiangsu was 20% water-saving irrigation compared with CK. In summary, under the premise of maintaining the economic yield of rice cultivation, an appropriate water irrigation plan helped save water resources and promote rice growth.

1. Introduction

Plants are becoming more vulnerable to abiotic stresses as global climate change worsens, e.g., when there is the occurrence of a water crisis. The yield and quality of crops are not only controlled by genetic factors but also influenced by environmental factors [1,2]. It is crucial to make agricultural decisions that are suitable for crop variety characteristics and local environments [3].
Rice (Oryza sativa L.) is the world’s primary food crop and also the most water-consuming [4]. However, with the continuous increase in the global population and the impact of climate change, the issue of water scarcity is becoming increasingly serious. Less than one-third of rice cultivation areas have adopted water-saving irrigation methods. Nationwide paddy cultivation still primarily relies on traditional flooding irrigation, with its water consumption accounting for 70% of China’s total agricultural water use and 50% of China’s total water consumption, representing a significant amount of water consumption. Such unreasonable water irrigation strategies not only have adverse effects on rice yield and quality but also lead to a significant waste of water resources [5,6,7]. Therefore, it is crucial to explore scientific irrigation programs for rice cultivation and understand the impact of water on rice growth, yield, and quality.
Scientific irrigation schemes should avoid stress and damage to crops caused by improper water saving. Currently, there are different opinions on the effects of water stress on rice yield and quality. In terms of yield, Wang et al. [8] verified that mild water stress could stimulate plants to produce stress responses, forming a better “source” and “sink” coordination structure to achieve high yields. However, Shao et al. [9] found that yield during the booting stage with controlled irrigation was reduced by 6.8% compared to conventional flooding irrigation. In terms of quality, Zheng et al. [10] verified that water stress during the flowering period reduced the head rice rate, increased chalkiness and the protein content, decreased the amylose content, affected rice quality, and caused yield reduction. Dong et al. [11] argued that soil moisture during the grain-filling period had a significant effect on the rice quality. Therefore, selecting an appropriate water-saving irrigation scheme, studying the effects of water treatment on rice yield and quality, and seeking a comprehensive evaluation method for irrigation schemes have become essential. The Technique for Order Preference by Similarity to Ideal Solution (TOPSIS) entropy weight method has the advantages of flexible application and objective quantification of results and has been gradually used in agricultural production decision evaluation in recent years. Zheng et al. [12] used the TOPSIS multi-objective decision-making method for a comprehensive evaluation and found that controlled irrigation combined with 100% humic acid could effectively reduce agricultural water use and increase rice yield.
At present, although there have been many scientific studies of the effects of water stress on rice yield during specific growth periods, conclusions often vary significantly due to differences in experimental locations, varieties of selected samples, and designs of experimental procedures. Moreover, the effects of water stress on rice growth, development, yield, and quality through irrigation schemes that save water and produce a high yield are still unclear in south Jiangsu and central Jiangsu. Therefore, in this study, we used Jinxiangyu 1, a japonica rice variety and an aerobic variety suitable for the Ning-Zhen-Yang region, as the experimental variety. Field experiments were conducted in the farmland of Jiangsu Runguo Agricultural Development Co., Ltd. in Zhenjiang City, Jiangsu Province, China. The TOPSIS entropy weight method was used to quantitatively evaluate measured paddy agronomic traits, grain yield, rice quality, and other indicators. The aim was to obtain a water-saving irrigation scheme under the premise of maintaining original yield and quality; to investigate the effects of water on rice growth, yield, and quality; and to provide a theoretical basis for high-quality rice cultivation and water-saving irrigation technology in Zhenjiang and neighboring regions.

2. Materials and Methods

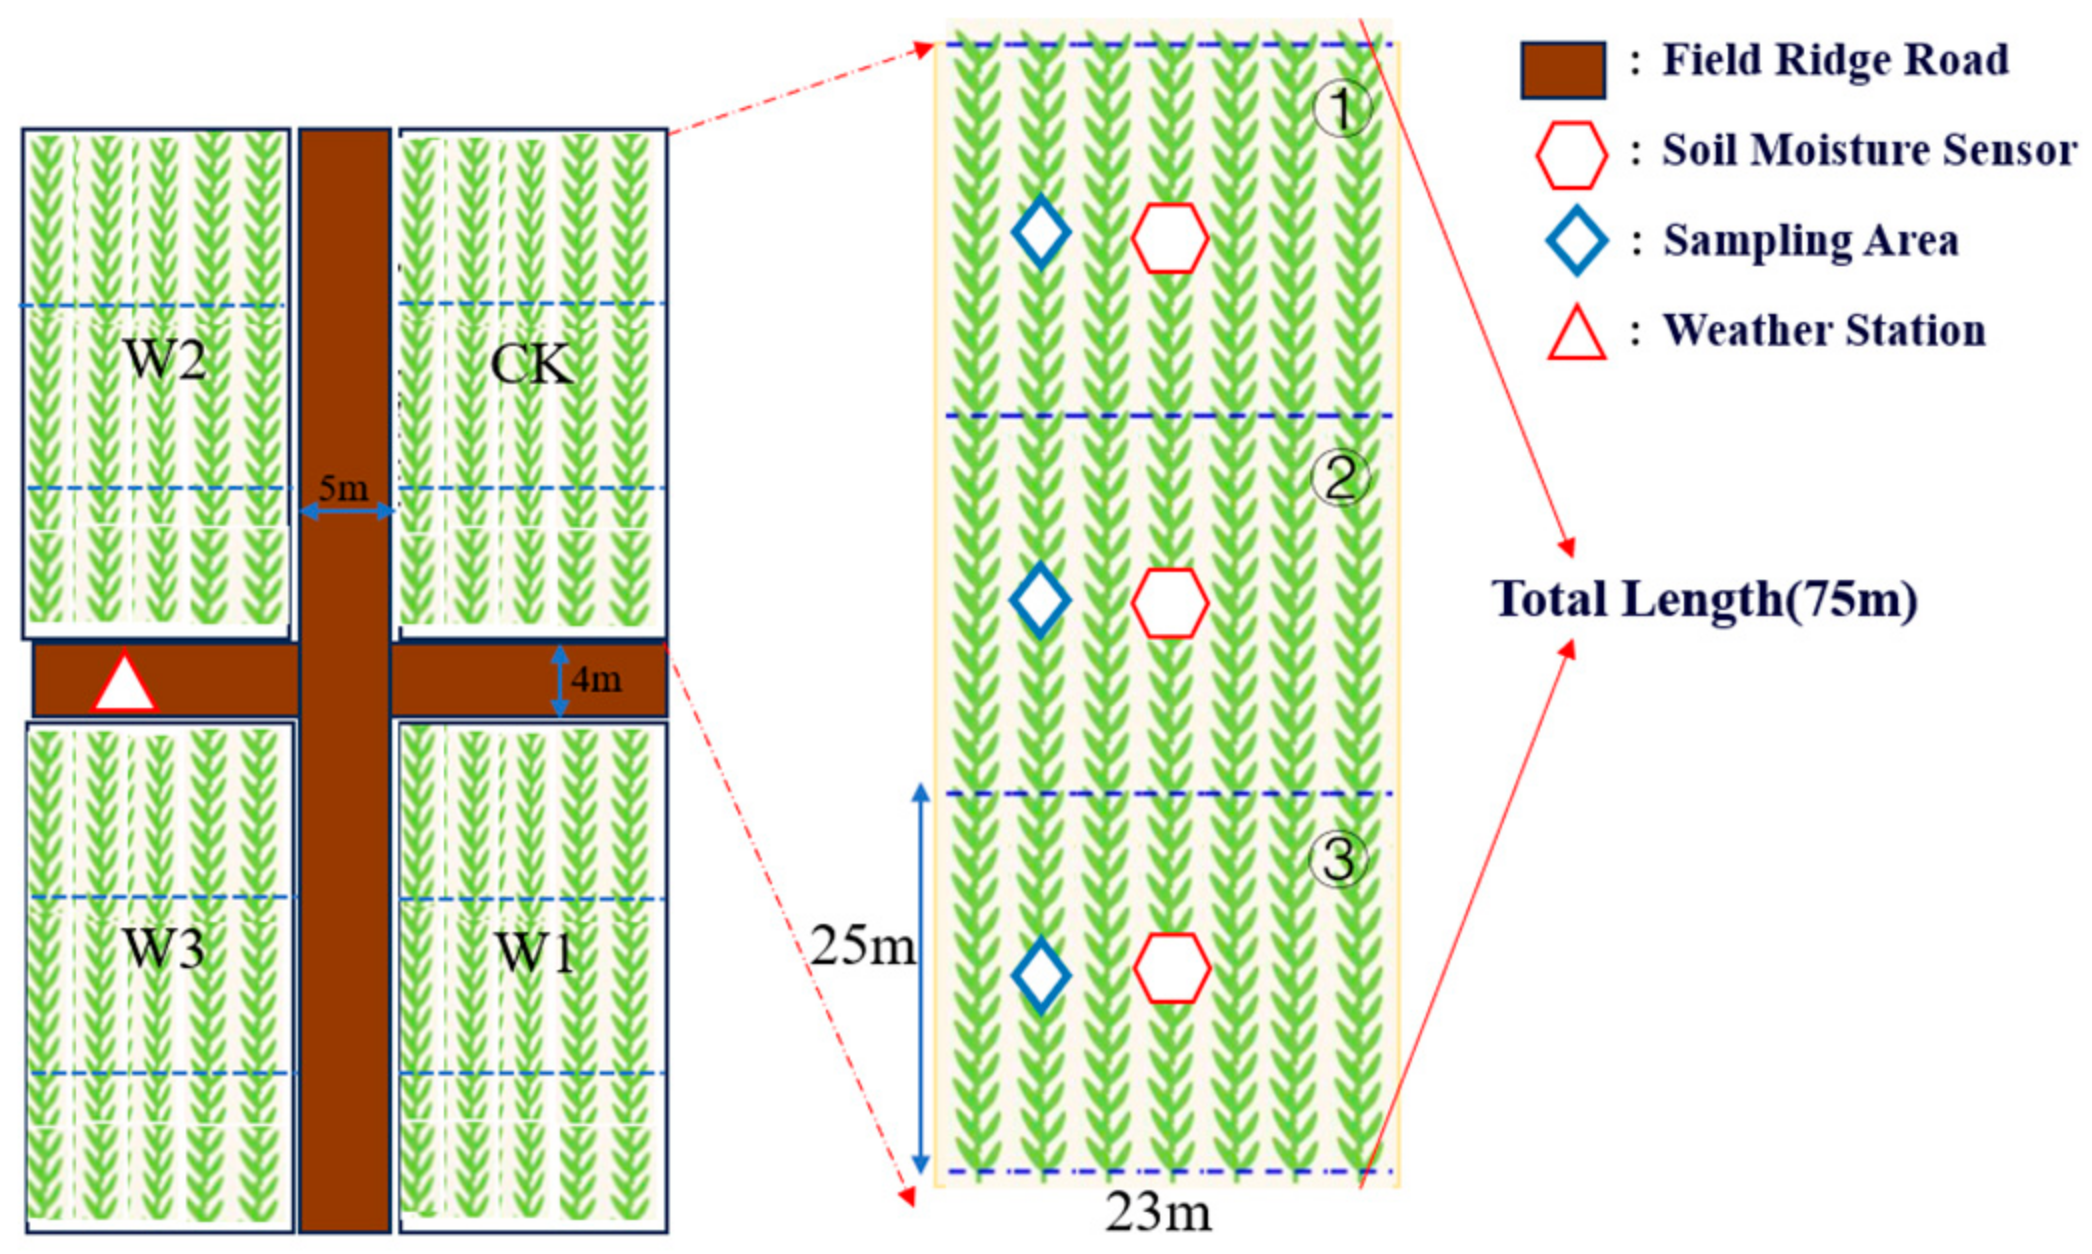
2.1. The Experimental Site

The experiment was conducted from June to October 2023 at Runguo Agricultural Development Co., Ltd. (the largest single base of rice planting in south Jiangsu) in Zhenjiang City, Jiangsu Province, China. The experimental site is located at 32°20′ N, 119°47′ E, and is in the warm subzone of the north subtropical monsoon climate. In the field experimental area, the annual average temperature was 15.3 °C, the annual total radiation was 111.3 kcal cm−2, and the frost-free period lasted 238 days in a year. The temperature variations and monthly rainfall during the rice growth period in 2023 are shown in Figure 1, and they are very similar to the average temperature and average rainfall in the past decade for the same region.
Soil samples were taken from 0 to 60 cm, with every 20 cm being one layer, totaling three layers. Soil samples were collected using the cutting-ring method, with three repetitions for each layer. A total of 12 samples were collected, and relevant soil indicators were determined. Among them, the determination methods of soil PH, soil bulk weight, soil organic matter content, soil total nitrogen, soil water content at the field capacity, and soil density followed the Agricultural Industry Standard of the People’s Republic of China NY/T 1121 [13]. The measurement method for soil total phosphorus was referenced from the alkali fusion-molybdenum antimony colorimetric method of Chen et al. [14]. Furthermore, the measurement of soil total potassium and electrical conductivity was performed according to Bao [15]. The soil of the experimental site was measured to be alkaline and sandy loam. It has moderate sandiness, an appropriate ratio of large and small pores, and good aeration and water permeability; is rich in nutrients; and exhibits good tillage performance. The average field moisture capacity of the 0–60 cm soil layer was 20.358%, and the soil bulk density was 1.601 g cm−3. Detailed data of the different soil layers are shown in Table 1.

2.2. Experimental Materials and Treatments

The rice variety used in the experiment was ‘Jinxiangyu 1’, a late-maturing medium japonica rice suitable for the central region of Jiangsu province. The seedlings were short and sturdy, with strong tillering ability, relatively thick stalks, and good lodging resistance. As an aerobic rice variety, ‘Jinxiangyu 1’ requires moderate sun drying for the field during the early growth stage and intermittent irrigation during the late growth stage. The rice was transplanted using a machine, with a basic seedling density of 60,000 to 80,000 seedlings per mu (1 mu is equal to 666.7 m2). It was transplanted on 28 June 2023, and harvested on 28 October, resulting in a total growth period of 139 days (Table 2). Apart from differences in irrigation management, all other aspects of agronomy management, such as fertilization, were consistent with the agronomy management of local fields.
Four treatments were applied, as shown in Table 3, including CK (the control according to the conventional irrigation amount on the farm, maintaining a constant water layer), W1 (mild water-saving, 80% of the total irrigation amount of the control), W2 (moderate water-saving, 70% of the total irrigation amount of the control), and W3 (severe water-saving, 60% of the total irrigation amount of the control). In the field, the water irrigation volume was controlled using a flowmeter (DCT1158, Shenzhen Jianheng Measurement and Control, Shenzhen, China), and the soil moisture was measured using a soil profile moisture meter (PR2/6-SDI-12, Delta–T Devices, Cambridge, UK); measurements were taken in the experimental area every two days. When the measured value was lower than the lower limit of soil moisture according to the conventional irrigation scheme on the farmland, irrigation was conducted, and it was stopped when the measured value reached the upper limit of soil moisture. The flowmeter was used to record the water volume for each irrigation, ultimately obtaining the total irrigation water volume for the entire growth period. Each experimental plot had a land area of 1725 m2, which included three replicated plots, and each replicated plot covered an area of 575 m2 (Figure 2). Draining and sunning of the fields sometimes were performed for increasing oxygen in the rhizosphere of the rice after the tillering stage of rice.

2.3. Measurement Indicators and Methods

2.3.1. Plant Height Measurement

After the rice seedlings’ recovery from transplanting was over, 5 rice plants with consistent growth were selected and marked in each plot. The plant height of the marked rice plants was measured with a tower ruler during the tillering stage, jointing and booting stage, heading and flowering stage, milk stage, and yellow ripening stage.

2.3.2. Biomass Measurement

After the rice seedlings’ recovery from transplanting was over, the above-ground parts of three rice plants with consistent growth were cut in each plot during different growth stages. After being marked, the cut above-ground parts were put into mesh bags as measured samples. The samples were first placed in an oven at 105 °C for 30 min to kill the enzymes; then, the temperature of the oven was adjusted to 75 °C and drying was continued for at least 48 h until the weight reached a constant. Finally, the weight of the dried samples was measured.

2.3.3. Leaf Chlorophyll Content (SPAD Content)

Chlorophyll content was measured using a chlorophyll meter (SPAD-502 Plus, Konica Minolt, Tokyo, Japan). Starting from the tillering stage, 5 rice plants with consistent growth were selected and marked in each plot. During each growth period, the SPAD values of the top third leaf on the marked plants were measured and recorded.

2.3.4. Yield and Its Components

During the rice maturity stage, the effective panicle number of rice within 1 square meter in each plot of each treatment was investigated. Five points were sampled for yield assessment in each plot. Nine rice plants with consistent growth were selected from a 1 m2 plot for indoor yield assessment, where the grain number per panicle, seed setting rate, and 1000-grain weight were measured.

2.3.5. Rice Quality Measurement

After the rice was harvested, the brown rice rate, milled rice rate, head rice rate, chalkiness degree, starch, and crude protein were measured according to the Chinese National Standard GB/T 17891-2017 [16].

2.3.6. Measurement of Stress Resistance Indicators

Some samples of the above-ground parts in mesh bags were measured for water stress resistance. Referring to the method of Zhang et al. [17], the thiobarbituric acid method was used to determine the malondialdehyde (MDA) content in rice leaves, the nitroblue tetrazolium photoreduction method was adopted to measure superoxide dismutase (SOD) activity, and peroxidase (POD) activity was determined based on the oxidation of guaiacol method. Each set of data was obtained three times.

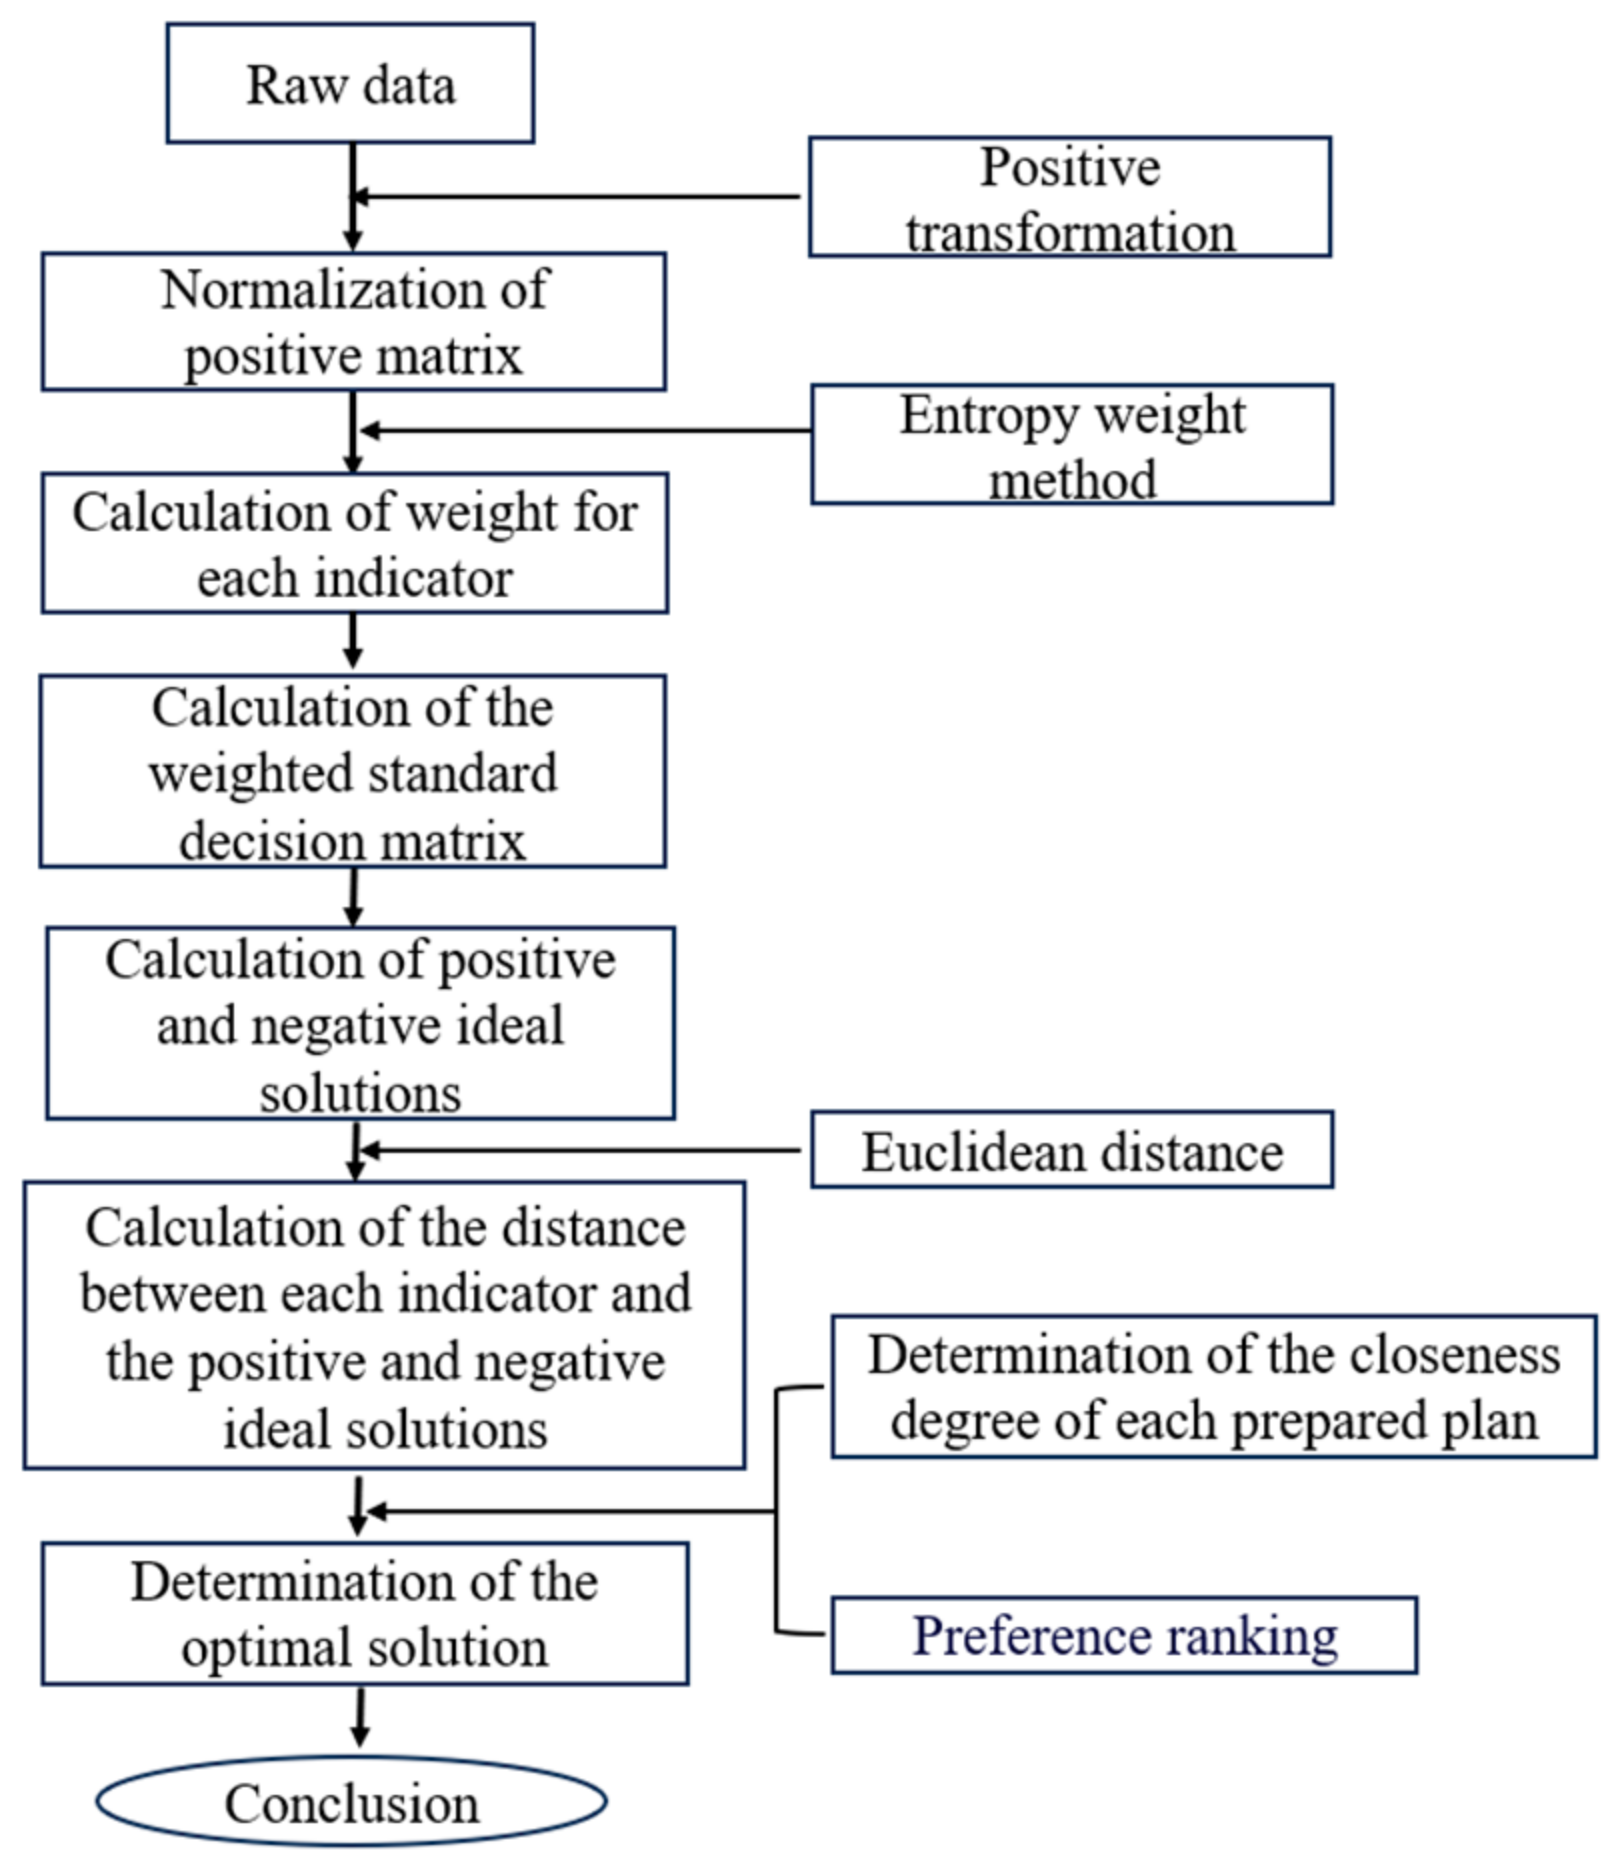
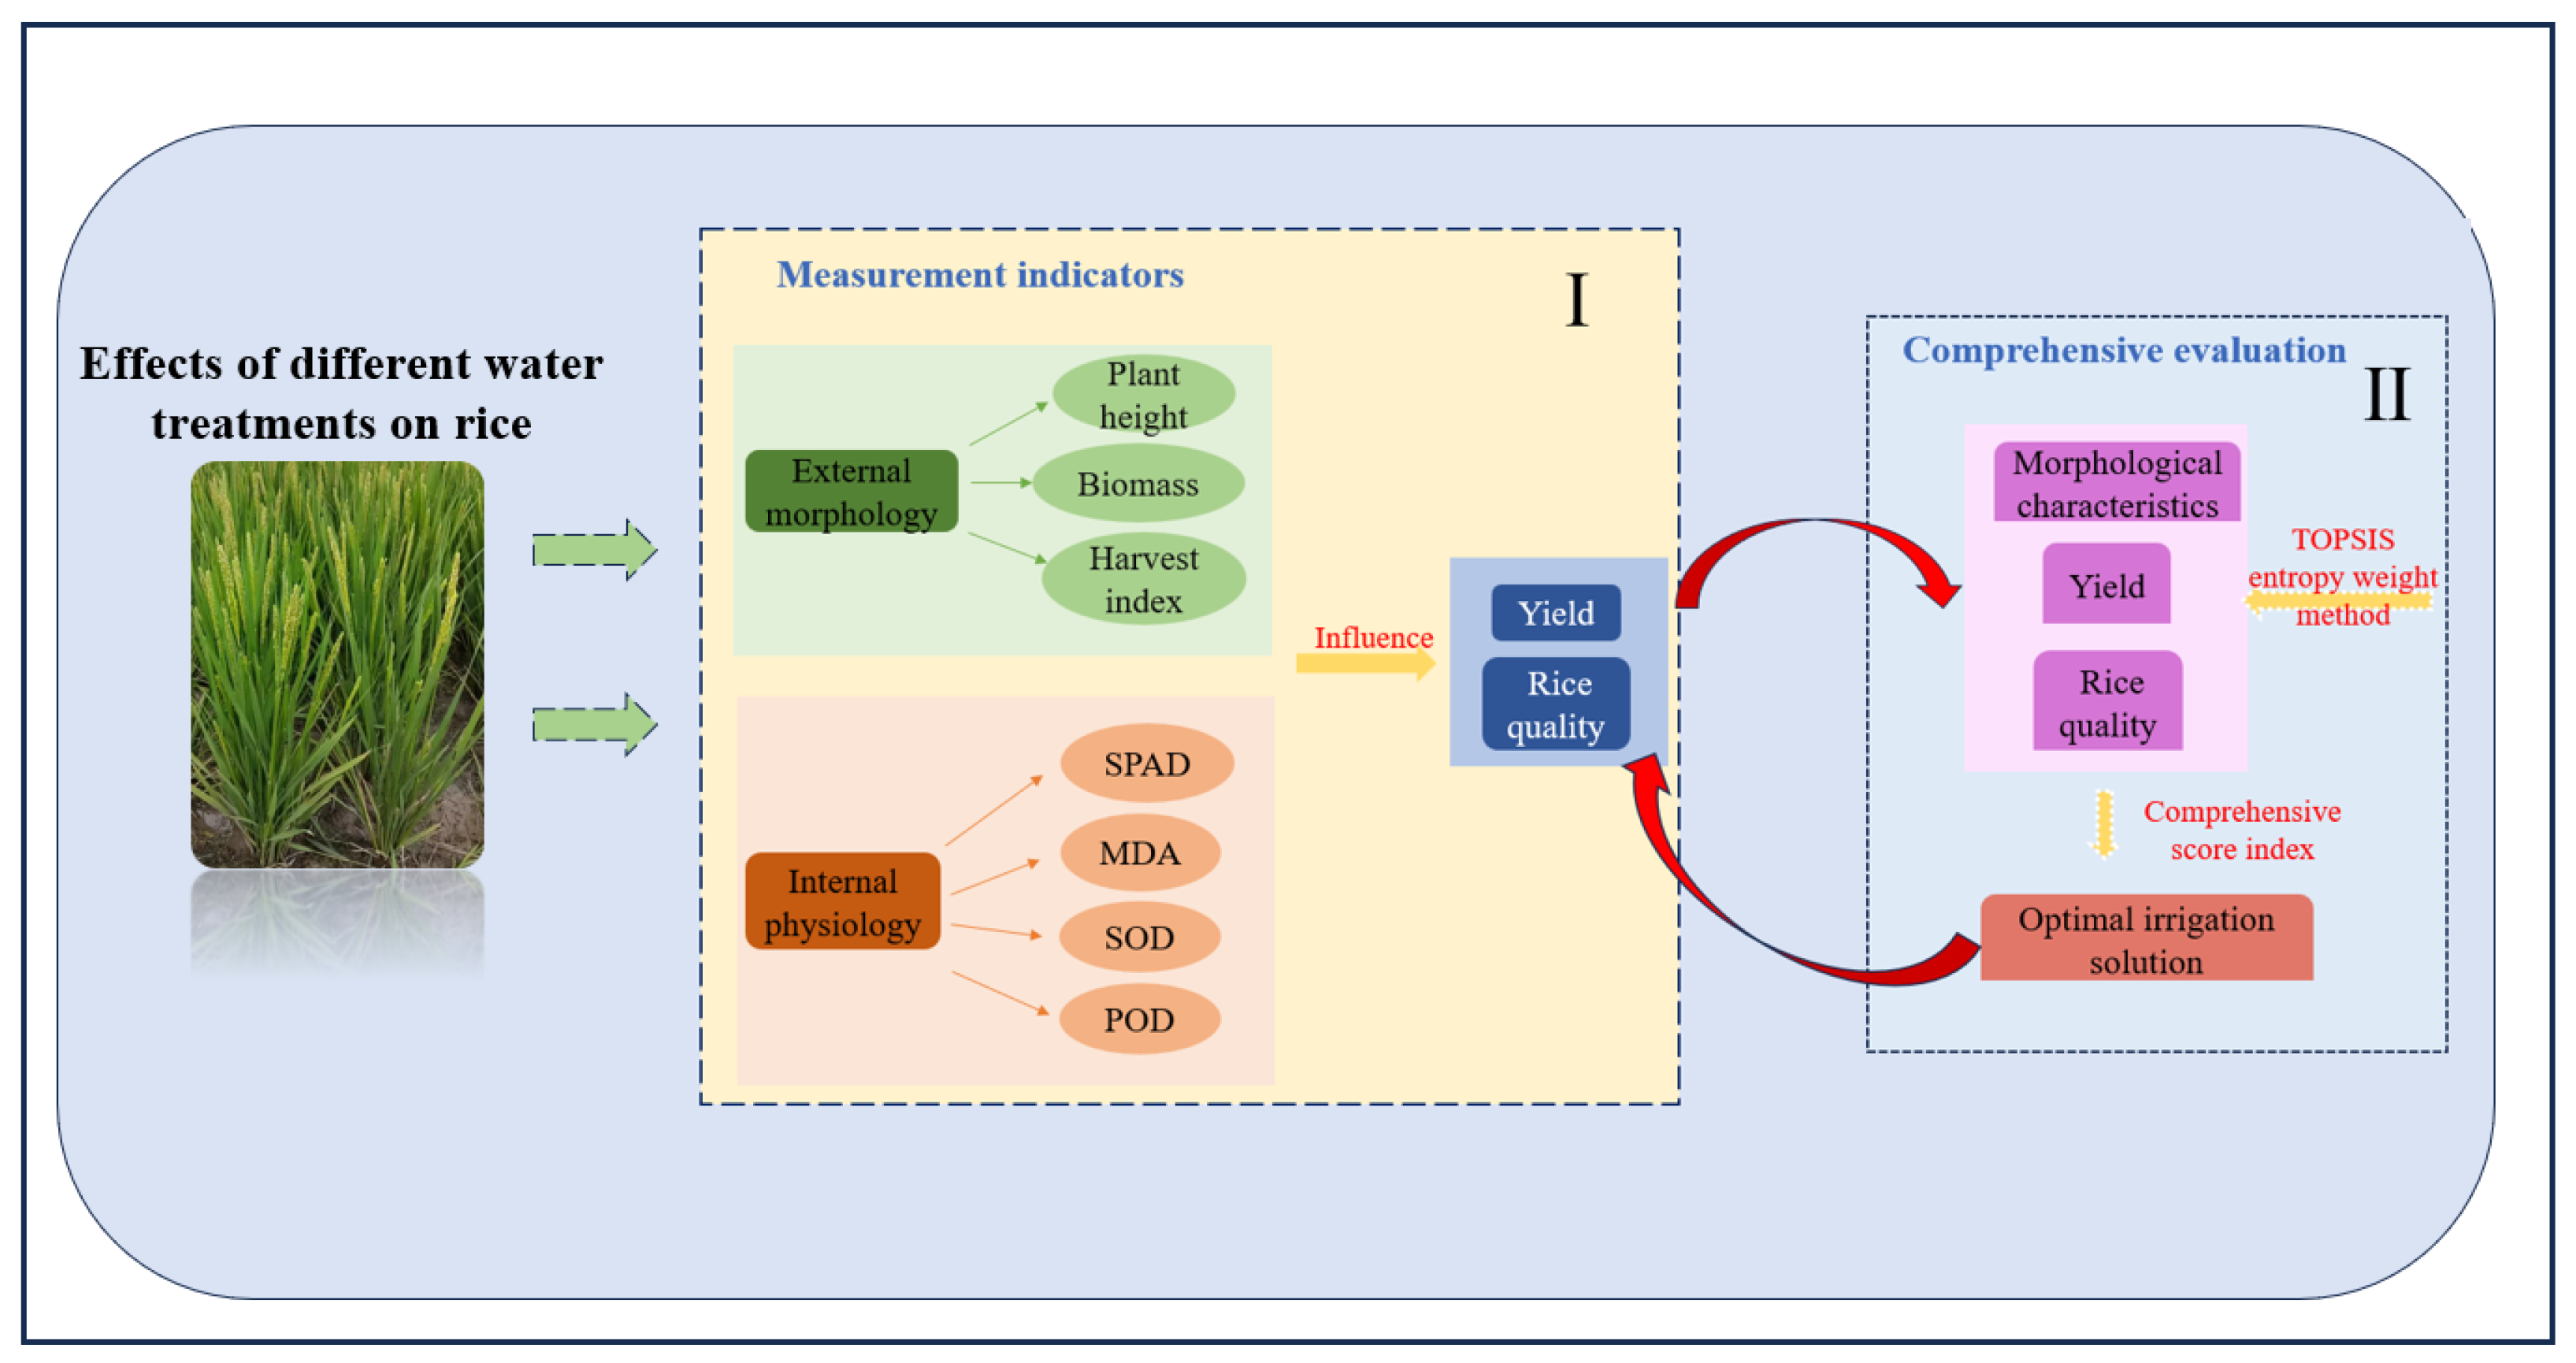
2.4. Comprehensive Evaluation Method for Irrigation Treatments

The TOPSIS entropy weight method is an effective multi-criteria decision-making approach that determines the contribution of each criterion to the decision outcome by calculating its information entropy. Based on these weights and the original data, the TOPSIS method calculates the distance between each alternative and the ideal solution as well as the negative ideal solution, thereby deriving a ranking of the alternatives in terms of their superiority and inferiority.
The TOPSIS method is widely used in agricultural research to evaluate crop growth plans. It can correctly and effectively evaluate the advantages and disadvantages of the planning schemes, and the evaluation results are reliable [18,19].
The calculation process of the TOPSIS entropy weight method was completed by SPSS PRO 1.1.25, and the calculation process is shown below (Figure 3).

2.5. Data Statistics and Analysis

Experimental data are expressed as mean values ± SD. SPSS 24.0 statistical (SPSS Inc., Chicago, IL, USA) software was used to perform analysis of variance (ANOVA), using LSD multiple comparisons at a significance level of p < 0.05. All figures were drawn using Origin 2019 (OriginLab Corporation, Northampton, MA, USA).

3. Results

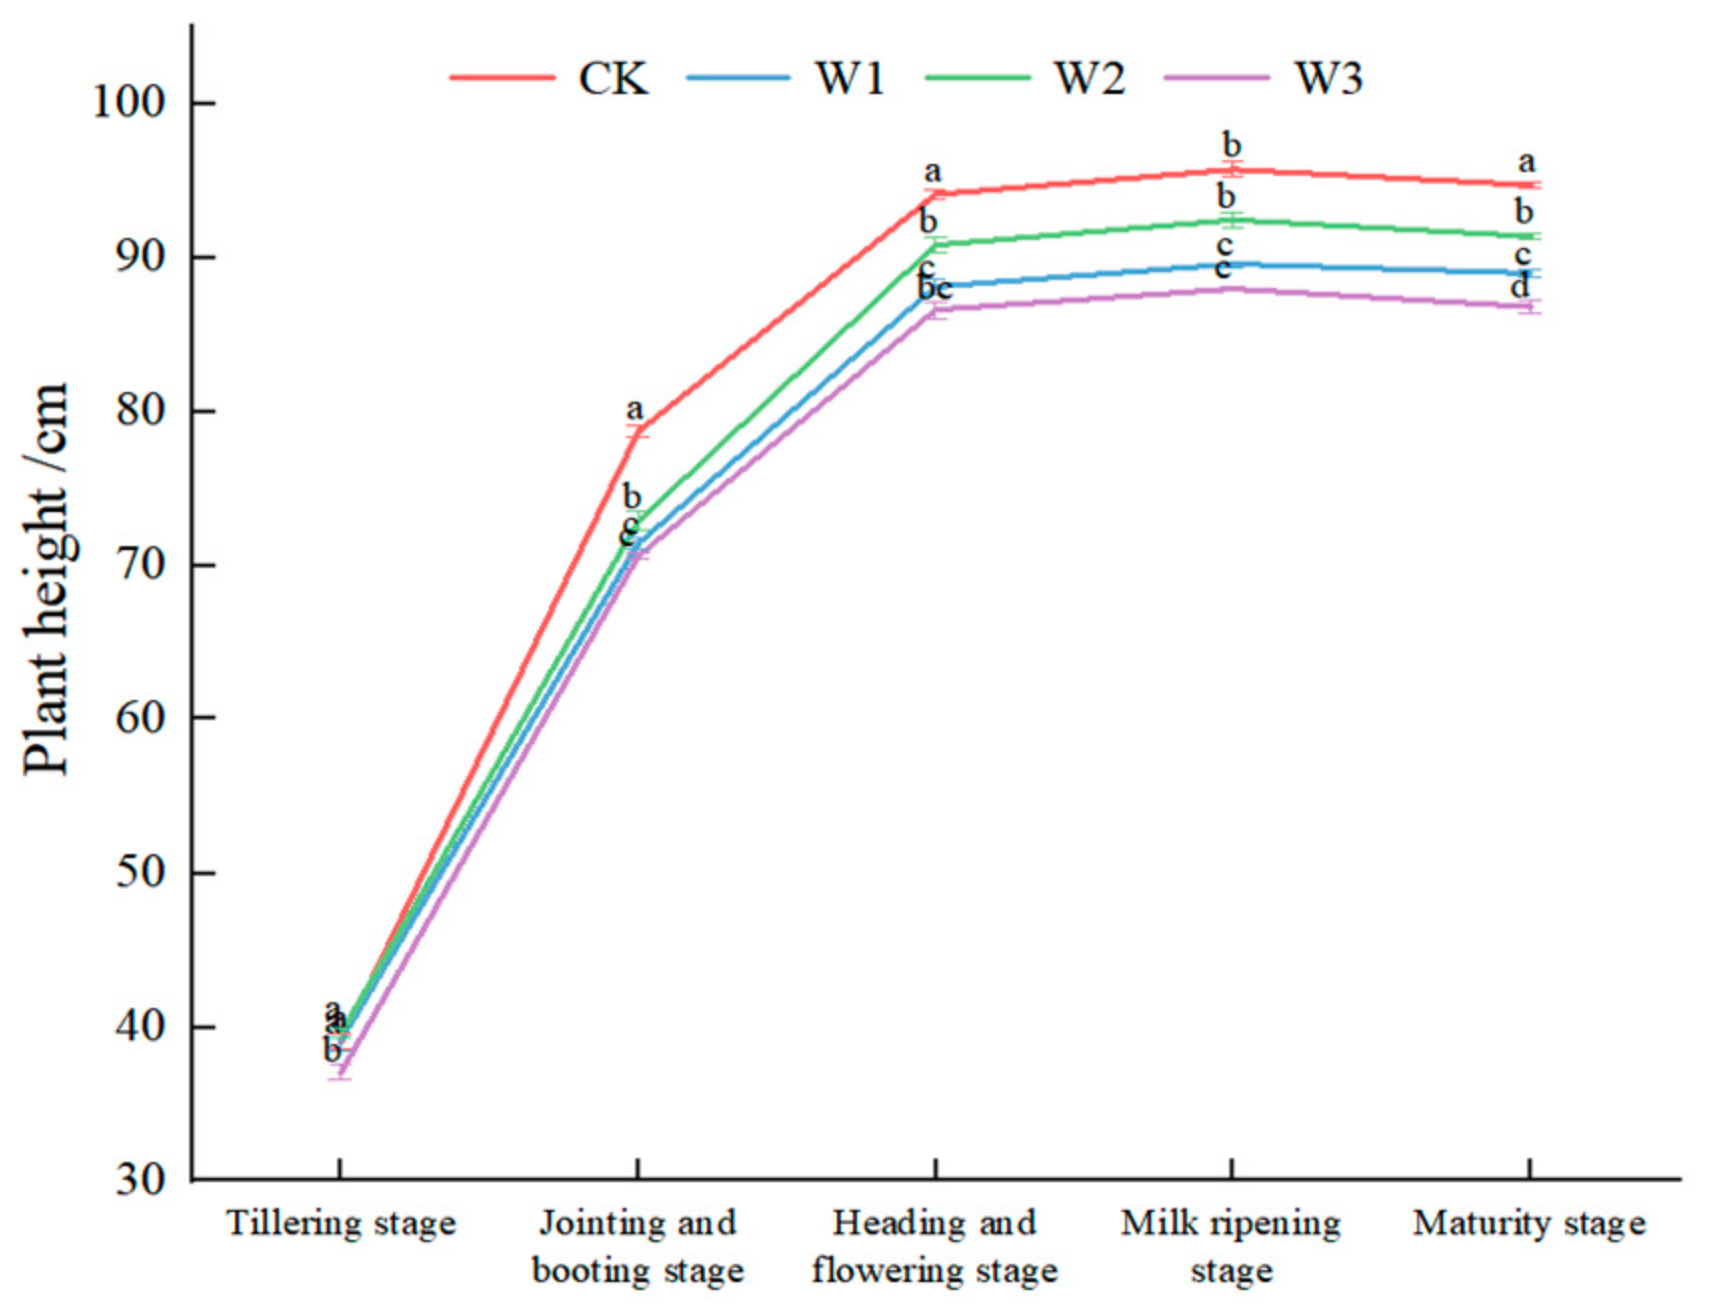
3.1. Effects of Different Water Treatments on Rice Plant Height

The growth rate of the rice plant height was relatively fast in the early stage and decreased slightly after the milk ripening stage. Between the tillering stage and the jointing and booting stage, the growth rate of the rice plant height was the highest. The plant height under the CK treatment was the highest, which was 8.44%, 12.08%, and 15.46% higher than that under the W1, W2, and W3 treatments, respectively (Figure 4). From the perspective of the whole growth period, the plant height in the CK group has a significant advantage, indicating that water-saving treatment had an inhibitory effect on the plant height of rice.

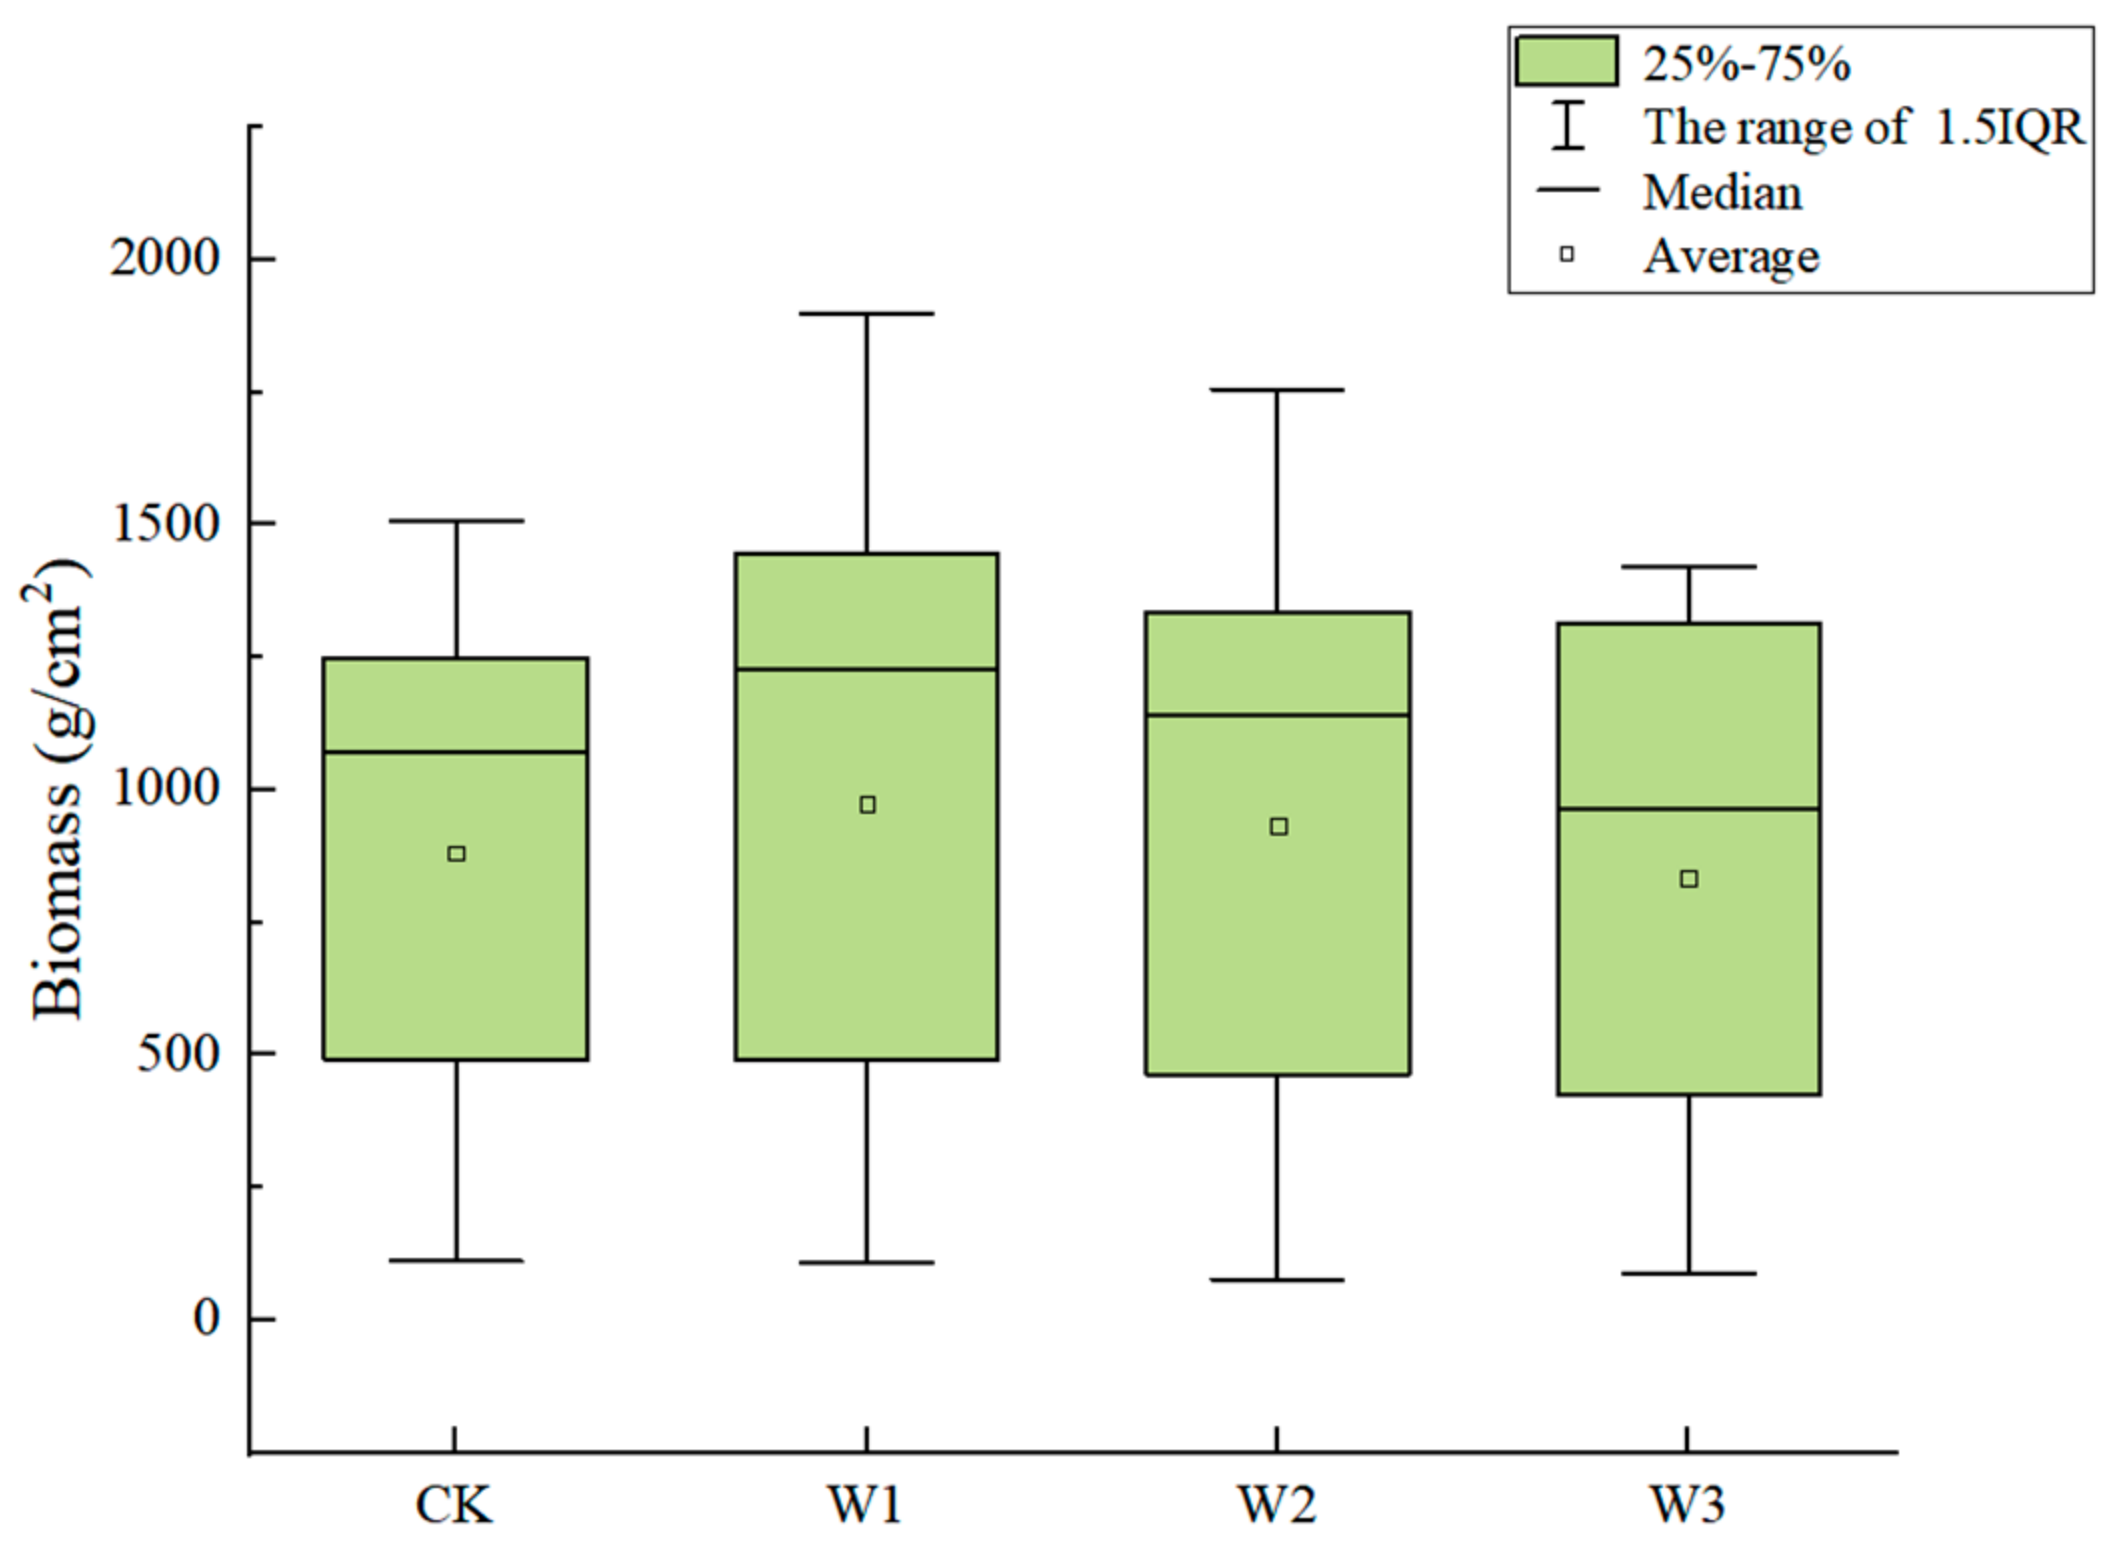
3.2. Effects of Different Water Treatments on Rice Biomass

Rice dry matter mass accumulation is the basis of grain yield formation. The cumulative biomass of rice during the whole growth period under different water treatments is shown in Figure 5. Among the water-saving treatments, the mean growth of rice biomass under W1 was the highest, reaching 947.67 g cm−2, followed by W2 with 933.87 g cm−2, which are 7.50% and 5.90% higher than the result with CK, respectively. However, the mean rice biomass under W3 treatment was 5.47% lower than that with CK. The rice harvest index under different water treatments is shown in Table 4, following the order W1 > W2 > CK > W3, thus indicating that appropriate water stress could promote an increase in crop biomass and harvest index.

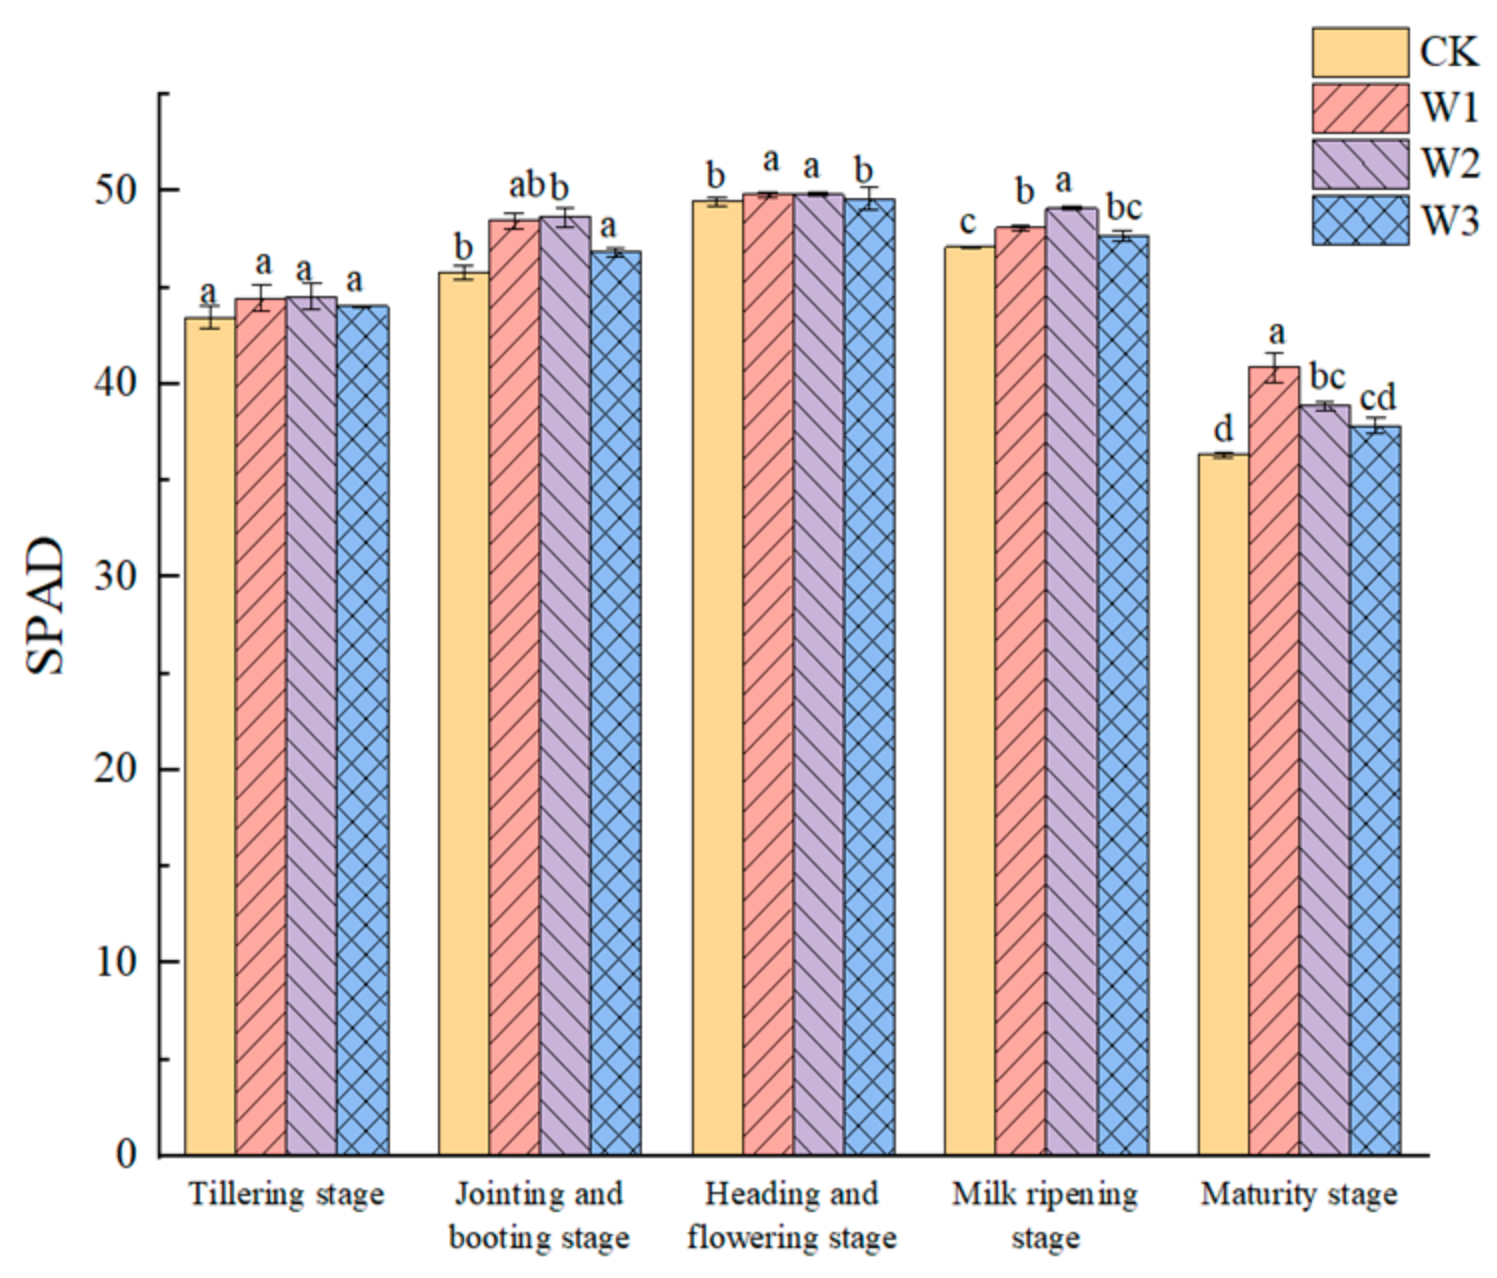
3.3. Effects of Different Water Treatments on SPAD of Rice Leaves

The SPAD content in rice leaves under different water treatments was consistent, exhibiting a trend of initial increase followed by a decrease, peaking during the heading and flowering stage. The decreases in leaf SPAD content under the W1, W2, and W3 treatments were all lower than that in the CK group, by 8.34%, 3.69%, and 2.42%, respectively (Figure 6). Based on the comprehensive data, it could be concluded that mild and moderate water-saving treatments significantly increased the SPAD values of rice plants during the early and middle stages.

3.4. Effects of Different Water Treatments on MDA of Rice Leaves

MDA is one of the main products of membrane lipid peroxidation, and its content reflects the degree of damage to the cell membrane of plants caused by stress, such as water stress to a certain extent. Overall, compared with CK, the MDA content under W3 treatment was the highest, while that under W1 was the lowest. This indicated that under severe water-saving conditions, the degree of membrane damage in the rice leaves was high (Figure 7). Conversely, under mild water-saving conditions, the degree of damage to the rice leaves was the lowest, which was beneficial for the stability of the cell membrane structure and thus ensured the normal progress of a series of physiological and biochemical reactions in the rice leaves.

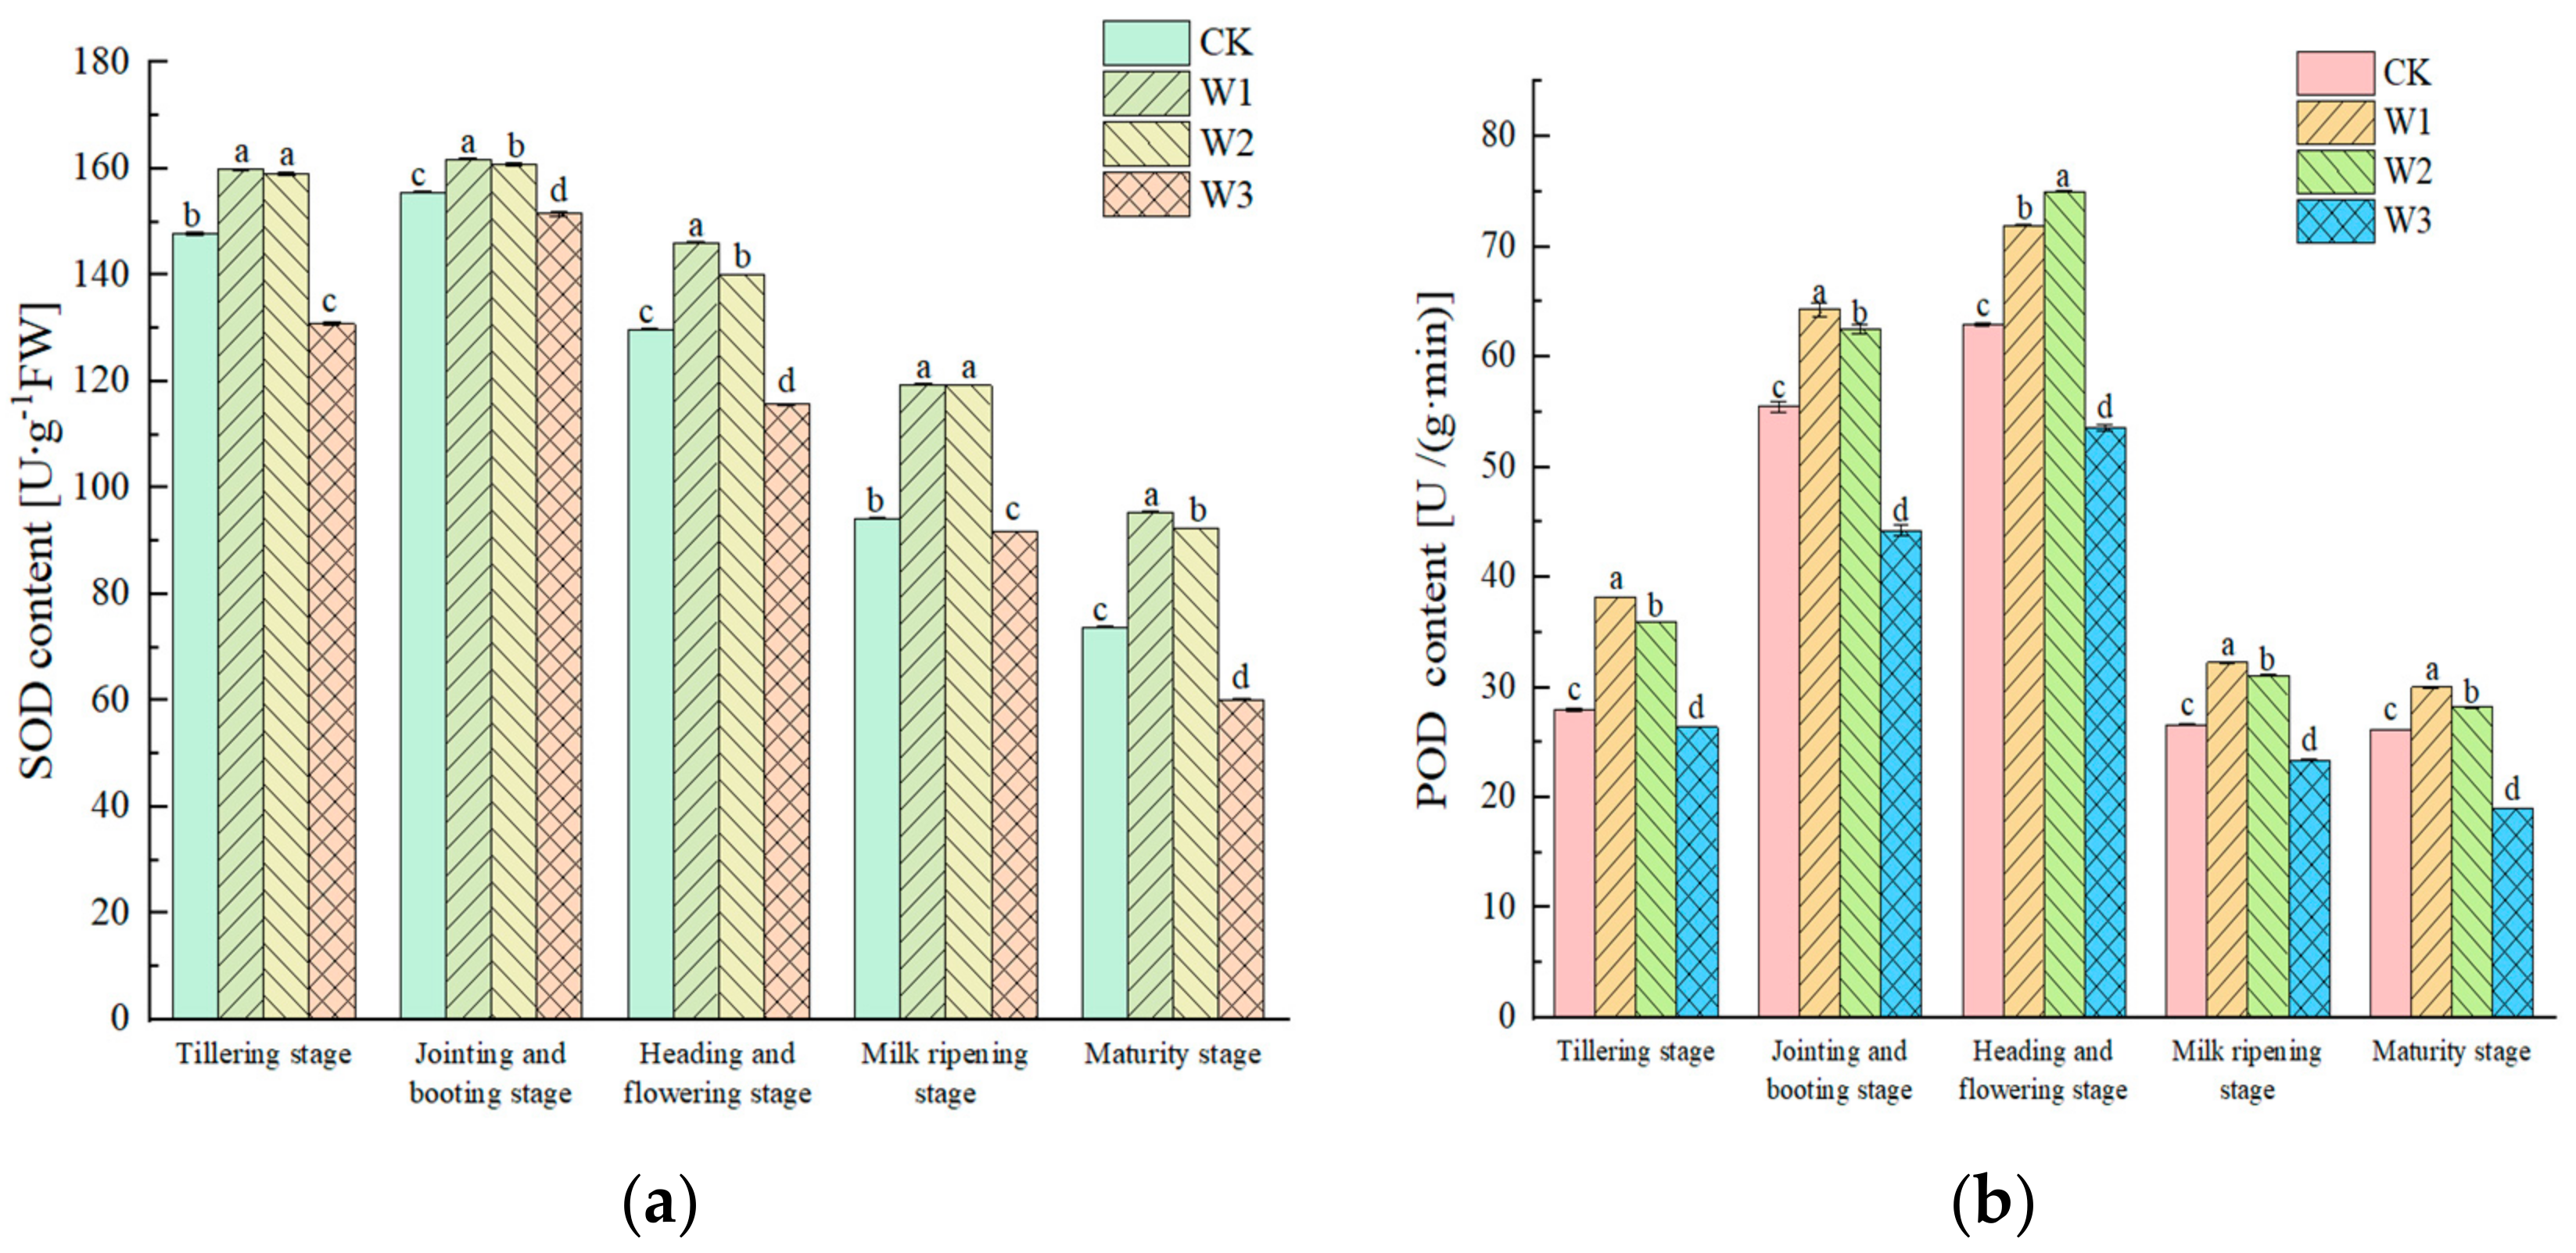
3.5. Effects of Different Water Treatments on Antioxidant Enzyme Activities in Rice Leaves

Under water stress, plants produce excessive amounts of reactive oxygen species, which can cause toxicity to the plant. Antioxidant enzymes, such as SOD and POD, could eliminate excess reactive oxygen species. The activities of SOD (a) and POD (b) in the rice leaves exhibited a trend of initial increase followed by a decrease (Figure 8). Compared with CK, the activities of SOD and POD in leaves under the W1 and W2 treatments increased significantly, while the activities of these antioxidant enzymes in leaves under the W3 treatment decreased. It indicates that a certain degree of water stress could induce the enhancement of SOD and POD activities, thereby eliminating excess reactive oxygen species. Conversely, excessive drought disrupts the balance between the production and elimination of reactive oxygen species, leading to severe damage to the membrane system. This severe damage caused the decrease in SOD and POD activities and slowed down the antioxidant process in the plant, thereby affecting the growth and development of the plants at some growth stage.

3.6. Effects of Different Water Treatments on Rice Yield and Its Components

Under various water treatments, there was no significant difference in the number of grains per panicle (Table 5). The seed setting rate and effective panicle number under the CK treatment differed significantly from those under the water-saving treatments. The seed setting rate of the CK group was lower than that of W1, W2, and W3 groups by 11.37%, 8.68%, and 5.71%, respectively. The effective panicle number of the CK group was lower than that of the W1, W2, and W3 groups by 23.67%, 11.96%, and 14.88%, respectively. The 1000-grain weight of rice from highest to lowest followed the order CK > W1 > W3 > W2. In terms of final grain yield, the W1 mode obtained the highest, being 18.79%, 15.41%, and 31.40% higher than those of the W2, W3, and CK modes, respectively. It needs to be noted that the results of the rice yield and water-saving treatment are preliminary on the single season field tests.

3.7. Effects of Different Water Treatments on Rice Quality

In terms of processing quality of rice, the overall trends of brown rice rate, milled rice rate, and head rice rate were consistent. Compared to the CK treatment, all water-saving treatments exhibited improved brown rice quality, with maximum increases of 2.20%, 2.79%, and 3.85%, respectively (Table 6). Overall, the W1 treatment was effective in enhancing the processing quality of rice. Regarding appearance quality, the chalkiness degree changed little, with a slight increase in all water-saving treatment groups. In terms of cooking taste and nutritional quality, the rice starch content under the CK treatment was lower than that under the W1 and W2 treatments by 18.82% and 10.03%, respectively. The rice starch content under the severe stress treatment was only 1.57% lower than that of the CK group. The above results show that the W1 treatment had the best positive effect.

3.8. Comprehensive Evaluation and Optimization of Irrigation Treatment Schemes

To provide a visual reference for rice cultivation in Zhenjiang and neighboring regions and establish a scientific water-saving model, the TOPSIS entropy weight method for the optimization of water-saving schemes was studied. By integrating experimental data, the optimal water-saving approach that promotes good growth, high quality, and high yield of rice was identified. The evaluation criteria encompassed rice morphological characteristics, yield, and rice quality.
The entropy weight calculation results of the entropy weight method showed that the information entropy value of the number of grains per panicle was the smallest at 0.454, with the highest information utility value of 0.546. This indicated that it carried the most useful information and had the largest weight at 13.82% (Table 7). The comprehensive score index and economic impact assessment according to the TOPSIS entropy weight method are shown in Table 8. Among the different irrigation treatments, the mild water-saving scheme (W1) had the greatest closeness to the ideal solution, indicating the best performance and the highest comprehensive score index of 0.619. In 2023, the sales price of rice in the Runguo region was 2.94 RMB kg−1. As can be seen from Table 8, the highest economic income of rice under W1 treatment was 27,680.247 RMB hm−2, which was an increase of 18.79%, 18.21%, and 31.40% compared to the economic incomes under the W2, W3, and CK treatments, respectively. Note that this assessment did not consider the water saved.

4. Discussion

Water-saving irrigation has application significance in sustainable agricultural development. The aim of this study was to investigate the impacts of different water-saving treatments on rice plant growth, grain yield, and rice quality by measuring its external morphology and internal physiological indicators. In addition, a quantitative evaluation was conducted using the TOPSIS entropy weight method. A comprehensive comparison was made to obtain the optimal water-saving irrigation scheme, while ensuring both agricultural production and grain quality. The technical route of this study is shown in Figure 9. The discussion of the corresponding results is as follows.
The growth status of crops varies with different water conditions. Rice plant height, as one of the crucial agronomic traits, plays a significant role in determining rice yield. However, excessively tall plants may cause the lodging resistance of rice to reduce, leading to yield reduction [20]. Our study found that each water-saving treatment had a certain inhibitory effect on the plant height of rice (Figure 4). Similarly, several studies found that mild water stress has little impact on rice plant height, while severe water stress significantly reduces rice plant height [21,22,23]. Other research revealed that when the soil moisture content reached 90% of the field capacity, rice yield was the highest [24,25]. This demonstrates that appropriate irrigation plays a key role in rice growth and development. Appropriate water-saving cultivation can effectively regulate the plant height of rice and thus enhance its resistance to lodging and reduce yield losses caused by lodging. In addition, water-saving cultivation reduces the energy consumption for stem growth. As a result, more energy can be allocated to the growth of above-ground parts, such as leaves and panicles, thereby improving yield potential.
Similar to plant height, dry matter mass and harvest index are also some of the main factors determining rice yield under drought conditions [26]. It has long been known that water is a determining factor that affects harvest index and dry matter mass, which can intuitively reflect the relationship between crop yield and the environment [27]. In our study, under appropriate water-saving treatments, the biomass and harvest index of rice were higher than those under the control group (Figure 5), which was similar to the results of previous studies [28,29]. During the early growth stage of rice, rice leaves under the W1 treatment (20% water saving) had strong photosynthesis and could generate more organic matter. This organic matter is the basis for rice growth and the main source of dry matter. Part of this energy flows into various organs through the transport system within the plant for their growth and development. Another part is stored in the form of dry matter, which includes various parts of rice such as stems, leaves, and panicles [30]. Rice under the W1 treatment had a higher harvest index (Table 4) and reduced plant height compared with CK and other treatments (Figure 4), showing that more assimilated products were allocated to grains. The harvest index was also verified by the high seed setting rate and effective panicle number. By optimizing water management measures for rice, it is possible to improve the efficiency of rice photosynthesis, increase the accumulation of dry matter in the panicle, and thus achieve high yield and good quality of rice (Table 4).
Under water-saving treatment, the leaf structure of rice changed accordingly [31]. The SPAD value of plants could indirectly reflect the impact of adversity stress and is closely related to rice growth and yield [32]. Some studies have also shown that water-saving treatments applied at critical growth stages of rice resulted in significantly higher leaf chlorophyll contents [33,34,35]. Similarly, our research showed that compared with CK, the leaf SPAD content increased under different water-saving treatments. Mild and moderate water conservation significantly improved the SPAD value of rice during the early and middle stages (Figure 6). The reason for the decline in SPAD content in rice leaves under the CK treatment might be due to the excessive accumulation of hydrogen peroxide in rice under flooded cultivation, which led to carbon–nitrogen imbalance. Eventually, the structure of chlorophyll was destroyed.
One of the opposing phenomena to the decreased SPAD content in plants under water stress was the increase in ROS content [36]. When the balance between ROS production and elimination is disrupted, oxidative stress occurs within plants, leading to membrane lipid peroxidation, protein denaturation, and inhibition of photosynthesis [37]. Malondialdehyde (MDA) is one of the main products of membrane lipid peroxidation, and its level indirectly reflects the degree of cellular membrane damage, affecting the stability of the membrane structure [38]. In our study, the rice leaves under the W3 treatment had the highest MDA content and the leaf cytoplasmic membrane permeability was the most severe. At the same time, the MDA content of rice leaves under the W1 treatment was the lowest, suggesting minimal cellular membrane damage (Figure 7). It is thus clear that under the W1 treatment condition, rice plant membrane structures were stabilized and the photosynthetic rate was enhanced by increasing the chlorophyll content and by reducing cellular membrane damage in the leaves.
Excessively accumulated ROS within plants can be eliminated by SOD (superoxide dismutase) and POD (peroxidase), which are the main antioxidant enzymes, thus mitigating the degree of oxidative damage to plant cells [39]. SOD decomposes O2 into H2O2 in plants, and POD decomposes H2O2 subsequently [40]. The results of our study are similar to previous studies, indicating that rice leaves under an appropriate water condition exhibit higher antioxidant enzyme activity, possess a stronger antioxidant capacity, and maintain a balanced state of ROS (Figure 8). However, excessive drought disrupted the balance between ROS production and elimination, causing severe damage to the membrane system in rice plants (Figure 7 and Figure 8).
The crop yield is closely related to the growth status of plants under different water treatments. Wang et al. [41] found that water-saving irrigation to a certain extent reduced rice yield compared to conventional irrigation. However, Wu et al. [42] observed that flooding stress during the jointing and booting stages caused a decrease in rice yield. Others found that compared to continuous flooding irrigation, moderate water-saving measures could stably increase the rice yield in paddy fields [43], which is consistent with the results of our study. The reasons for these different results might be the differences in rice varieties, agronomic measures, etc. It was observed that the yield under the mild water-saving treatment was significantly higher than that under the CK treatment (Table 5). The field was flooded in order to prevent weed growth before the tillering stage of rice, and the surface water accumulation is the main cause of hypoxia stress in rice roots at this time. The oxygen status in fields directly affects the growth and yield of rice, especially for aerobic rice varieties. Under the W1 treatment, the SPAD content in rice leaves increased, while the content of MDA decreased. Additionally, the activities of SOD and POD were enhanced, which was beneficial for eliminating excessively accumulated ROS within the cells, enhancing membrane antioxidant capacity, and reducing membrane damage (Figure 6, Figure 7 and Figure 8). By optimizing the water condition for better growth characteristics of rice plants, a higher yield could be achieved.
As an important food crop, the quality of rice has become a hot research topic in cultivation and breeding in recent years [44]. Previous studies have indicated that appropriate water conservation enhances rice quality [45]. Brunet et al. [46] discovered that under water deficit conditions, the chalkiness of grains would decrease. In our study, the processing quality of rice grains in each water-saving treatment was significantly improved, which was consistent with previous findings [47]. However, in terms of appearance quality, the chalkiness of rice grains in all water-saving treatments slightly increased (Table 6). This could be due to the fact that the water-saving treatments affected the transpiration of rice plants, resulting in an increase in temperature within the rice canopy, which had an adverse impact on the normal grain filling process [48,49]. Protein content not only affects the nutritional quality of rice but is also closely related to the taste quality [50,51]. Starch is the most important carbohydrate in rice grains, and its synthesis directly depends on photosynthesis [52]. In our study, the starch content of grains significantly increased under the W1 treatment, while the protein content decreased (Table 6). Under the W1 treatment, it could be attributed to the SPAD content of rice leaves being increased significantly, and the activities of SOD and POD enzymes of rice plants rose. Consequently, the photosynthetic rate of the leaves increased, leading to the accumulation of photosynthetic products and a rise in the starch content of grains. Previous studies found that there was a complementary effect between starch and protein [53], which is consistent with our results. Therefore, an appropriate water-saving scheme can help improve rice quality and enhance its taste and texture.
The field test with irrigated plants was conducted for one year and the results obtained were preliminary. The field tests will continue and be repeated in subsequent growing seasons for modifying the water-saving irrigation scheme of rice cultivation in this region. Real-time data on the growth and development of the rice plants were obtained through field experiments under different water treatments this year. The water-saving irrigation amount and the reasons for the high quality and high yield of rice under optimized irrigation were analyzed. It provided a theoretical basis for exploring the impact of different water-saving irrigation treatments on the growth, development, yield, and quality of rice during the whole growth period. The preliminary irrigation scheme for water saving and high yield in southern and central Jiangsu was obtained. However, at the same time, there were weaknesses in these one-year results. The results had more uncertainties because there were many environmental interference factors in the field experiments, especially for one-year results. High random errors and low accuracy possibly exist for one-year experiments, although we adopted the principle of replication, random assortment, etc. Nevertheless, a more appropriate experimental design should be conducted in the future. At present, it was insufficient for the implementation of the water-saving irrigation technology.
The experimental design should have been improved by comprehensively considering multi-year field experience data. We will conduct a detailed experimental design based on the results of this year, specifically determining the preferred irrigation volume and time for each growth stage according to the soil moisture content, crop status, and climatic conditions. For example, the five-point sampling method will be adopted for field data collection, and data from 2-3 years will be combined for comparative analysis. The results of multi-year tests will provide a scientific theoretical basis for high-quality and high-yield rice cultivation, as well as water-saving irrigation technology for agronomy application.

5. Conclusions

In order to explore the effects of different water-saving treatments on rice plant growth and select suitable water-saving irrigation schemes for aerobic rice varieties, field tests were conducted in 2023. The results showed that compared to conventional irrigation (CK), under the W1 treatment, the rice plant height was reduced and the chlorophyll content in rice leaves was increased, promoting the accumulation of dry matter in the above-ground parts and enhancing the harvest index. Simultaneously, corresponding changes occurred under the W1 treatment, including the enhancement of antioxidant enzyme activity, which improved membrane stability and metabolic vitality. This ultimately led to an increase in the effective panicle number and seed setting rate of rice, resulting in higher yields. Notably, grain yield under the W1 treatment increased by 31.4% compared to CK, resulting in the highest economic profit. It followed that mild water stress (W1) did have a significant impact on improving the quality of the rice. Finally, the TOPSIS entropy weight method was used to comprehensively evaluate rice plant height, chlorophyll content, grain yield, yield components, and rice quality. The results of the TOPSIS evaluation showed that the most suitable irrigation scheme for Zhenjiang and its neighboring regions was W1 (80% of the irrigation amount of CK). In summary, the W1 irrigation scheme not only saved agricultural water but also played an important role in promoting rice growth, increasing rice yield, and improving rice quality. At the same time, further research is needed that supports the implementation of the proposed water-saving irrigation practices.

Author Contributions

Data curation, J.M.; formal analysis, M.T. and M.L.; funding acquisition, W.S.; investigation, M.T. and M.L.; methodology, C.G.; project administration, W.S.; software, M.L.; supervision, M.T.; writing—original draft, J.M. and C.G.; writing—review and editing, L.H. and W.S. All authors have read and agreed to the published version of the manuscript.

Funding

This research was funded by the National Science and Technology Major Project (2022ZD0115801) and the Independent Innovation of Agricultural Science and Technology in Jiangsu Province (CX(22)3114).

Data Availability Statement

Data are contained within the article.

Conflicts of Interest

The authors declare no conflicts of interest.

References

  1. Liu, Q.H.; Wu, X.; Chen, B.C.; Xin, C.Y.; Chen, F.; Wang, Y.; Sun, Z.W.; Ma, J.Q. Effects of different irrigation methods on grain quality of japonica rice in Huanghuai District of China. Chin. J. Appl. Ecol. 2014, 25, 2583–2590. [Google Scholar] [CrossRef]
  2. Ladha, J.K.; Radanielson, A.M.; Rutkoski, J.E.; Buresh, R.J.; Dobermann, A.; Angeles, O.; Pabuayon, I.L.B.; Santos-Medellín, C.; Fritsche-Neto, R.; Chivenge, P.; et al. Steady agronomic and genetic interventions are essential for sustaining productivity in intensive rice cropping. Proc. Natl. Acad. Sci. USA 2021, 118, e2110807118. [Google Scholar] [CrossRef] [PubMed]
  3. Wu, Y.; Bian, S.F.; Liu, Z.M.; Wang, L.C.; Wang, Y.J.; Xu, W.H.; Zhou, Y. Drip irrigation incorporating water conservation measures: Effects on soil water–nitrogen utilization, root traits and grain production of spring maize in semi-arid areas. J. Integr. Agric. 2021, 20, 3127–3142. [Google Scholar] [CrossRef]
  4. Muscolo, A.; Junker, A.; Klukas, C.; Weigelt-Fischer, K.; Riewe, D.; Altmann, T. Phenotypic and metabolic responses to drought and salinity of four contrasting lentil accessions. J. Exp. Bot. 2015, 66, 5467–5480. [Google Scholar] [CrossRef]
  5. Lan, K.; Chen, X.; Ridoutt, B.G.; Huang, J.; Scherer, L. Closing yield and harvest area gaps to mitigate water scarcity related to China’s rice production. Agric. Water Manag. 2021, 245, 106602. [Google Scholar] [CrossRef]
  6. Griglione, A.; Liberto, E.; Cordero, C.; Bressanello, D.; Cagliero, C. High-quality Italian rice cultivars: Chemical indices of ageing and aroma quality. Food Chem. 2015, 172, 305–313. [Google Scholar] [CrossRef] [PubMed]
  7. Tong, H.; Duan, H.; Wang, S.J.; Su, J.-p.; Sun, Y.; Liu, Y.-q.; Tang, L.; Liu, X.-j.; Chen, W.-f. Moderate drought alleviates the damage to grain quality at high temperatures by improving the starch synthesis of inferior grains in japonica rice. J. Integr. Agric. 2022, 21, 3094–3101. [Google Scholar] [CrossRef]
  8. Wang, W.; Liu, X.; Tian, Y.; Yao, X.; Cao, W.; Zhu, Y. Effects of different soil water treatments on photosynthetic characteristics and grain yield in rice. Acta Ecol. Sin. 2012, 32, 7053–7060. [Google Scholar] [CrossRef]
  9. Shao, G.C.; Deng, S.; Liu, N.; Yu, S.-E.; Wang, M.-H.; She, D.-L. Effects of controlled irrigation and drainage on growth, grain yield and water use in paddy rice. Eur. J. Agron. 2014, 53, 1–9. [Google Scholar] [CrossRef]
  10. Zhang, C.; Li, S. Effects of Water Stress on Rice Growth and Grain Quality During Flowering. China Rice 2017, 23, 43–45. [Google Scholar] [CrossRef]
  11. Dong, M.H.; Xie, Y.L.; Liu, X.B.; Wu, X.Z.; Zhao, B.H.; Yang, J.C. Effect of soil water potential on grain quality at different spike positions during grain filling in rice. Chin. J. Eco-Agric. 2011, 19, 305–311. [Google Scholar] [CrossRef]
  12. Zheng, E.; Zhu, Y.; Hu, J.; Zhang, Z.; Xu, T. Effects of humic acid on japonica rice production under different irrigation practices and a TOPSIS-based assessment on the Songnen Plain, China. Irrig. Sci. 2021, 40, 87–101. [Google Scholar] [CrossRef]
  13. GB/T. High Quality Paddy Rice. National Standards of the People’s Republic of China 2017. National Public Service Platform for Standards Information Home Page. Available online: https://std.samr.gov.cn/gb/gbQuery (accessed on 24 May 2024).
  14. Zhang, S.Y.; Zhang, S.; Zhang, Q. Plant Physiology Experimental Techniques Tutorial; Science Press: Beijing, China, 2011. [Google Scholar]
  15. Luo, X.; Wu, Z.; Fu, L.; Dan, Z.; Long, W.; Yuan, Z.; Liang, T.; Zhu, R.; Hu, Z.; Wu, X. Responses of the Lodging Resistance of Indica Rice Cultivars to Temperature and Solar Radiation under Field Conditions. Agronomy 2022, 12, 2603. [Google Scholar] [CrossRef]
  16. He, J.Y.; Liu, F.Y.; Yang, J.H.; Cui, X.W. Effects of water and salt stress on yield components and quality of rice in arid area. Water Sav. Irrig. 2024, 33–43. [Google Scholar] [CrossRef]
  17. Xu, Q.; Lv, T.B.; Ma, X.P.; Wang, D.W.; Bai, M.; Wang, Z.L.; Niu, J.R. Effects of water regulation and cultivation on rice growth and irrigation water use efficiency under drip irrigation. Southwest China J. Agric. Sci. 2020, 33, 46–52. [Google Scholar] [CrossRef]
  18. Ding, F.; Pu, S.; Lv, Y.; Ma, X.; Shen, X.; Mo, Y. Effects of different irrigation quotas on water consumption characteristics and water production efficiency of rice under film drip irrigation. Xinjiang Agric. Sci. 2021, 58, 1577–1584. [Google Scholar]
  19. Gu, X.; Liu, K.; Gao, J.; Liu, L.J. Research advances of water-saving irrigation methods and their influences on rice yield. Hybrid. Rice 2022, 37, 7–13. [Google Scholar]
  20. He, J.; Ma, B.; Tian, J. Water production function and optimal irrigation schedule for rice (Oryza sativa L.) cultivation with drip irrigation under plastic film-mulched. Sci. Rep. 2022, 12, 17243. [Google Scholar] [CrossRef]
  21. Tian, J.; Li, S.; Xing, Z.; Cheng, S.; Guo, B.; Hu, Y.; Wei, H.; Gao, H.; Liao, P.; Wei, H.; et al. Differences in rice yield and biomass accumulation dynamics for different direct seeding methods after wheat straw return. Food Energy Secur. 2022, 11, e425. [Google Scholar] [CrossRef]
  22. Stella, T.; Bregaglio, S.; Confalonieri, R. A model to simulate the dynamics of carbohydrate remobilization during rice grain filling. Ecol. Model. 2016, 320, 366–371. [Google Scholar] [CrossRef]
  23. Dwivedi, S.K.; Kumar, S.; Natividad, M.A.; Quintana, M.R.; Chinnusamy, V.; Henry, A. Disentangling the Roles of Plant Water Status and Stem Carbohydrate Remobilization on Rice Harvest Index Under Drought. Rice 2023, 16, 14. [Google Scholar] [CrossRef] [PubMed]
  24. Sharma, S.; Singh, P.; Choudhary, O.P.; Neemisha. Nitrogen and rice straw incorporation impact nitrogen use efficiency, soil nitrogen pools and enzyme activity in rice-wheat system in north-western India. Field Crops Res. 2021, 266, 108131. [Google Scholar] [CrossRef]
  25. Saito, H.; Fukuta, Y.; Obara, M.; Tomita, A.; Ishimaru, T.; Sasaki, K.; Fujita, D.; Kobayashi, N. Two Novel QTLs for the Harvest Index that Contribute to High-Yield Production in Rice (Oryza sativa L.). Rice 2021, 14, 18. [Google Scholar] [CrossRef]
  26. Yi, Z.; Zhu, D.; Wang, Y.; Hu, G.; Zhang, Y.; Xiang, J.; Zhang, Y.; Chen, H. Advances of rice growth response to drought and its compensatory effects. China Rice 2020, 26, 1–6. [Google Scholar] [CrossRef]
  27. Wu, Z.; Yuan, B. Effect of water and fertilizer coupling on growth, yield and nitrogen use efficiency of rice. J. Water Resour. Water Eng. 2020, 31, 199–207+215. [Google Scholar]
  28. Guo, H.; Ma, J.; Li, S.X.; Li, M.; Zhu, P.; Chen, Y. Effects of water stress on partial physiological characteristics and yield compensation in rice at booting stage. J. South. Agric. 2013, 44, 1448–1454. [Google Scholar] [CrossRef]
  29. Yin, C.; Wang, S.; Liu, H.; Sun, J.; Hu, X.; Wang, H.; Tian, F.; Ma, C.; Zhang, X.; Zhang, R.; et al. Effects on Leaf Physiological Characteristics, Yield and Quality of Dry Seeding Rice: Water-saving Irrigation and Conventional Irrigation. Chin. Agric. Sci. Bull. 2020, 36, 1–9. [Google Scholar]
  30. Yang, X.; Wang, B.; Wang, B.; Zhang, Z. Effects of different water management on yield and rice quality of dry-seeded rice. Chin. J. Rice Sci. 2023, 37, 285–294. [Google Scholar] [CrossRef]
  31. Wang, L.; Zhang, X.; She, Y.; Hu, C.; Wang, Q.; Wu, L.; You, C.; Ke, J.; He, H. Physiological Adaptation Mechanisms to Drought and Rewatering in Water-Saving and Drought-Resistant Rice. Int. J. Mol. Sci. 2022, 23, 14043. [Google Scholar] [CrossRef]
  32. Xiao, M.; Li, Z.; Zhu, L.; Wang, J.; Zhang, B.; Zheng, F.; Zhao, B.; Zhang, H.; Wang, Y.; Zhang, Z. The multiple roles of ascorbate in the abiotic stress response of plants: Antioxidant, cofactor, and regulator. Front. Plant Sci. 2021, 12, 598173. [Google Scholar] [CrossRef]
  33. Sreekanth, D.; Pawar, D.V.; Kumar, R.; Ratnakumar, P.; Sondhia, S.; Singh, P.K.; Mishra, J.S.; Chander, S.; Mukkamula, N.; Kiran Kumar, B. Biochemical and physiological responses of rice as influenced by Alternanthera paronychioides and Echinochloa colona under drought stress. Plant Growth Regul. 2023, 103, 119–137. [Google Scholar] [CrossRef]
  34. Poudel, M.; Mendes, R.; Costa, L.A.S.; Bueno, C.G.; Meng, Y.; Folimonova, S.Y.; Garrett, K.A.; Martins, S.J. The Role of Plant-Associated Bacteria, Fungi, and Viruses in Drought Stress Mitigation. Front. Microbiol. 2021, 12, 743512. [Google Scholar] [CrossRef] [PubMed]
  35. Lukić, N.; Kukavica, B.; Davidović-Plavšić, B.; Hasanagić, D. Plant stress memory is linked to high levels of anti-oxidative enzymes over several weeks. Environ. Exp. Bot. 2020, 178, 104166. [Google Scholar] [CrossRef]
  36. Wang, Z.; Shao, G.; Lu, J.; Zhang, K.; Gao, Y.; Ding, J. Effects of controlled drainage on crop yield, drainage water quantity and quality: A meta-analysis. Agric. Water Manag. 2020, 239, 106253. [Google Scholar] [CrossRef]
  37. Wu, F.; Wang, H.; Zhu, R.; Zhai, L.; Hu, T. Post-effects of waterlogging on the rice growth at the jointing-booting stage. Trans. Chin. Soc. Agric. Eng. 2021, 37, 85–93. [Google Scholar] [CrossRef]
  38. Dossou-Yovo, E.R.; Kouadio, S.A.K.; Saito, K. Effects of mid-season drainage on iron toxicity, rice yield, and water productivity in irrigated systems in the derived savannah agroecological zone of West Africa. Field Crops Res. 2023, 296, 108901. [Google Scholar] [CrossRef]
  39. Sultana, S.; Faruque, M.; Islam, M.R. Rice grain quality parameters and determination tools: A review on the current developments and future prospects. Int. J. Food Prop. 2022, 25, 1063–1078. [Google Scholar] [CrossRef]
  40. Wei, X.; Liang, J.; Zhang, J.; Tong, T.; Huang, S.; Mo, Z.; Tian, H.; Pan, S.; Duan, M.; Tang, X. Effects of different irrigation methods on yield, quality and water use efficiency of fragrant rice. Acta Agriculurae Boreali-Sin. 2020, 35, 129–136. [Google Scholar]
  41. Brunet-Loredo, A.; López-Belchí, M.D.; Cordero-Lara, K.; Noriega, F.; Cabeza, R.A. Assessing Grain Quality Changes in White and Black Rice under Water Deficit. Plants 2023, 12, 4091. [Google Scholar] [CrossRef]
  42. Yang, C.; Wang, Y.; Zhang, W.; Ye, T.; Lu, J.; Zhang, G.; Li, X. Effects of interaction between irrigation mode and nitrogen application rate on the yield formation of main stem and tillers of rice. Chin. J. Rice Sci. 2021, 35, 155–165. [Google Scholar] [CrossRef]
  43. Lanning, S.B.; Siebenmorgen, T.J.; Ambardekar, A.A.; Counce, P.A.; Bryant, R.J. Effects of nighttime air temperature during kernel development. Cereal Chem. 2012, 89, 168–175. [Google Scholar] [CrossRef]
  44. Convertino, M.; Zhao, X.; Fitzgerald, M. Climate Change: Implications for the yield of edible rice. PLoS ONE 2013, 8, e66218. [Google Scholar] [CrossRef]
  45. Li, L.; Shi, S.; Cheng, B.; Zhao, D.; Pan, K.; Cao, C.; Jiang, Y. Association between rice protein components and eating quality traits of different rice varieties under different nitrogen levels. J. Cereal Sci. 2023, 113, 103760. [Google Scholar] [CrossRef]
  46. Xu, Y.; Gu, D.; Li, K.; Zhang, W.; Zhang, H.; Wang, Z.; Yang, J. Response of grain quality to alternate wetting and moderate soil drying irrigation in rice. Crop Sci. 2019, 59, 1261–1272. [Google Scholar] [CrossRef]
  47. Zhang, H.; Xu, H.; Jiang, Y.; Zhang, H.; Wang, S.; Wang, F.; Zhu, Y. Genetic control and high temperature effects on starch giosynthesis and grain quality in rice. Front. Plant Sci. 2021, 12, 757997. [Google Scholar] [CrossRef]
  48. Hou, P.; Xue, L.; Zhou, Y.; Li, G.; Yang, L.; Xue, L. Yield and N utilization of transplanted and direct-seeded rice with controlled or slow-release fertilizer. Agron. J. 2019, 111, 1208–1217. [Google Scholar] [CrossRef]
  49. NY/T. High Soil Testing. Agric. Ind. Stand. People’s Repub. China 2010. National Public Service Platform for Standards Information Home Page. Available online: https://std.samr.gov.cn/gb/gbQuery (accessed on 25 May 2024).
  50. Chen, Y.S.; Hou, M.T.; Ma, D.; Han, X.H.; Zhang, R.Y.; Zhang, X.Z. Determination of Total Phosphorus in Soil by Alkali Fusion-Mo-Sb Anti Spectrophotometric Method. China Stand. 2018, S1, 193–196. [Google Scholar]
  51. Bao, S.D. Soil Agrochemical Analysis, 3rd ed.; China Agricultural Press: Beijing, China, 2000. [Google Scholar]
  52. Wang, H.; Wang, X.; Bi, L.; Wang, Y.; Fan, J.; Zhang, F.; Hou, X.; Cheng, M.; Hu, W.; Wu, L.; et al. Multi-objective optimization of water and fertilizer management for potato production in sandy areas of northern China based on TOPSIS. Field Crops Res. 2019, 240, 55–68. [Google Scholar] [CrossRef]
  53. Ning, D.; Yan, C.; Zhao, Y.; Yang, X.; Yang, L.; Li, N.; Wang, Z. Study on agronomic, economic and qualitative characters of different peanuts varieties with TOPSIS method evaluation. J. Shanxi Agric. Sci. 2018, 46, 1986–1989. [Google Scholar] [CrossRef]
Figure 1. Climate characteristics during the rice growth period. (a) Temperature variations after transplantation of rice seedlings; (b) monthly average rainfall during the rice growth period.
Agronomy 14 01363 g001
Figure 2. Schematic diagram of the experimental plot layout in the field.
Agronomy 14 01363 g002
Figure 3. The calculation process of the TOPSIS entropy weight method.
Agronomy 14 01363 g003
Figure 4. Dynamic changes in plant height under different water treatments (different letters in the figure indicate significant differences between treatments at p < 0.05).
Agronomy 14 01363 g004
Figure 5. Changes in rice biomass under different water treatments.
Agronomy 14 01363 g005
Figure 6. Changes in SPAD under different water treatments (different letters above the bars indicate significant differences between treatments at p < 0.05).
Agronomy 14 01363 g006
Figure 7. Changes in MDA under different water treatments (different letters above the bars indicate significant differences between treatments at p < 0.05).
Agronomy 14 01363 g007
Figure 8. Changes in antioxidant enzyme activities under different water treatments. (a) The change in SOD content under different water treatments; (b) the change in POD content under different water treatments (different letters above the bars indicate significant differences between treatments at p < 0.05).
Agronomy 14 01363 g008
Figure 9. The technical route of water-saving irrigation.
Agronomy 14 01363 g009
Table 1. Soil parameters of the test site.
Soil Layer
(cm)
pHTotal N
(g kg−1)
Total
P
(g kg−1)
Total K
(g kg−1)
Organic
Matter
(g kg−1)
EC
(dS m−1)
Bulk
Density
(g cm−3)
Soil Water Content at
Field
Capacity (%)
Soil
Porosity
(%)
Soil Water Content at Saturation
(%)
0–208.4031.084772.21016.6319.8420.2421.62518.60838.66823.791
20–408.4911.195735.86517.1547.7630.2431.61120.58339.22624.356
40–608.4431.236788.07417.4578.4760.2781.56821.88340.84526.056
Table 2. The period of rice growth and development stages.
Transplanting DayRecovery Growth StageTillering StageJointing and Booting StageHeading and Flowering
Stage
Milk Ripening StageYellowing and Maturity
Stage
28 June 202329 June 2023 to 4 July 20235 July 2023 to 4 August
2023
5 August 2023 to 30 August 202331 August 2023 to 25 September 202326 September 2023 to 9
October 2023
10 October 2023 to 28 October 2023
Note: The rice seedlings were transplanted into the experimental field on 28 June 2023, and they recovered from transplanting for a week. The subsequent rice growth was divided into five stages, namely the tillering stage, jointing and booting stage, etc.
Table 3. Irrigation scheme during whole growth period of rice under different treatments.
Amount of Irrigation Water Applied (mm) According to the Crop Periods
TreatmentsTillering StageJointing and Booting StageHeading and Flowering StageFilling StageMaturity StageTotal
Irrigation
CKUpper Limit50.040.040.030.0Dry naturally1048.90
Lower Limit20.020.010.010.0
W1Upper Limit20.020.020.020.0Dry naturally839.17
Lower Limit12.612.612.610.4
W2Upper Limit14.814.814.814.8Dry naturally734.29
Lower Limit12.612.612.610.4
W3Upper Limit14.814.814.814.8Dry naturally629.36
Lower Limit8.98.98.98.2
Table 4. Changes in harvest index under different water treatments.
TreatmentEconomic Yield (g m−2)Biological Yield (g m−2)Harvest Index (%)
W1941.505 a1486.853 a0.641 a
W2792.570 ab1269.825 b0.624 ab
W3796.455 ab1316.519 b0.603 ab
CK716.505 b1213.093 b0.591 b
Note: The different letters in the table indicate significant differences between treatments at p < 0.05.
Table 5. Variance analysis of rice yield and constituent factors under different water treatments.
TreatmentGrain Number per PanicleSeed Setting Rate (%)1000-Grain Weight (g)Effective Panicle Number (10−4 hm−2)Theoretical
Yield (kg hm−2)
W1180.79 ± 8.72 a71.79 ± 1.05 a22.98 ± 0.43 a313.43 ± 10.90 a9415.05 ± 993.75 a
W2186.64 ± 3.66 a69.68 ± 0.52 a21.75 ± 0.11 b279.94 ± 6.89 bc7925.7 ± 237.15 ab
W3178.84 ± 13.08 a67.48 ± 3.06 ab22.17 ± 0.23 ab298.99 ± 2.77 a7964.55 ± 713.85 ab
CK179.17 ± 1.55 a63.63 ± 1.31 bc23.32 ± 0.30 a269.90 ± 13.12 bc7165.05 ± 567.9 b
Note: The different letters in the table indicate significant differences between treatments at p < 0.05.
Table 6. Variance analysis of rice quality under different water treatments.
TreatmentBrown Rice Rate (%)Milled Rice Rate (%)Head Rice Rate (%)Chalky Degree (%)Starch (mg g−1)Crude Protein
(g kg−1)
W180.56 ± 0.17 a68.90 ± 0.10 a66.29 ± 0.41 a18.79 ± 1.33 a543.76 ± 11.30 a65.30 ± 1.23 b
W280.66 ± 0.84 a68.85 ± 0.89 a64.69 ± 1.37 a19.51 ± 0.68 a503.57 ± 25.92 ab67.50 ± 1.23 ab
W379.32 ± 2.02 a67.84 ± 2.04 a64.53 ± 1.94 a19.86 ± 2.83 a450.43 ± 13.95 b67.00 ± 0.64 ab
CK78.92 ± 1.15 a67.03 ± 0.79 a63.83 ± 0.52 a17.49 ± 0.18 a457.65 ± 27.67 b71.22 ± 0.33 a
Note: The different letters in the table indicate significant differences between treatments at p < 0.05.
Table 7. Evaluation indicators and their corresponding values of TOPSIS entropy weight calculation.
Entropy Weight Method
ClassificationItemType of IndicatorEntropyInformation Utility ValueWeight (%)Positive Ideal SolutionNegative Ideal Solution
Morphological characteristicsPlant height (cm)Positive indicators0.7060.2947.430.999987340.00001266
SPADPositive indicators0.7250.2756.9510.9999780.000022
YieldGrain number per paniclePositive indicators0.4540.54613.820.999987180.00001282
Seed setting rate (%)Positive indicators0.7640.2365.9710.998777510.00122249
1000-grain weight (g)Positive indicators0.7110.2897.3090.999936450.00006355
Effective panicle number
(10−4 hm−2)
Positive indicators0.7470.2536.3920.999998120.00000188
Theoretical yield
(kg hm−2)
Positive indicators0.6930.3077.7720.999999964.00 × 10−8
Rice qualityBrown rice rate (%)Positive indicators0.6890.3117.8560.999942430.00005757
Milled rice rate (%)Positive indicators0.750.256.3280.999946690.00005331
Head rice rate (%)Positive indicators0.6750.3258.210.999959280.00004072
Chalky degree (%)Positive indicators0.7720.2285.770.999957870.00004213
Starch
(mg g−1)
Reverse indicators0.5870.41310.4460.999998930.00000107
Crude protein
(g kg−1)
Positive indicators0.7730.2275.7440.999983130.00001687
Table 8. Comprehensive score index and economic impact assessment according to TOPSIS entropy weight method.
TreatmentsPositive Ideal DistanceNegative Ideal DistanceComprehensive Score IndexSales Revenue
(RMB hm−2)
Ranking
W10.470363450.76406740.6189633127,680.2471
W20.570642460.658612950.5357820223,301.5582
W30.663305660.533278020.4456671323,415.7773
CK0.869272660.466641420.3493049721,065.2474
Disclaimer/Publisher’s Note: The statements, opinions and data contained in all publications are solely those of the individual author(s) and contributor(s) and not of MDPI and/or the editor(s). MDPI and/or the editor(s) disclaim responsibility for any injury to people or property resulting from any ideas, methods, instructions or products referred to in the content.

